
Abstract
Introduction
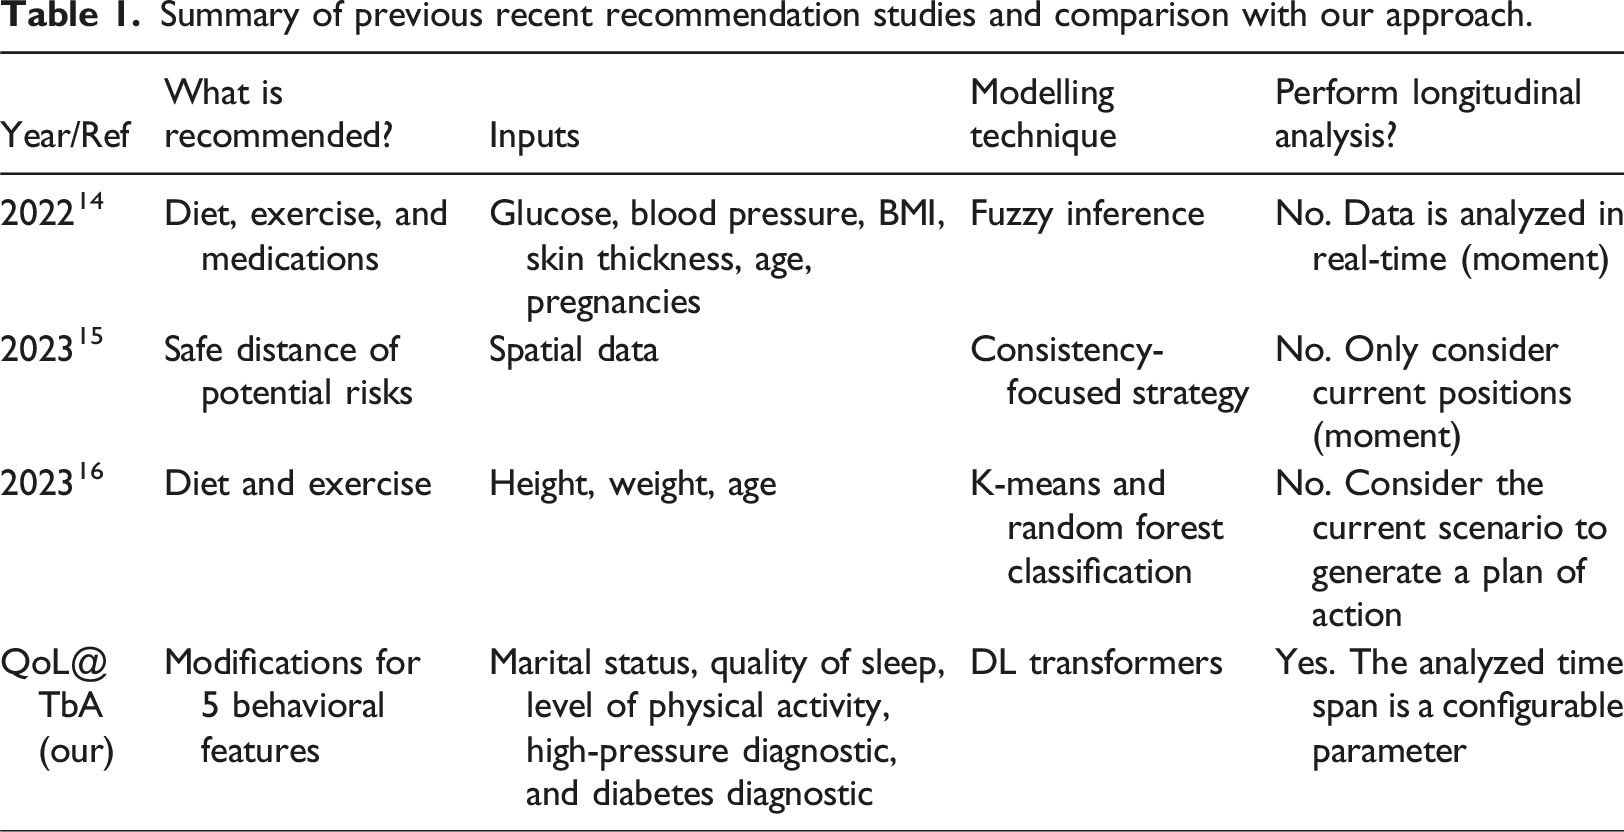
According to the World Health Organization (WHO), quality of life (QoL) is “the individuals’ perception of their position in life in the context of the culture and value systems in which they live and in relation to their goals, expectations, standards and concerns. 1 ”. The QoL assessment is important because a direct association exists between QoL and the health of individuals. 2 Moreover, according to Manea and Wac, 3 (un)healthy lifestyle over long periods significantly affects QoL. Thus, the evolution of behavioral patterns in multiple dimensions presents intrinsic information that leverages the QoL interpretation. Indeed, as several health issues are derived from multifeature and evolving daily behavior, the specification of health care support systems must consider such behavior to properly anticipate health issues, 4 and possibly recommend behavioral modifications to avoid or attenuate such issues.
The current state of the art for capturing the long-term dependencies among events is the transformer architecture. 5 Given its success in handling natural language processing problems, several works were encouraged to adapt such an architecture to other areas 6 including health care.7,8 However, the most recent health recommendation systems reviews9,10 show that the main employed approaches are still based on text mining, KNN, clustering, matrix factorization, and neural network techniques. Moreover, such approaches do not consider longitudinal data.
Summary of previous recent recommendation studies and comparison with our approach.
Methods
Theoretical framework
Behavior Sequence Transformers (BSTs) are neural network models used to capture the dependency among items in individuals’ behavior sequences.
12
They are currently used in domains such as products or movies recommendation systems. We can specify a BST domain using the tuple <I,P>, where I = (i1, i2,.., in) is a set of n individuals, while P = (p1, p2,.., pm) is a set of m products. At different temporal moments t, each individual ij can buy and evaluate (e.g., attributing a score α) a product pk. This means, ij: (pk,α)t. Thus, the following descriptions are possible, considering the α range from 1 to 5: • Leo: (shoes, 3)1, (cellphone, 4) 2, (earphone, 4)3, (glass, 5)4. • Eva: (shoes, 3)1, (cellphone, 3)2, (earphone, 4)3, (SiliconeCover, 4)4. • Marie: (shoes, 3)1, (cellphone, 3)2, (earphone, 4)3, (ps,
The idea behind BST, in this context, is to predict the evaluation of Marie for different products ps, so a BST-based recommender can offer the products with higher evaluations to her. Therefore, the shopping behavior sequence of all individuals is analyzed to suggest candidate products to Marie. BST optionally includes the use of individuals’ profiles. For example, the system could reduce the glass score since Leo is a male while Marie is a female, or they have very different ages. As this information is not temporal, it brings implications for the architecture specification.
While BSTs were created for and are generally used in recommendation systems, this same transformer can be adapted to analyze the impact of behavior changes on health attributes. The tuple <X,A> represents this scenario, where X = (x1, x2,.., xn) is a set of n individuals, while A = (a1, a2,.., am) is a set of m behavioral assessments. At different moments t, each individual xj has a physical, psychological, or social attribute value β derived from an assessment ak. For example, depression status can be derived from other quality of life attributes, which characterize the behavior of individuals. 28 Like the previous example, this scenario can be summarized as xj: (ak,β)t. When a physical, psychological, or social attribute value β is derived from ak at the moment t, this derivation must use the sequence (ak,β)t-1, (ak,β)t-2 … (ak,β)t-z, rather than only ak. This strategy considers the importance of the sequence of behaviors to predict health outcomes, as in the previous example that considers the shopping sequence to score future options for shopping.
Conceptualization
The following schema (Figure 1) summarizes the method used in this work. The BST training stage generates a model using longitudinal data from several individuals. The prediction variable is defined as any physiological or psychological feature. For example, sleep quality or level of stress. Assessments are multifeature data rather than unique features. Thus, a1 = [a11, a12, a13,..] represents common subset of quality of life features such as level of physical activity (a11), sleep quality (a12), indicators of health problems (a13), and marital status (a14), as defined in WHOQOL.
1
After being compiled, the trained model returns values to the prediction variable based on an individual’s profile and his/her sequence of behaviors. In this case, the last behavioral sequence (St) assessment is one or more generated behavior patterns. This means the model will evaluate these patterns, returning their prediction values. As discussed in the following sections, we needed to adapt the BST architecture for dealing with static and behavioral data given the multifeature aspect of the assessments, which are also changing and unfolding over time.
24
QoL@TbA: BST application schema for QoL analysis.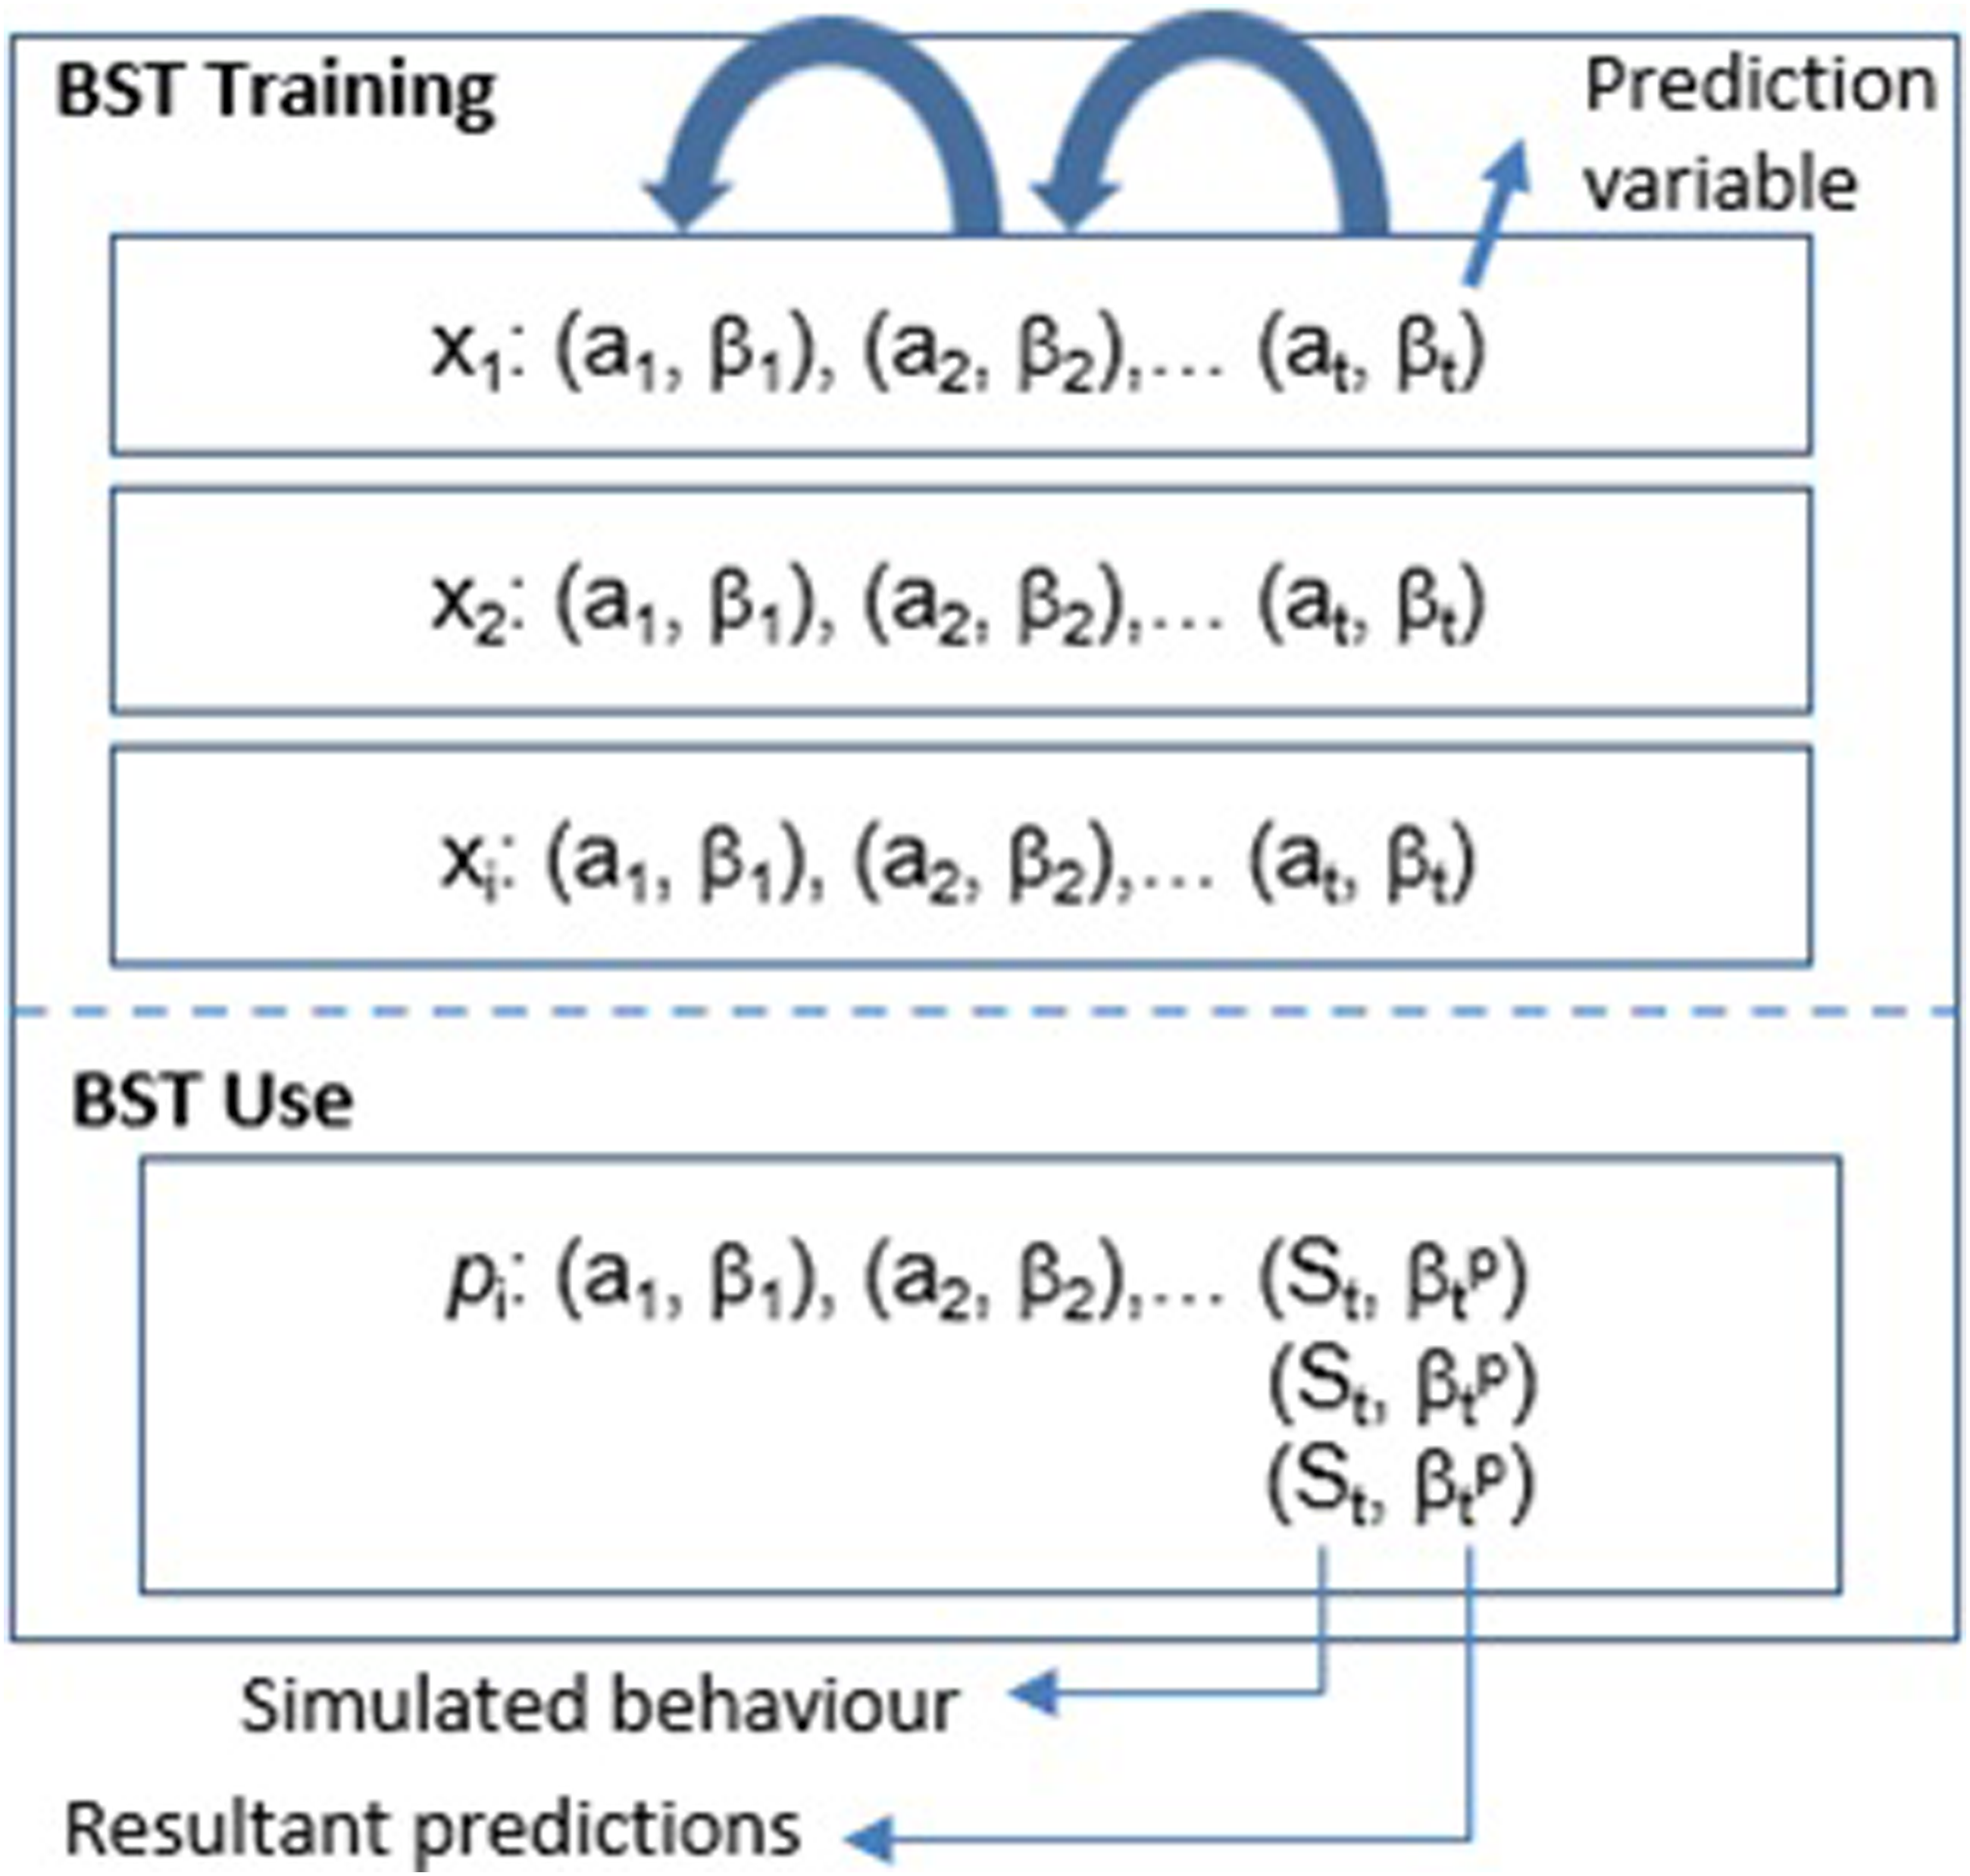
Architecture
The following schema (Figure 2) illustrates the high-level perspective of the QoL@TbA architecture proposed in this paper, which is an adaptation of the BST.
12
QoL@TbA architecture (adapted from Chen et al. proposal
12
).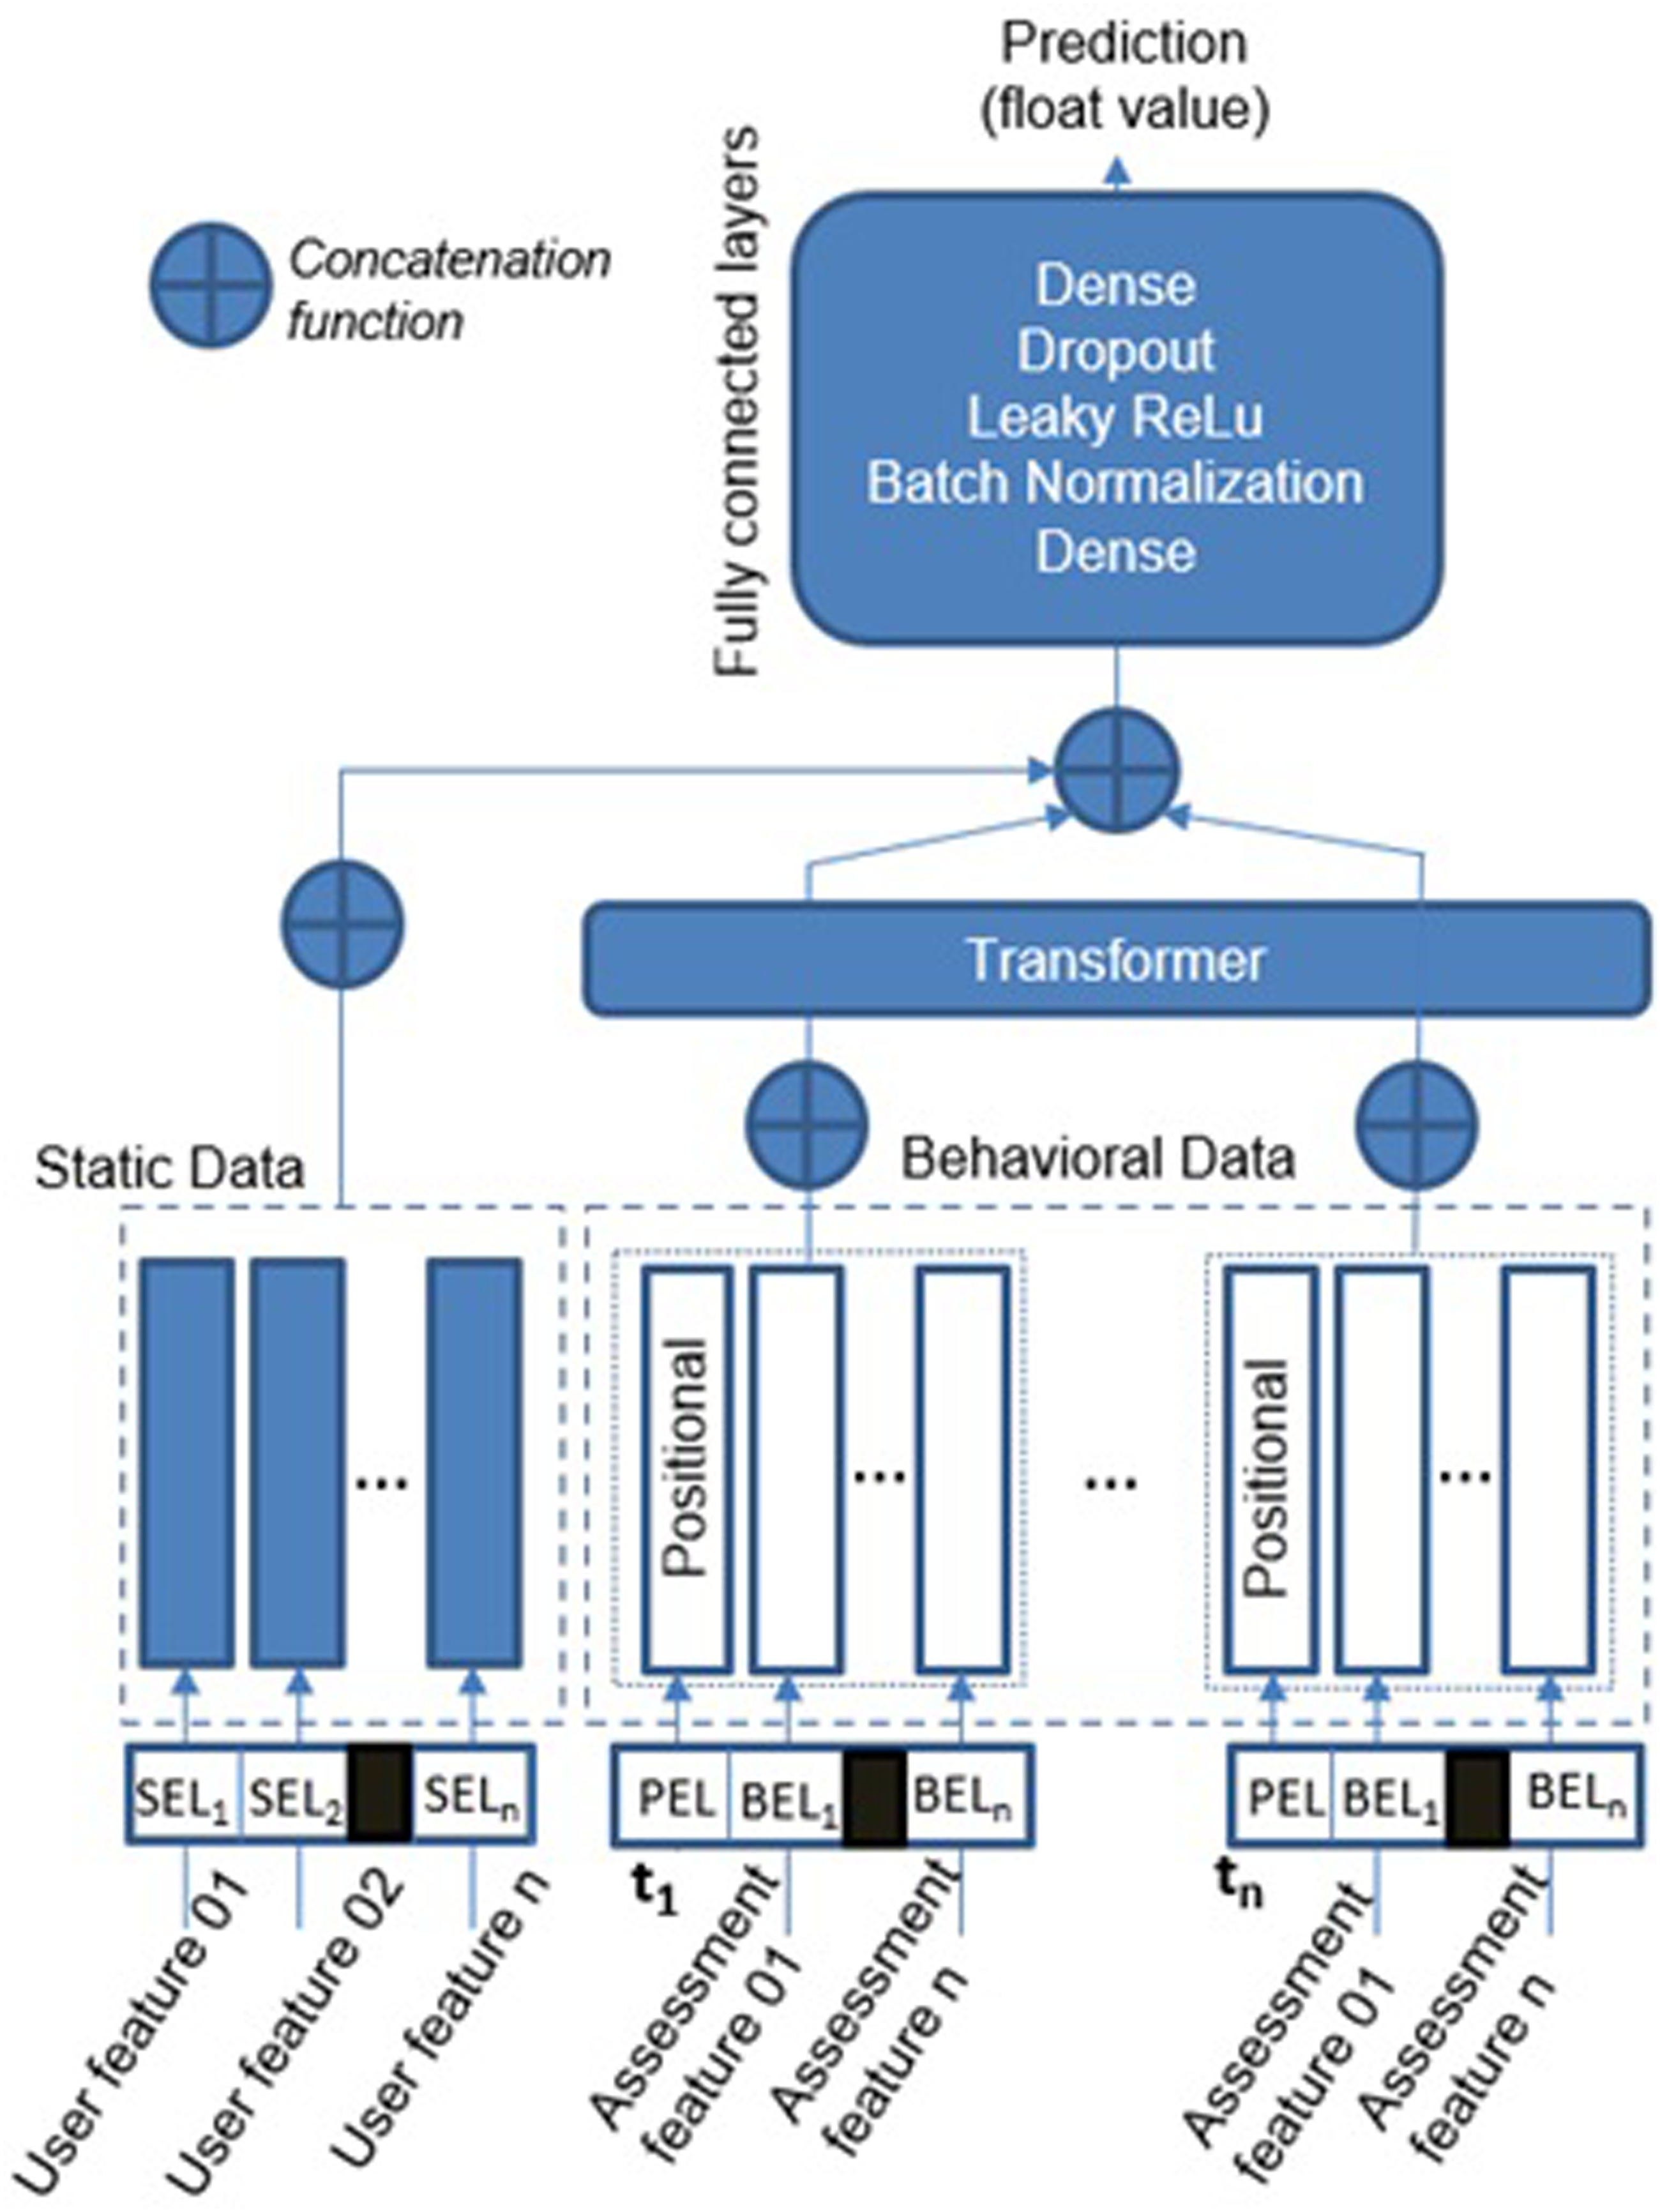
Static embedding layer (SEL)
Static data are represented by categorical features that do not evolve over time (e.g., biological sex). The module that processes such data has an embedding layer for each feature, and these layers encode categorical features to a dense vector of fixed size. However, as embedding layers only accept integer values as input, categorical values (strings) are first mapped into integer indexes. Moreover, each of the embedding layers is configured with an embedding dimension equal to the square root of the vocabulary size of the feature. For example, if the age group feature has four words in its vocabulary (child, young, adult, and elderly), the embedding dimension is 2. This is one of the machine learning design patterns commonly used in the area. 17 Finally, the outputs of all static features are concatenated to form a single input tensor for the next module.
Our embedding layer for static data is simpler than the original layer of the BST version. For example, we do not combine different features to create new features. According to the BST authors, 12 such a combination has been demonstrated useful in their scenarios. However, we allow the model to automatically learn this cross-feature information if it is important since this is already an intrinsic feature of transformers architectures.
Behavioral embedding layer (BEL)
Unlike static data, longitudinal behavioral data, such as sleep quality and level of physical activities, are assessed at different moments and change over time. Each assessment feature is encoded as a one-hot vector (Behavioral Embedding Layer - BEL) since they can only assume one value at each assessment. For example, the sleep quality can be “good” or “poor”. We defined the one-hot vector strategy because it can easily be adapted for a multi-hot vector if the assessment includes features that assume more than one value simultaneously. For example, an individual can have several diseases from a list. Moreover, we used a non-linear dense layer to process the outcomes of the embedding vector since it improves the results compared to directly sending the embedding vector to the next module. BEL uses the positional embedding layer (PEL) to add a positional vector to each set of BELs assessed at the same time, giving the notion of sequence for the input data.
Transformer layer
As in the original BST architecture, we implemented the only-encode transformer. 5 The main issue in this layer is to optimize its hyperparameters. The work of Michel et al. 25 discusses some greedy strategies to conduct such optimization. Similarly, automatic tuning algorithms, such as Random search and Bayesian Optimization, are usually applied to find optimal values for these hyper-parameters. 26
Fully connected layers
The final module contains a set of fully connected layers (Dense, Batch Normalization, Leaky ReLu, and Dropout) (Figure 2). The role of these layers is to further learn the interactions among dense features. Our experiments used a linear layer with one output unit (float value) as last component since we intended to return a value that could represent the quantitative difference between predictions and reference values. In this case, dense layers do not present an activation function and only implement the dot product of matrices.
Case example: Motivation
According to Razavi et al., “depression is currently the second most significant contributor to non-fatal disease burdens globally.”. 18 This same study shows the possibility of screening for depressive symptoms using pervasive mobile technology. 18 This means, conducting a continuous capture of behavioral data. Thus, mobile technology enables the assessment of longitudinal data, which can be used to analyze possible pre-patterns for depression. This fact encourages investigations focused on inductive strategies that can efficiently analyze such data and provide the basis for interventions.
Case example: Dataset
The English Longitudinal Study of Ageing (ELSA) 13 is a large-scale longitudinal study that involves participants aged 50 and over. This study is divided into waves, which occur every 2 years. During each wave, participants are requested to answer questions to figure out changes in their health, social, and economic situations. 13 Thus, the ELSA study aims to “complete the picture of what it means to grow older in the 21st century, and help us understand what accounts for the variety of patterns that are seen.”. 13 The resultant information provides, for example, data regarding demographics, physical and psycho-social health, cognitive function, social participation, and others. This study started with 7168 samples (in 2002). However, only 2959 continuously participated in the nine waves. Our study focused on these samples since our future aim is to use all the nine waves available in this dataset. This case example, in particular, uses data from the first four waves (2002-2008).
Case example: Objectives
This case example aims to train a BST-based model using multifeature longitudinal (4 waves) data, comprising five QoL features. Then, the BST-based model uses behavioral history (3 waves) and profile of individuals to predict their psychological mood (normal, pre-depressed, depressed), according to input recommendations for behavioral changes. From the model perspective, each recommendation works as the fourth assessment. Thus, the model can evaluate several different recommendations. The following points detail the model input:
Case example: evaluation process
Hyperparameters used in the experiments.
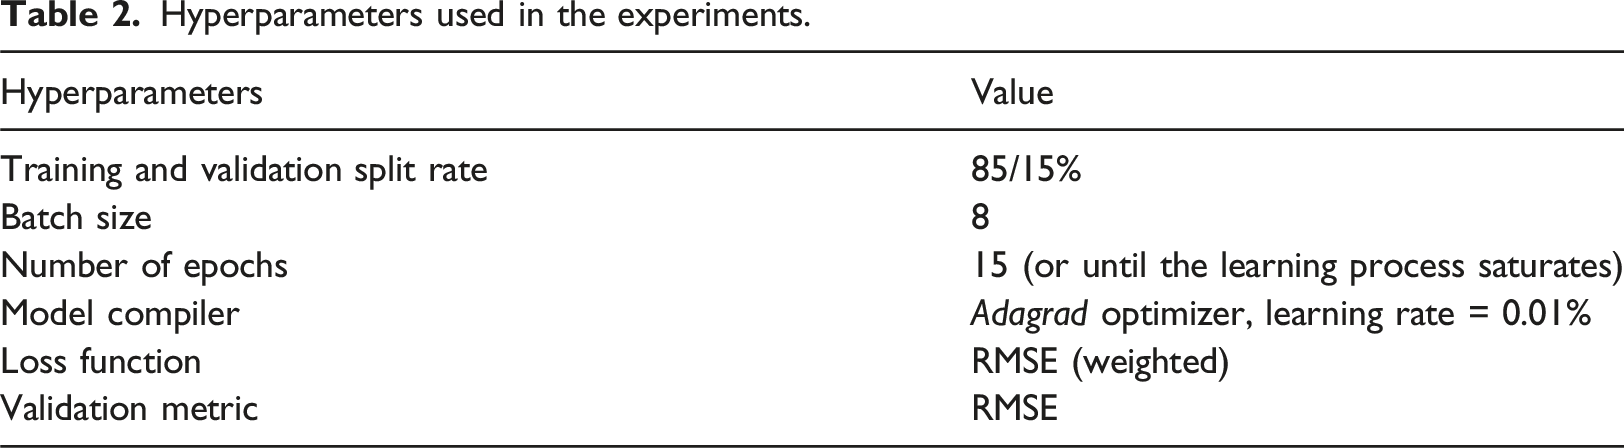
We observed the accuracy evolution and overfitting behavior using the loss for training and validation curves. Our network implemented the L2 Regularization (R2) to mitigate overfitting situations. The final parameters of the model, including the regularization parameter lambda, were obtained using a tuning process (Bayesian Optimization). We consider the output value a continuous float value to have a numeric idea about the errors. However, the Softmax function could also be used as the final layer.
Results
Single features experiments
The first experiments examined our BST model performance in relating single-longitudinal quality of life features to depression mood status (Figure 3). The curves represent the mean values (10 rounds), and their standard deviations. The graphs show that the model can reduce the loss (difference between predicted and real mood representation values <1, 2 or 3>) during the training phase for all features. However, the validation curves are very smooth in most cases (Figure 3(a), 3(d), 3(e)), and their loss reductions are not very evident. The curves also show that the learning process saturates between epochs 6 and 13 for such experiments (black arrows in the graph), given the simplicity of the models (single feature embedding). Figure 3 also shows the mean (μ) and standard deviation (σ) for RMSE values. Such RMSE values are lower than the baseline (0.71), mainly when the model uses high-pressure diagnosis (0.357, Figure 3(c)) as the training feature. QoL@TbA training and validation loss curves for models using a unique feature: (a) marital status, (b) high-pressure diagnosis, (c) diabetes diagnosis, (d) sleep quality, and (e) level of physical activity.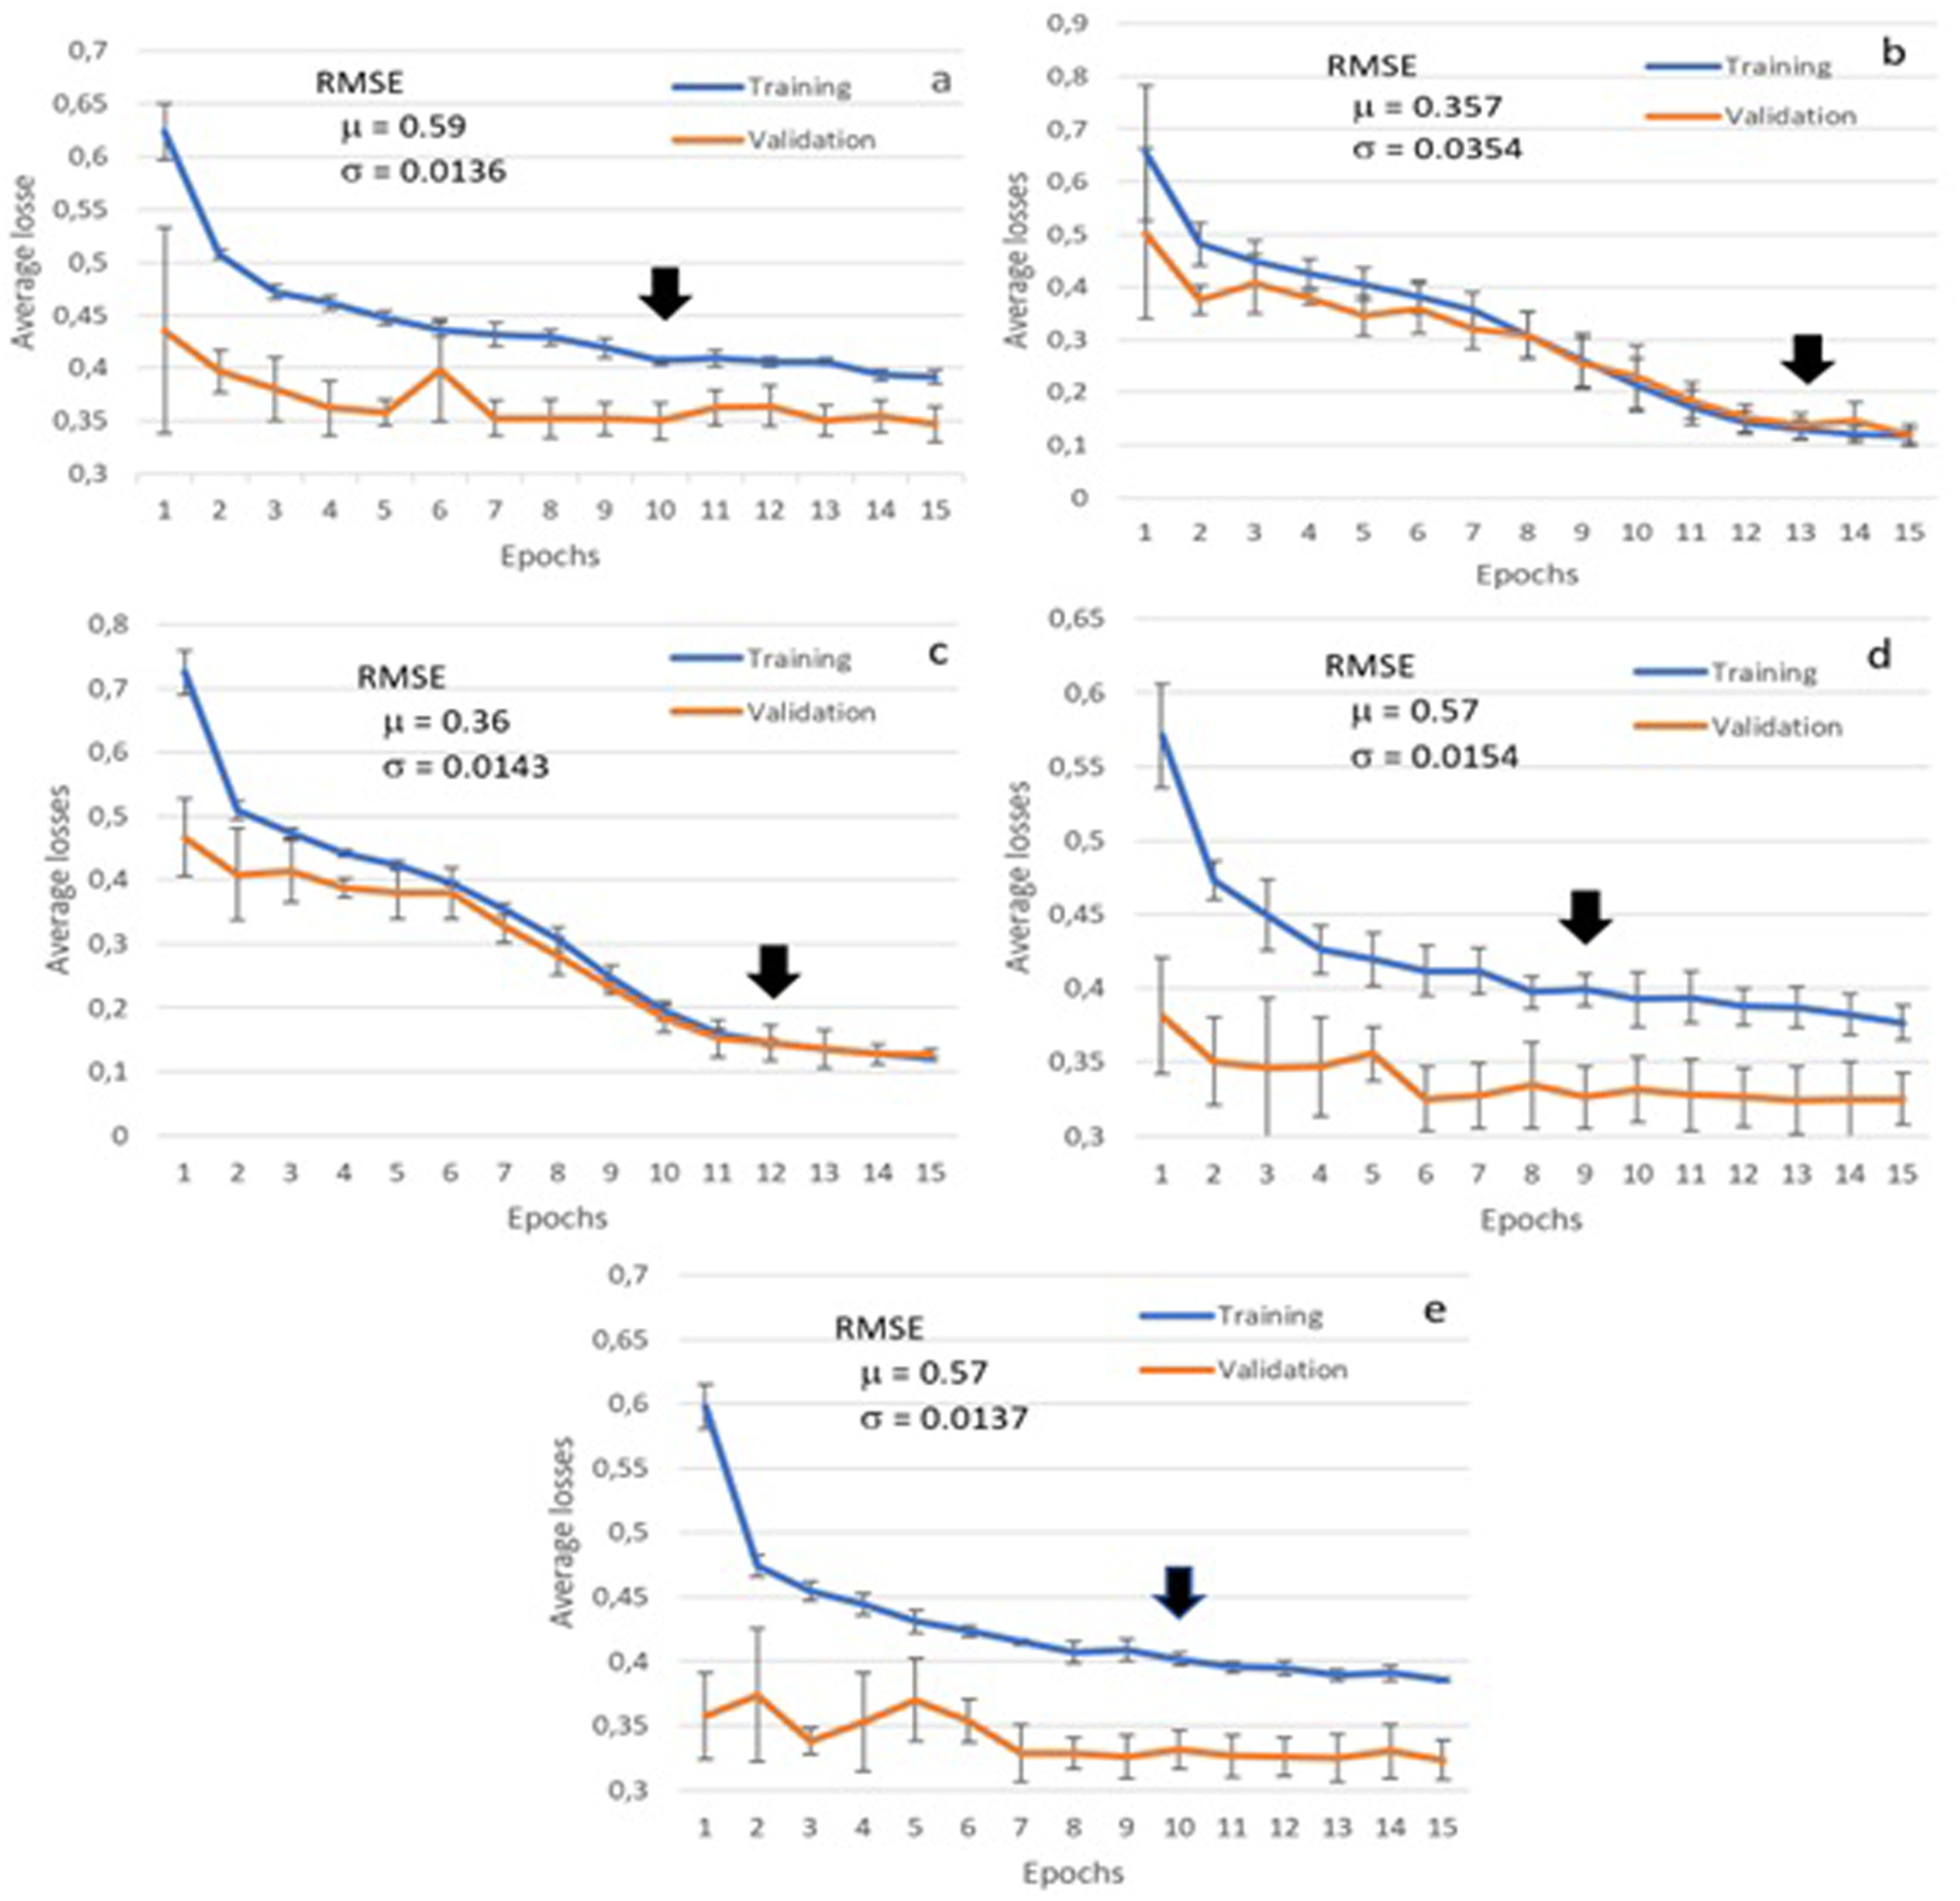
Multifeature experiment
This experiment used all features together (Figure 4). In this case, the training and validation loss curves present a sharper decreasing behavior. Moreover, the RMSE was improved to 0.28, with the learning saturation point at epoch 27. This high number of epochs was expected since the model presents a higher complexity. After that point, the model could not return any meaningful gains, and the curves became almost flat. QoL@TbA training and validation loss curves for the multifeature model.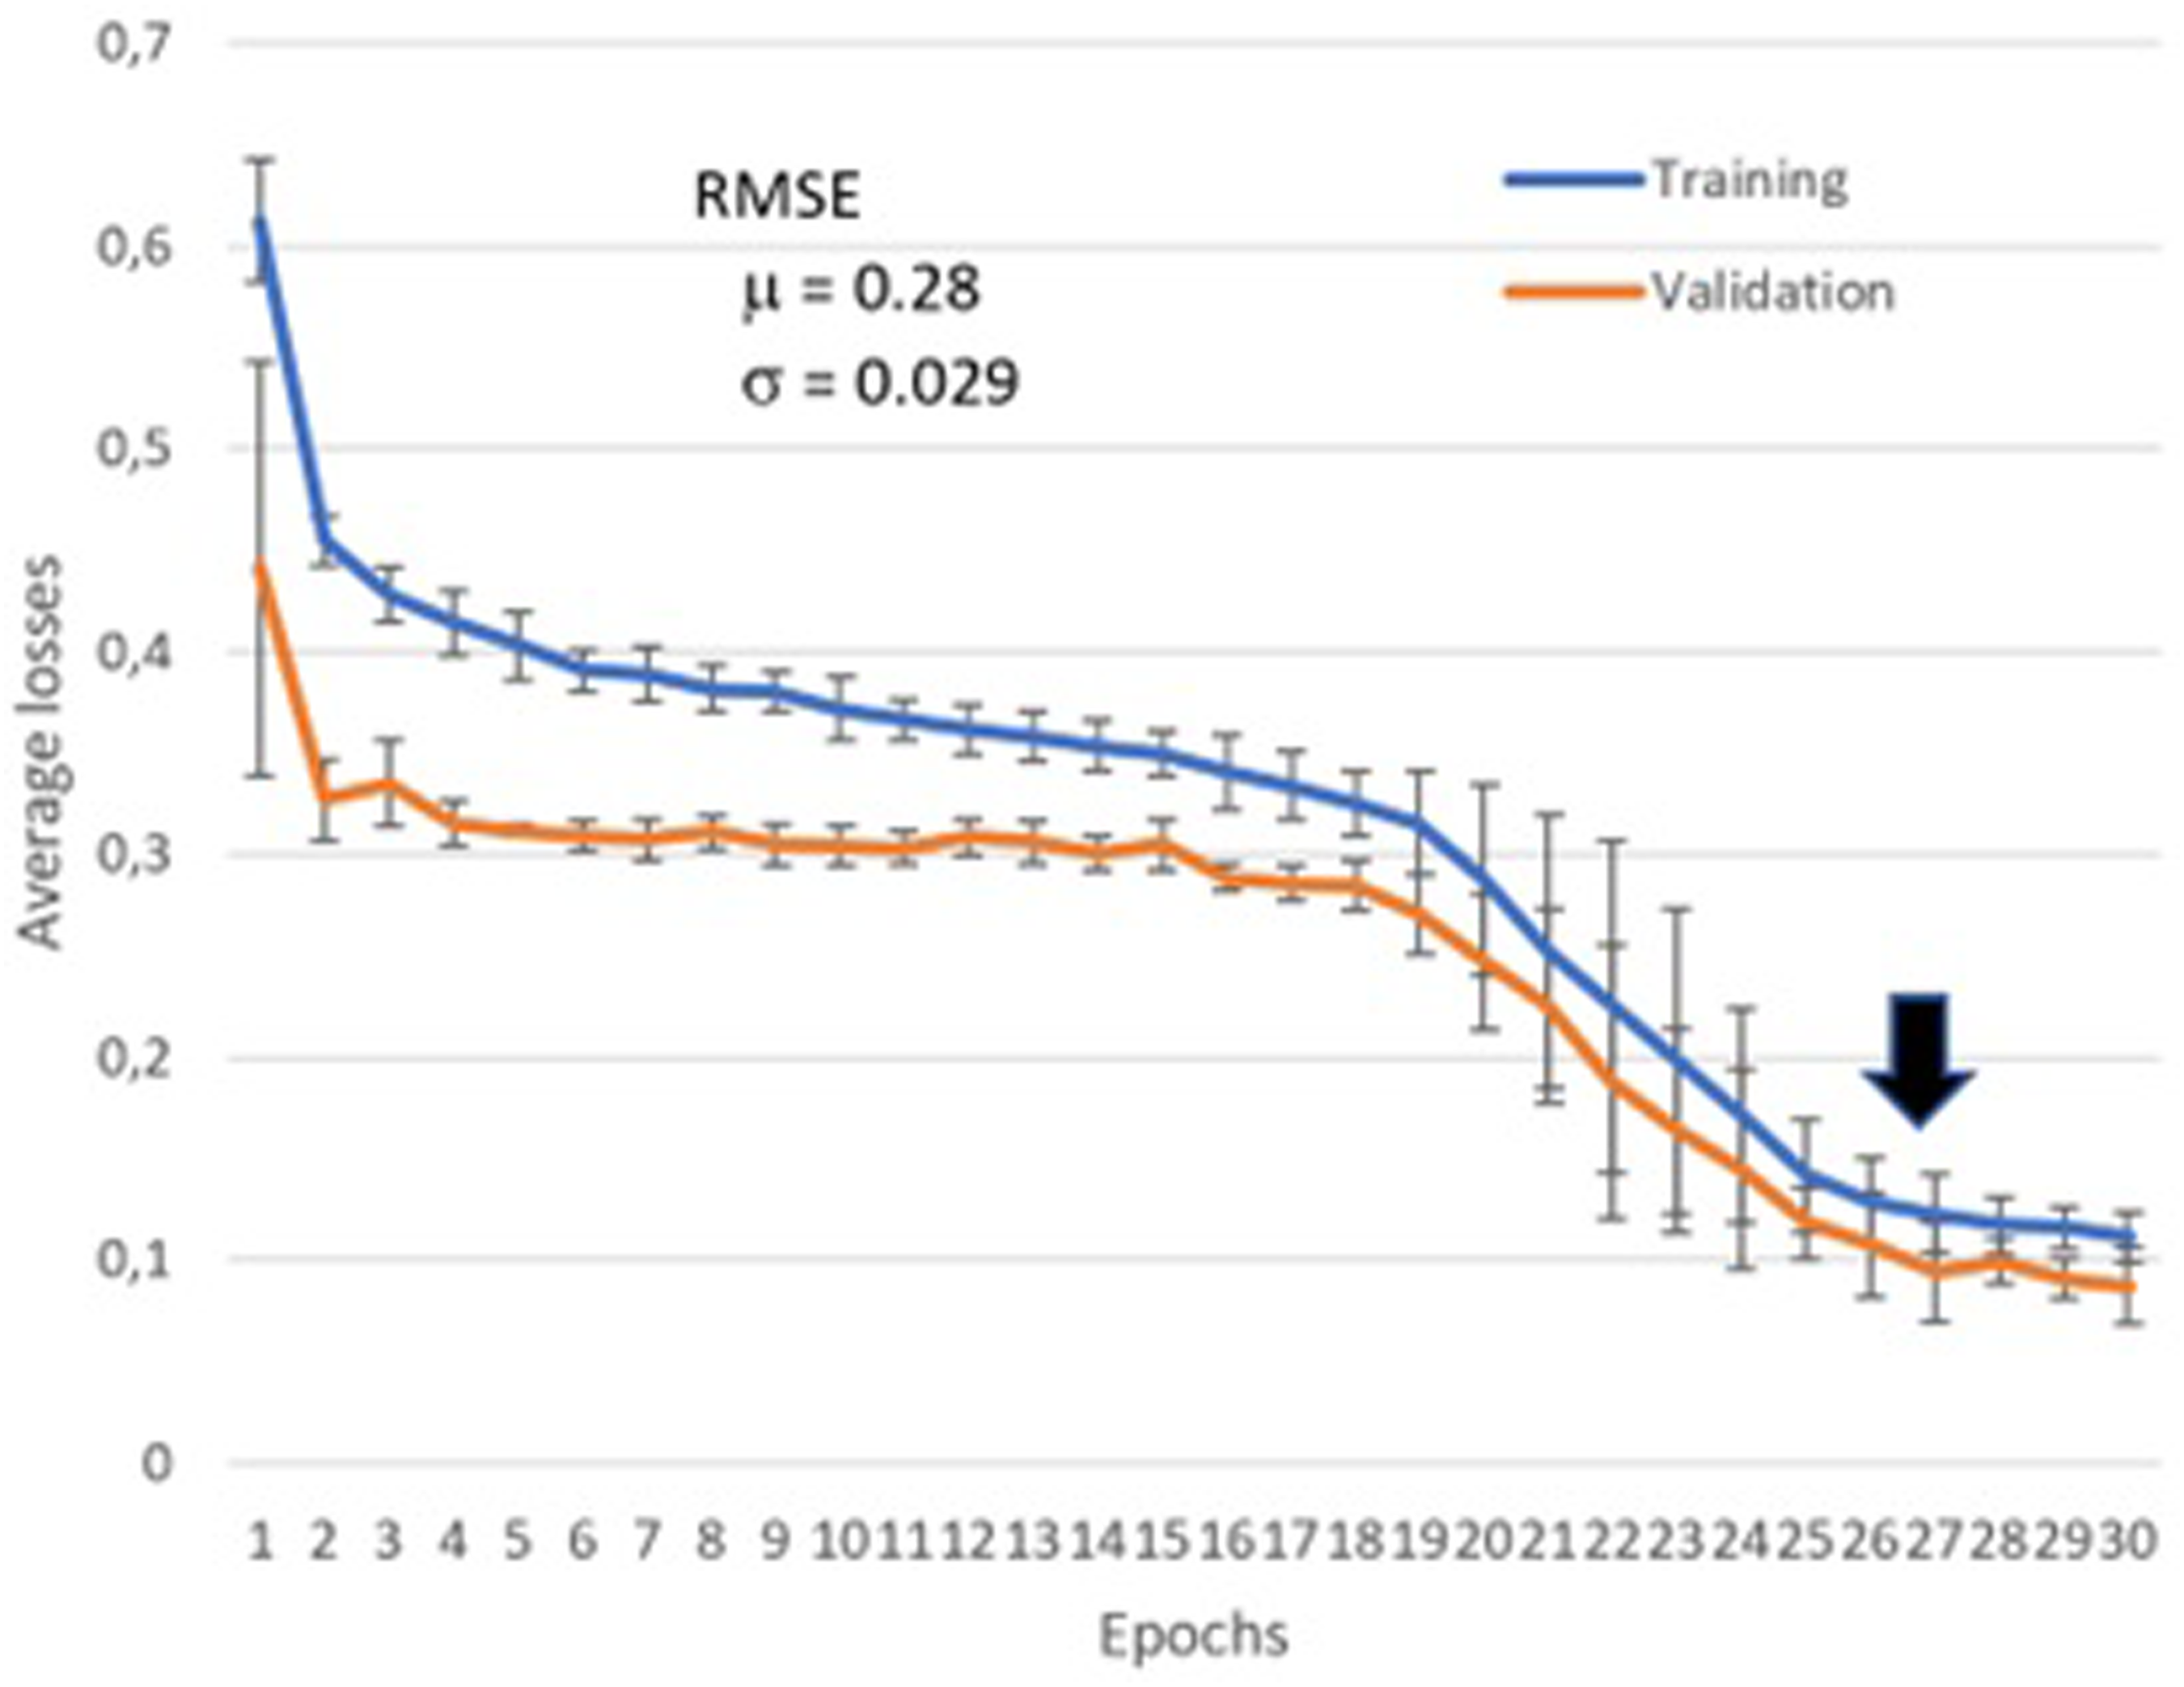
Influence analysis of behavior changes
This experiment aimed at verifying if and which behaviors could mitigate a state of depression at wave 4. Therefore, we randomly selected 10 individuals who presented depression in their fourth wave. After that, we generated behavior patterns for this fourth wave and applied the BST model to verify the influence of these generated patterns on the individuals’ moods (e.g., what could have happened if the individual had slept better?).
Equation (1) shows the number of possible generated behavior patterns γ, considering the number of classes of each feature a, where n represents the number of features. For example, our five categorical attributes have the following possible classes: marital status = 6, high pressure = 2, diabetes = 2, sleep quality = 2, and level of physical activity = 3. Thus, the model should evaluate 144 patterns.
Examples of recommendations for behavior changes.
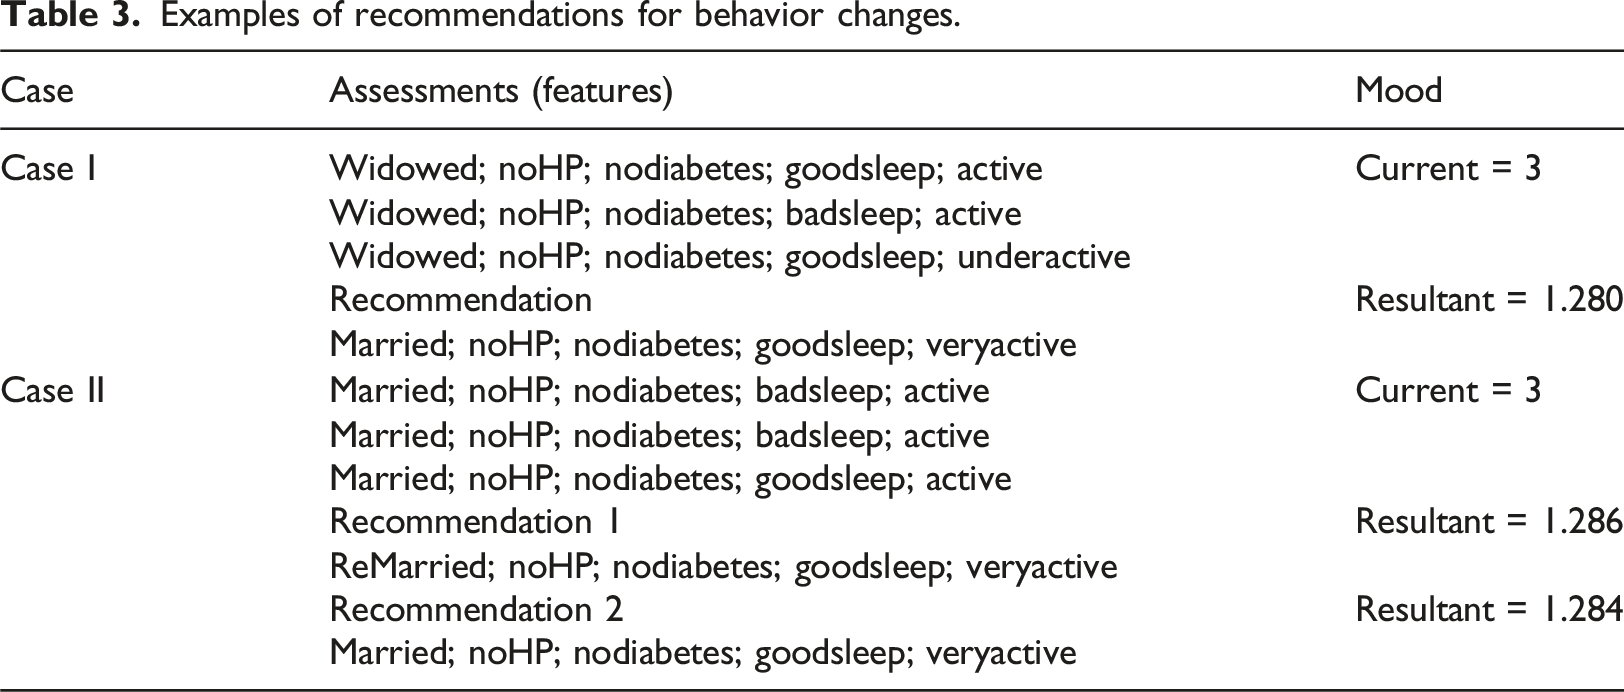
The second case returns two recommendations. Part of the first recommendation (Recommendation 1) may indicate that the individual must still be married. However, the first and second recommendations for this individual again emphasize the importance of physical activity as an option to avoid depression.
Discussion
Multifeature longitudinal data
Multifeatured models obtained better results as they captured more complex relationships and interactions among various variables influencing the outcome. Theoretically, an increased number of features can enhance results, provided the correlations among these inputs are low and the dataset has sufficient data to avoid a sparse search space. Given the limitations of the ELSA dataset, we chose to maintain only five input features in our model. Additionally, we selected features that influence depression based on the specialized literature, including marital status, 19 high-pressure diagnosis, 20 diabetes diagnosis, 21 sleep quality, 22 and level of physical activities. 23 These features do not exhibit direct bidirectional correlations, thereby contributing valuable information to the problem. Furthermore, we observed that multifeatured models can effectively distinguish signal from noise, reducing the impact of random fluctuations associated with any single feature.
The use of multi-feature longitudinal data was also important to improve the accuracy of predictions and support the analysis of results (explainability). For example, the results in Table 3 allow a comparative analysis between the previous and recommended behavioral patterns. Moreover, we can confront new hypotheses with results from previous studies. For example, according to the literature, “married people have comparatively low depression rates because they are, for several reasons, emotionally less damaged by stressful experiences that are non-married people”. 19 This statement corroborates our results. However, this statement may only be valid if associated with other QoL features, such as a high level of physical activity. A multifeature approach allows this type of analysis, which differs from previous studies focusing only on one dimension.19–23
Scalability
Our study presented and validated the concept of BST for longitudinal multifeature QoL data. However, this case example is simple when compared with real scenarios. For example, we only used five features as available in the ELSA dataset, configuring a scenario with low dimensionality. For example, these features allow 144 behavioral patterns (see equation (1)). Complex QoL domains may present more than 24 features (WHOQOL, 1995). If a domain has 30 features, each with five classes, the dimensionality exponentially increases to 530, or approximately 931 × 1018 combinations. In this case, the use of meta-heuristics (e.g., genetic algorithms) is essential to reduce the search space of behavioral patterns.
Practical implications
Health recommendations in the real world must consider three main aspects. First, recommendations for behavior change should closely align with current behaviors; for instance, we restrict the choice of new values to those in proximity to existing values. Second, the assessment of inputs should minimize user interactions and be transparent, utilizing passive data collection methods such as accelerometers. Finally, explainability is crucial for clarifying the reasons behind recommendations, which in turn supports user engagement.
Limitations and future works
This study had three main limitations. We trained the model using only four waves. Thus, we could not evaluate the transformer’s ability to analyze long sequences when applied to multifeature data. As far as we know, the literature does not present this type of analysis yet. The number of samples (2682) is also low, considering the search space of the problem. Thus, overfitting was a challenge during the training stage. However, the main limitation is the reliability of the data. Some of its values are collected using questionnaires that summarize long periods. For example, ELSA summarizes the sleep quality of 2 years in a single binary class (“good”, “poor”). Thus, the use of a longer and larger (more samples) as well as a more granular dataset based on passive data is part of our ongoing work.
It is important to note that our architecture has a dense layer as the last network component. Thus, it returns a continuous value, characterizing a regression rather than a classification model. This strategy is interesting when the aim is to return probabilistic outputs and have insights into the likelihood of belonging to a particular class. Thus, RMSE is used since the resultant error is in the same units as the target variable. However, this strategy to use a regression rather than a classification model also has disadvantages. Regression assumes a continuous output space, which might not align with the discrete nature of class labels. Thus, it can lead to misinterpretation of predictions and loss of class information, which could be a limitation depending on the task.
In future works, we intend to use the same strategy with data generated by wearable devices, which produce passive, continuous, and diverse behavioral data streams. For example, data about sleep quality (e.g., sleep duration, sleep efficiency), physical activity (e.g., level of intensity and distribution of activities along the day), physiological signals (e.g., heart rate variability, respiration), and others. Some of these data bring additional challenges since our approach relies on categorical input data. Thus, their use requires a process of data categorization that summarizes the data without losing quality. Besides own efforts in data collection, available datasets (e.g., UK Biobank and All of Us Research Program) provide long streams of health-related data and can be very useful for multifeature longitudinal recommendation research. Moreover, such long-term datasets are also helpful in supporting the validation of approaches regarding scalability and the use of long multifeature sequences.
The integration of explainable/interpretable strategies is another possible future work derived from our investigation. Our current approach returns a combination of features (i.e., recommendations) that, if implemented, could improve the long-term health aspects of individuals since such features work as a guide for possible behavioral changes toward healthy routines. Therefore, in this version, experts’ opinions account for the interpretability of the recommendations’ outcomes. However, considering the new trends regarding regulations for critical AI domains 27 (e.g., health), self-explainable models will be compulsory and part of our short-term research directions.
Conclusion
Unlike traditional recommendation systems that aim to predict potentially interesting outputs for users, the QoL@TbA model supports a multifeatured longitudinal data analysis to provide recommendations for concurrent modifications across multiple input features. Additionally, static data (e.g., user profiles) is incorporated into the model to create more personalized recommendations for behavior change. To the best of our knowledge, this use of transformers represents a novel direction (multifeatured longitudinal data analysis for recommendation support and recommendations for concurrent modifications in multiple input features) with no prior efforts in this area. Supplementary material discusses the training algorithm, pre-processing strategies for missing and imbalanced data, and the computational complexity of this approach.
Footnotes
Author contribution
Siebra: Methodology, conceptualization, experiments, writing. Kurpicz-Briki: Conceptualization and review. Wac: Conceptualization and review.
Declaration of conflicting interests
The author(s) declared no potential conflicts of interest with respect to the research, authorship, and/or publication of this article.
Funding
The author(s) disclosed receipt of the following financial support for the research, authorship, and/or publication of this article: This work was supported by the European Commission Horizon 2020 research - Marie Sklodowska-Curie Action (H2020-MSCA-IF-2020-101024693).
Ethical statement
Given the nature of the utilized data, which are publicly available, there is no cause for concern regarding ethical considerations in this study.