
Abstract
Introduction
Background
The world is inherently multimodal. Entities, from patients to proteins, can be described in various ways called modalities. The onset of diseases and conditions can be measured in a medical setting through a measurable change in biomarker modalities, such as blood-pressure, heart-rate, and x-ray findings. As an example, the progression of Alzheimer’s Disease (AD) has shown a correlation with modalities such as Magnetic Resonance Imaging (MRI), 1 Positron Emission Tomography (PET), 2 and protein measures of Cerebrospinal Fluid (CSF). 3 MRI provides a means of detecting atrophied brain regions, PET can reveal hypometabolism, 4 and protein measures of CSF can detect the presence of beta-amyloid (Aβ42) and tau (τ) proteins characteristic of AD. 5 Each modality provides unique information, which, combined, could improve AD progression classification.
Medical machine learning (ML)-based analytics attempt to improve the quality and speed of previously manual tasks and have featured predominantly uni-modal approaches. Combining multiple information modalities, similar to a physician considering multiple sources of information, can enhance the performance of complex predictive ML-based analytics.
Multimodal representation learning (MRL) 6 is a theoretical and practical framework for combining multiple information modalities to improve the effectiveness of ML. MRL has recently expanded into the medical analytics domain, where it has been used to combine multiple medical modalities for diagnosis and prognosis tasks. 7 However, no comprehensive survey of MRL in the medical domain has been performed, leaving researchers to piece together which modality combinations have been attempted for various medical analytics using MRL techniques.
Furthermore, various medical information modalities exist in the medical space, such as omics data, medical images, textual medical records, electronic health records (EHR), computerized clinical practice guidelines, and biomedical knowledge graphs. It has become daunting to sift through these options with medical analytics in mind and identify which are relevant, have been used previously, and in what combination.
This work reviews the use of MRL as a computational technique for utilizing multiple sources of information to improve the performance of ML-based medical analytics. The review describes and classifies the techniques and provides a hierarchy of medical information modalities over which one could attempt MRL. The review represents a comprehensive, structured survey of publications utilizing MRL for ML-based medical analytics, positioning them in the following classification spaces. The MRL classification space describes the specific MRL technique used. The medical information modality classification space describes the modalities being integrated. The medical application classification space describes the clinical motivation, and the utility classification space describes the intended use of the analytics.
The review thereby addresses the following questions: What has been done in the medical analytics field with MRL? Which dimensions of analysis can be defined and used to identify unexplored techniques and application areas of MRL in the medical domain? This paper’s contribution to answering these questions can be summarized as follows: it provides a comprehensive review of MRL technologies, improving upon previous surveys by proposing a novel and updated MRL classification space, including neural network technologies as a top-level category. This category is further expanded with recent technologies, such as attention techniques, convolution neural networks, and autoencoders. The paper provides a novel taxonomic hierarchy for structuring medical information modalities into three levels, starting from structured and unstructured data. Furthermore, an explorable online analysis is provided for diving into MRL-based techniques for medical applications, opening up the potential for researchers to investigate the current state of the art and novel ideas for medical MRL.
Related work
Previous surveys of MRL over general-purpose application domains have focused on the type of MRL technique. While surveys reviewing multimodal deep-learning8–10 review new technologies and narrow the scope of the MRL technique employed. In this work, we do not limit ourselves to specific branches of MRL techniques. Additional surveys contextualize MRL in the general challenge of multimodal ML, 6 with a focus on fusion-based MRL 11 or its mathematical-theoretical foundations, 12 disregarding the application domain. We, however, provide a comprehensive systematic review of the medical analytics domain.
To the best of our knowledge, this paper presents the first attempt to review MRL for medical applications and provide a classification space in which modality combinations from the literature can be placed and future medical analytics designed. Furthermore, this work is the first to comprehensively review more than 1400 papers for MRL in multimodal medical applications while classifying the literature into four dimensions, i.e., utility, medical, modality, and MRL.
Methods
The following section describes the review methodology employed in this work. It begins by describing the classification space used throughout this paper, followed by the details of the section Review Methodology.
Classification space
The following classification space is used throughout this work to structure our survey of previous work utilizing MRL for ML-based medical analytics. The classification space comprises three orthogonal dimensions of classification. The utility dimension describes the intended use of the medical analytics task. The information modality dimension describes the types of medical information modalities incorporated in the MRL approach. Finally, the MRL approach dimension describes the MRL technique used. We begin by defining a medical analytics task.
Medical Analytics Task A medical entity is an item of interest for medical purposes. Entities can be patients, diseases, tumors, viruses, blood samples, etc. A medical analytics task provides information on a medical entity in an automated manner using an algorithm or a learned model over some input data.
Medical analytics utility
It is common to classify analytics by utility. 13 Descriptive analytics describes the given input. This type of analytics is the most common. It contains methods, such as classification (this is an ultrasound image) and object detection (the image contains three lesions in these coordinates). Diagnostic analytics methods attempt to identify the root cause of the observed phenomena and are used to diagnose diseases and sub-types of diseases with similar symptoms but slightly different causes. Predictive analytics, also often described in the medical domain as prognostic, attempt to predict the occurrence of a future event or state from the current state or the sequence of states given as input. A medical example could be sepsis mortality prediction. 14 Prescriptive analytics provide one or more recommended actions to take in response to the given input. While in the general domain, this form of analytics is sometimes employed as autonomous agents, e.g., as recommendation systems, in the medical domain, they are used for decision support, e.g., treatment recommendation. 15
Medical information modalities
A medical information modality is a data representation used to present information about a medical entity and used by medical analytics. In data management and ML, 16 it is common to distinguish between structured and unstructured data. Structured information is discretized into records, each containing fields that are assigned values describing some medical entity. For example, a relational database, where tables contain records sharing a fixed schema for describing the status of a patient.
Figure 1 presents a partial view of the proposed hierarchy, showing levels one and two in full and examples from the third level. Partial hierarchy for structuring medical modalities. The full hierarchy can be found at https://tabsoft.co/40aAECd.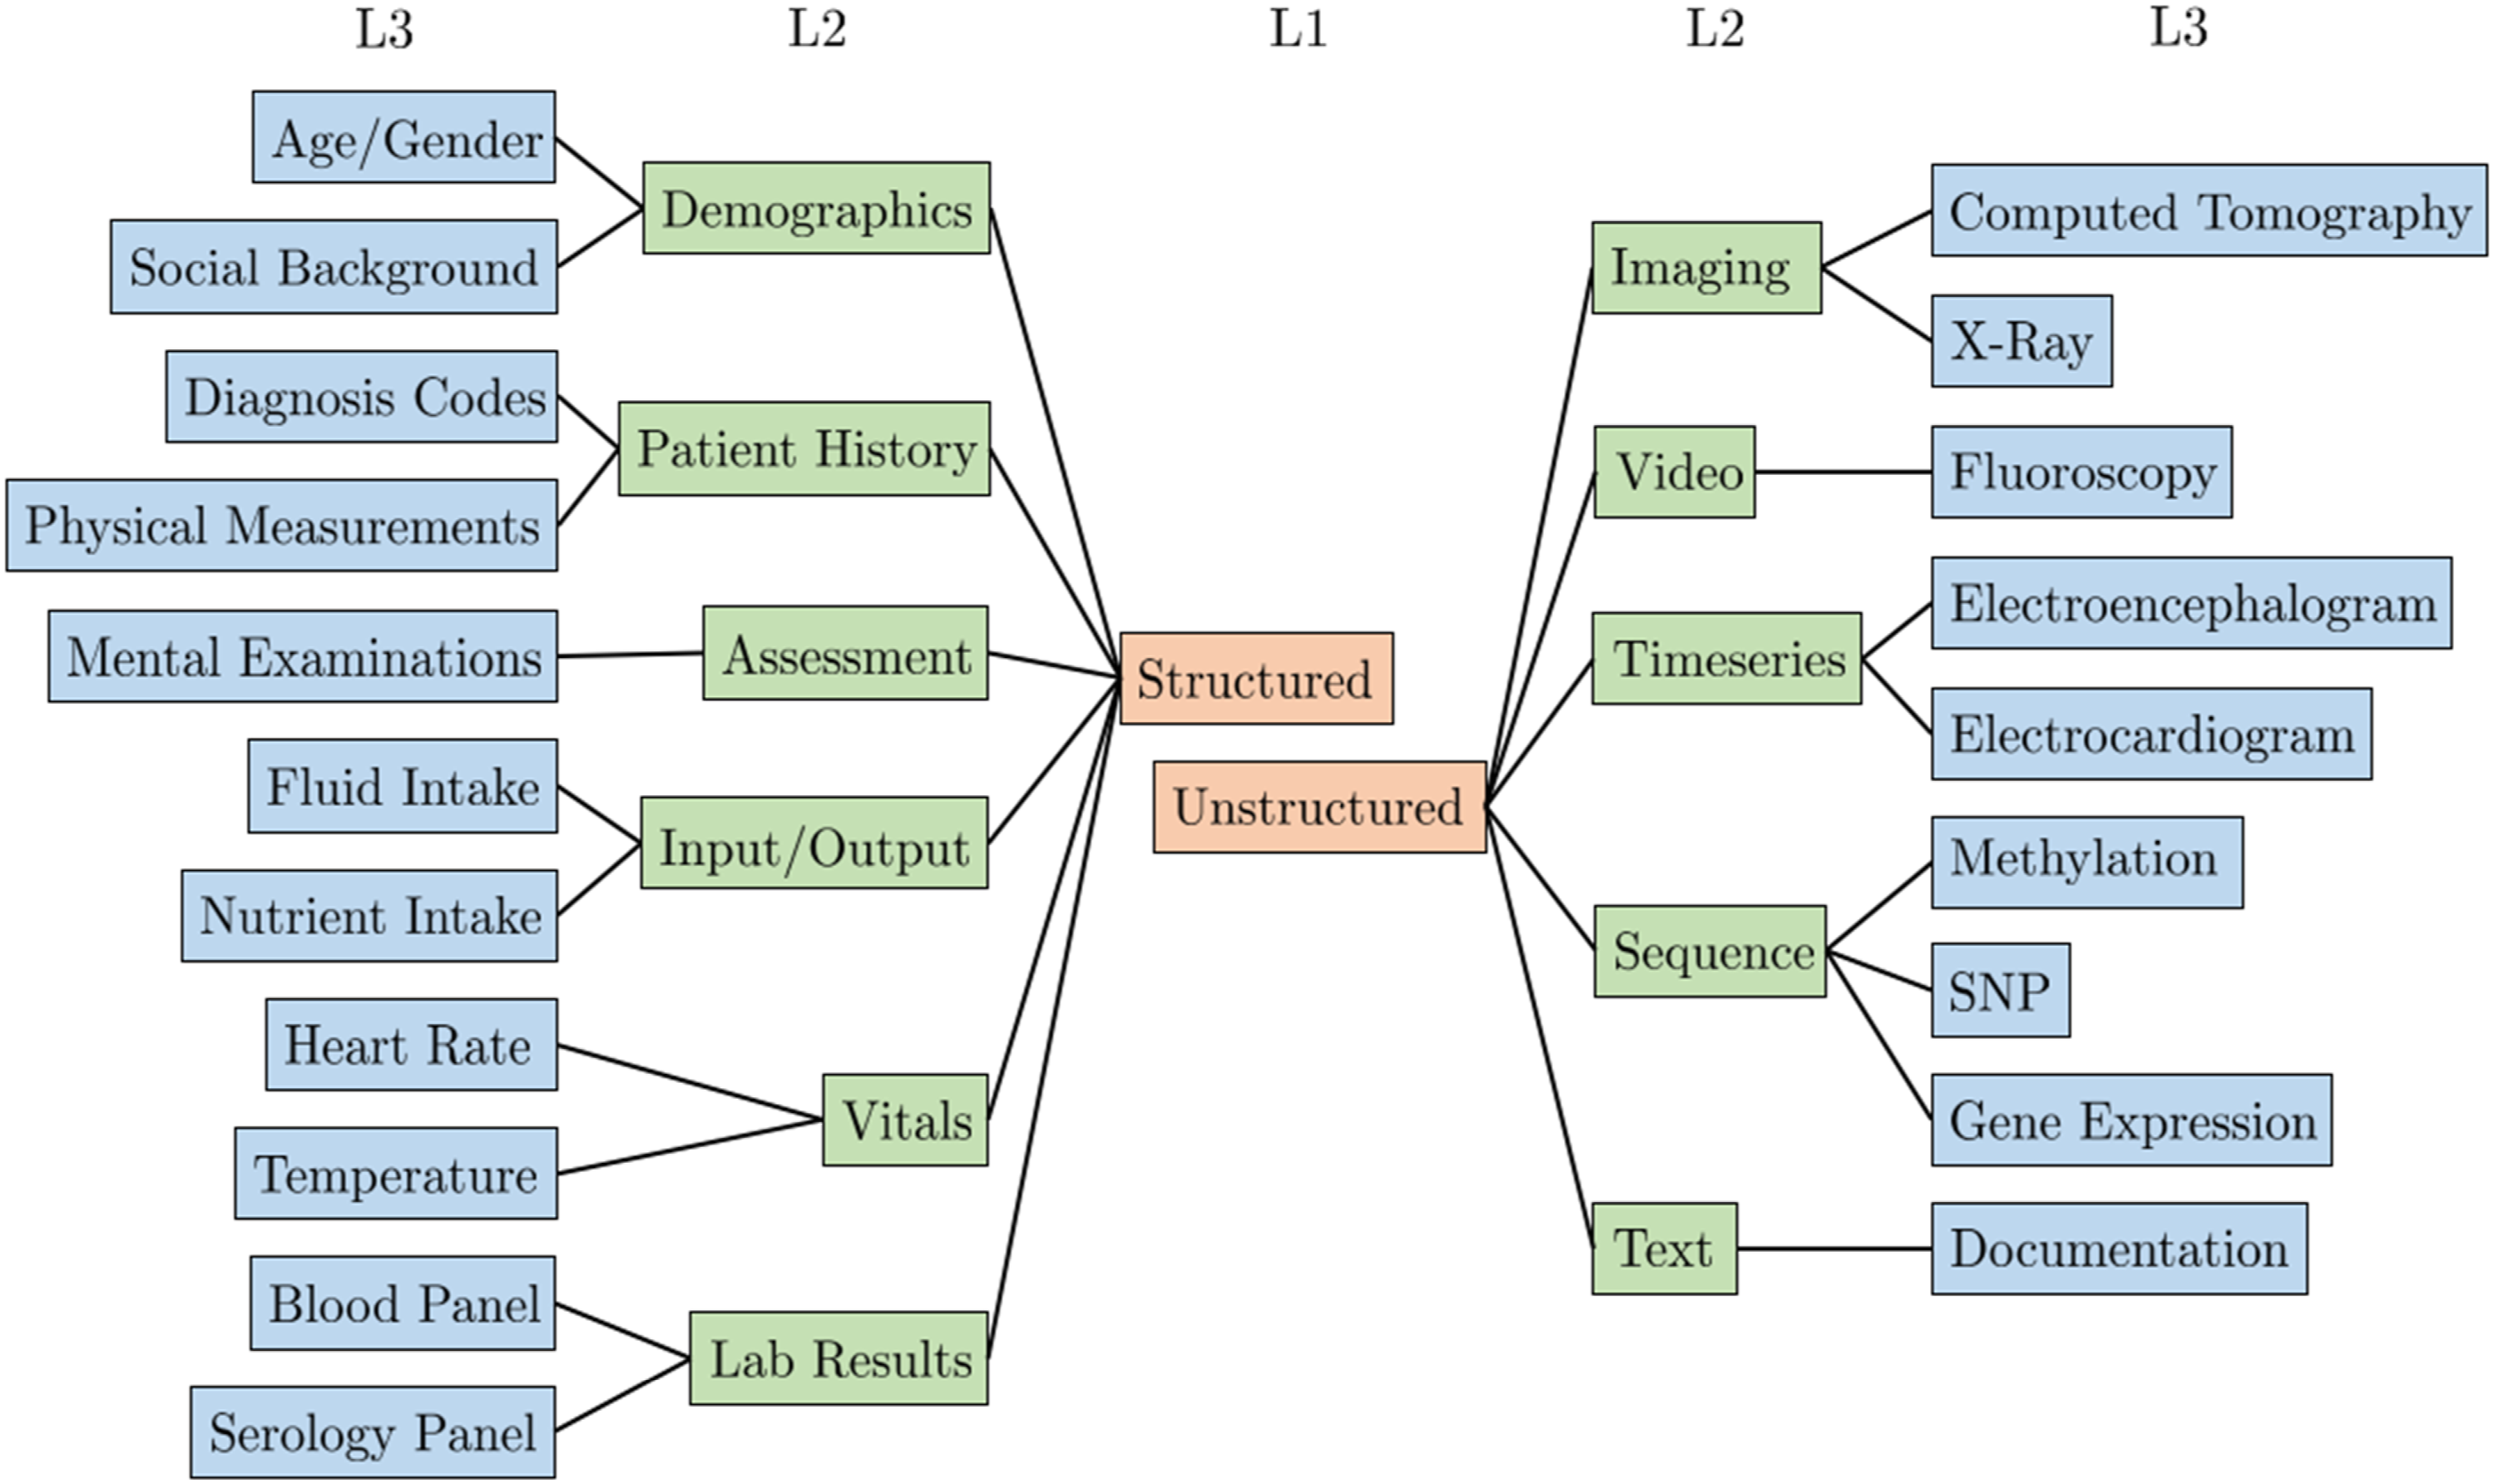
The top level of the hierarchy separates structured and unstructured modalities. On the second level, multiple medical modalities are grouped using common groupings in ML literature, such as image, text, and timeseries. The third level represents specific medical information modalities used in MRL analytics. Furthermore, level three concepts are mapped to SNOMED taxonomy concepts to the extent possible. Hence, the SNOMED sub-classes can serve as the fourth and onward levels of the hierarchy. Furthermore, through these concepts, our third-level concepts can be connected to other terminologies and translated into other languages. For example, our level three concept Computed Tomography is mapped to the SNOMED concept Computed tomography (procedure). Using the Bioportal SNOMED ontology 1 the SNOMED concept can be mapped to other taxonomies like MedDRA 2 with the concept CT scan and BIM 3 with Computed_Tomography. The medical modality hierarchy is complete with respect to the set of publications surveyed in this work and available online. 4
Multimodal representation learning
To perform a structured analysis of existing MRL approaches, they are organized in a hierarchical structure. Let us first define MRL.
Multimodal Representation Learning Given two datasets Thus, the latent space contains information from both medical modalities and hence should enable improved subsequent medical analytics compared to uni-modal approaches. Figure 2 exemplifies MRL for Alzheimer’s Disease (AD) classification. MRL techniques can be broadly classified into alignment, fusion, and neural, as illustrated in Figure 3 (adapted from
12
). Generally, alignment techniques find a feature space where modalities can coexist, fusion techniques combine uni-modal features into a new latent representation, and neural techniques jointly learn a latent representation combining uni-modalities and learn a model for solving a medical analytics task. The remainder of this section presents these subcategories.
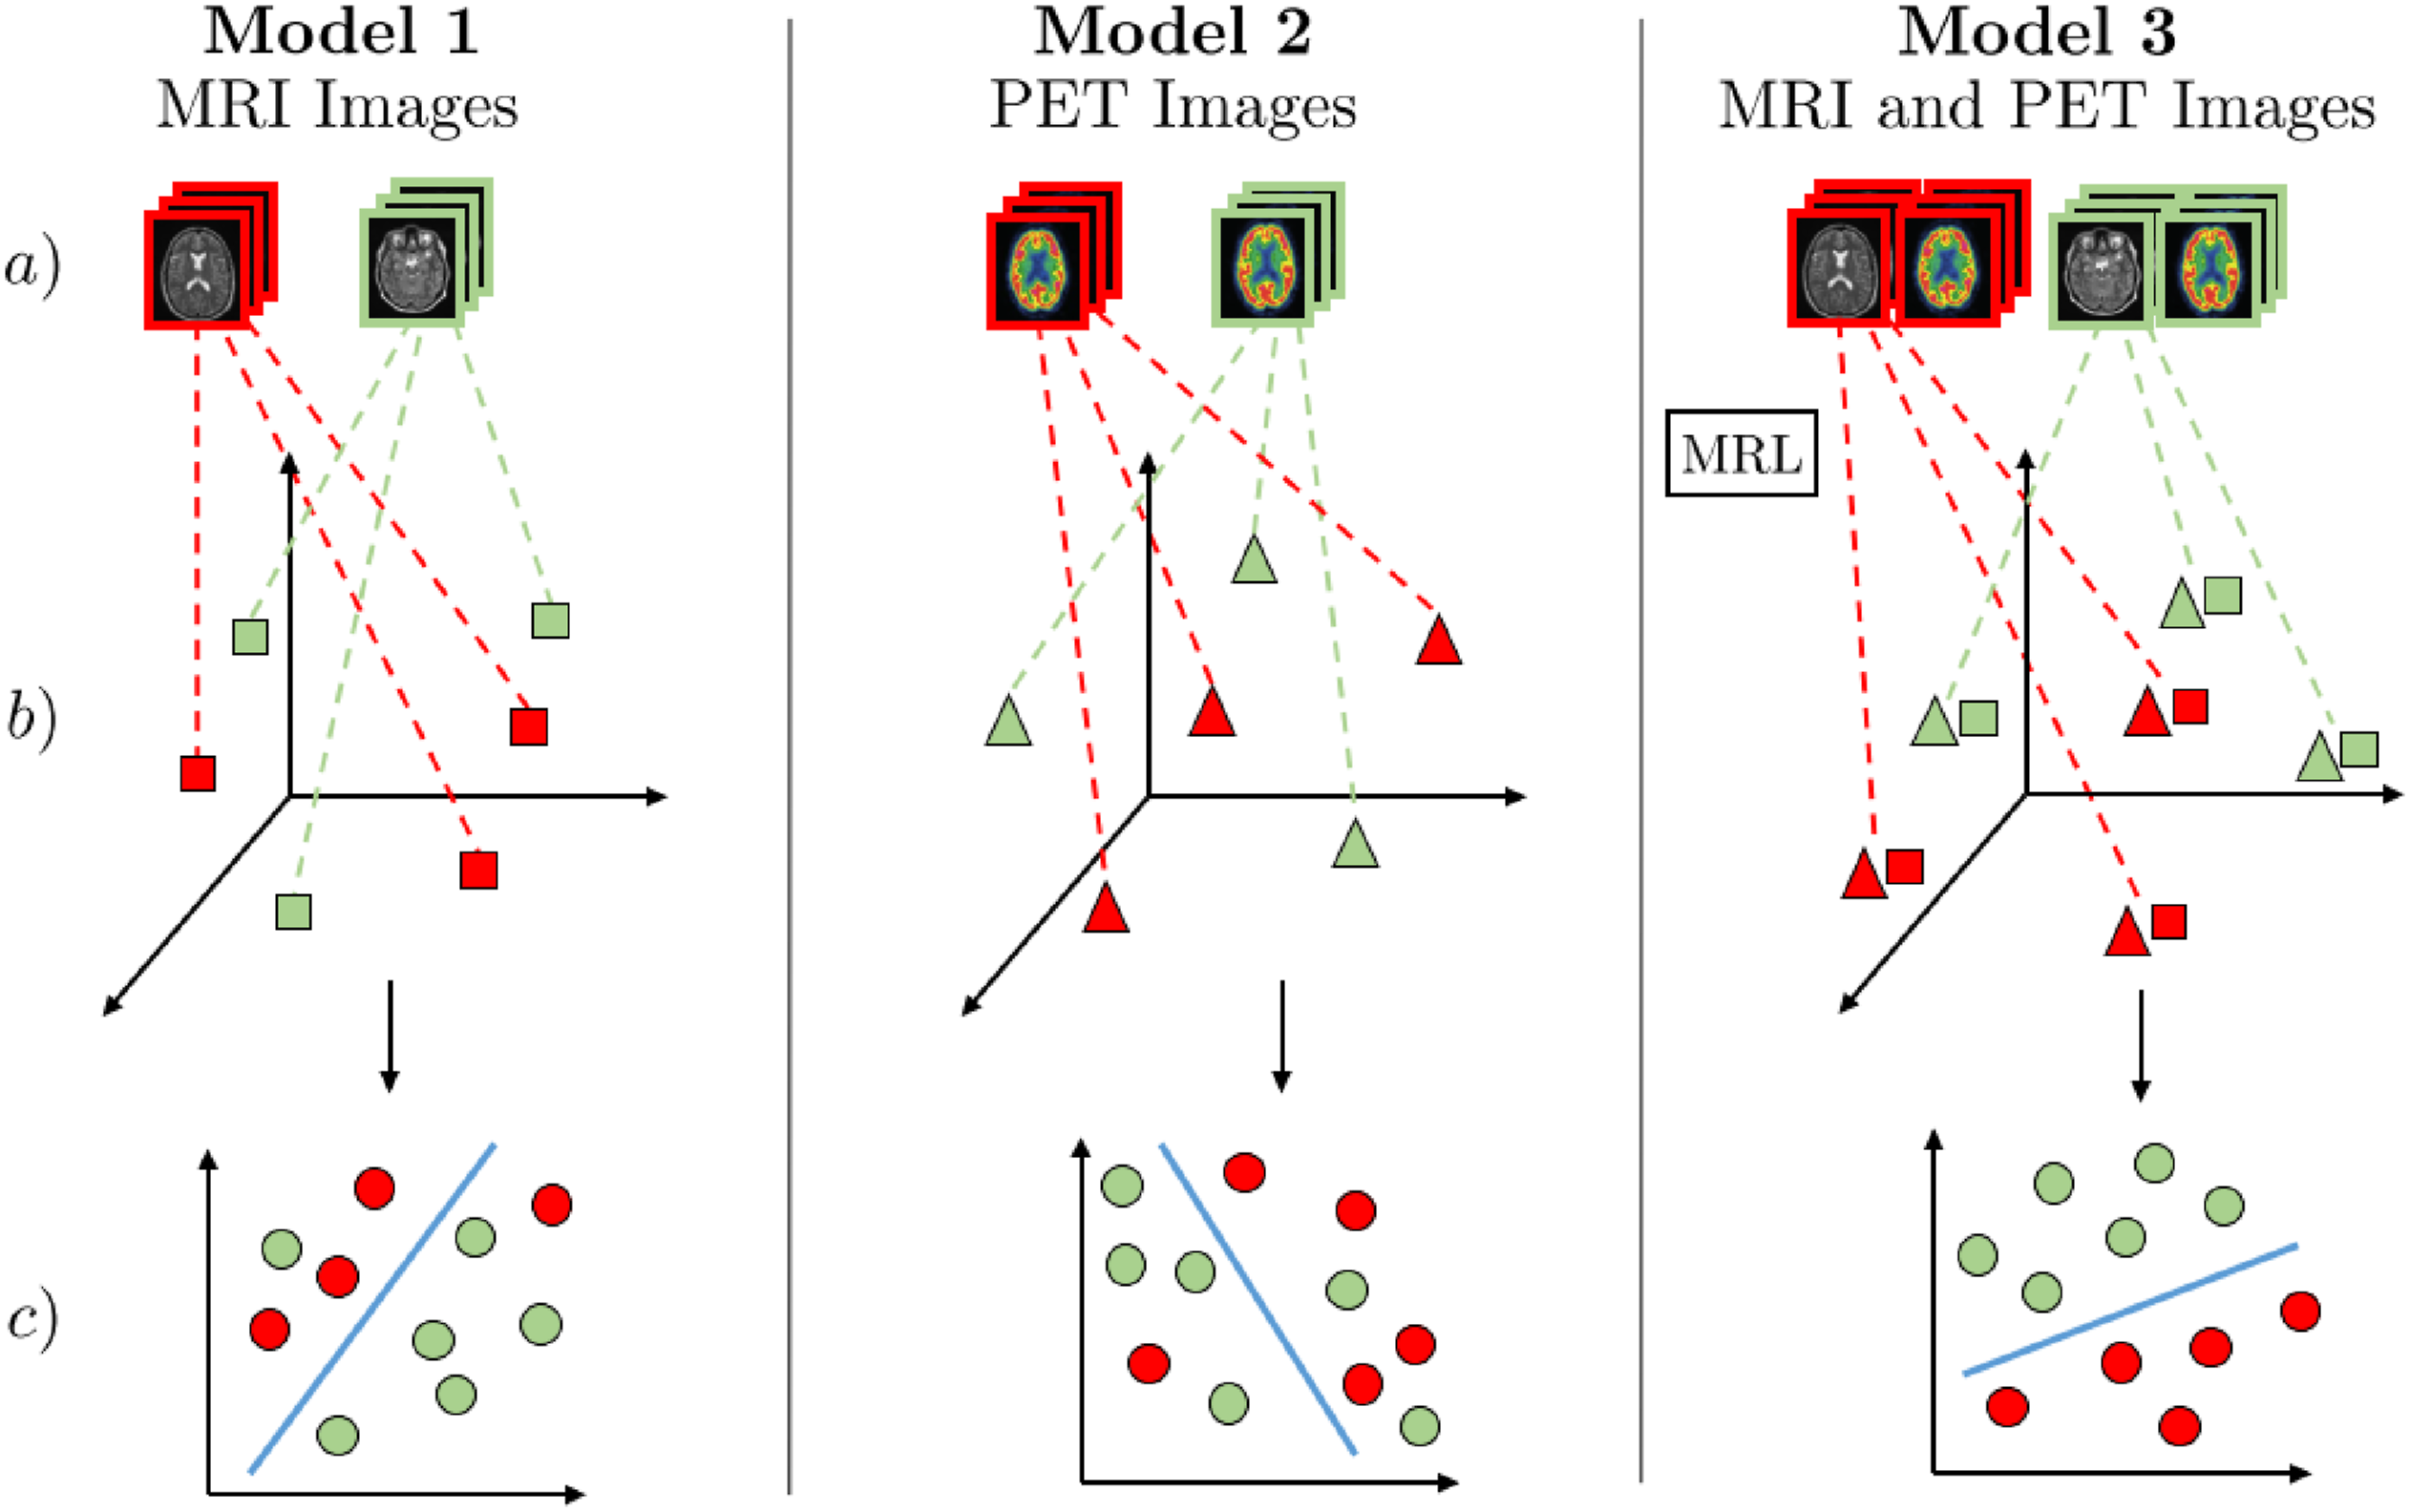
MRL for discriminating Alzheimer’s disease (AD) patients from healthy subjects∼(HS). The three models (1 and 2 - uni-modal, 3 - multimodal) consist of three steps: (a) Receive multimodal samples, (b) map samples to their individual representation spaces, or, in the case of Model 3, use MRL to map modalities to a shared semantic space, (c) classification of AD/HS. Red represents AD-positive samples, and green represents AD-negative samples. Models 1 and 2 use MRI and PET images for uni-modal AD classification. In Model 3, MRL is used to find a shared semantic space combining MRI and PET images, capturing the underlying semantic correlation between these modalities. As illustrated in step c) of Model 3, the combined discriminative information from a shared semantic space between MRI and PET can be used for superior medical analytics such as AD classification. 39
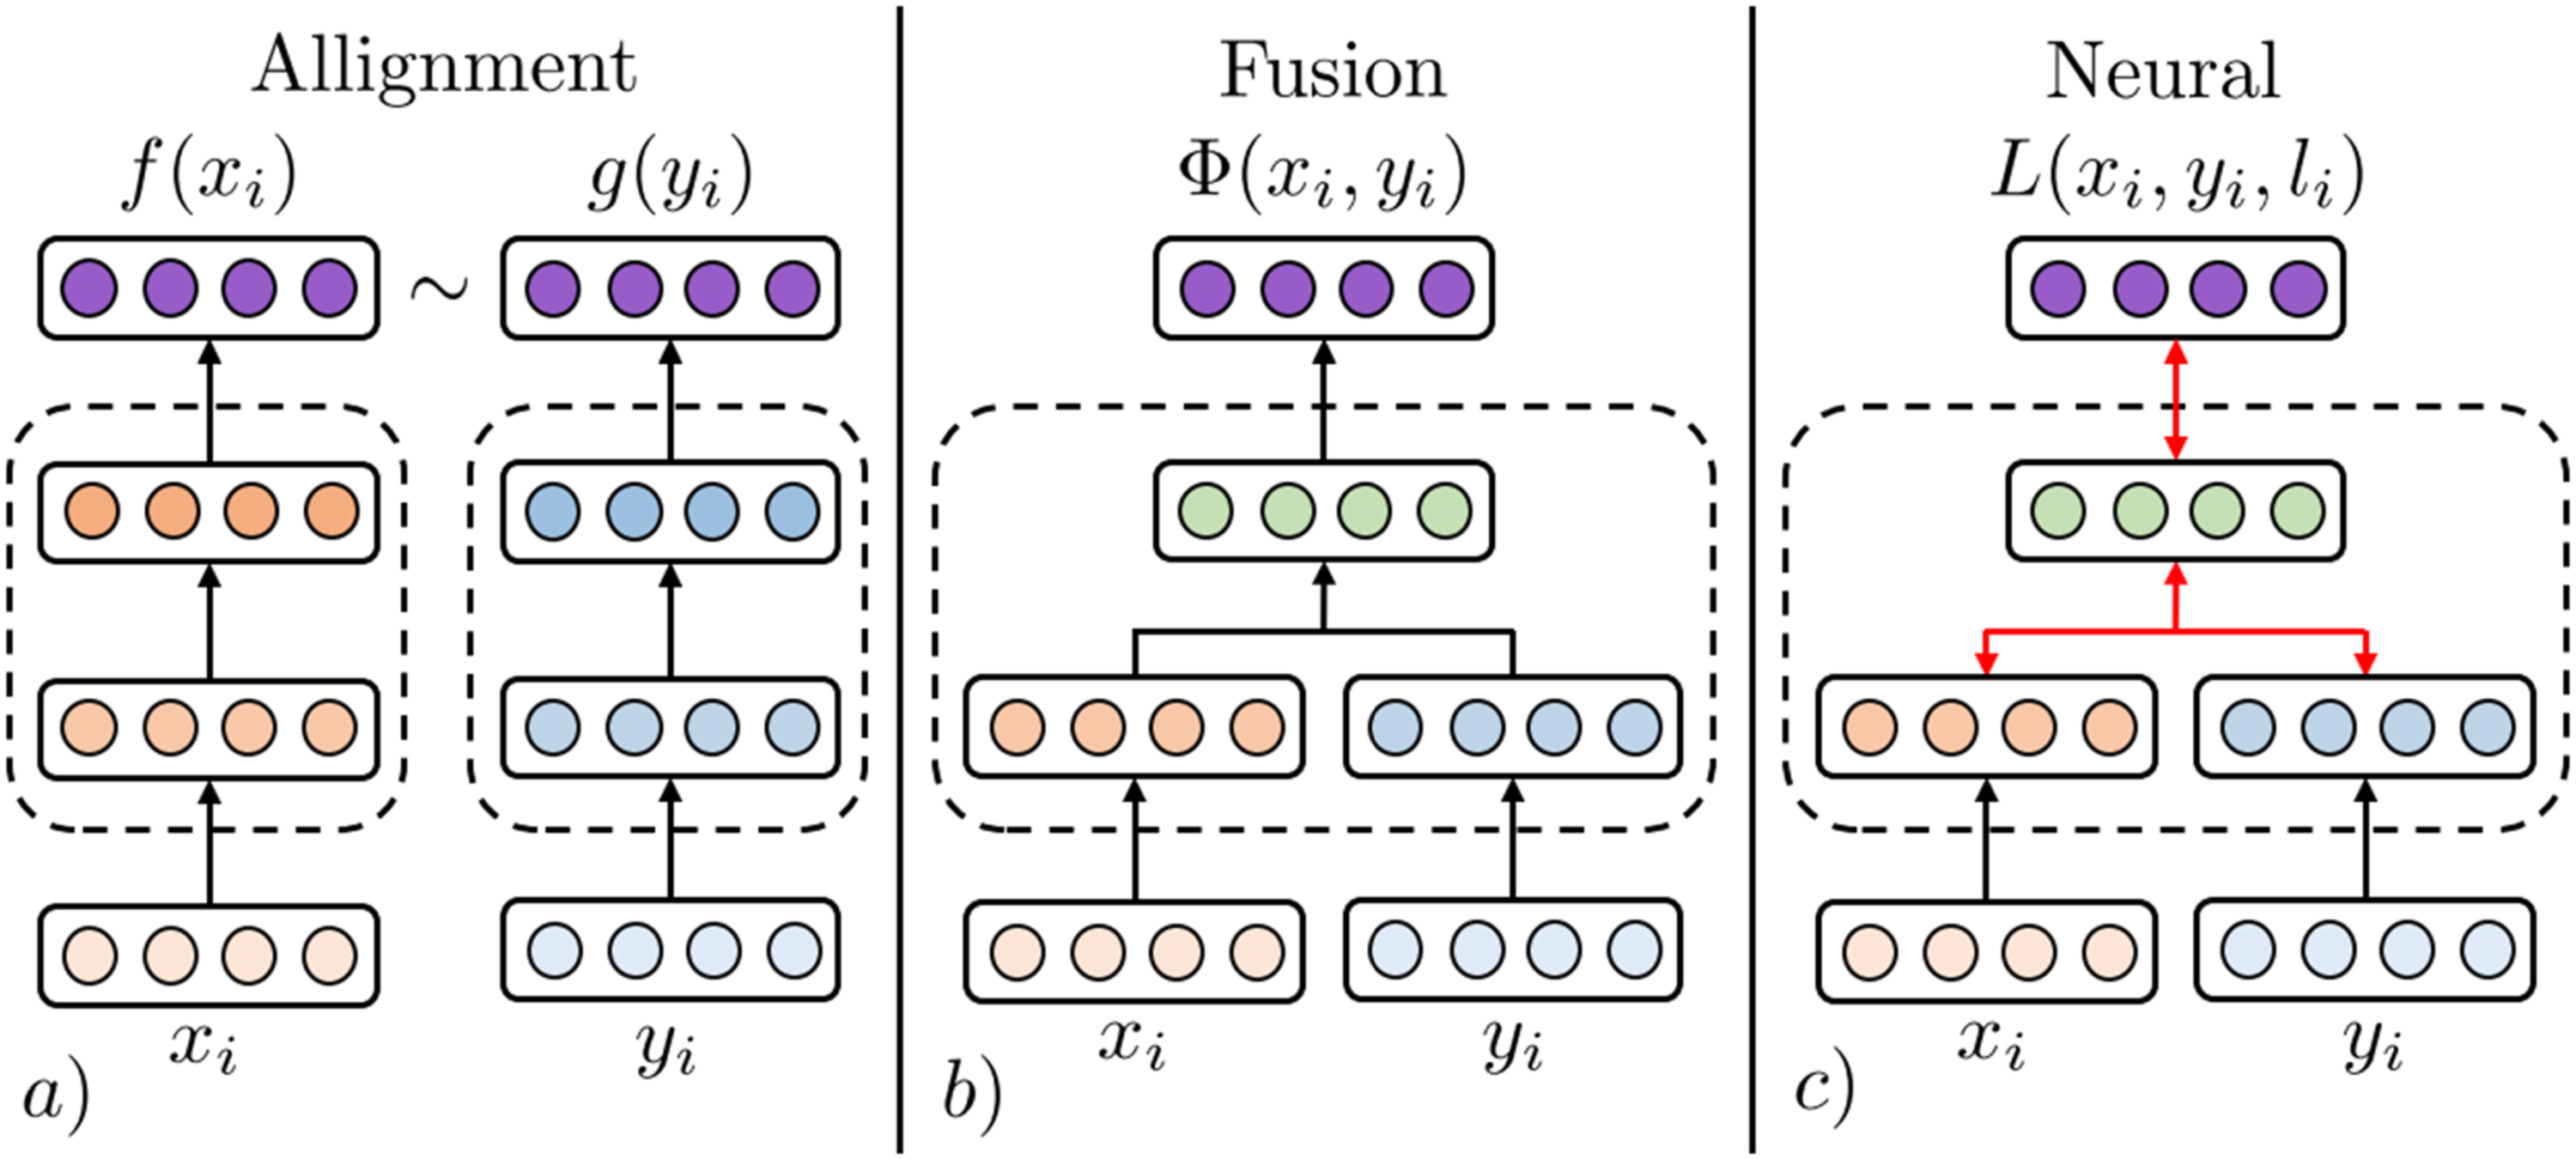
An illustration of fusion and coordination categories of MRL. The MRL step of Model 3 from Figure 2 can be substituted by techniques from all three categories of MRL.
Alignment MRL (AMRL)
AMRL learns a representation space in which uni-modal modalities
Similarity-aligned representation learning learns an aligned space between GSL technique of AMRL. (a) Modality samples 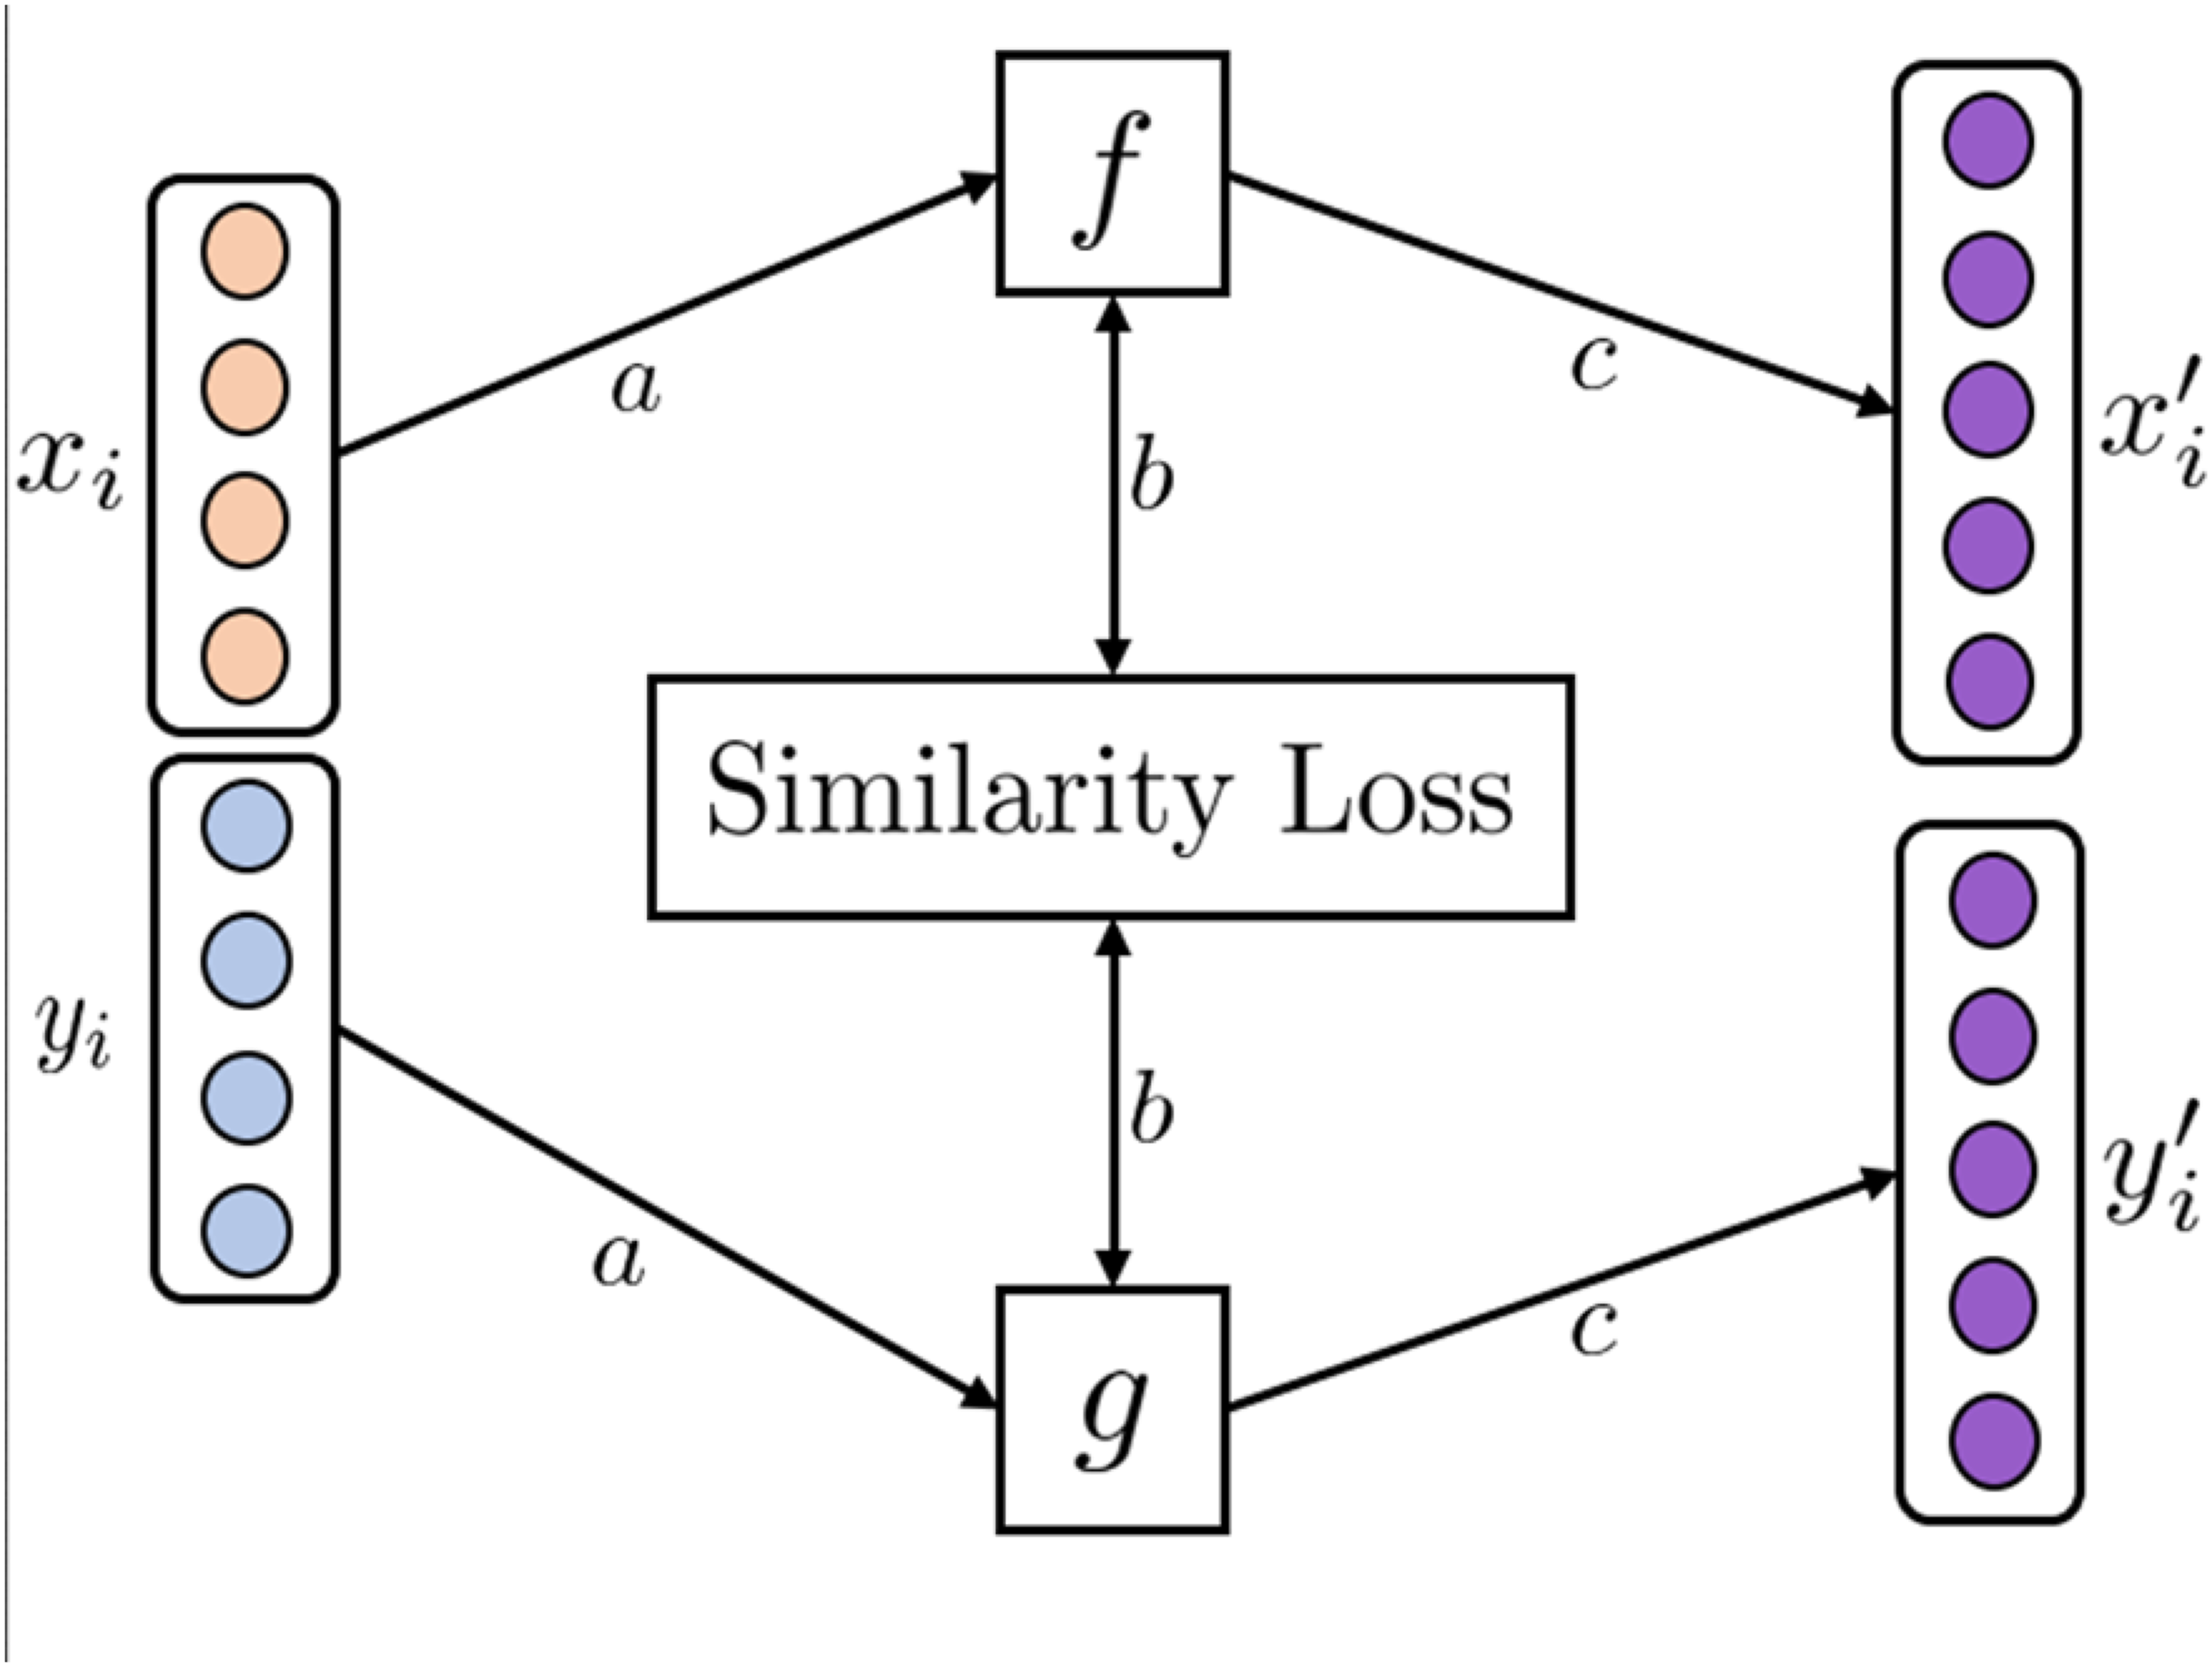
One of the earliest examples is general similarity learning (GSL). 17 GSL creates an aligned space between pairs of images and textual annotations by learning projection functions to map the modalities into a shared space using the weighted approximate-rank pairwise loss. In the resulting coordinated space, similar samples of images and textual annotations have a smaller cosine distance from each other.
Whereas GSL is limited by the choice of initial uni-modal embeddings, deep similarity learning (DSL)
18
jointly learns initial uni-modal feature representations and subsequent transformation matrices
Hence, the initial embeddings and subsequent aligned representation space can be jointly learned. Extensions of DSL include using different combinations of loss functions 19 and neural network architectures.
Correlation employs statistical methods for finding the correlation between two sets of variables. One of the most popular techniques is canonical correlation analysis (CCA). CCA was first introduced in 1936 by H. Hotelling. 20
Given two sets of variables CCA technique of AMRL. (a) CCA finds linear transformations, 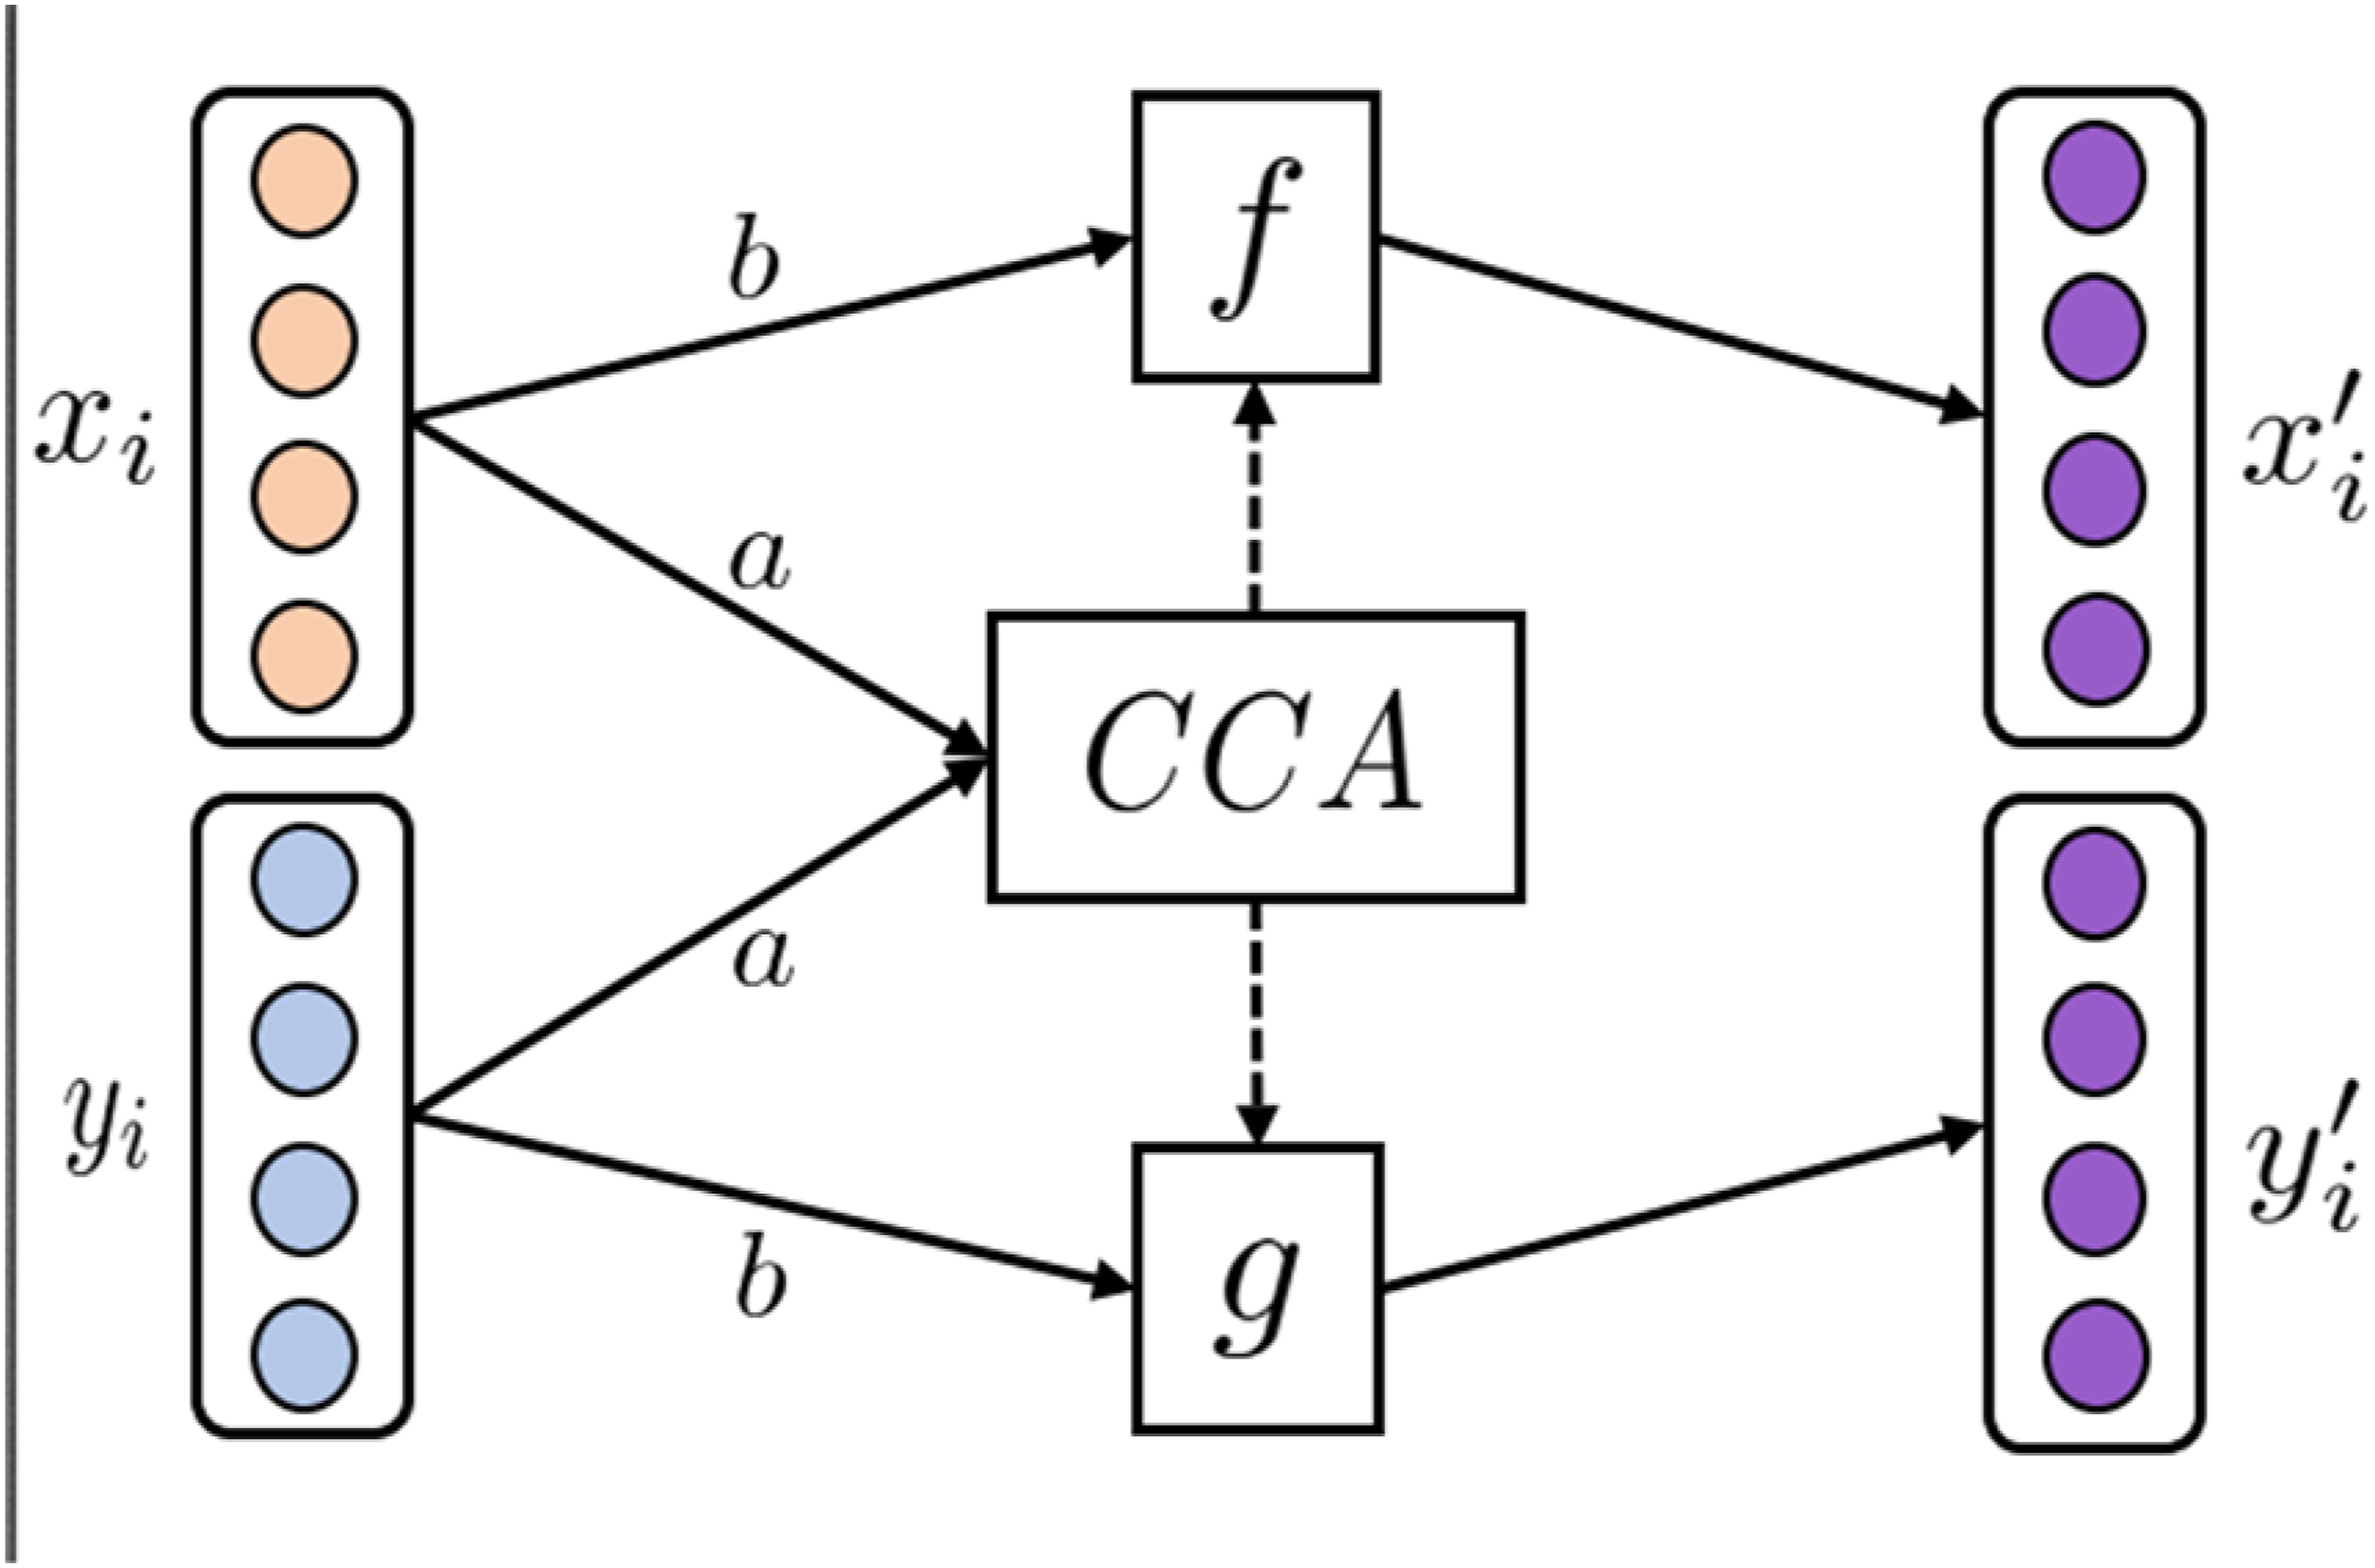
Various non-linear extensions to the classical CCA have been proposed, such as Deep CCA (DCCA) 21 using Fully Connected Neural Networks (FCNNs) for initial feature learning and Kernel CCA (KCCA) 22 utilizing kernels for non-linear feature transformation. Furthermore, extensions to multiple sets of variables have also been proposed, such as Multi CCA (MCCA), 23 which learns a shared space between multiple sets of variables. The many CCA variants are reviewed in ref. 24
Fusion MRL (FMRL)
Mathematically, FMRL can be formulated as
Joining combines modalities by concatenating early, intermediate, or late modality-specific features. Early Joining (EJ)
25
combines modality features using concatenation functions before any data transformations have been applied to individual modalities (Figure 6(a)). While EJ is simple and efficient in combining multimodal data, problems arise when modalities have varying sampling rates. For example, when combining MRI images and EEG signals. To alleviate such problems, Intermediate Joining can be used, where uni-modalities are transformed before latent features are concatenated (Figure 6(b)); however, manual engineering of modality-specific feature transformations is time-consuming and requires extensive domain knowledge. Joining MRL techniques. (a) Illustrates EJ FMRL. Features of uni-modal samples 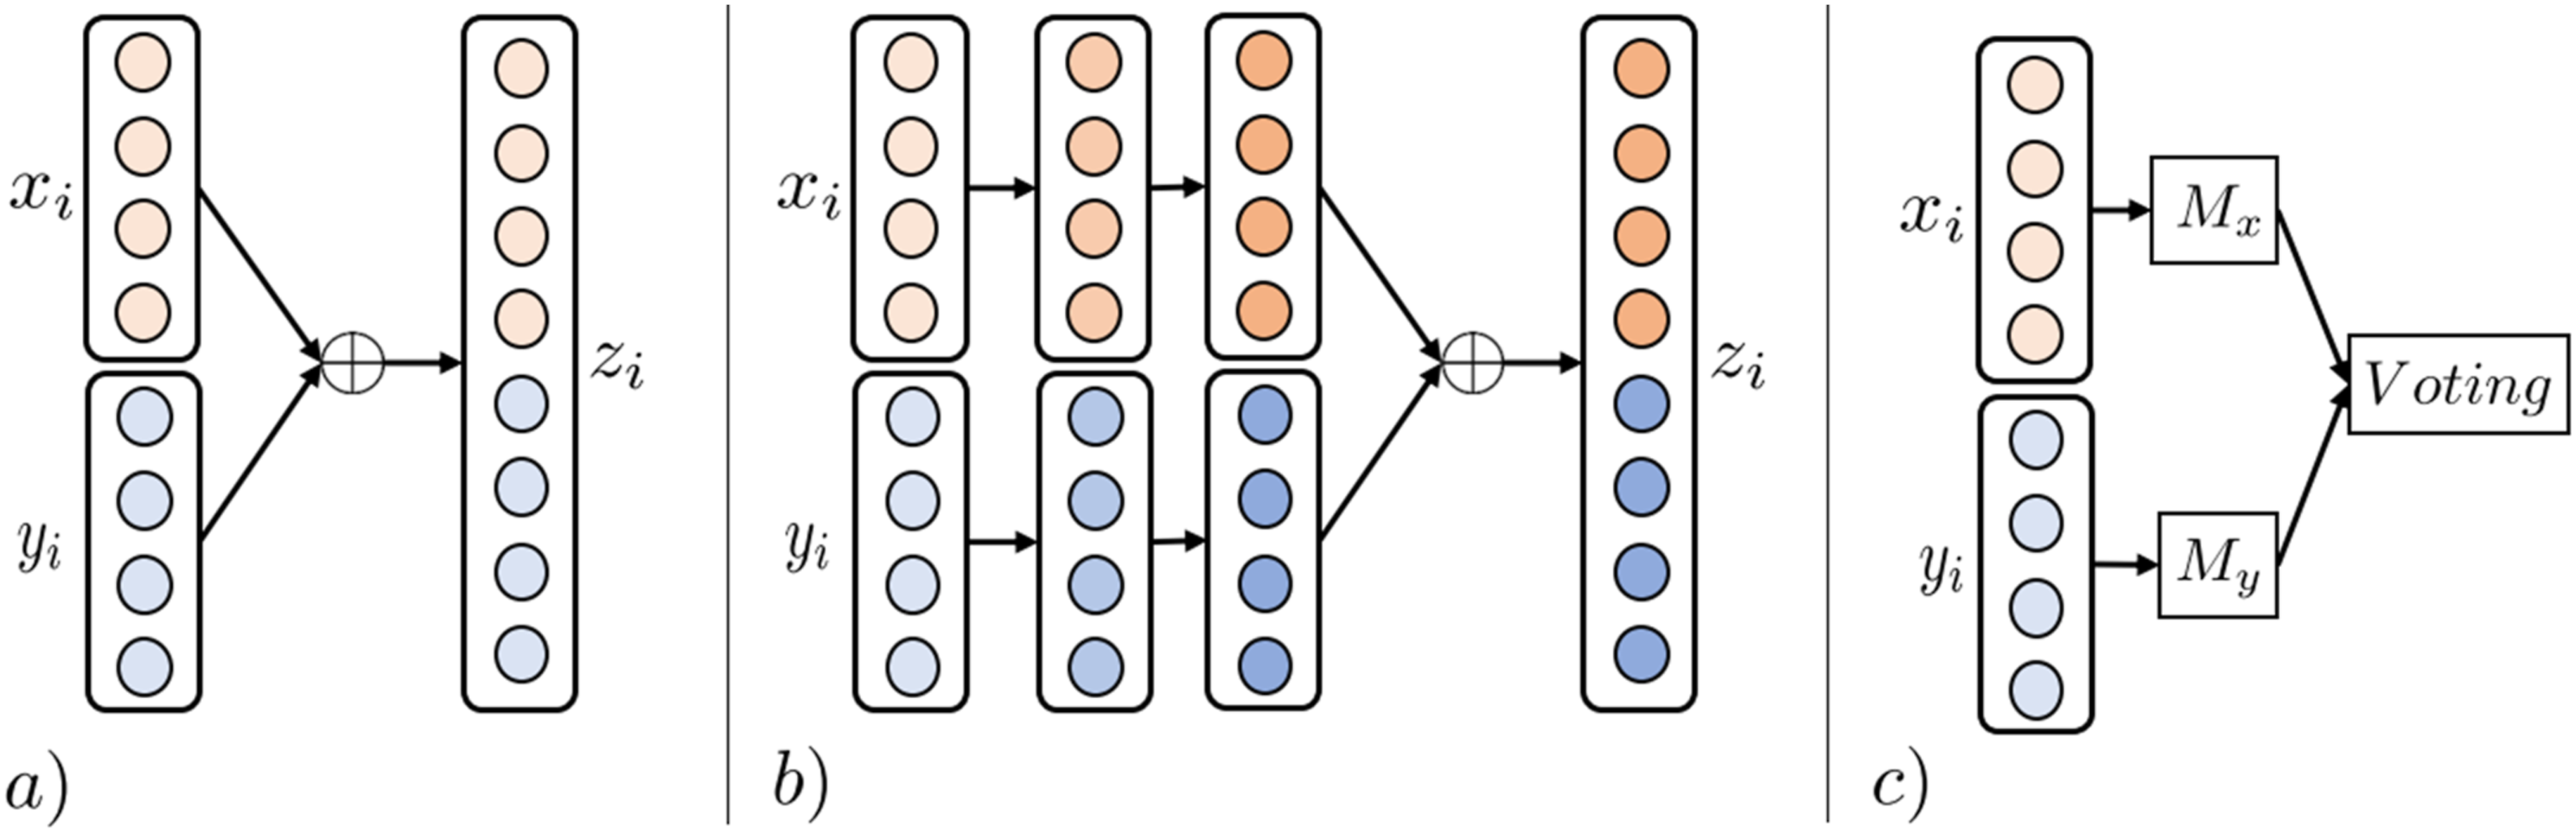
Decision Joining (DJ) combines the results of multiple uni-modal analytics, either by majority vote, weighted linear combinations, or more complex techniques (Figure 6(c)). DJ is sometimes preferred in tasks involving low-correlated modalities as the technique is modality-independent, and errors from individual analytics tend to be uncorrelated. 11
Kernels project linearly inseparable data into higher dimensional but linearly separable representation spaces using a non-linear kernel transformation. Multiple Kernel Learning (MKL) is a sub-type utilizing multiple such kernels. Well-known kernel techniques include support vector machines, the kernel-fisher discriminant, and regularized AdaBoost 26 ). Multimodal representation learning can be achieved by linear, non-linear, or weighted combinations of the resulting modality-specific kernel transformations.
Graphical Models are a class of probabilistic ML techniques used to discover latent factors explaining the data distribution. Among the most common graphical models for MRL is the multimodal deep Boltzmann machine (MDBM). 27 An MDBM stacks layers of fully connected restricted Boltzmann machines to form a multi-layer network structure for each modality, which are subsequently joined by an output layer.
Neural MRL (NMRL)
Neural Architectures aim to learn to join representation spaces for multimodal data in supervised, semi-supervised, or unsupervised ways. An idea shared among all architectures is learning layers of non-linear transformations for fusing uni-modal representations into a multimodal representation space guided by optimizing a loss function. 28 The basis of neural network architectures is the perceptron. The perceptron contains a learnable transformation matrix to linearly transform incoming data modalities into a new representation space, subsequently exercising non-linearity by applying an activation function such as sigmoid.
Concatenation (Concat) is the most straightforward neural architecture for multimodal data fusion.
28
Multiple layers of fully connected perceptrons are used to ultimately fuse uni-modal representations in either early, intermediate, or late layers of the network structure (Figure 7(a)). In ref,
29
a fully connected neural network structure predicts patient diagnosis codes by concatenating patient medication prescription history with demographic information. Neural MRL techniques 1. (a) Illustrates the Concat technique of NMRL. Uni-modalities are fused by layers of non-linear transformations between input modalities 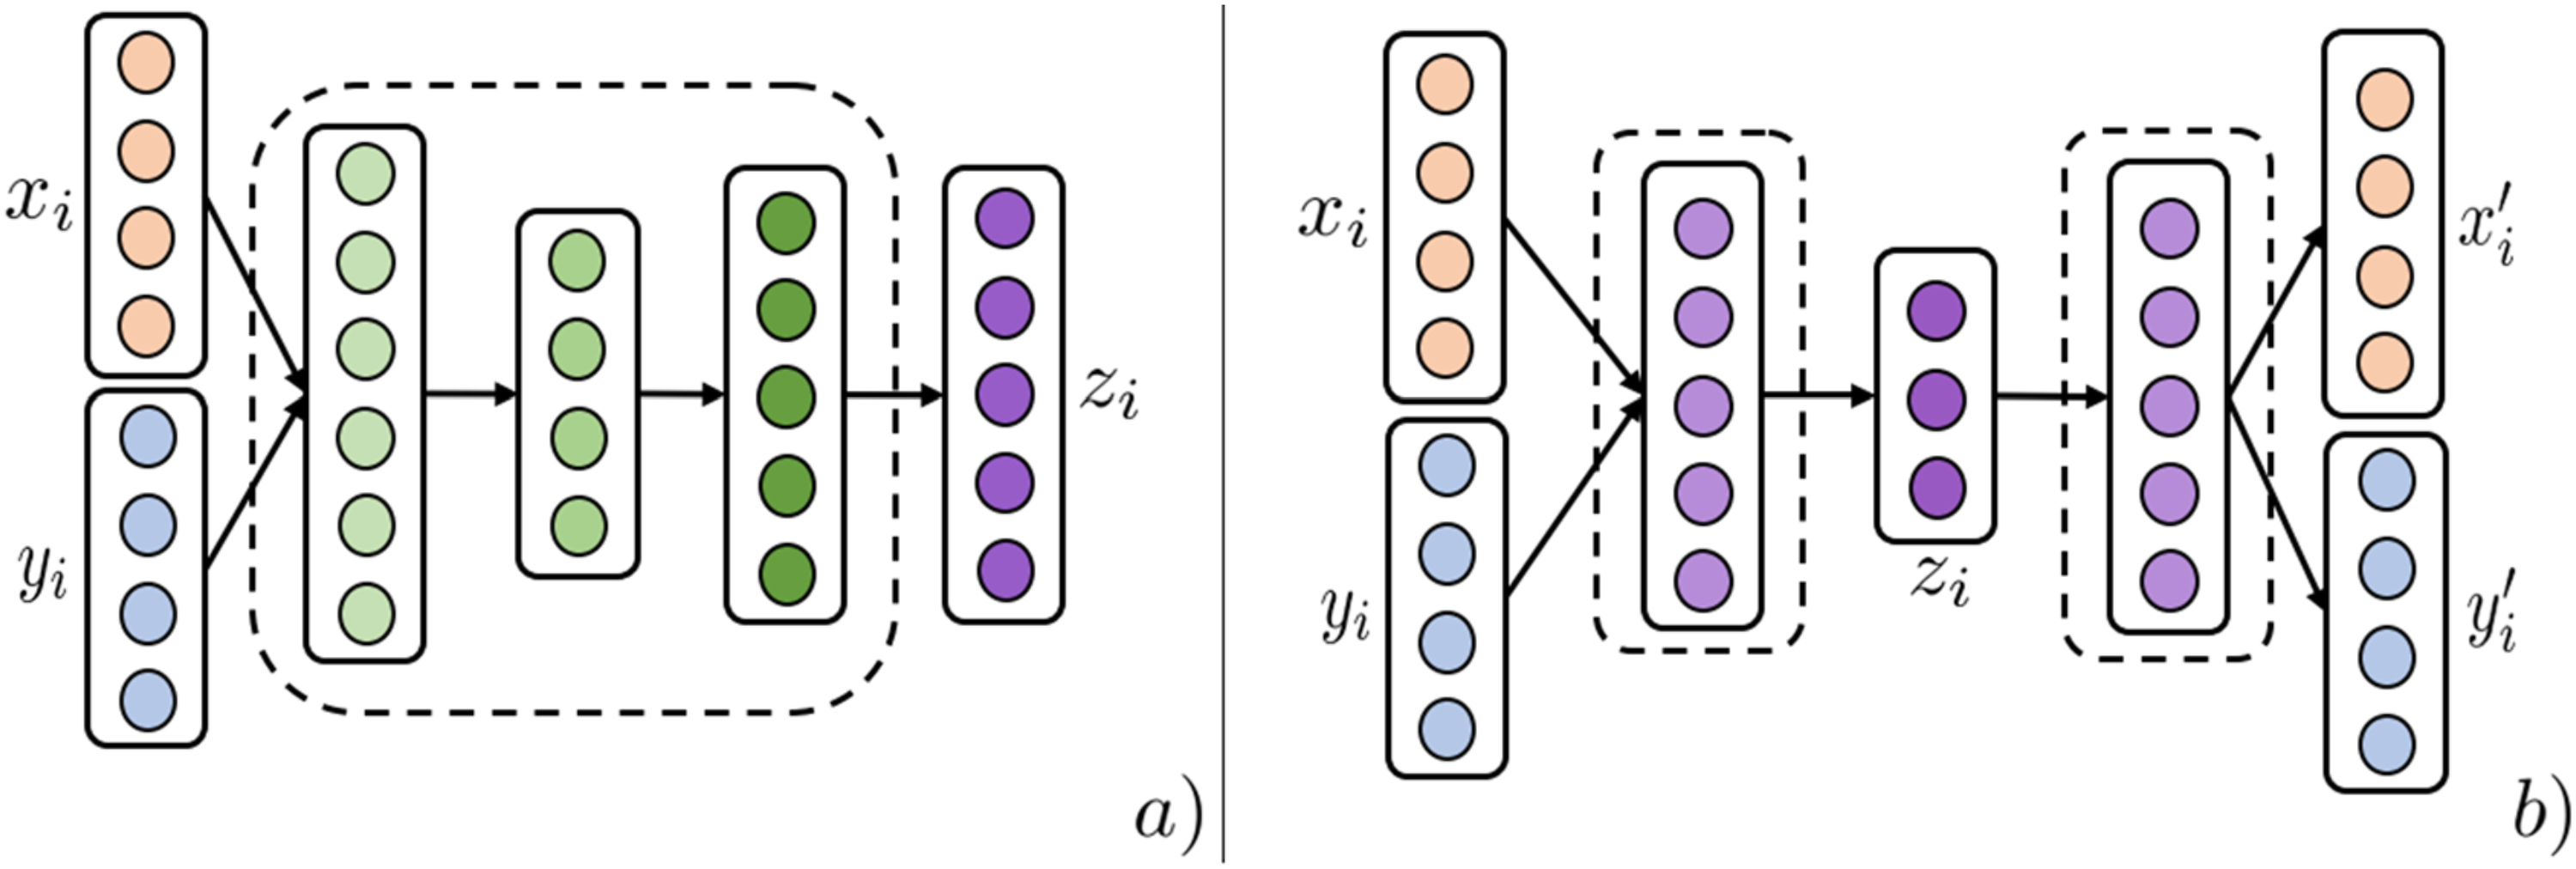
An Auto Encoder (AE) is an unsupervised architecture that utilizes a reconstruction loss to learn low-dimensional entity representations that capture most of the original modality information.
30
Multimodal AE architectures have three stages (Figure 7(b)). Modality-specific networks transforming uni-modal modalities are initiated and then joined by an intermediary layer that acts as the fused modality representation. The last stage splits the intermediary layer into uni-modal networks trained on a reconstruction loss between the final representations
A Convolutional Neural Network (CNN) is a technique for learning representations of imaging modalities. Due to the essential domain-specific information that images contain, CNNs are often used to learn low-dimensional image representations in end-to-end architectures (Figure 8). CNNs apply layers of convolution matrices and pooling operations to condense images to their essential discriminative features. Due to their properties, they are often used as an intermediary step of imaging processing with subsequent fully connected layers fusing uni-modal entities.
8
Illustration of the NMRL CNN technique. (a) A 3 × 3 convolution matrix with shared weights (as indicated by dotted blue lines) slide over the two input modalities 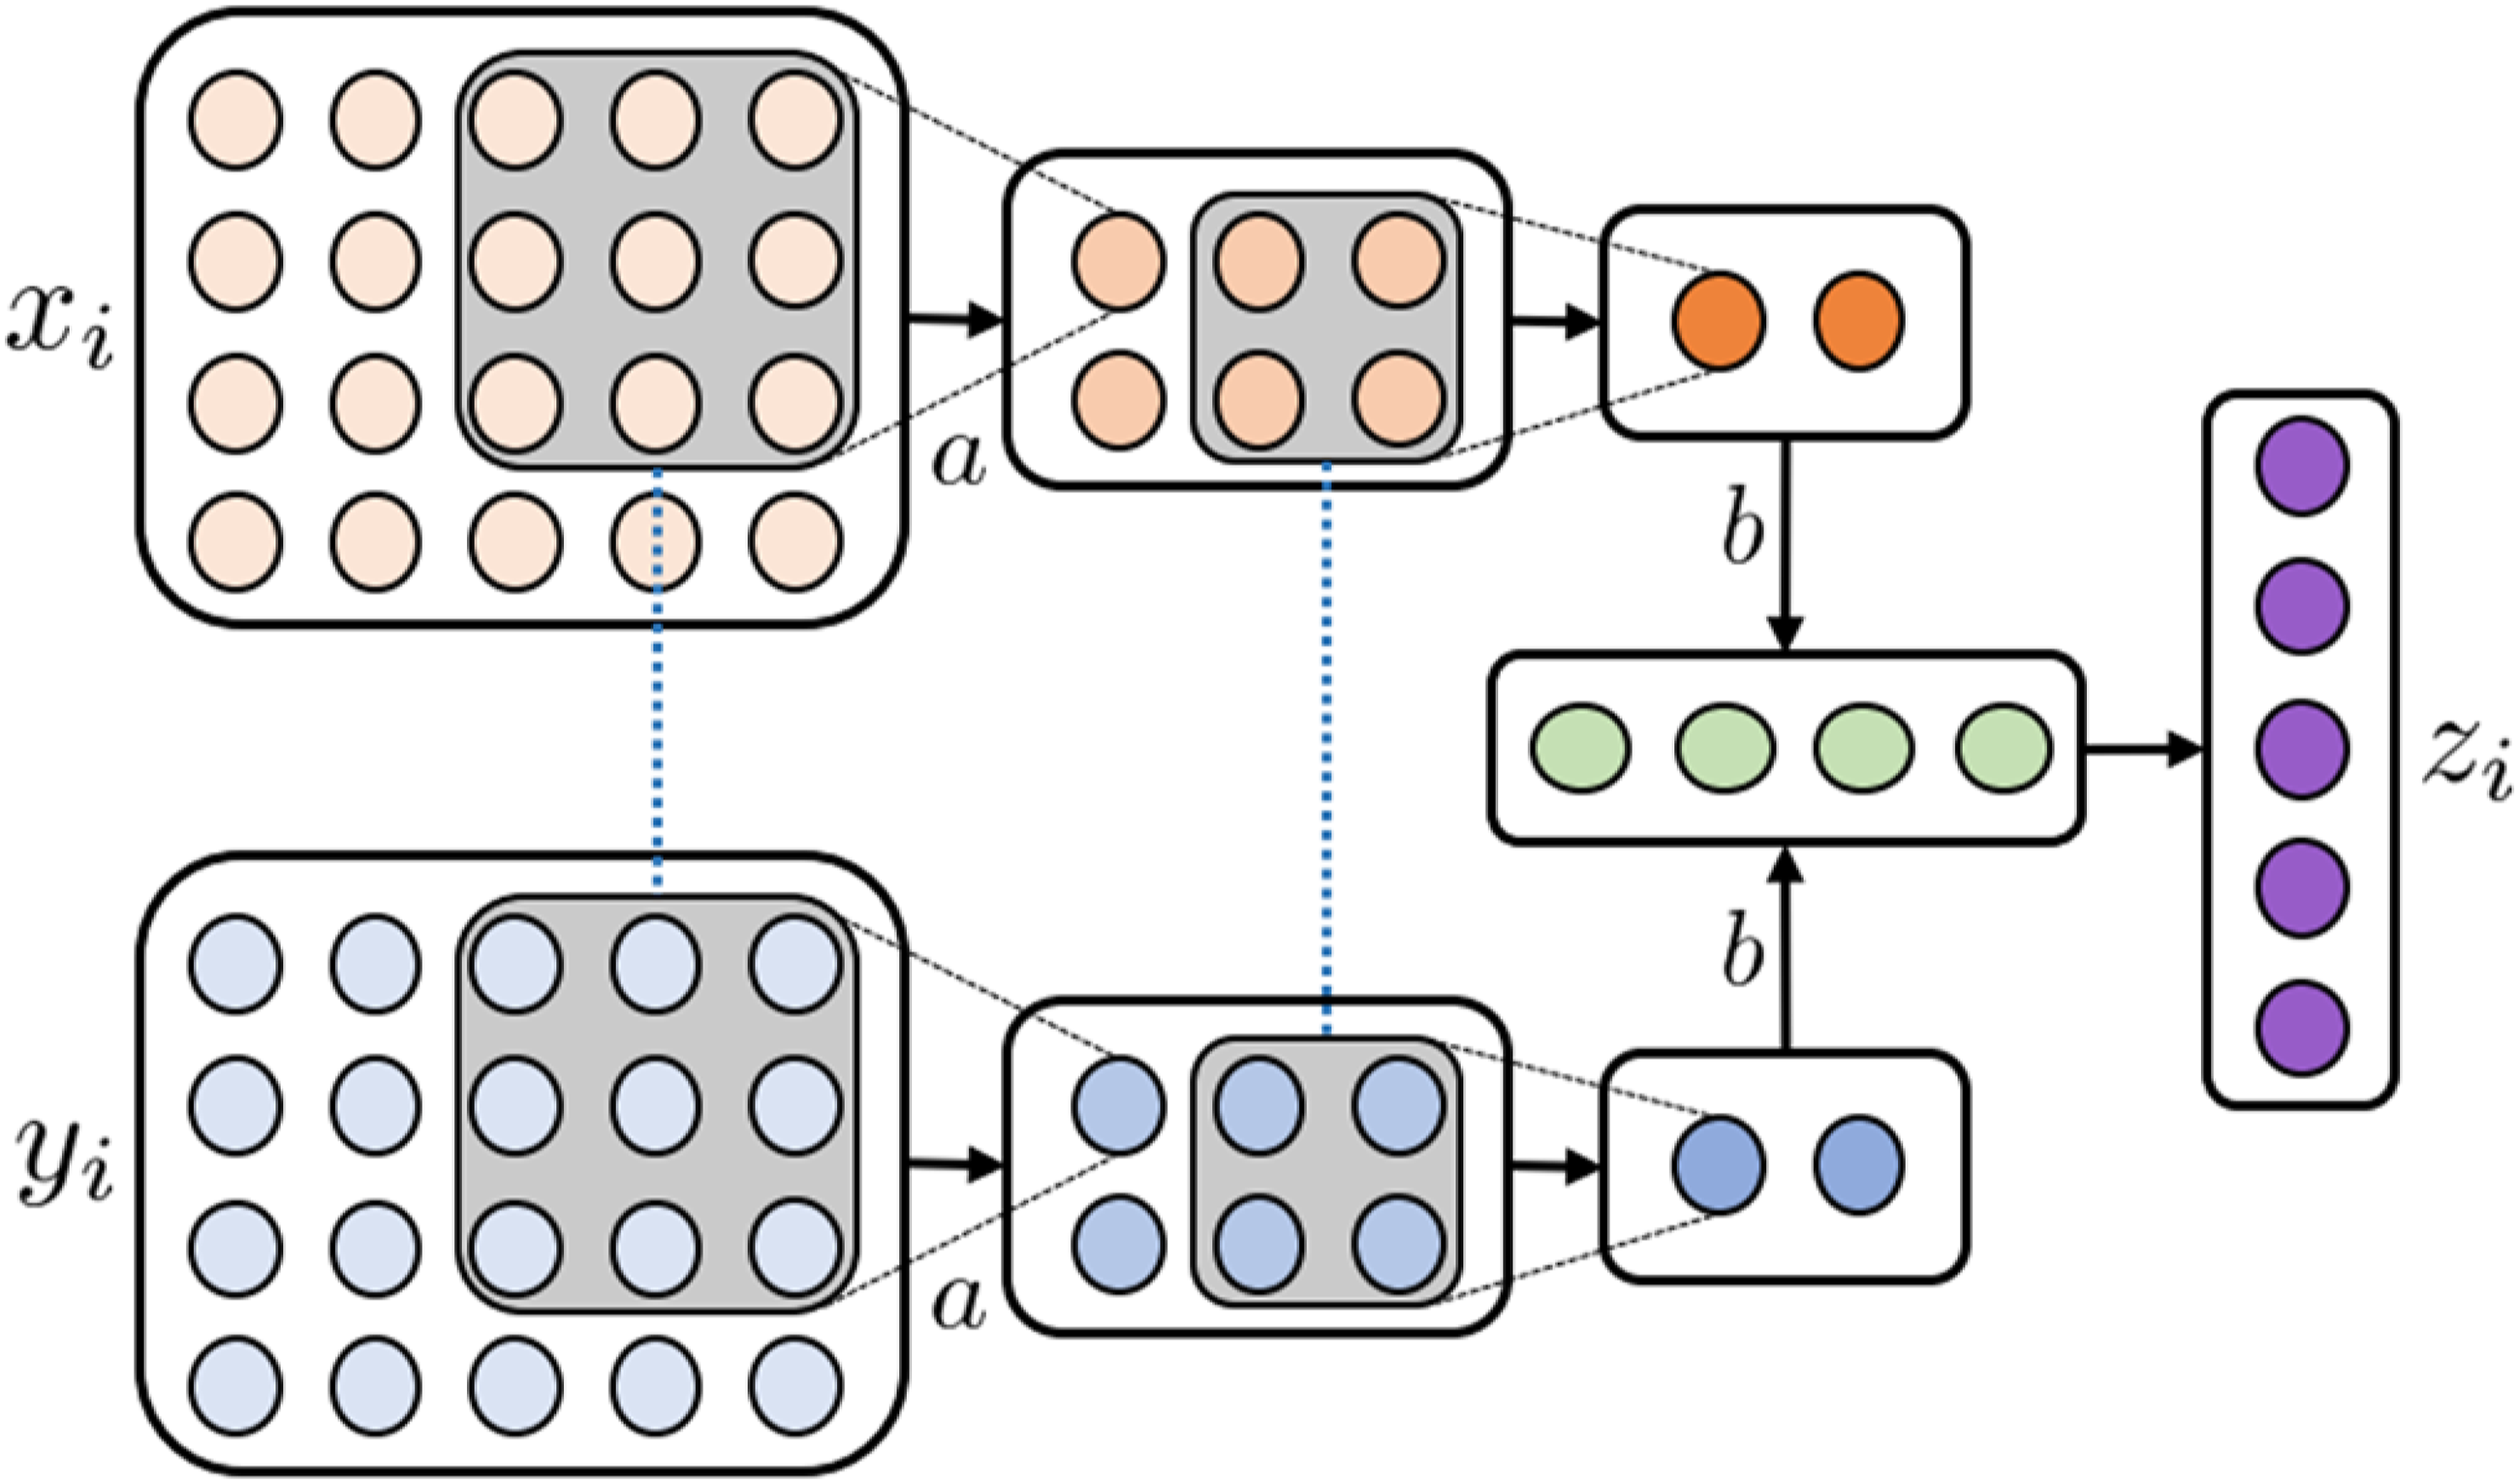
Transformers (TF) specialize in learning to represent sequence data. Utilizing a powerful component called self-attention, the model learns the relationships between different parts of the input sequence. This allows the model to attend to specific parts of the input sequence while learning a latent representation for each part of the sequence. This technique can be extended to multimodal networks by using the learned self-attention weights from one modality in the self-attention mechanism of other modalities. In ref, 31 skin lesion diagnosis is performed using an end-to-end transformer neural network to learn a latent representation between images and clinical features. In ref, 32 hospitalization length of stay was predicted based on the first 24 h of observations modelled as event sequences, effectively combining multiple clinical modalities into the same model.
Review methodology
A systematic search was done using the PubMed search engine
5
, searching for MRL articles targeting medical analytics tasks while following the PRISMA guidelines
33
for structured surveys, as summarized in Figure 9. Our search terms were (“joint” OR “fusion” OR “coordinated” OR “alignment”) AND (“multimodal” OR “multi-view”) AND (“machine learning” OR “deep learning” OR “representation learning”) and (“different modalities” OR “multiple modalities”) AND (“machine learning” OR “deep learning” OR “representation learning”). Studies were excluded on criteria as summarized in the screening and eligibility steps of the PRISMA guidelines (Figure 9), excluding inaccessible records, papers that did not employ MRL or did not attempt to perform a medical analytic task, and survey papers. Eventually, 146 eligible publications were identified. Since the nature of this paper is a literature review, it is not registered in a medical review registry. PRISMA flow chart for reporting systematic reviews.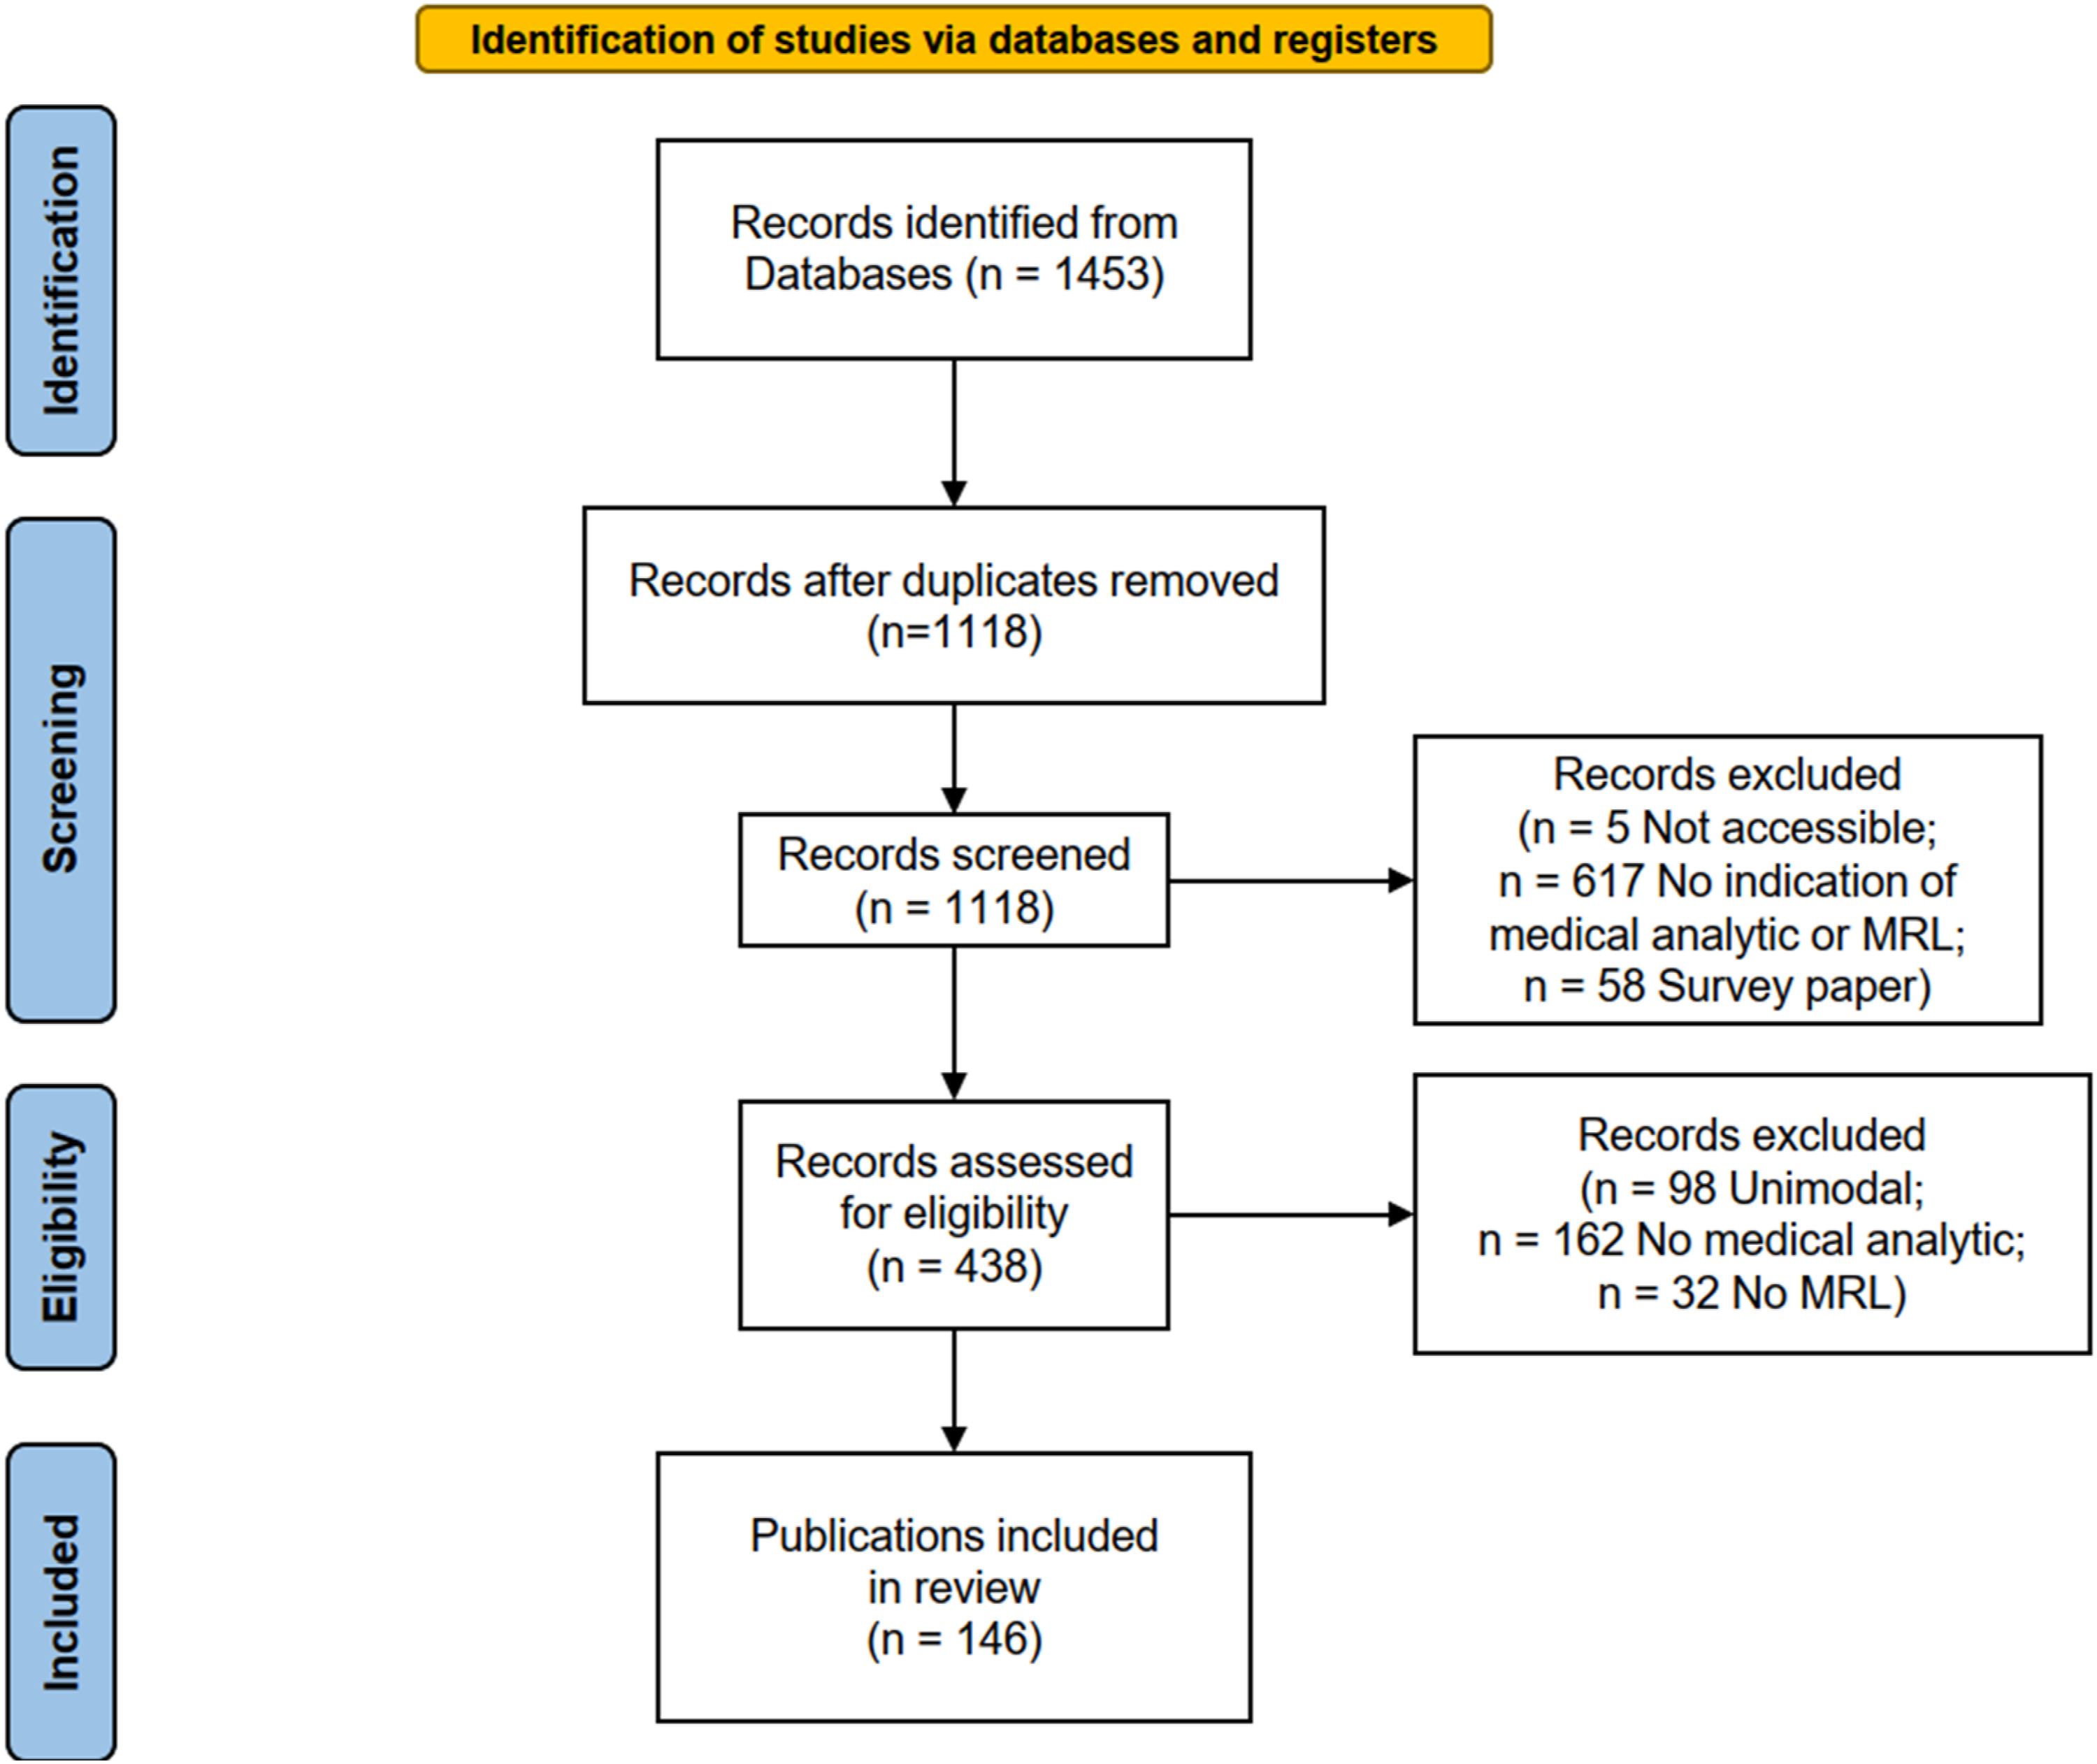
The analysis employs four dimensions, Utility, Medical, Modality, and MRL, to better structure the analysis and put the many surveyed papers into a medical and algorithmic context. The utility dimension characterizes the analytic utility or purpose of the developed model. The medical dimension uses the ICD-10
34
diagnosis classification hierarchy to describe the analytics task’s medical domain. The modality dimension uses our medical information modality hierarchy as introduced above. The MRL dimension (Figure 10) describes the MRL technique employed. Our primary measure of interest is the number of papers in a specific intersection of dimension values, such as how many papers have used joining MRL for combining structured patient data and MRI. A single reviewer (one of the authors) performed the entire review, consulting the other authors on reviewed papers they deemed difficult to classify. The authors decided the inclusion and exclusion criteria jointly based on the pilot survey examples. Classification space of reviewed MRL techniques used in medical analytics.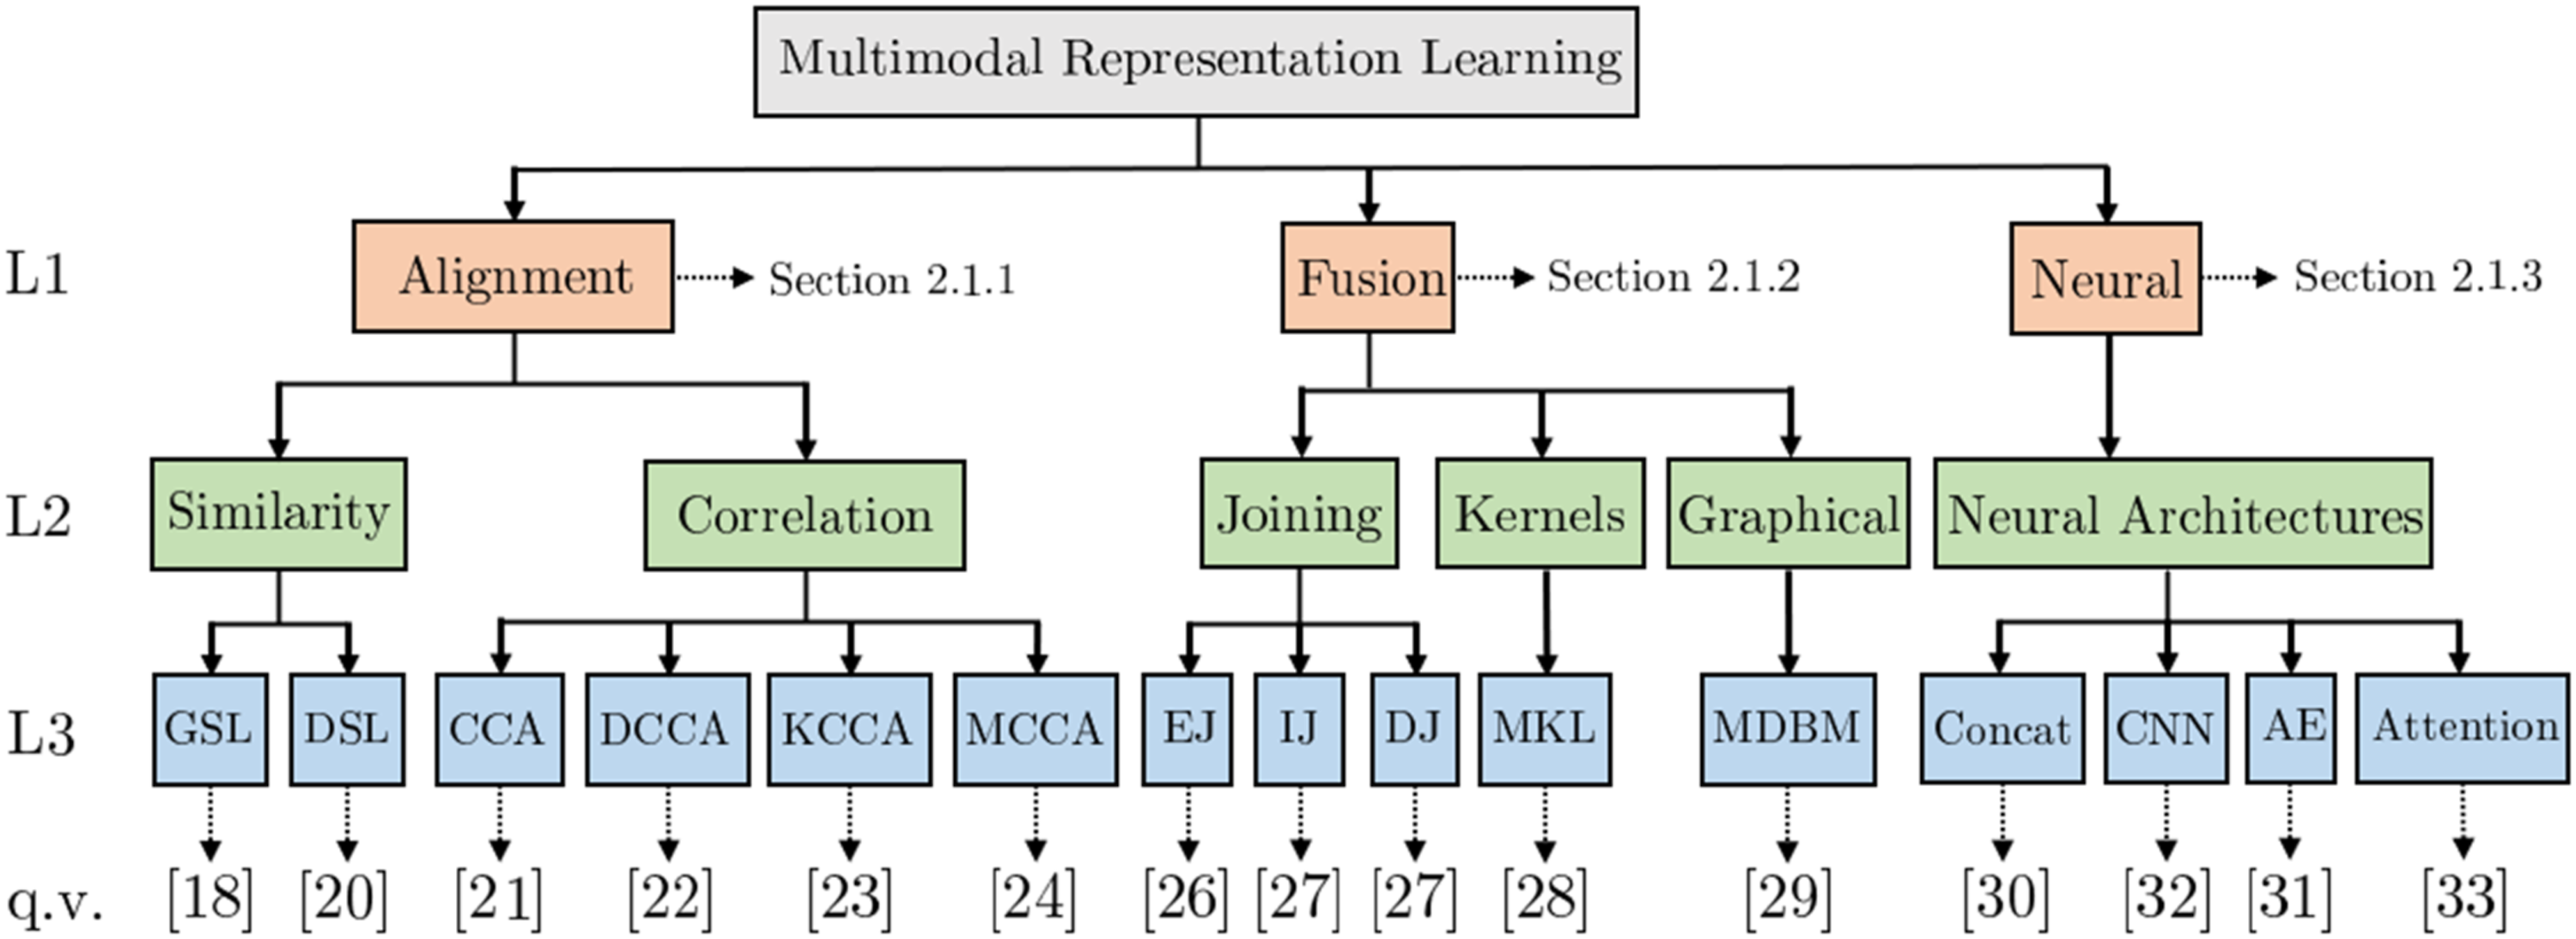
Based on the structured survey and our four classification dimensions, an explorable online analysis tool is provided together with this work as an electronic supplement. 6 The analysis was compiled on the Tableau public platform and shared using the same platform as an online tool. The tool can be used to investigate the publications included in this review on our four classification dimensions and provide visual representations of findings.
Results
In this section, the findings are presented. The first section explores the pairs of modalities observed. We then examine the prevalence of MRL techniques in disparate medical fields and for different modality types. The last section examines the results from the perspective of medical analytics tasks.
Modality pairings
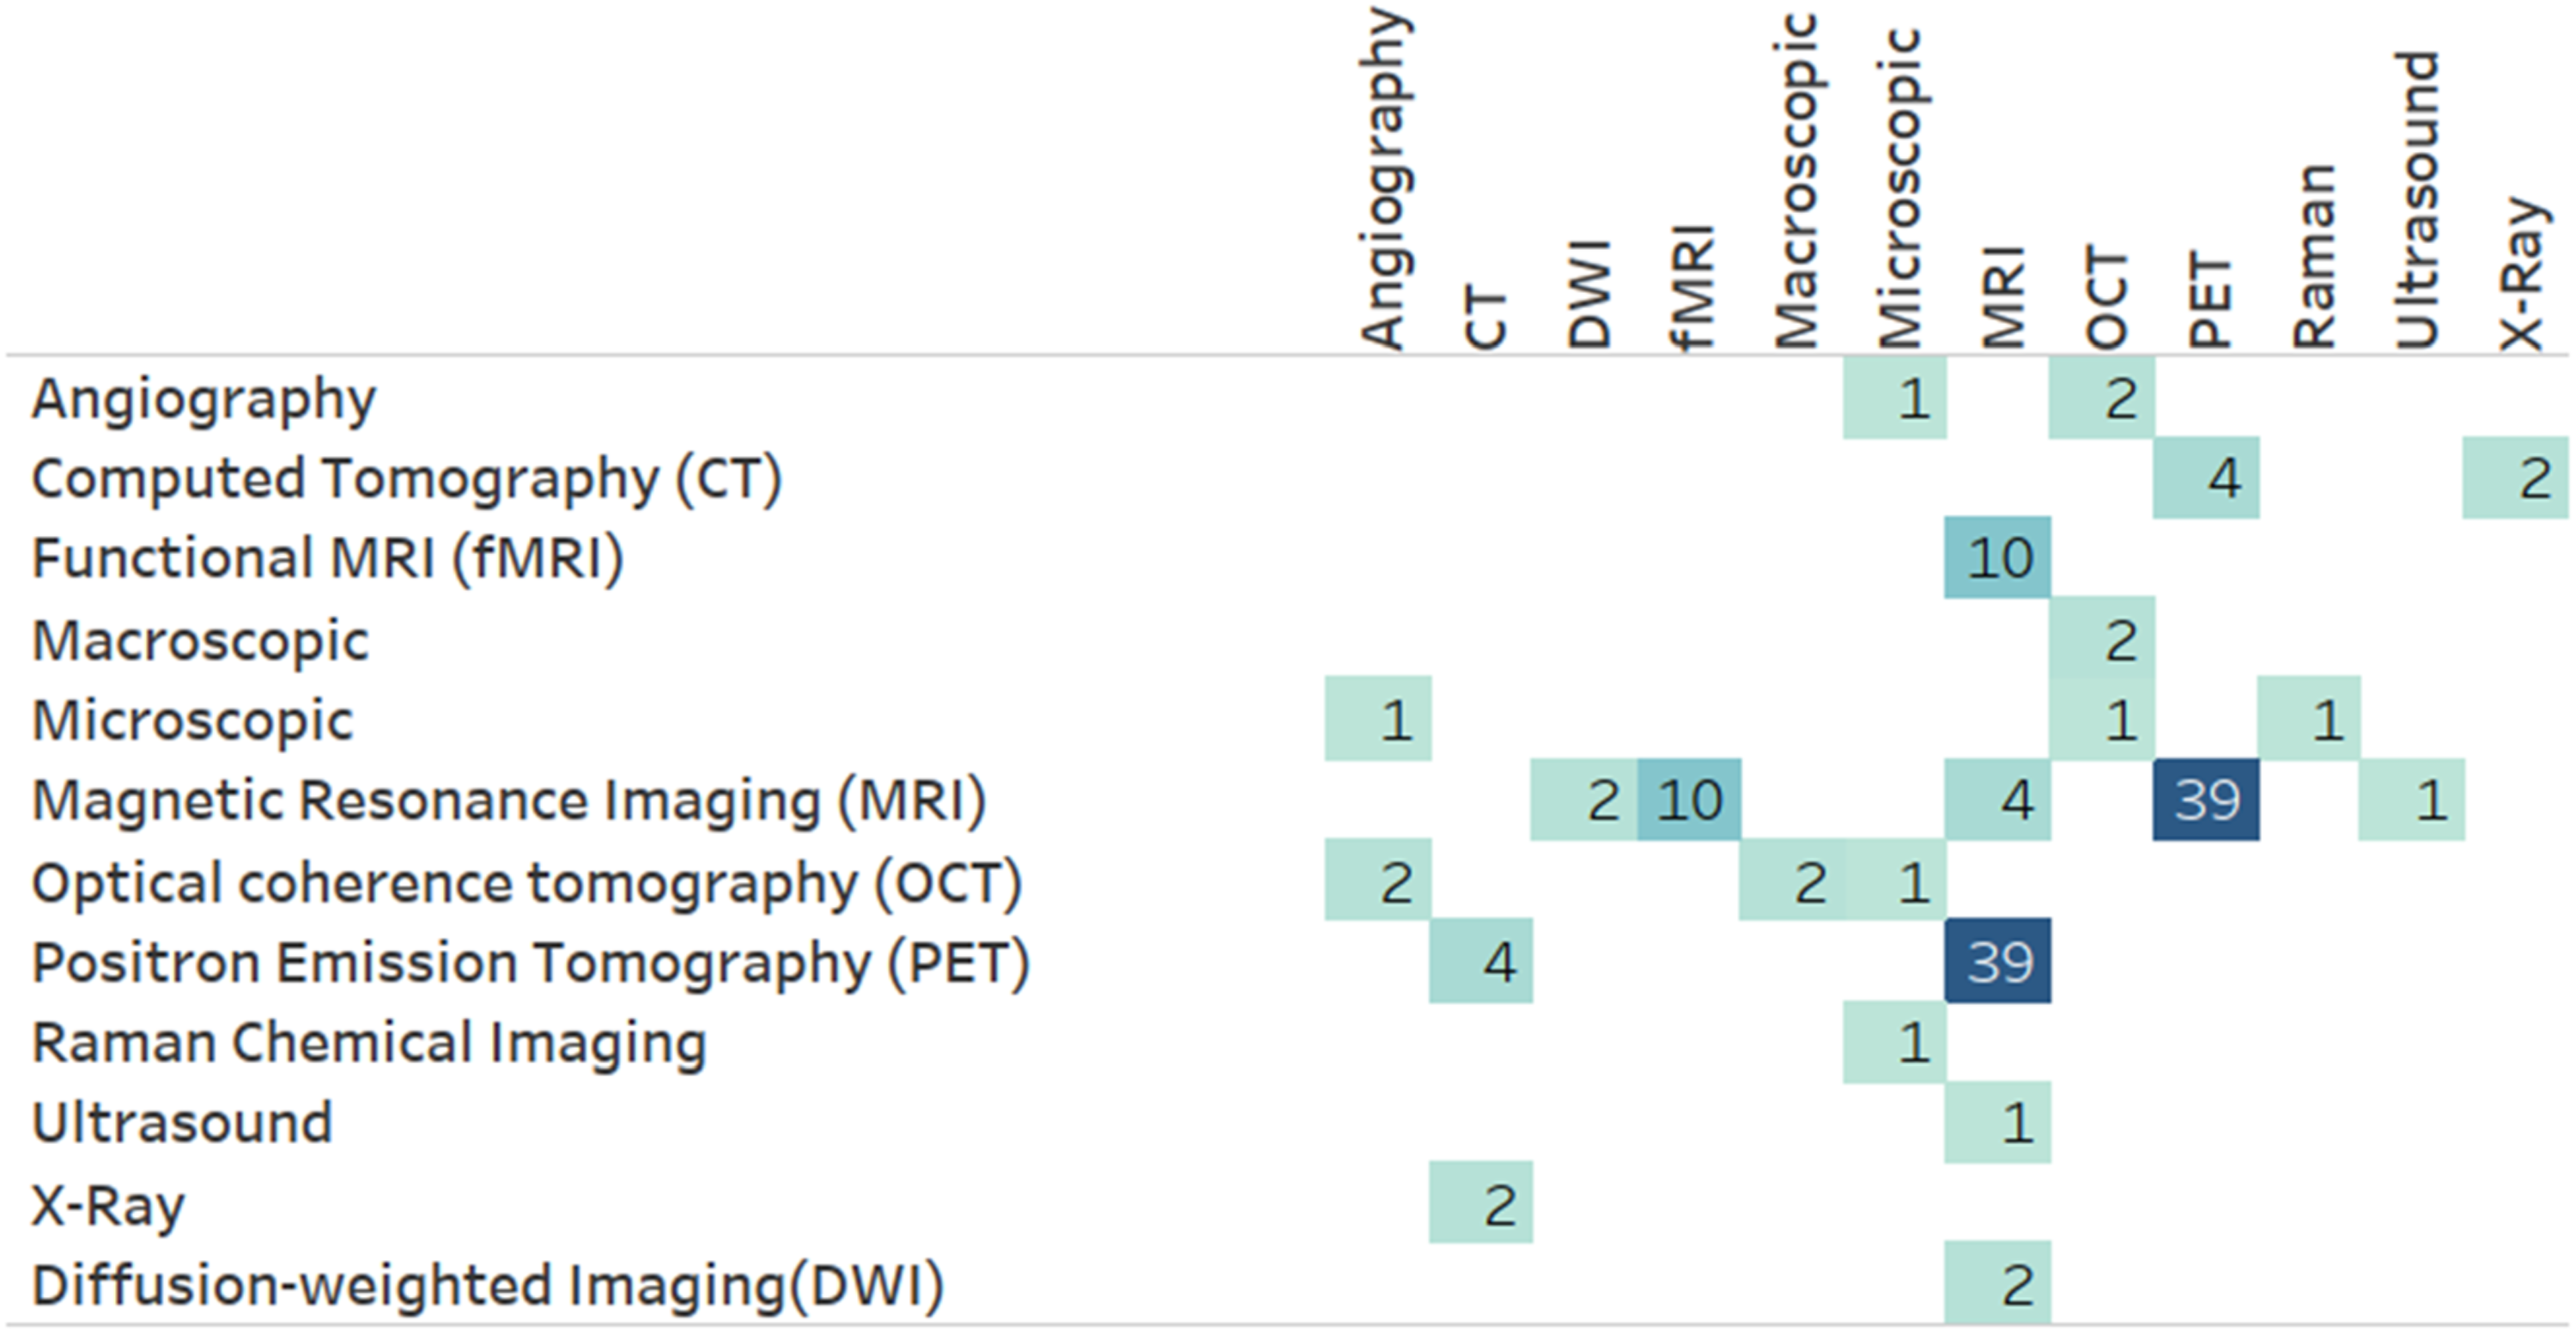
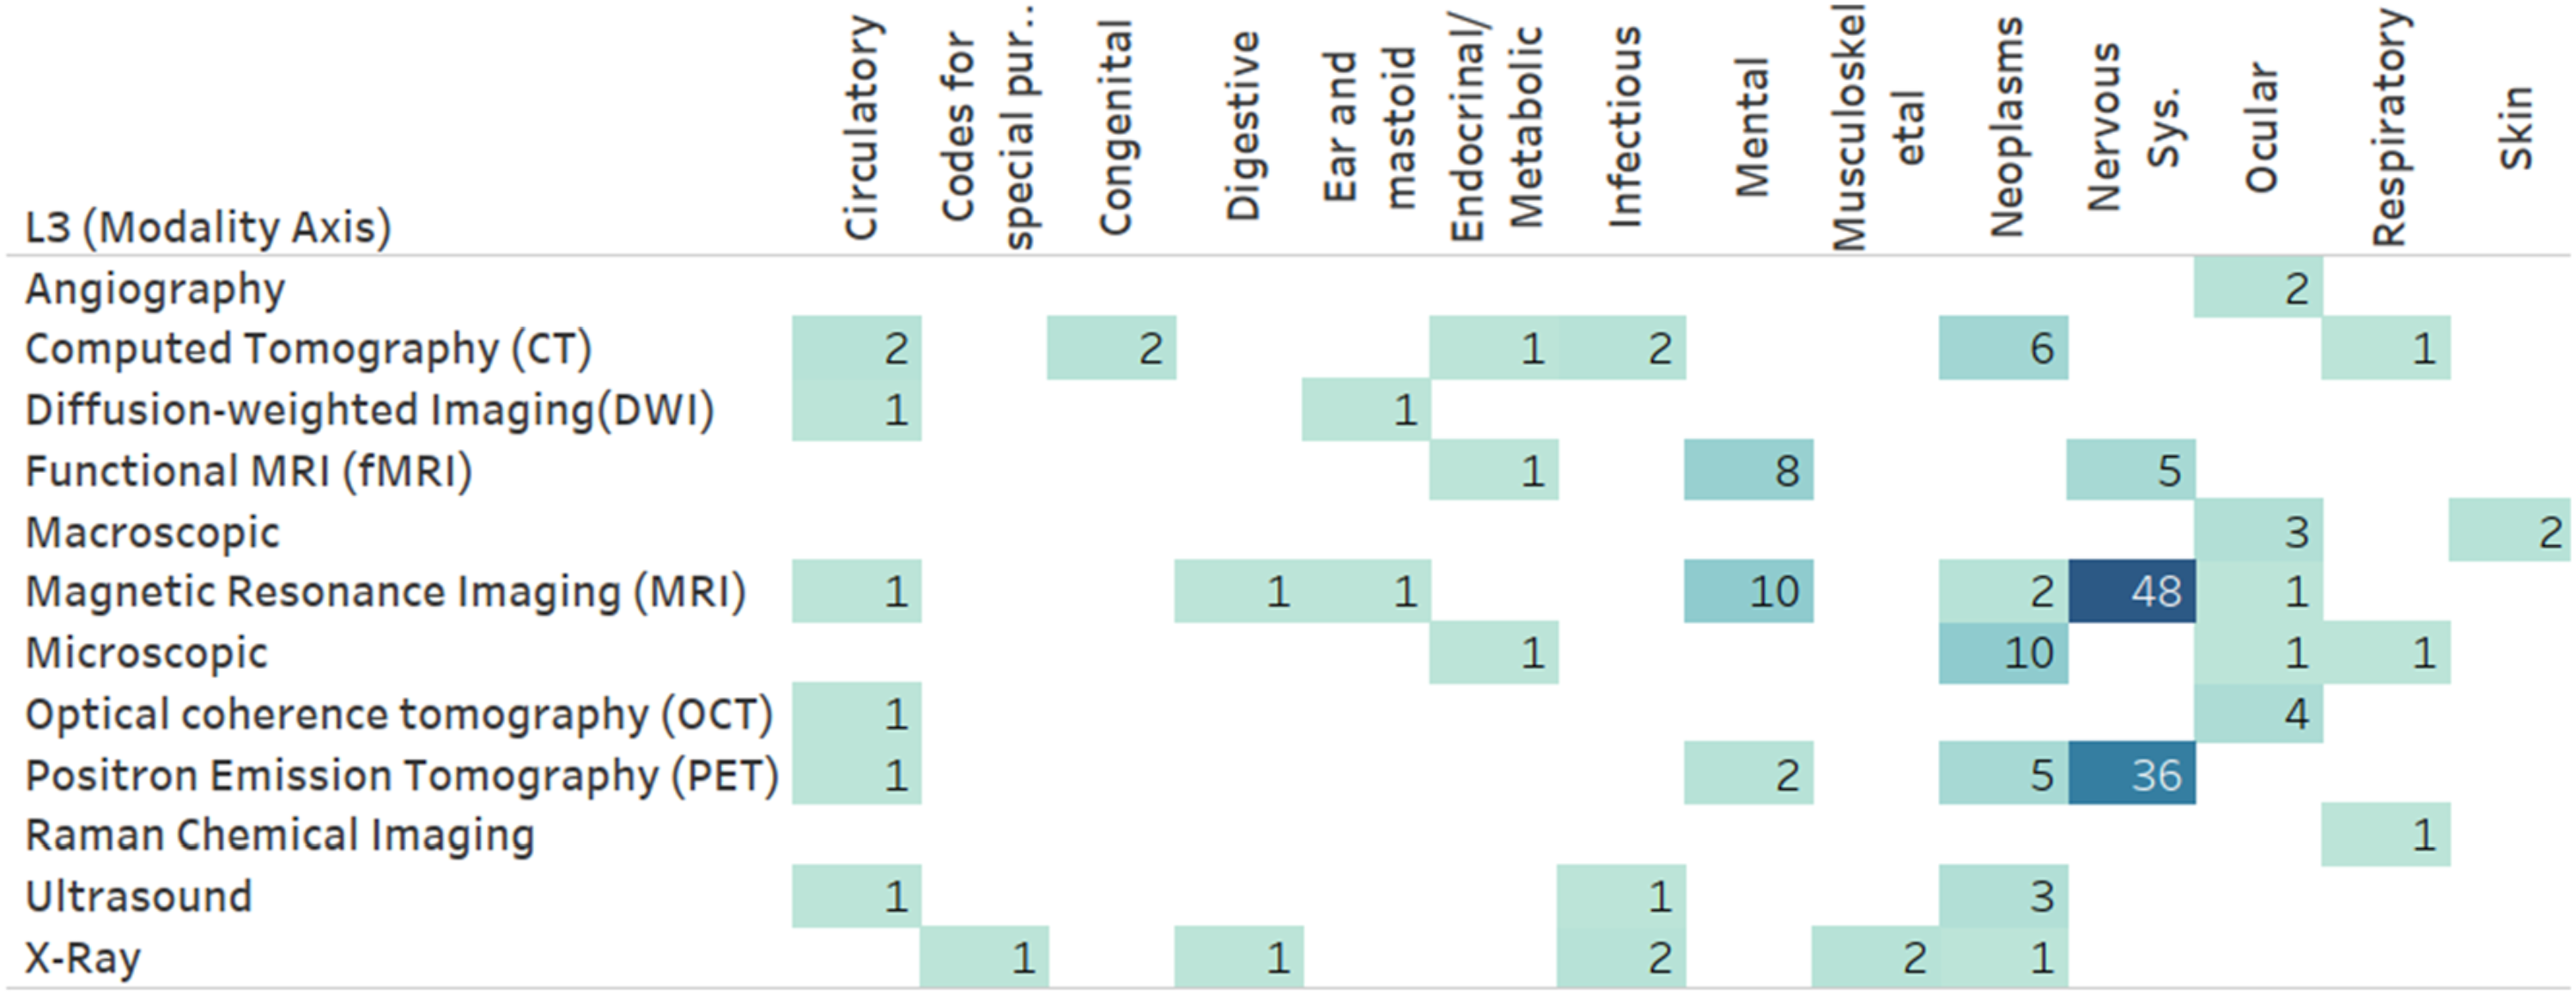
Figure 11 presents the frequency of MRL applications utilizing level 2 (L2) MRL modalities (Figure 10) combined with level 1 (L1) modalities (Figure 1). As illustrated, imaging modalities are often combined with other unstructured modalities, specifically other imaging modalities. This tendency is primarily due to medical brain imaging applications, such as AD classification, utilizing the distinct discriminative properties of disparate medical imaging technologies. This insight is verified when drilling down into the darkest box (representing imaging-imaging pairings) in Figure 11 using the Level 3 (L3) modality level. One can see (Figure 12) that many of these pairs involve PET and MRI scans often utilized in brain studies. A more direct verification can be achieved by adding the medical dimension to this diagram (Figure 13), where one can see that an overwhelming majority of MRI and PET modalities are used as part of a mental or nervous system analytics task. Number of papers by level 2 modality combinations used. Number of papers by level 3 modality combinations, limited to imaging modalities. Number of papers by level 3 modality and level 1 ICD-10 category, limited to imaging modalities.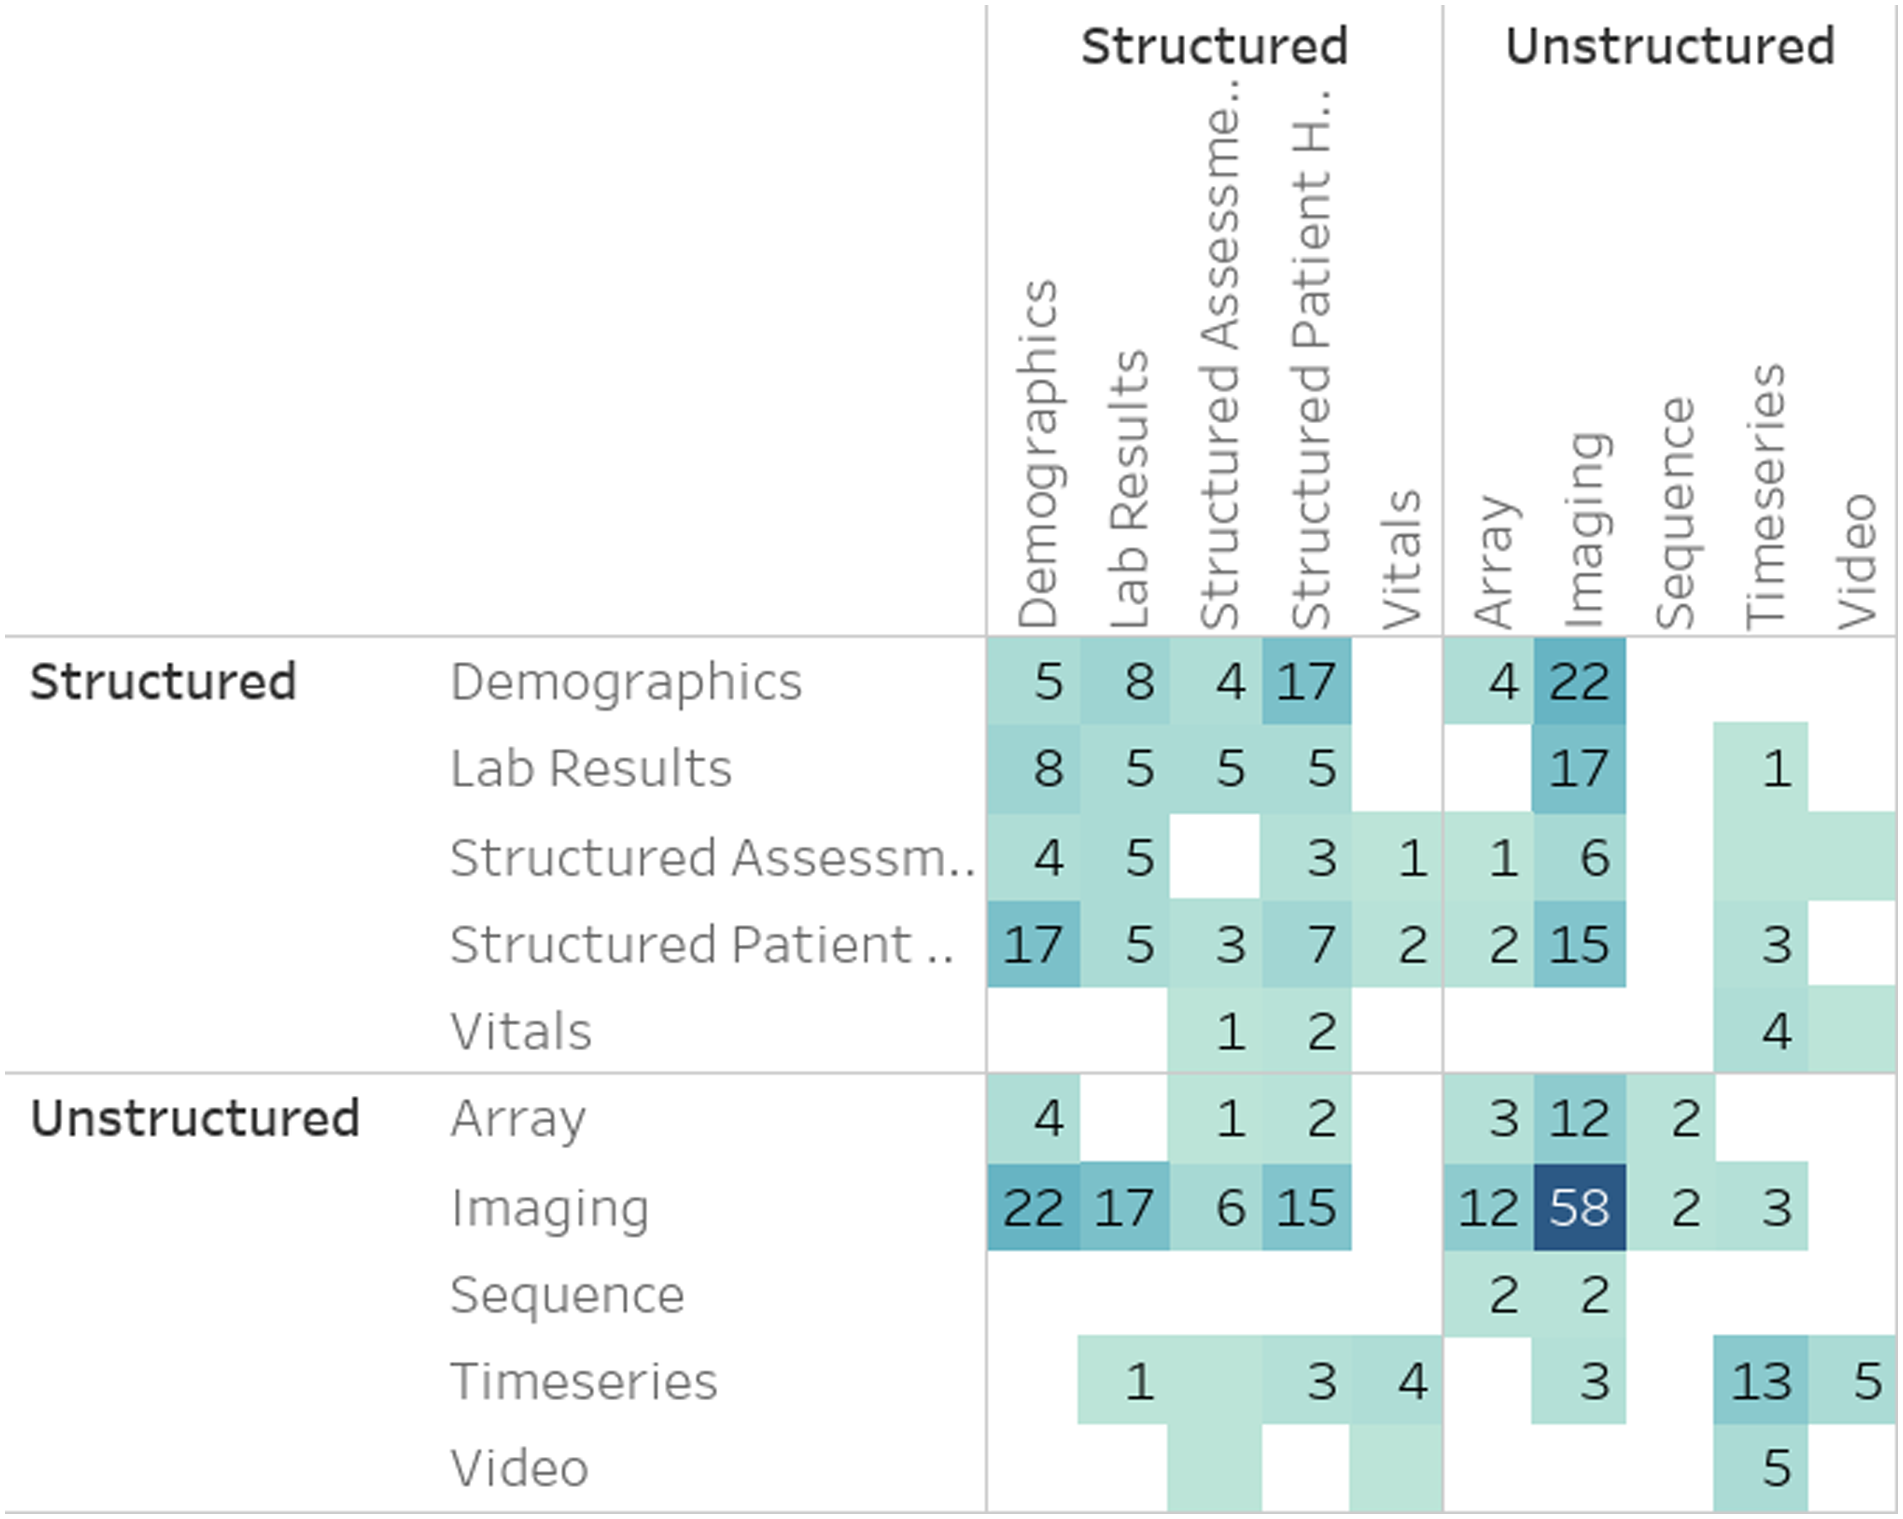
MRL techniques
A hierarchical analysis of the MRL techniques used in literature Figure 14 shows that the majority (46.7%) uses neural MRL. Further drill-down into L3 is available in the explorable online analysis.
7
Percentage of papers by level-two MRL technique. Techniques in red/orange employ NMRL and CMRL respectively. The rest of the techniques employ FMRL. Level one followed by level two MRL class is shown for each group of papers.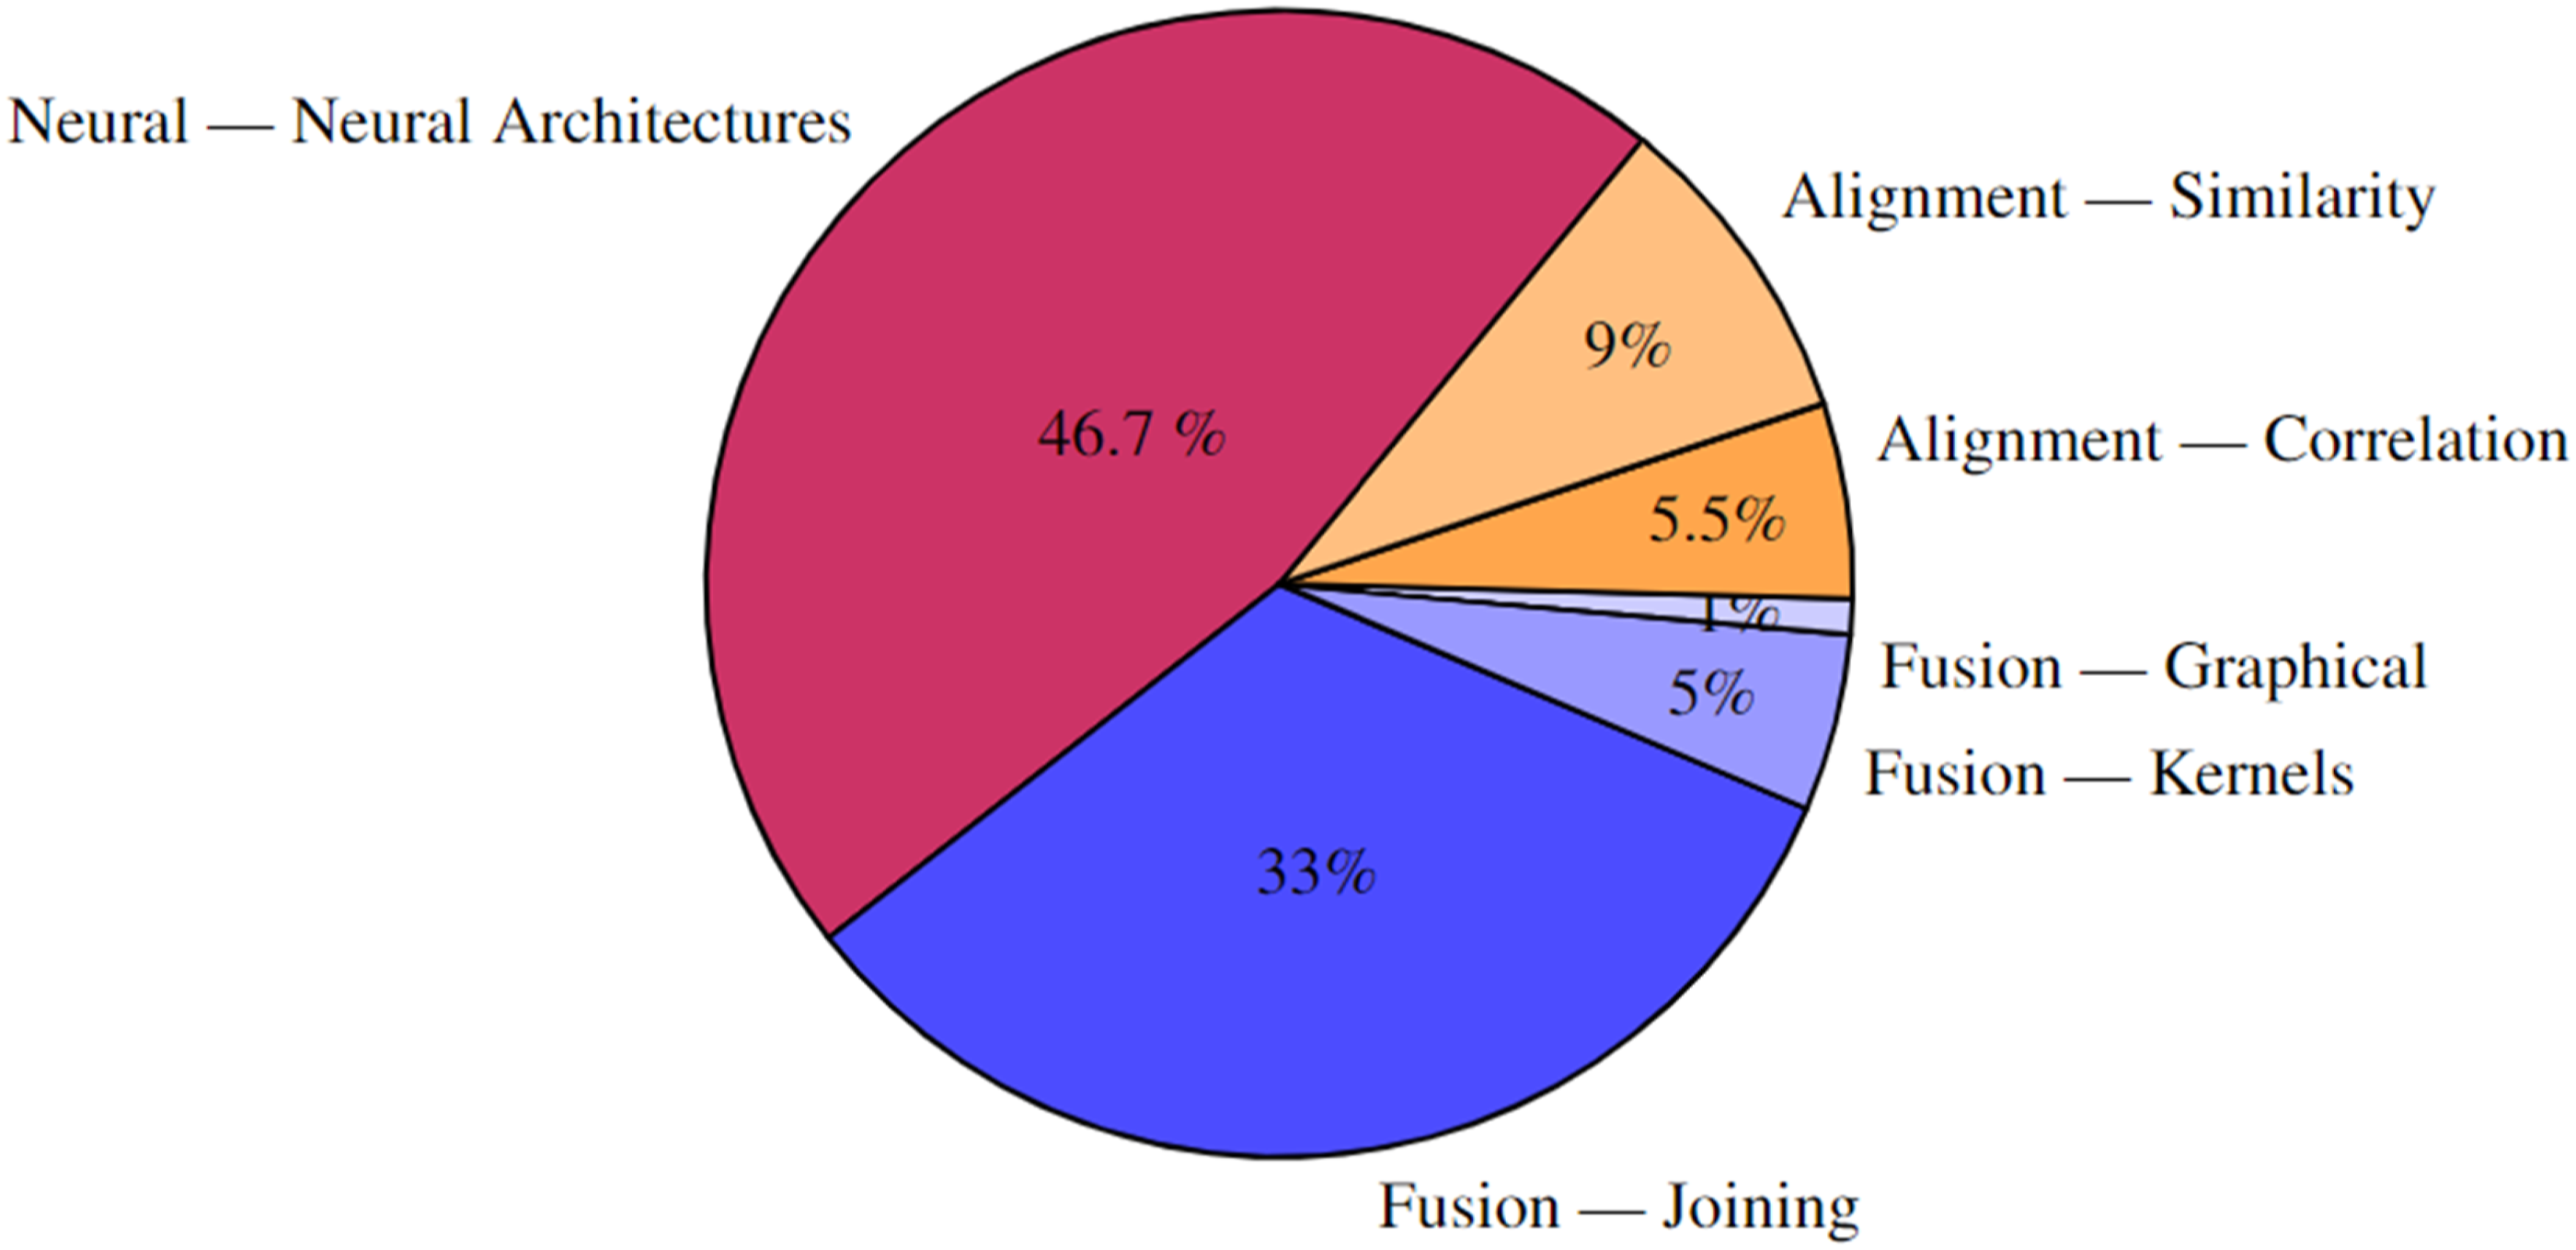
A few results stand out when comparing modalities and MRL techniques (Figure 15). While neural architectures and joining techniques are evenly used, joining techniques are more prevalent in time-series data and lab results. For time series, this amounts to 75% of the papers, while in lab results, over 70% of the papers utilize MRL joining techniques. Frequently, medical time series data has an immense sampling frequency, leading to hundreds of observations per second. Although data transformations can be learned directly for raw time-series data using deep learning techniques, such as the artificial recurrent neural network (RNN), the significant sampling rate of modalities like electroencephalography (EEG) can pose algorithmic problems, e.g., processing time, due to the sheer extent of raw data. This could explain why most time-series data is processed uni-modally and then fused with other modalities using joining. Percent of papers utilizing a level 2 MRL technique by level 2 modality. Results are limited to modalities with over 15 papers and to fusion MRL techniques.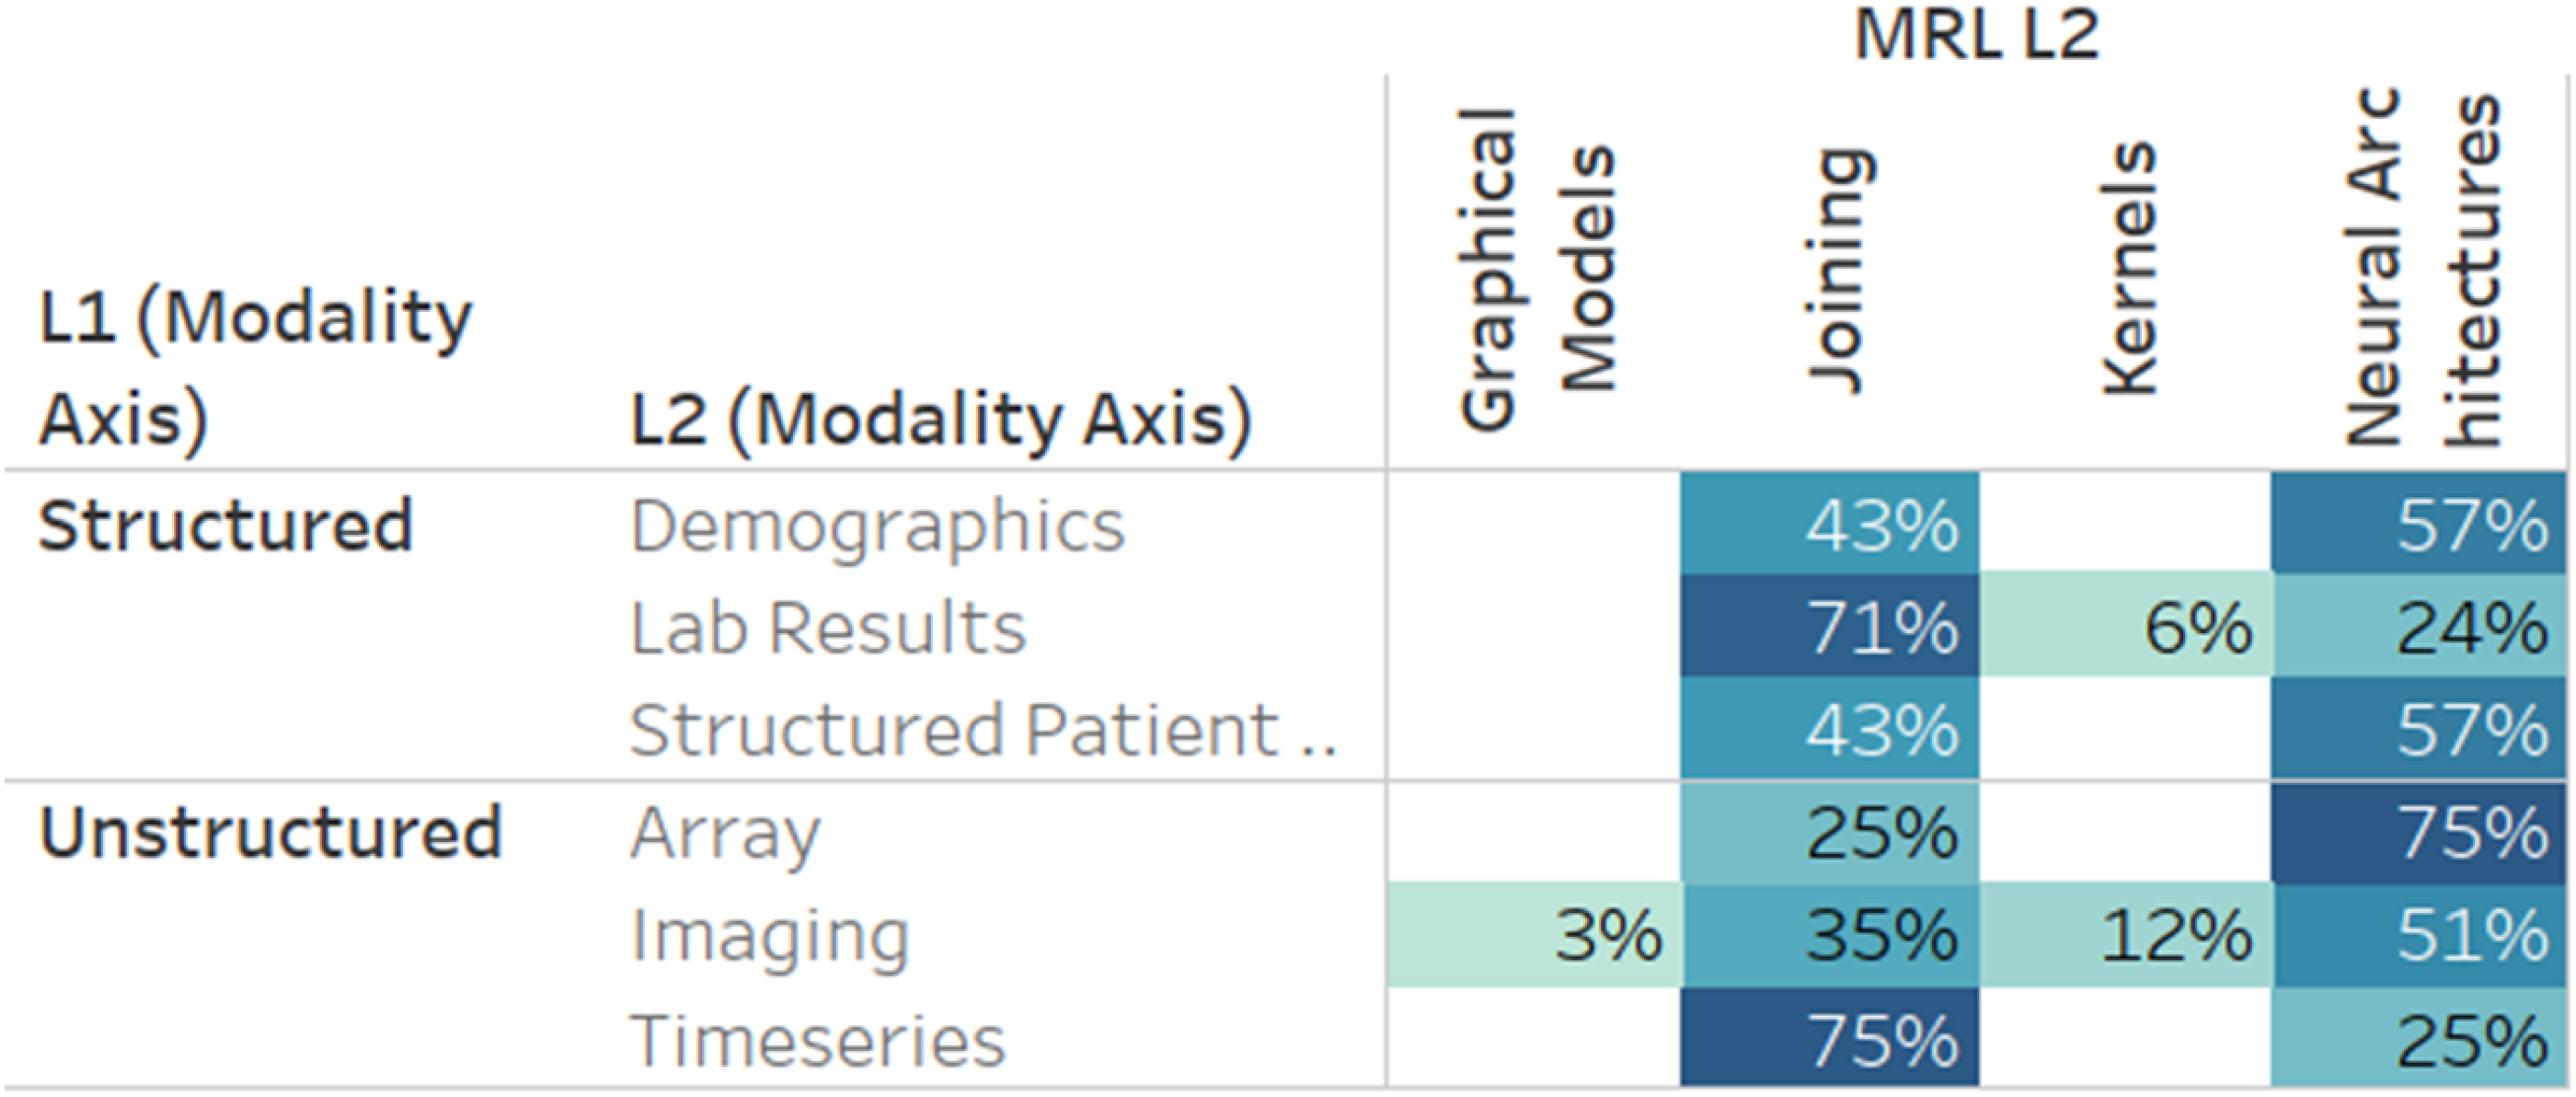
Medical analytics tasks
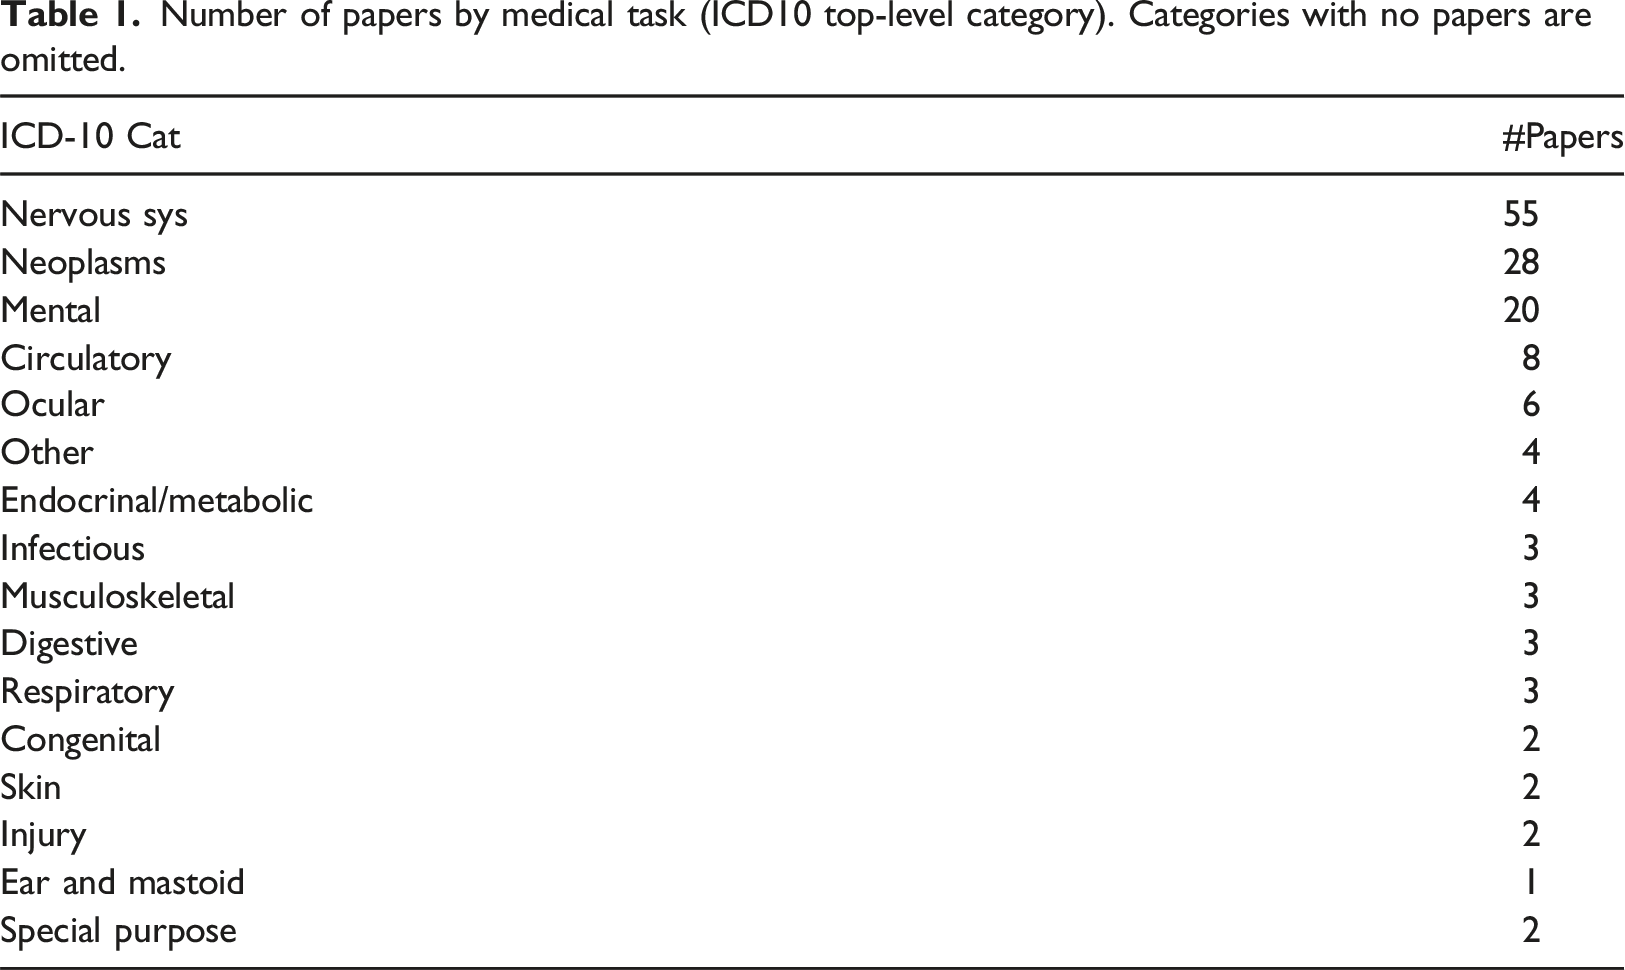
Number of papers by medical task (ICD10 top-level category). Categories with no papers are omitted.
Analysis of the type of analytical tasks derived from the MRL revealed that the only two types used were predictive
17
and descriptive (128), as illustrated in Figure 16. Papers by analytic type.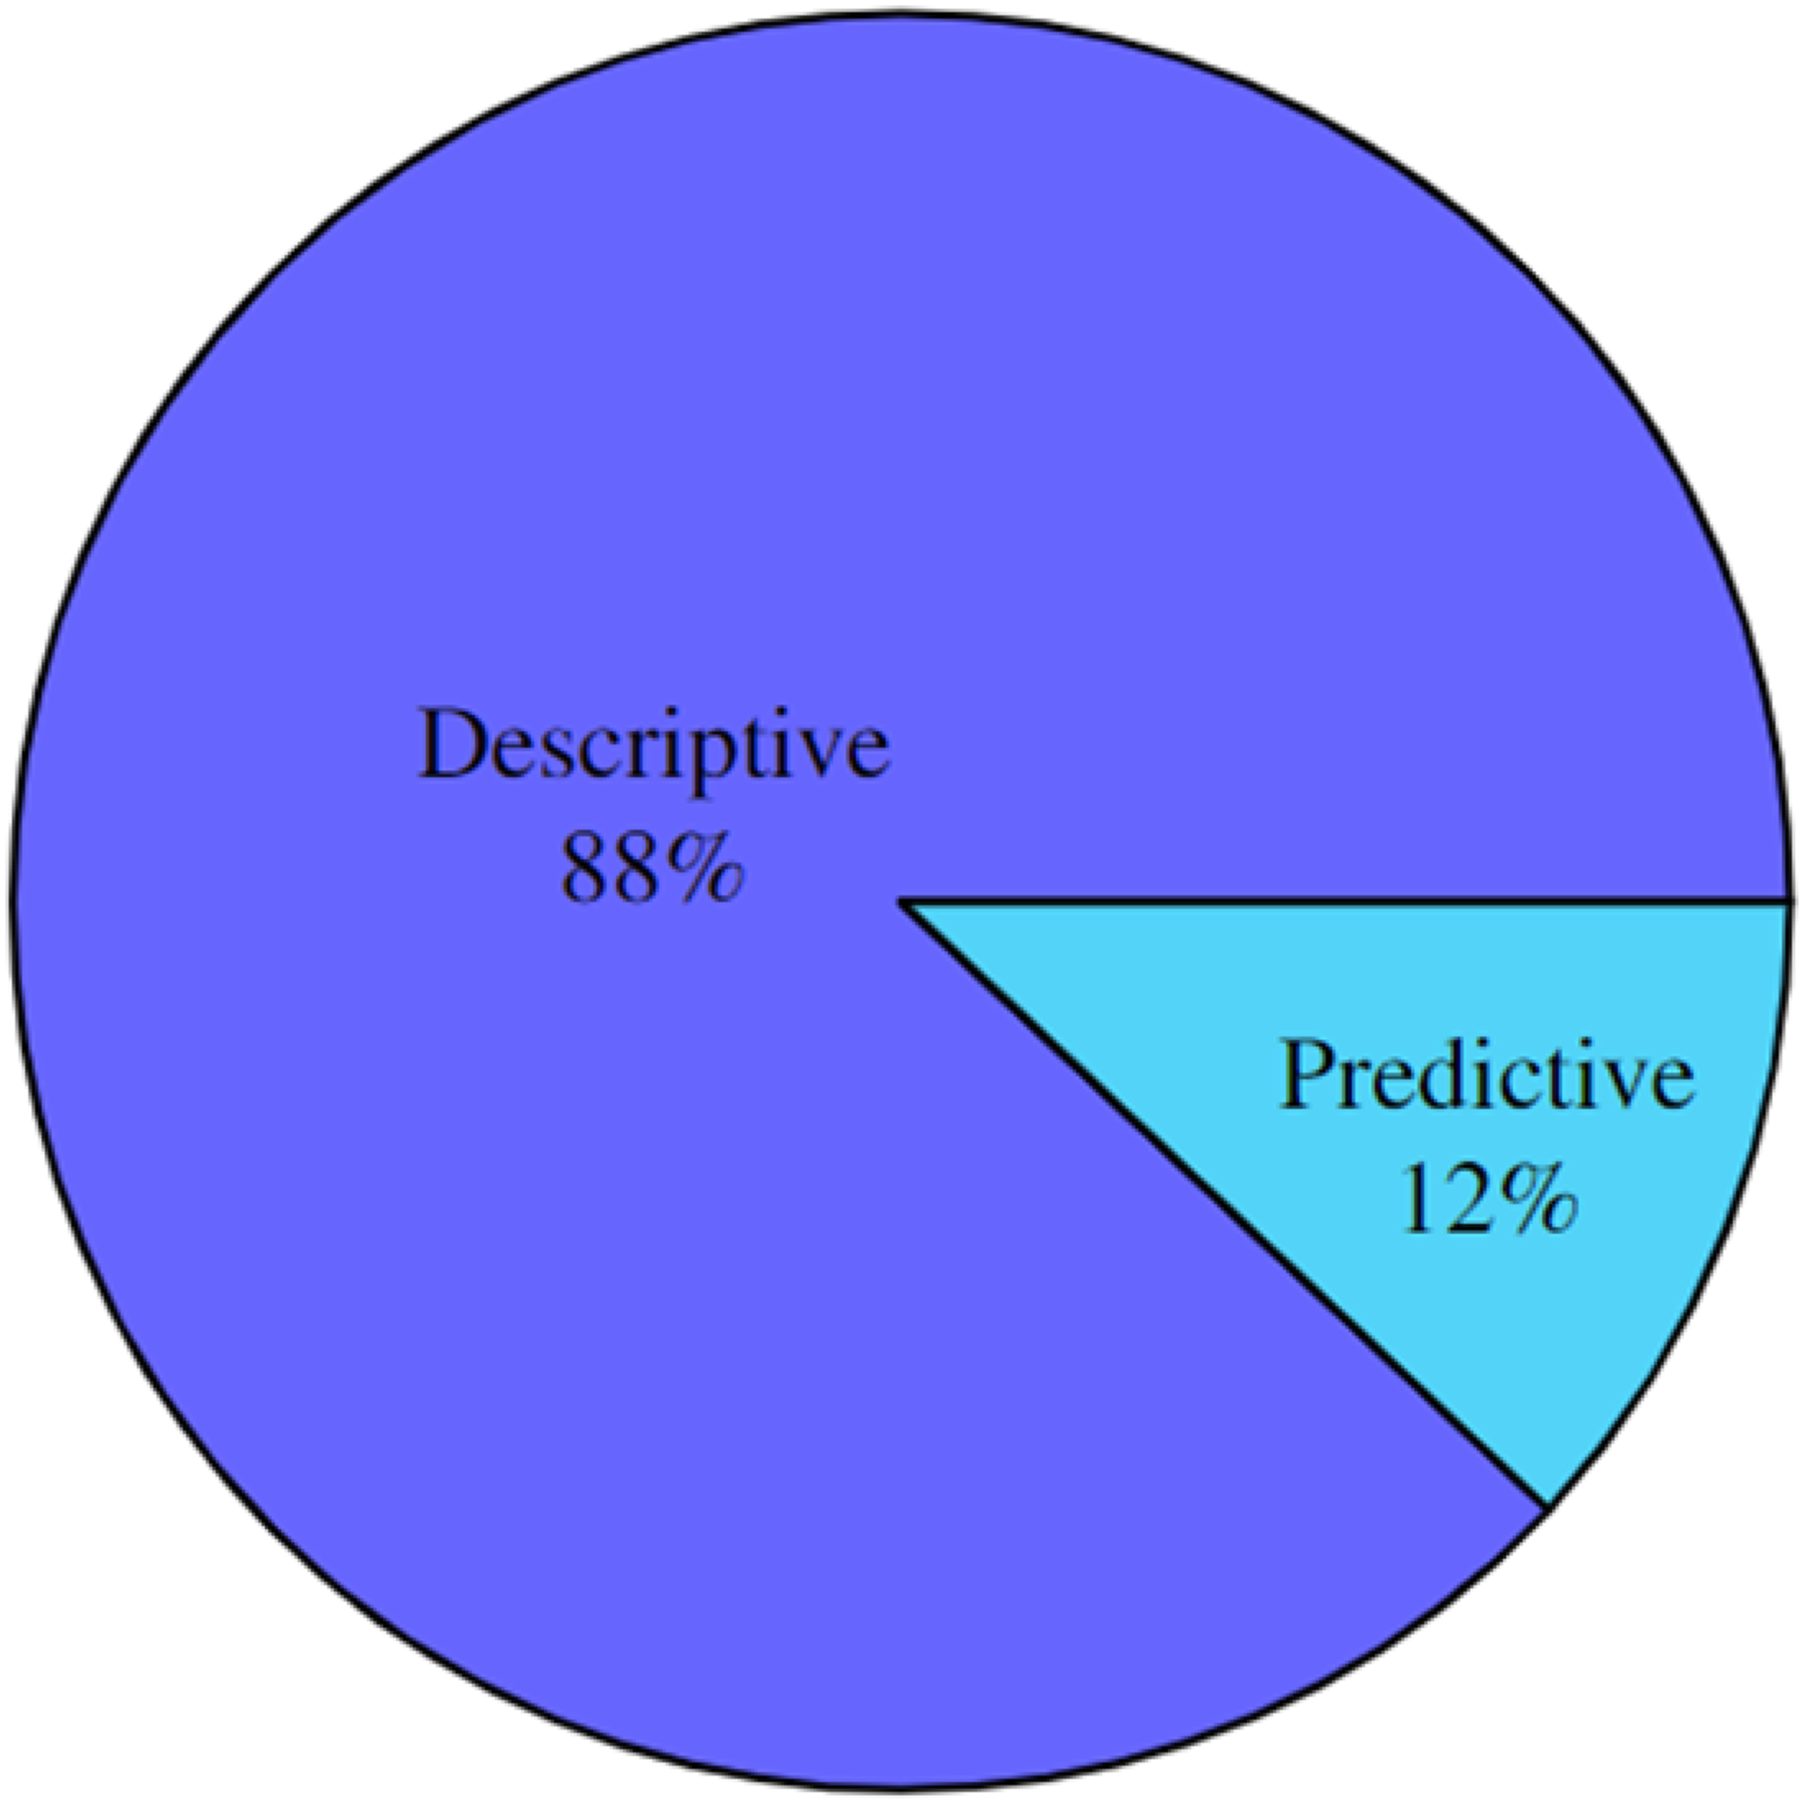
Discussion
Across all dimensions, it is clear that the use of MRL is clustered around specific use cases and techniques. Numerous unexplored areas are available for future research. These under-explored areas can be identified and analysed in more detail using the online analysis tool provided by this paper. In the following, some dimension-specific findings are further discussed.
With respect to the information dimension (Figure 11), notice the significantly limited utilization of structured data together with imaging and other unstructured modalities such as Video, sequences, and time-series. This could indicate opportunities for future research, as simple structured data, such as demographics, diagnosis codes, and prescriptions, have been shown to increase the discriminative power in multiple medical MRL tasks.36,37
Concerning the medical task dimension, results show the untapped potential of MRL, especially for the less-investigated disease categories of ICD-10, such as dermatological and circulatory diseases.
The results in the MRL techniques dimension show that Neural methods have recently received increased interest. These techniques can learn models directly from labelled data instead of human-engineered feature extraction and modelling techniques. However, the amount of labelled data needed for training medical analytics in an end-to-end practice exceeds what is readily available for many medical analytical questions. While some medical analytics tasks have large datasets accessible for immediate consumption in model creation, such as the Alzheimer’s Disease Neuroimaging Initiative (ADNI) database 8 , researchers are mostly faced with a dearth of annotated datasets 38 ). In the absence of large amounts of data, or conversely, when needing to process high-frequency sampled data, the more traditional, join-based techniques seem to be the tool of choice for the foreseeable future.
Limitations
As a time-bound review, this work is limited to the papers reviewed prior to submission. However, the authors hope our classification approach and online tool can be reused in future reviews to provide a clear picture of the current state of the art. The use of keyword-based retrieval for populating the initial list of papers is a limited technique, as we may have overlooked semantically similar keywords or papers using terminology not picked up by this method but still performing MRL in the medical domain.
Conclusion
This work comprehensively reviews the use of Multimodal Representation Learning (MRL) in medical analytics. A novel hierarchical taxonomy of medical information modalities is provided and linked to the SNOMED concept hierarchy and a hierarchy of related MRL techniques. Subsequently, a literature review of more than 1400 papers, following the PRISMA guidelines for structured surveys, is performed, and the eligible papers are inserted into four orthogonal classification dimensions: utility, medical, modality, and MRL. Using these classifications, a free and publicly available explorable online analysis is made available to investigate what modalities have been used together, for which medical analytics, and which MRL techniques have been successful in which combinations. In addition, as an electronic supplement to this paper, the complete list of works reviewed with exclusion reasons for excluded papers and classifications for included papers is provided.
Few ICD-10 top-level category disease codes were found to be the primary target for multimodal medical analytics. Many ICD-10 classes had few or no cases of medical analytics using multimodal data. This result could be due to the scarcity of openly available labelled training data for medical analytics, forcing MRL research to progress where such data is readily available.
While some medical information modalities can be integrated using most MRL techniques, modalities like time-series need special attention when utilizing end-to-end learning using neural architectures to mitigate high sampling rates. Furthermore, investigations of the utility dimension show that most medical applications have been developed for descriptive analytics and only a few for predictive analytics. This finding suggests that we are still in the early phase of adopting ML for medical analytics and opens the door for future work in developing prescriptive utility analytics.
Supplemental Material
Supplemental Material - Multimodal representation learning for medical analytics - a systematic literature review
Supplemental Material for Multimodal representation learning for medical analytics - a systematic literature review by Emil Riis Hansen, Tomer Sagi and Katja Hose in Health Informatics Journal
Footnotes
Acknowledgements
The authors wish to acknowledge Kashif Rabbani, Theis Jendal, and the rest of the Data, Knowledge, and Web research group at Aalborg University for their advice and support.
Author contributions
Hansen: Writing - Original Draft, Investigation, Visualization; Hose: Supervision, Writing - Review and Editing, Funding Acquisition; Sagi: Conceptualization, Visualization, Supervision, Writing - Review and Editing.
Declaration of conflicting interests
The author(s) declared no potential conflicts of interest with respect to the research, authorship, and/or publication of this article.
Funding
The author(s) disclosed receipt of the following financial support for the research, authorship, and/or publication of this article: This work was partially supported by the Poul Due Jensen Foundation.
Data availability statement
Supplemental Material
Notes
References
Supplementary Material
Please find the following supplemental material available below.
For Open Access articles published under a Creative Commons License, all supplemental material carries the same license as the article it is associated with.
For non-Open Access articles published, all supplemental material carries a non-exclusive license, and permission requests for re-use of supplemental material or any part of supplemental material shall be sent directly to the copyright owner as specified in the copyright notice associated with the article.