
Abstract
Keywords
Introduction
The term “heart disease” is used to describe several heart conditions, such as acute coronary syndrome, heart failure, atrial fibrillation, aortic aneurism, hypertension, and peripheral arterial diseases. 1 The most common type of heart disease in the United States is known as coronary artery disease (CAD), coronary heart disease, or ischemic heart disease. 2 In addition, a group of diseases known as acute coronary syndrome or heart attacks are characterized by decreased blood flow to the heart muscle. 3 Some people experience a heart attack or Myocardial Infarction (MI) as the first sign of CAD that happens when a part of the heart muscle doesn’t have enough blood, muscle spasm, sudden contraction of coronary arteries that stop blood perfusion to the heart muscle. 4 Heart attack is still the first cause of death among both sexes that is related to differences in biology, lipids building-up of several areas in the body, different symptoms of heart attack, different risk factors of heart diseases, and requirements of different treatments of heart attack. 5
Heart attack symptoms like chest pain, discomfort, shortness of breath, nausea, vomiting, dizziness, and fatigue may be silent, making it difficult to diagnose until they manifest. 6 However, symptoms can differ from person to person and from attack to attack within a single person. 7
In general, heart disease is the number one killer of men in the USA, expected to claim the lives of 384,886 men in 2021, or one out of every four men. 8 In the European Union (EU), the standardized rate of death from heart attack was 1,194 per million people, with the highest rate for men being about 1,625, and the lowest rate for women being about 881 per million people. 9 Furthermore, African Americans, American Indians, Hispanics, and whites were the most racial and ethnic group of men who had a heart attack. 2 Men are highly susceptible to developing heart disease; in addition, about half of the men who passed away suddenly from a heart attack had no signs of heart disease. 10
Due to the major complications of heart attack and the overlapping of the main symptoms of heart diseases, several novel treatments were available including pharmacologic and non-pharmacologic regimens. 11 However, with the advanced technology and the huge amount of laboratory and diagnostic data that is known as “big data” or “large-scale data”, the prediction of heart attack utilizing the non-invasive methods of artificial intelligence (AI) is a crucial necessity among men who had a high prevalence rate of heart attack and recurrent episodes of heart diseases. 12 Thus, the purpose of this study is to propose a prediction model of death versus life among men who could develop heart attacks called the Chi-squared Automated Interactive Detection (CHAID) algorithm.
Recently, a study was conducted by Nandal, Goel 13 to optimize the best prediction model for heart diseases. Their study has used machine learning algorithms of support vector machine, logistic regression, Naïve Bayes, and XGBoost with a collection of heart data symptoms from the UCI machine learning repository. It was provided that the XGBoost was the best prediction model among the given models with an area under the curve of 0.94. Another research was carried out by Gour, Panwar 14 that found gradient boosting is the most accurate prediction model, with an accuracy of 85.5%, according to their analysis of several supervised machine learning algorithms, including decision trees, random forests, gradient boosting, and logistic regression. Additionally, it was discovered that chest pain with typical angina is the symptom of a heart attack that is most often associated with it, followed by age, a cholesterol level of more than 200 mg/dl, and an elevated heart rate. Another study used AI to create a risk prediction model for myocardial infarction patients. This study used a variety of prediction models, such as logistic regression, support vector machines, and gradient-boosting decision trees, and discovered that the last model was the best bottom prediction layer, with an accuracy of 83% and an area under the curve of 0.90. This study concludes that the AI-building model had better accuracy and good prediction of MI cases by reducing the occurrences of in-patient MI cases utilizing the large dataset perspective and then enhancing the treatment rate and the prognosis in their cases. 15 Hence, the objective of this study is to propose the Chi-Squared Automated Interactive Detection (CHAID) model as a prediction algorithm to forecast death versus life among men who might experience heart attacks.
In our study, the CHAID model outperformed eight other models in predicting death versus life among Jordanian men with heart attacks, with the highest accuracy of 93.72%. It excels in handling categorical variables, independently dividing data, and allowing for decision tree structure, making it ideal for datasets with substantial categorical information. This transparency is crucial in sectors like finance, healthcare, and policy formulation.
Materials and methods
Design
The retrospective, predictive study was used to extract data from the electronic health solution system in Jordan. Data were collected for men who were admitted to Public Jordanian hospitals from the years 2015 to 2021.
Detailed data description
Men’s age, governorates, medical diagnosis, pulse oximetry, pulse (heart rate), systolic and diastolic blood pressure, pulse pressure, and mean arterial pressure were extracted from the Health Analytical Department for the admitted patients between the years 2015 and 2021. Pulse pressure and mean arterial pressure were calculated based on the given systolic and diastolic blood pressure. In the context of big data, calculating the sample size involves considering the massive volume, variety, and velocity of data. 16 Hence, the larger data are better for data analysis. 17 Jordanian males who were treated at 195 health institutions in Jordan were included in the extracted data, which comprised 3,435 electronic health records.
Inclusion and exclusion criteria
All patient records from hospitals that used Hakeem (EHS) as a part of electronic health records were retrieved according to the required variables (attributes). The required data include information about adult male patients who are aged 18 years and older, as they are at more risk of developing IHDs. We excluded any records that contained patients’ information who were 1 under the age of 18 or 2 admitted to the system for trial purposes.
Data analysis
Data Pre-processing
The process of data analysis consisted of two primary stages: descriptive analysis and predictive modeling. Using frequency description, a large, selected pool of data was examined for noise, inconsistency, and missing values. Inconsistent and noisy data were eliminated from the dataset. Furthermore, missing data about biochemical parameters including fasting blood glucose, cholesterol, LDL, HDL, and HbA1c were excluded from the analysis due to the potential for error-inducing consequences associated with their replacement. Nonetheless, numerous variables, including age, gender, governorate, and medical diagnosis, were provided in their entirety without any missing; thus, each of these variables was retained and incorporated into the analysis procedure.
Algorithms Explanation
Eight models were developed to predict mortality versus survival among Jordanian men who had suffered a heart attack. However, the CHAID model achieved the best accuracy (93.72%) and an AUC of 0.792 with seven field-attributable risk factors. Depending on the exact environment and analysis aims, there are some advantages to utilizing the CHAID model over other AI models. CHAID excels at handling categorical variables, both ordinal and nominal. In contrast to many models that need surrogate coding or other pre-processing procedures, CHAID divides data independently based on these factors, making it ideal for datasets with significant categorical information. Furthermore, the CHAID model’s decision tree structure eases comprehension by allowing the tracking of individual decisions.
Training and testing Split
The CHAID model assesses each value in a potential predictor field using the significance of a statistical test as a criterion. It keeps all other values that are heterogeneous and merges values that are deemed to be statistically homogeneous (similar) concerning the target variable (dissimilar). The best predictor is then chosen to create the decision tree’s first branch, with each child node consisting of a collection of uniform values from the chosen field. Recursively, this process goes on until the tree is fully developed. The statistical test that is applied depends on the target field’s level of measurement. An F test is applied if the target field is continuous. A chi-squared test is applied if the target field is categorical. Furthermore, the CHAID model works by splitting the data into 70% as a training and 30% as a testing set.
Model development and validation
‘Exhaustive’ CHAID is a CHAID modification created to address some of the method’s shortcomings. 18 Since CHAID stops merging categories as soon as it determines that all of the remaining categories are statistically different, it is possible that it occasionally does not find the best split for a variable. This is fixed by exhaustive CHAID, which keeps merging the predictor variable’s categories until there are only two supercategories left. Once the series of merges for the predictor has been examined, the set of categories with the strongest correlation to the target variable is identified. An adjusted p-value is then calculated for that correlation. By comparing the adjusted p-values, exhaustive CHAID can determine the best split for each predictor and then decide which predictor to split on. Besides, cross-validation techniques were used to validate the results through fell on the ‘K-1' subsets; the test set was the remaining subset. Every subset acts as the test set once thanks to the repetition of this process. This technique aids in evaluating the model’s performance across various dataset subsets, offering a more thorough understanding of its predictive ability. 19
Statistical analysis
For manipulating, analyzing, and visualizing the data, the International Business Machine (IBM) Statistical Package for Social Science (SPSS) Modeler (version 18.0) was used, which provides the features of presenting the data effectively for statistical and predictive analysis and data management for descriptive and predictive modeling. 20 Using descriptive modeling, the leading risk factors for fatal heart attacks were identified. On the other hand, predictive modeling was chosen based on the overall accuracy and area under the curve (AUC) parameters to construct the appropriate model.
Ethical consideration
The Committees of Scientific Research and Ethics of Research at the School of Nursing/The University of Jordan and the Ethics Committee at the Ministry of Health (MOH) (#MOH/REC/2022/3) approved the ethical conduct of the study. In addition, the Health data analysit (HDA) department at the electronic health solution (EHS) institution approved the study. An ID was used to identify each record, enabling the handling of patient records anonymously. Informed consent was not applicable since the data were collected via contacting the health data analytics officer through electronic medical records. The extracted data were stored in a separate, password-protected file in a secure location in the researcher’s office. The data for the study were accessible only to the researchers.
Results
Sample characteristics
Sample characteristics (N = 3,435).
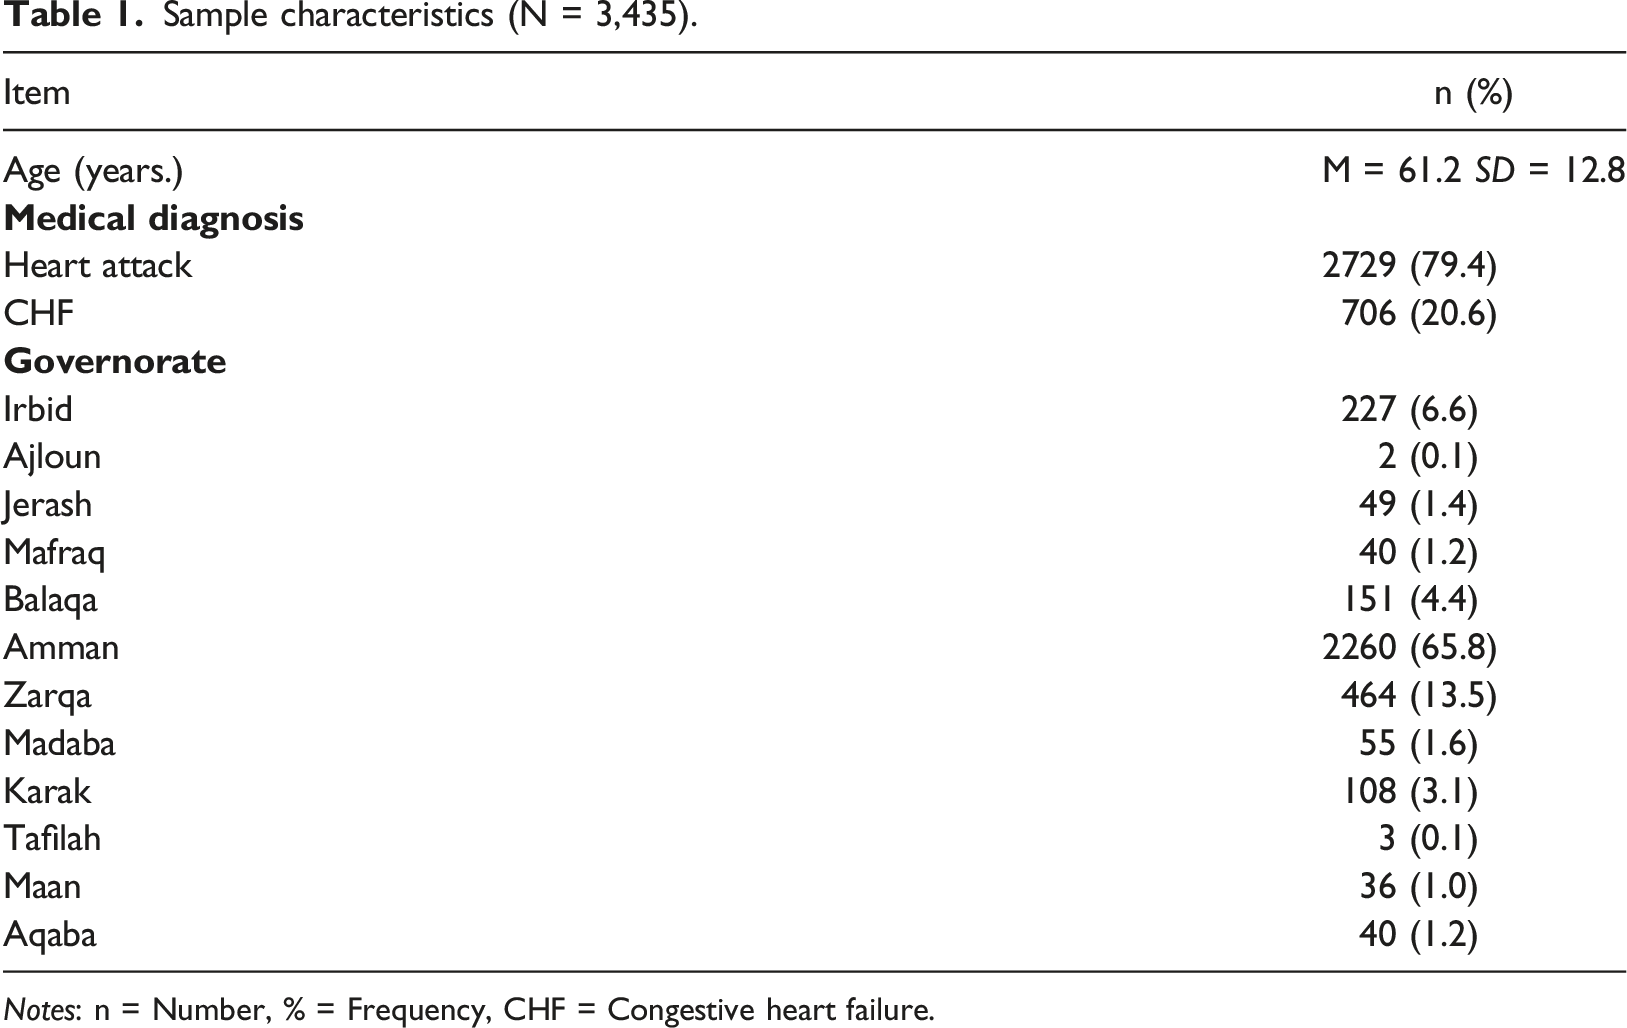
Notes: n = Number, % = Frequency, CHF = Congestive heart failure.
Hemodynamic readings for patients.
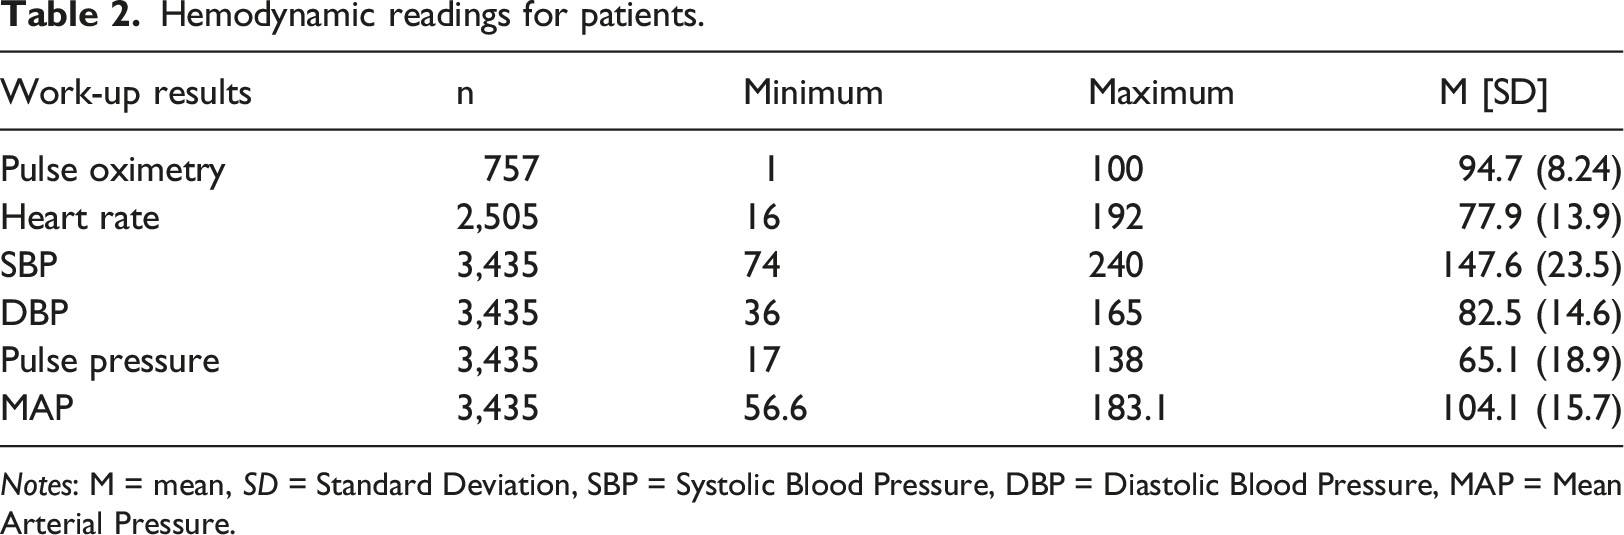
Notes: M = mean, SD = Standard Deviation, SBP = Systolic Blood Pressure, DBP = Diastolic Blood Pressure, MAP = Mean Arterial Pressure.
Predictive model
Eight models built for the study data.
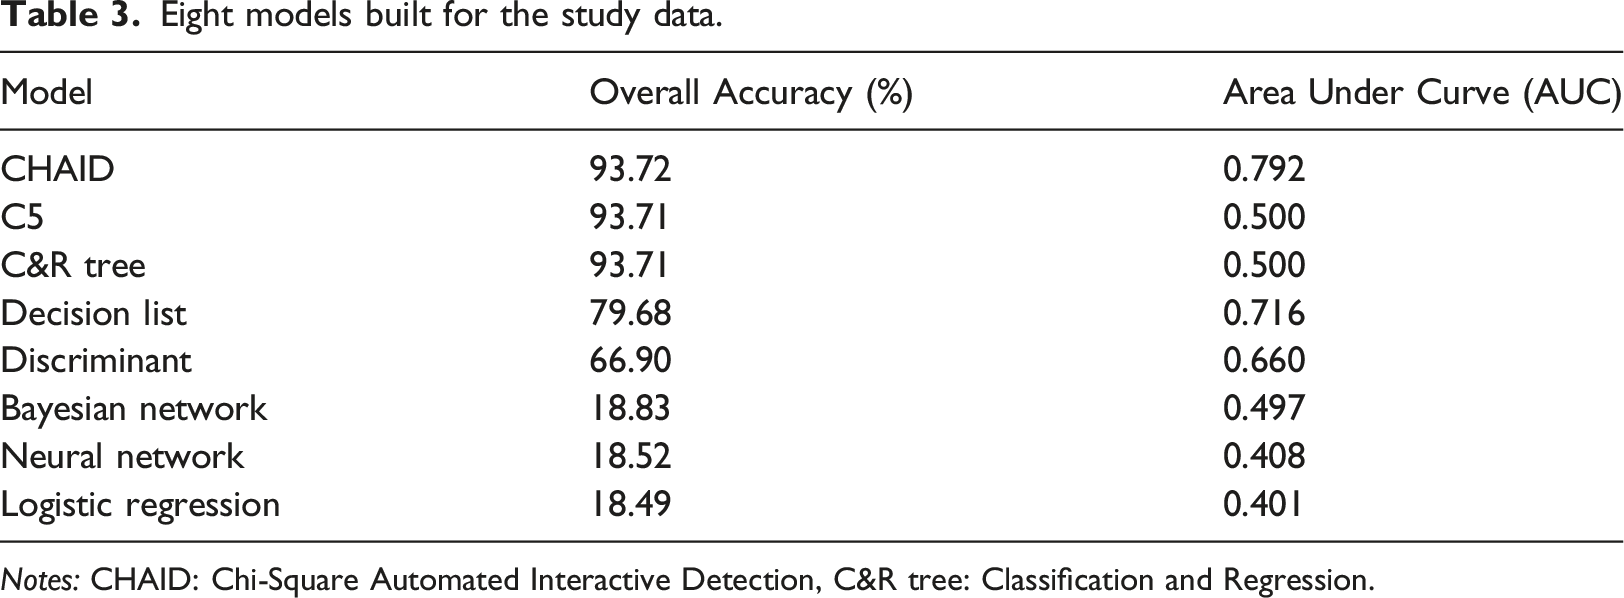
Notes: CHAID: Chi-Square Automated Interactive Detection, C&R tree: Classification and Regression.
The Chi-Square Automatic Interaction Detector (CHAID) algorithm is a decision tree technique that is used to discover the connection between variables by building a prediction model to explain an outcome in the given dependent variable. The CHAID algorithm can create all possible cross-tabulations between nominal, ordinal, and continuous variables with the associated related factors within the tree. 21 Besides, the CHAID algorithm works by splitting the target (death versus lifestatus) into two or more categories called the initial node, and then the nodes are split into child nodes. Furthermore, the CHAID algorithms do not require the given data to be normally distributed. 22
A total of 23 nodes were created using SPSS modeler version 18 as shown in Figure 1. The tress beginning node started with the target node known as death status, then it was branched into three nodes containing pulse oximetry that refers to the level of tissue oxygenation with a cut-off value reaching 90%, namely node 1, 2, 3, and 4. It was shown in the four nodes that the death rate was higher among men who have pulse oximetry of less than 95% (n = 53, 18.6%). (Chi-square = 142.4, p < .001). Predictive model of death versus a life outcome Among Jordanian men.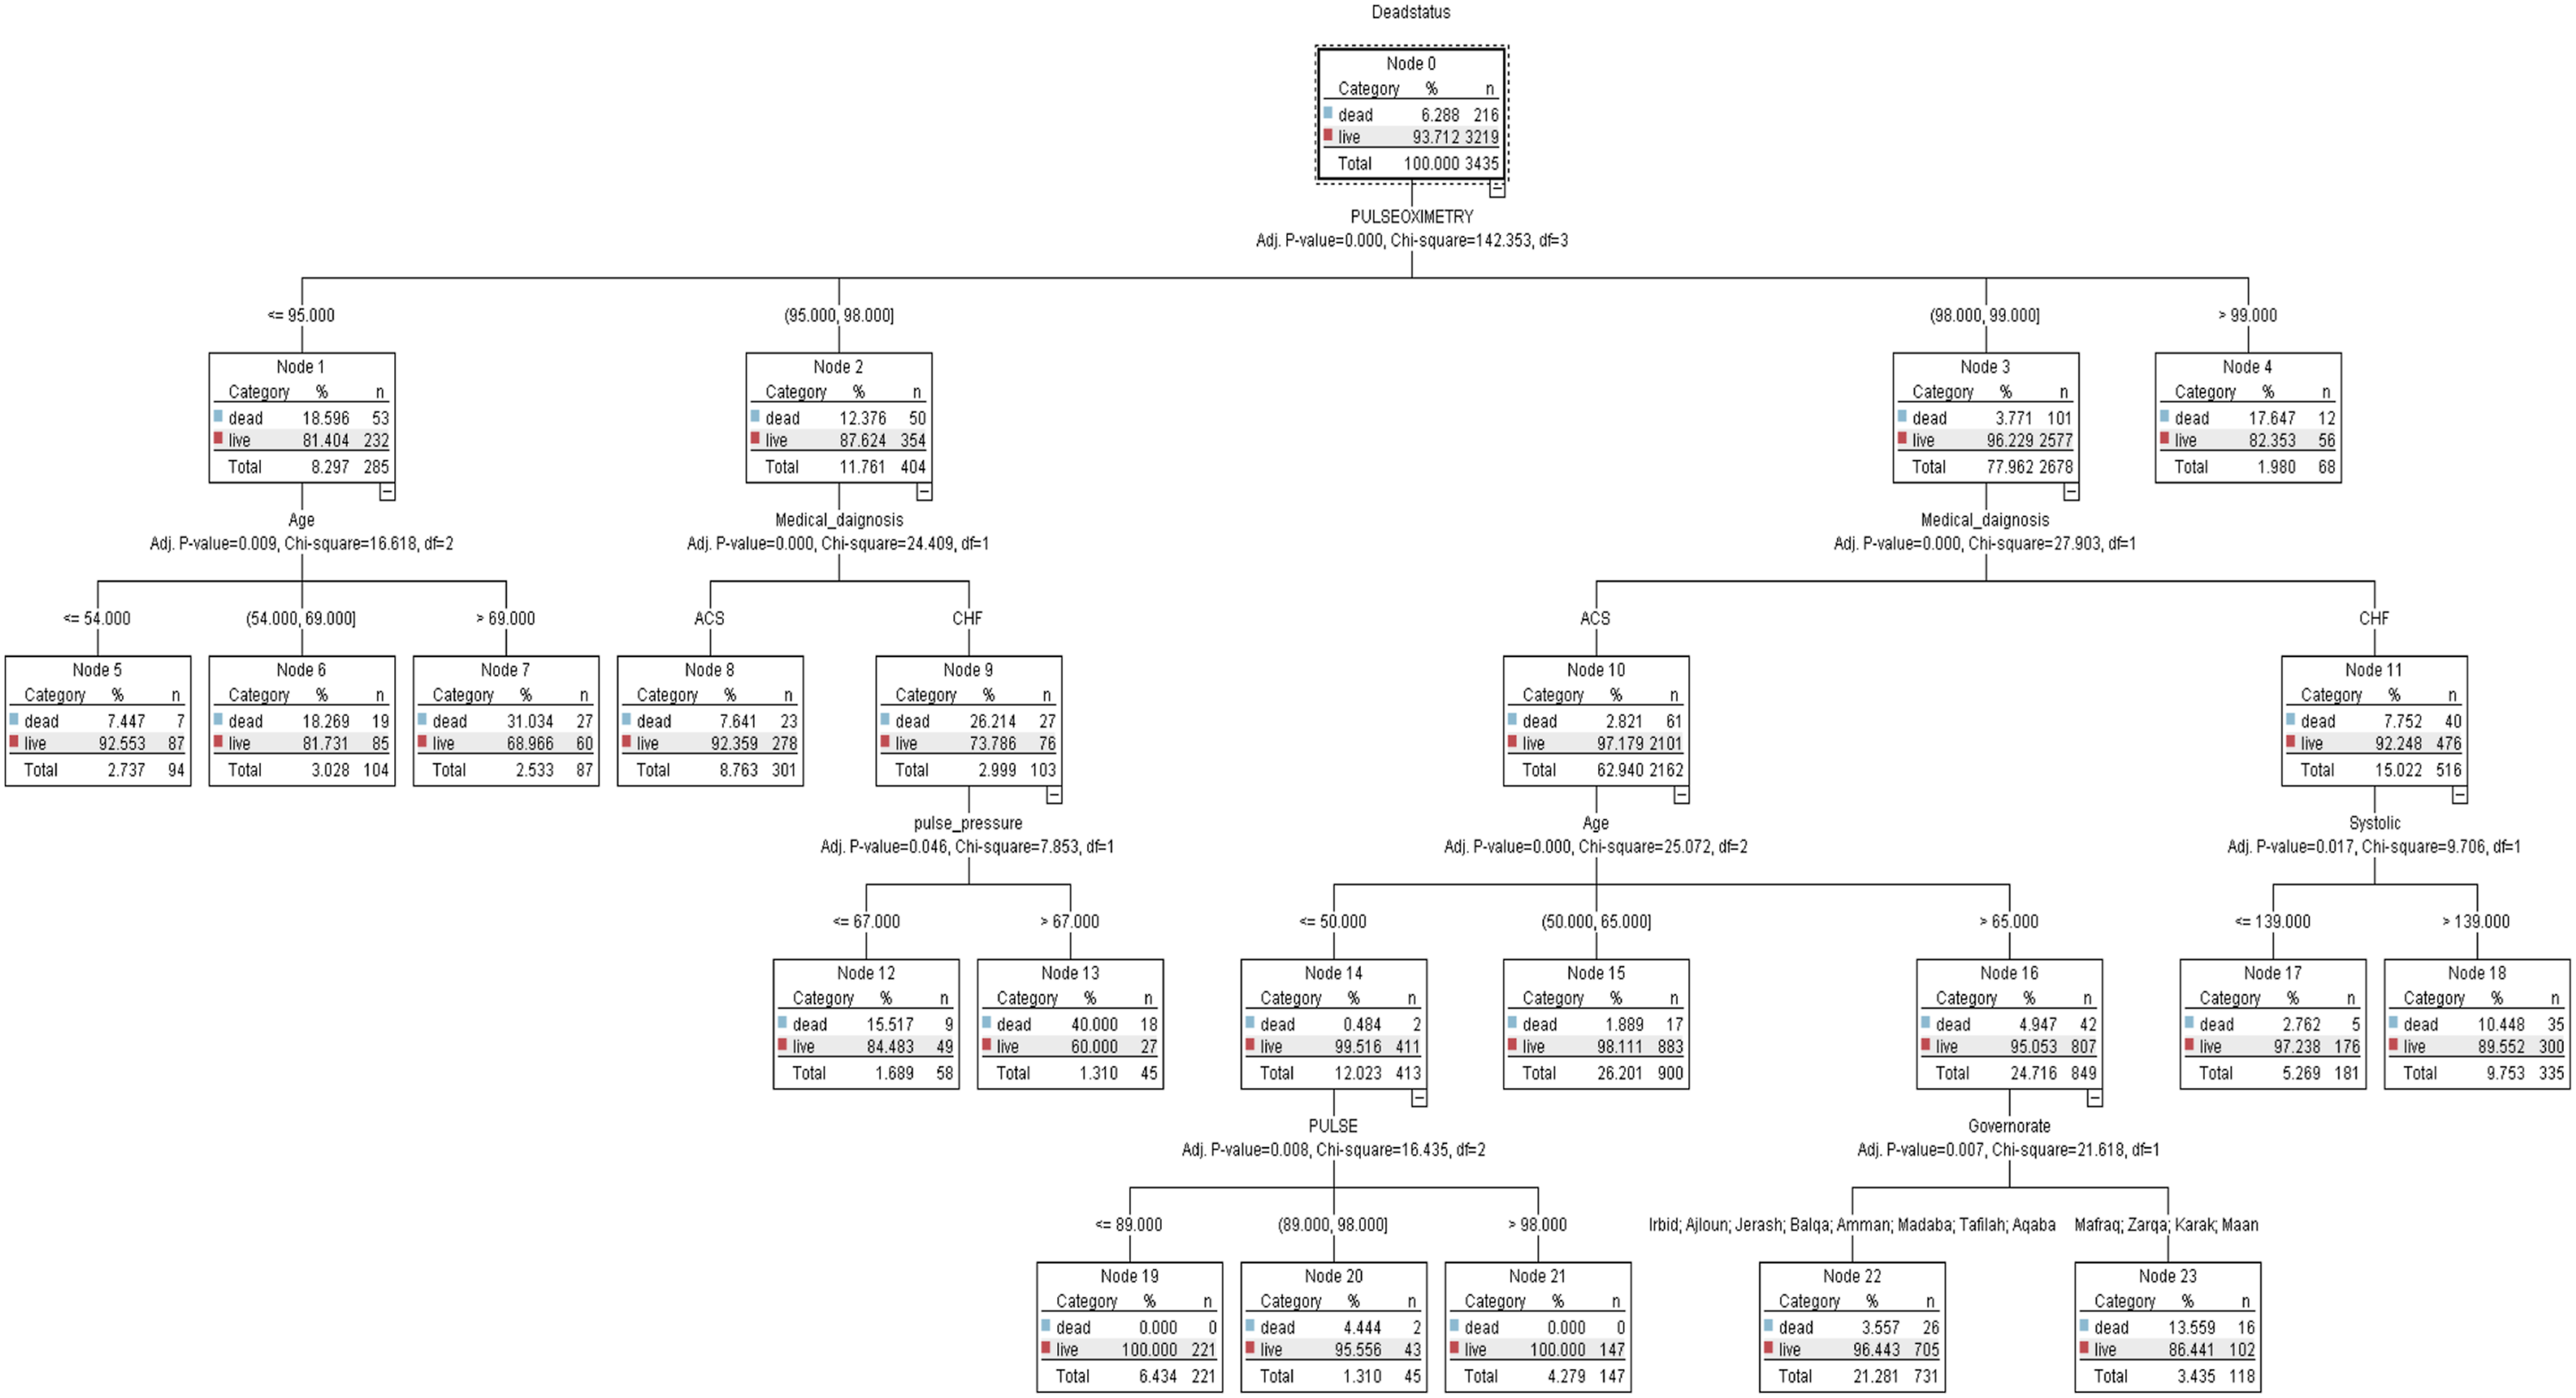
Medical diagnosis is the next significant predictor in the model. a patient who has a history of CHF were at risk of developing heart attack (n = 27, 26.2%) rather than those who have ACS (n = 23, 7.6%) in nodes 8 and 9. (Chi-square = 24.41, p < .001). The model’s next split depended on the pulse pressure at nodes 12 and 13 which represented that patients who had a pulse pressure of > 67 had a higher death status (n = 18, 40%) compared with patients who had ≤ 67 (Chi-square = 7.85, p < .001).
Consequently, pulse or heart rate is the next important predictor risk factor of mortality among men. It was performed that patients who had a heart rate of 98b\m and 89b\m had a higher death rate reaching 4.4%. (Chi-square = 16.4, p < .008). The fourth predictor risk factor for patients who have ACS was divided at node 10 to three nodes, namely, 14, 15, and 16 which confirmed that patients who were aged > 65 years were at high risk to develop death status of heart attack 4.96%. (Chi-square = 25.1, p < .001). For patients who were at the age of ≤ 50 years old, the next important predictor was split at node 14 into three nodes, namely, 19, 20, and 21 for pulse (heart rate). It was shown that patients who were aged ≤ 50 years and had a pulse of 89 and 89 b\m were at higher risk of death 4.4%. (Chi-square = 25.1, p < .001).
On the other hand, for patients who had CHF, the next important predictor was split at node 11 into two nodes, 17 and 18 for systolic blood pressure. It was demonstrated that patients who had a reading of > 139 mmHg were at high risk of death status 10.5%. (Chi-square = 9.71, p = .017). The next important predicted risk factor was the governorates (geographic location) of patients since it was found that patients who were living in Irbid, Ajloun, Jerash, Balqa’, Amman, Madaba, Tafilah, and Aqaba had a higher death rate of 26% compared to those who were living in Mafraq, Zarqa’, Karak, and Maan 16%. (Chi-square = 21.62, p = .007). The last node was related to age since the model demonstrated that men who were aged > 65 years were at higher risk of death 4.95% rather than those who were aged between 50 and 64 years and who were aged less than ≤ 50 years. (Chi-square = 25.1, p < .001).
To sum up, pulse oximetry, medical diagnosis, pulse pressure, pulse (heart rate), systolic blood pressure, governorates, and age were the predicted risk factors ranked from the most to the least important (Figure 2). Predicted risk factors ranked from most to least important.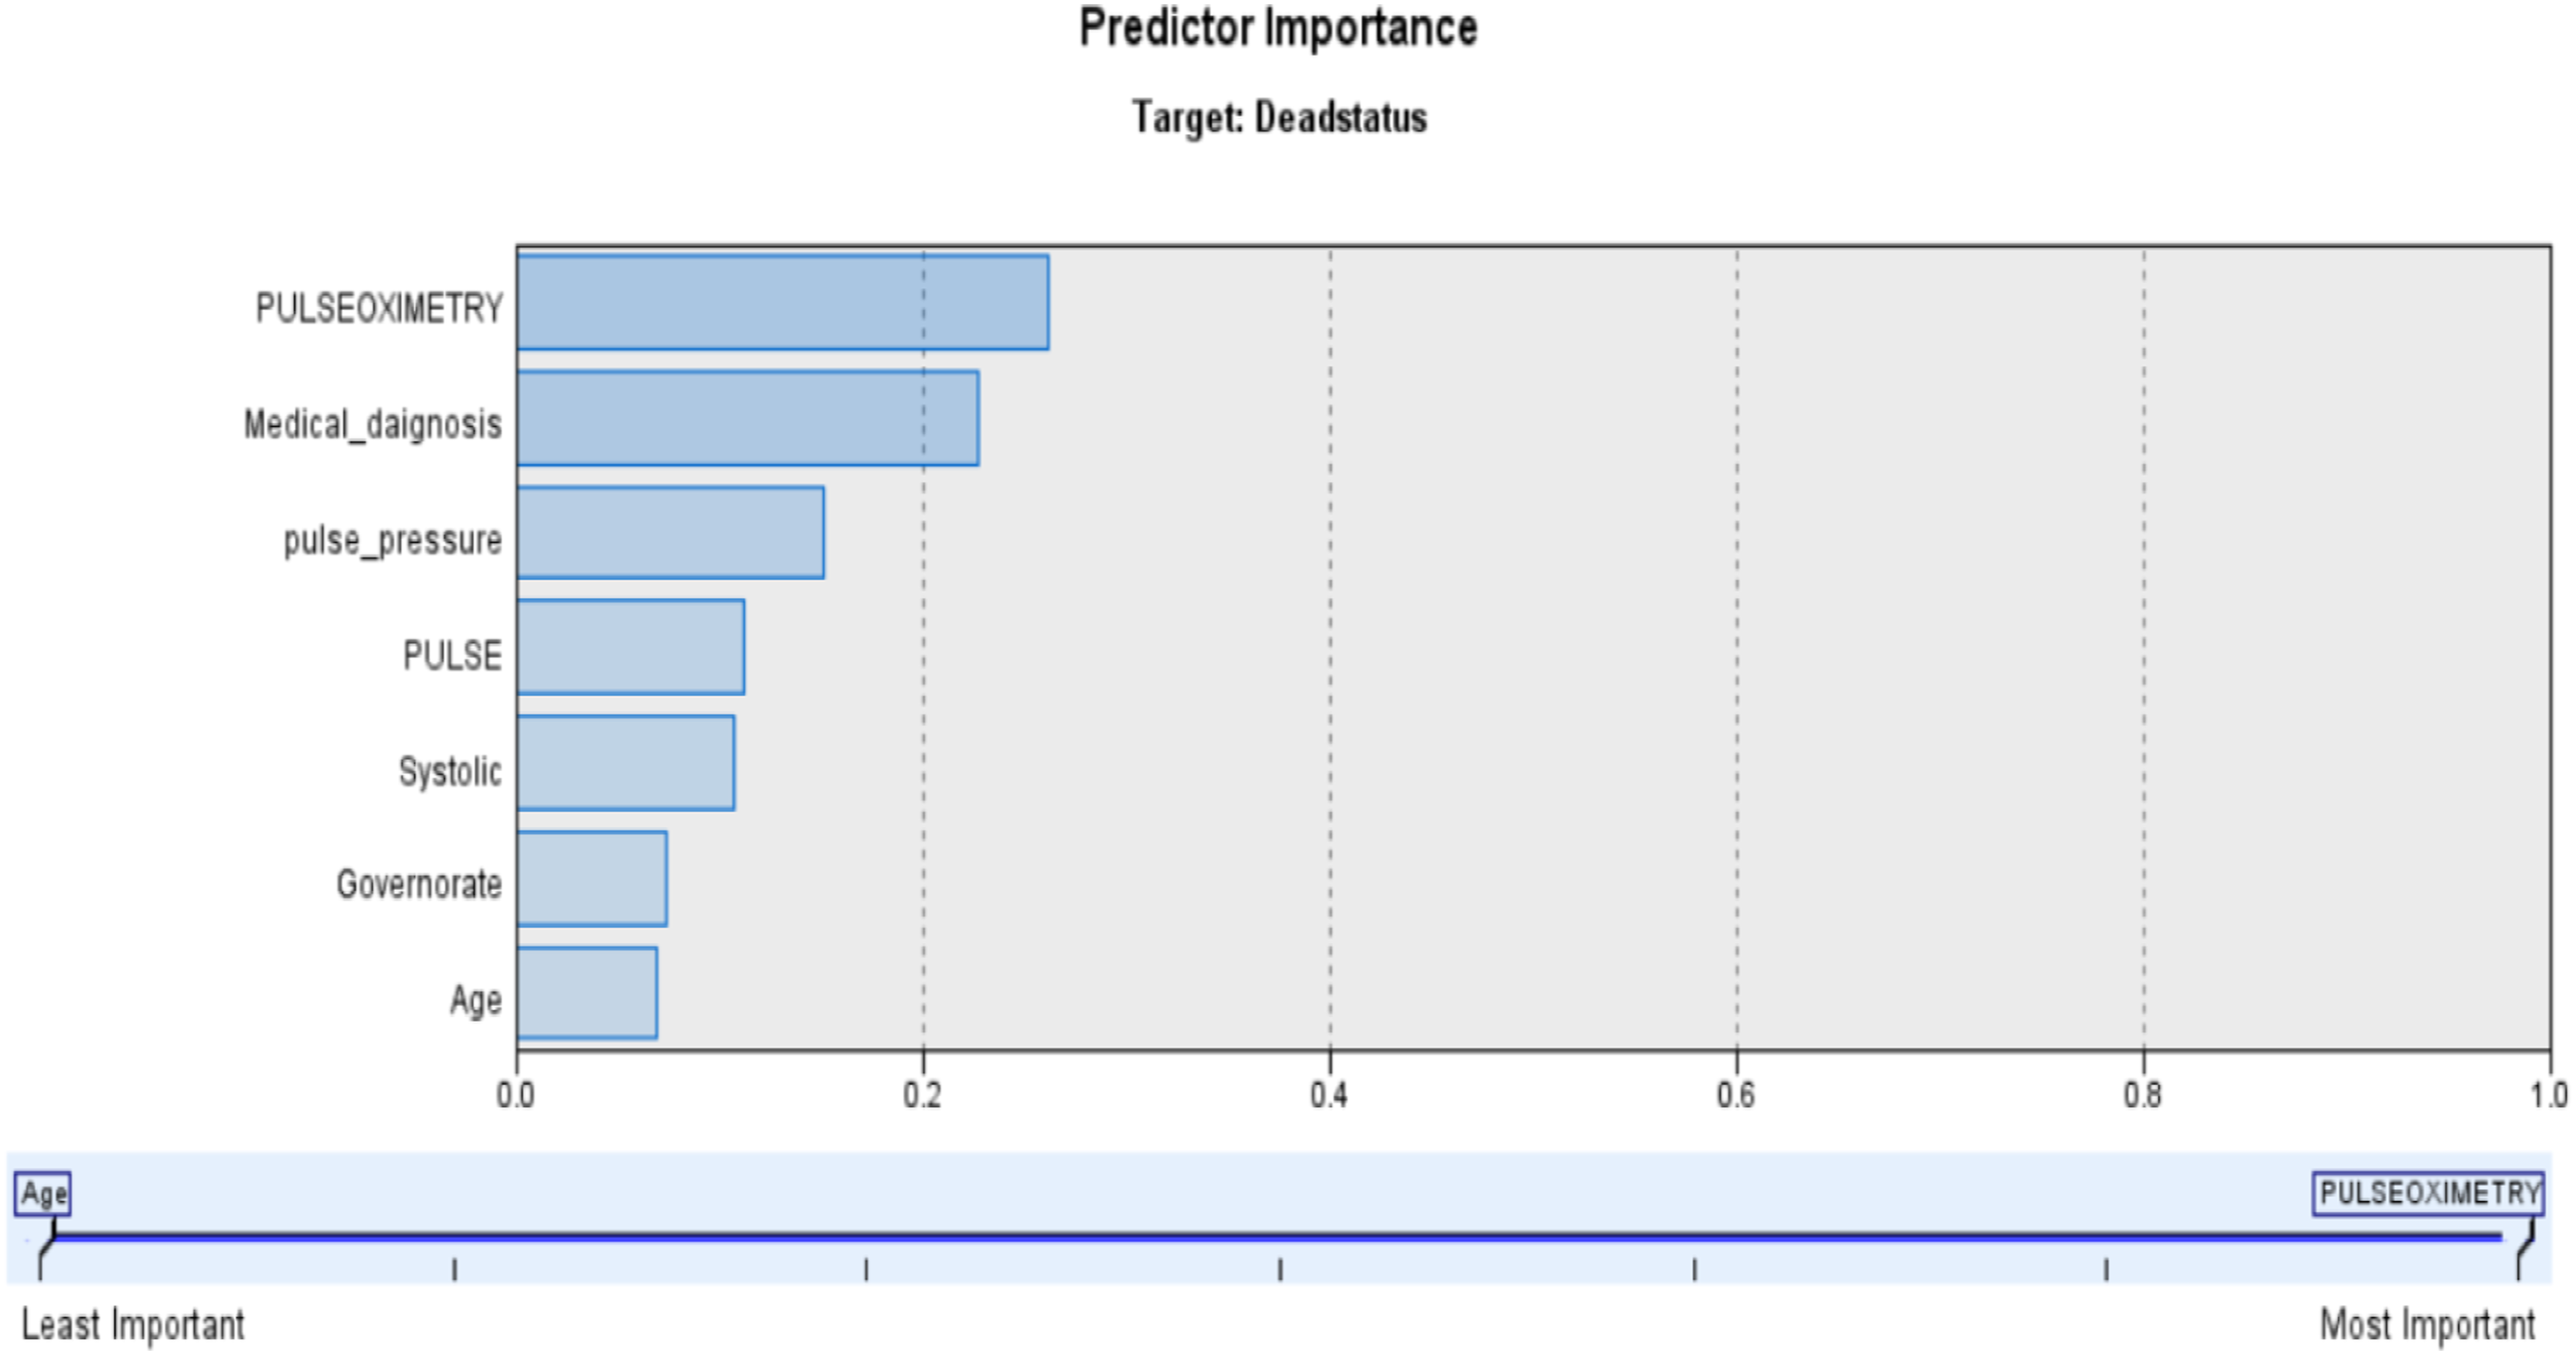
Discussion
Several variables were found to be associated with the prediction of heart attacks in males in Jordan. We found in this study that the hidden data pattern utilizes the provided data to construct a model of CHAID that is a component of decision trees, allowing for a graphical presentation and facilitating the interpretation of the logistic analysis. The CHAID model’s ease of interpretation and proficiency in handling categorical variables make it especially well-suited for use in clinical settings. Furthermore, it creates a decision tree based on predictor variables that best distinguish outcomes, graphically dividing data into mutually exclusive groups or nodes. Its tree-like structure makes it easy for clinicians to understand, even if they are not familiar with advanced statistical ideas. Additionally, in a CHAID tree, each path from the root to a leaf denotes a distinct set of predictor circumstances that result in a certain result. This clear tracing facilitates comprehension of the several elements that influence mortality risk, making it easy to justify the reasoning behind particular medical interventions. 23 CHAID model can be used as a risk assessment tool, personalized patient management through targeted intervention, and continuous improvement and adaptation by iterative refinement and feedback loop to ensure that the findings are aligned with real-world outcomes.
In this study, data were retrospectively extracted from electronic health records and used to predict the death or survival status of Jordanian men with heart attacks. Pulse oximetry, medical diagnosis, pulse pressure, heart rate, systolic blood pressure, living place (governorates), and age were found to be the most important predictors of heart attack among Jordanian men, ranked from most to least responsible.
Pulse oximetry refers to the methods used to assess oxygen saturation level in a person’s blood. 24 It was found that men who had lower oxygen saturation were at higher risk of developing heart attacks rather than those who had normal oxygen saturation. This result was consistent with the findings of 25 who found that low oxygen saturation affects the body, particularly the heart muscle, which cannot receive adequate oxygen levels, resulting in sudden blockage and eventual death. Using supervised machine learning on a large dataset of echocardiograms and several preprocessing techniques, 94.7% accuracy was achieved in this study.
Medical diagnosis is the second predictor, as patients with a history of heart disease, such as acute coronary syndrome or heart attack, are more likely to die than those with a healthy condition. Shah, Molsberry 26 Shah et al. (2020), who assessed the heterogeneous trends of heart disease death rates according to subtypes in the United States from 1999 to 2018, found that heart failure and hypertension were the leading causes of premature death in black men.
Pulse pressure, also known as the difference between systolic and diastolic blood pressure, is the third most significant risk factor for death among male heart attack patients. Numerous studies suggest that pulse pressure is an important predictor of cardiovascular disease.27,28 This finding was consistent with a study conducted by Franklin, Khan, 29 which demonstrated that heart attack and coronary heart disease patients were associated with pulsatile large-artery stiffness during systole, which was reflected by an increase in pulse pressure reading compared to the steady-state of resistance during diastole, which was associated with an increase in both systolic and diastolic blood pressure.
At the fourth level, the leading cause of death among Jordanian men was heart rate. As heart rate is a major determinant of oxygen consumption in patients with coronary heart disease, it was found in the current study that an increasing heart rate was associated with the development of a heart attack or myocardial infarction. This was following the findings of other studies30,31 where they reported that hemodynamic variability concerning increased heart rate has a direct impact on the arterial wall which promotes the development of atherosclerosis plaque.
Systolic blood pressure was the subsequent predictably significant risk factor. High blood pressure, particularly the systolic reading, is associated with numerous complications, including cardiovascular and kidney diseases, as well as death. 32 This result was consistent with the finding of a study that was conducted by 33 who reported that high systolic blood pressure of ≥ 120 mmHg was associated with an increase increased mortality caused by heart attack among men. Logically, a heart attack happens when blood flow is blocked due to the rise in blood pressure a study done by He and MacGregor 34 concluded that raising systolic blood pressure is responsible for about 50% of coronary heart diseases such as heart attack.
The governorate or living status was the final predictable risk factor of death versus life status for developing a heart attack. Men who lived in Irbid, Ajloun, Jerash, Balqa’, Amman, Madaba, Tafilah, and Aqaba were at higher risk of developing coronary heart disease such as heart attack. the mentioned places were large cities in Jordan with a crowded aggregation of men who worked in different industrial jobs. This finding contradicts a study conducted in the United States, which reported that cardiovascular mortality rates in rural areas were significantly higher than in urban cities and that black men living in rural areas could be associated with poor risk outcomes due to a high risk of heart attack and limited access to medical care. The findings of the present study indicate that urban men are at a higher risk for heart attacks, which may be related to their low socioeconomic status and overcrowding, which increases the burden of air pollution.
The final significant risk factor was age, as it was found that men older than 65 were at a greater risk of developing heart attacks leading to death. This result was consistent with a study that was conducted by Odden, Coxson 35 who reported that there was an unprecedented increase in the age of 65 years among the population in the United States which led to a substantial increase in coronary heart disease and heart attack. Furthermore, other studies reported that in the United States, the average age for a first heart attack among men is 65. 36
In the context of predicting mortality among men with heart diseases using various algorithms, the performance disparity between these algorithms can be influenced by several factors, including the nature of the data, the algorithms’ inherent biases and strengths, and the complexity of the underlying patterns associated with the outcomes.
In the current study, algorithms like the CHAID model might outperform simpler models like Logistic Regression and SVM due to their ability to model complex, non-linear relationships and interactions between heart disease features. For instance, heart disease outcomes are influenced by a complex interplay of factors such as age, genetics, lifestyle choices, and other comorbidities. Ensemble methods that aggregate decisions from multiple models can capture these intricate patterns more effectively than linear models, which assume independence between predictors. 37 Conversely, deep learning models, despite their capacity for capturing highly non-linear interactions, might not significantly outperform tree-based ensemble methods in this context due to the relatively small size of datasets typical in heart disease, their need for extensive data to learn effectively, and the challenge of interpreting their predictions.
Implications of findings
The conclusions from comparing algorithm performance have significant ramifications. If ensemble approaches regularly outperform others, their application in clinical decision-support systems may increase, potentially leading to more accurate prognoses and individualized treatment plans in the context of predicting heart disease. However, the trade-off between model complexity and interpretability must be considered, particularly in medical applications where understanding the reasoning behind predictions is critical for trust and ethical decision-making.
Additionally, SHAP (SHapley Additive exPlanations) values help bridge the gap between accuracy and interpretability by quantifying the contribution of each feature to the prediction of each instance. In the context of heart disease mortality prediction, SHAP values can reveal which features (e.g., cholesterol levels, blood pressure, smoking status) are most influential for models predicting death versus life. This not only aids in model interpretation but also aligns with clinical expectations and knowledge, thereby validating the model’s utility.
Any abnormalities or unexpected outcomes, such as a basic model outperforming more complicated ones in specific settings, require further research. These could be due to overfitting in sophisticated models, anomalies in the dataset, or previously ignored simple patterns that are highly predictive of outcomes. Such findings have the potential to challenge established assumptions and drive a re-evaluation of model selection criteria in predictive healthcare analytics.
Additionally, a fast-developing field of medical research is the convergence of common health measurements with digital medicine, especially for the management and prognosis of chronic disorders such as IHD. As non-invasive monitoring technologies and data analytics advance they enable more individualized and preventative healthcare methods. Another important factor to consider is the worldwide impact of IHD. The substantial number of illnesses and deaths globally, especially among younger adults aged between 25 and 49 years, is highlighted by recent data. By providing earlier and more accurate diagnoses, these technologies and analytical techniques have the potential to improve patient outcomes as well as our understanding of the epidemiological trends of diseases like IHD. This substantial move towards better health is represented by the combination of sophisticated predictive analytics with routine health measures. 38
Strengths and limitations
This research contributed to numerous strength issues. Firstly, this is the first study to use the CHAID model as a part of the design structure to classify and rank the predictability of heart attack risk factors among Jordanian men, which could aid primary care physicians in following the clinical sequences and ultimately making an accurate determination of the patient’s status. Tobacco use, body mass index, and socioeconomic status are examples of potential variables that could influence the development of coronary heart disease that were unable to be extracted from this study. In addition, the extracted data from the electronic system is highly noisy, inconsistent, and incomplete, necessitating extensive preprocessing. Lastly, regarding the variables of pulse oximetry and blood pressure, it was noted that a single reading of these hemodynamic variables can vary significantly, so a single reading does not accurately reflect a patient’s average pulse oximetry or blood pressure. To assess the impact of within-patient variability, repeated measurements are recommended.
Conclusion
Men are twice as likely as women to suffer a heart attack. In this study, variables were extracted from large-scale electronic health records. Heart attack complaints were presented alongside demographic characteristics and hemodynamic readings as the primary risk factors predicted by machine learning algorithms such as the CHAID model. Consequently, machine learning applications can accurately predict cardiovascular conditions to prevent fatal complications such as heart attacks.
Footnotes
Author contributions
SBH: Conceptualization, methodology, discussion, and initial drafting; MA: Data analysis, supervision, and final drafting.
Declaration of conflicting interests
The author(s) declared no potential conflicts of interest with respect to the research, authorship, and/or publication of this article.
Funding
The author(s) received no financial support for the research, authorship, and/or publication of this article.
Institutional review board statement
The Committees of Scientific Research and Ethics of Research at the School of Nursing/The University of Jordan and the Ethics Committee at the Ministry of Health (MOH) (#MOH/REC/2022/3) approved the ethical conduct of the study.