
Abstract
To assess the diagnostic utility of bone turnover markers (BTMs) and demographic variables for identifying individuals with osteoporosis. A cross-sectional study involving 280 participants was conducted. Serum BTM values were obtained from 88 patients with osteoporosis and 192 controls without osteoporosis. Six machine learning models, including extreme gradient boosting (XGBoost), light gradient boosting machine (LGBM), CatBoost, random forest, support vector machine, and k-nearest neighbors, were employed to evaluate osteoporosis diagnosis. The performance measures included the area under the receiver operating characteristic curve (AUROC), F1-score, and accuracy. After AUROC optimization, LGBM exhibited the highest AUROC of 0.706. Post F1-score optimization, LGBM’s F1-score was improved from 0.50 to 0.65. Combining the top three optimized models (LGBM, XGBoost, and CatBoost) resulted in an AUROC of 0.706, an F1-score of 0.65, and an accuracy of 0.73. BTMs, along with age and sex, were found to contribute significantly to osteoporosis diagnosis. This study demonstrates the potential of machine learning models utilizing BTMs and demographic variables for diagnosing preexisting osteoporosis. The findings highlight the clinical relevance of accessible clinical data in osteoporosis assessment, providing a promising tool for early diagnosis and management.
Keywords
Introduction
Although osteoporotic fractures are a major cause of death in the elderly, osteoporosis shows no specific symptoms until a fracture occurs. 1 South Korea has a higher prevalence of osteoporosis than Western countries,2,3 and the mortality rate of osteoporotic hip fractures has been increasing for at least 5 years. 4 Therefore, an early diagnosis of osteoporosis is important for identifying and treating patients at a high risk of fracture. The gold standard for diagnosing and evaluating osteoporosis is bone mineral density (BMD) analysis.5,6 Osteoporosis is defined as a BMD 2.5 standard deviations below the young healthy adult mean (t-score ≤ −2.5). 7 Osteoporosis is a disease characterized by bone fragility, which is determined by examining the bone microarchitecture, microdamage, and bone remodeling rate.6,8 Dual-energy X-ray absorptiometry (DEXA) is widely used for diagnosing osteoporosis, but it is expensive. 9 On the other hand, bone remodeling is determined by bone resorption and formation, 10 which can be evaluated using various bone turnover markers (BTMs). 11 Bone formation biomarkers include bone alkaline phosphatase (BAP), osteocalcin (OC), and procollagen type 1 N-terminal propeptide (P1NP), while bone resorption biomarkers include hydroxyproline, hydroxylysine, deoxypyridinoline, pyridinoline, carboxyl-terminal crosslinked telopeptide of type 1 collagen (CTX), and amino-terminal crosslinked telopeptides of type 1 collagen (NTX). These BTMs are useful for early detection of osteoporosis and may be more effective in combination with BMD analysis.
Machine learning is greatly impacting various fields and allows to discover previously unknown patterns by training on data, creating models, and making predictions.12–17 Several machine learning algorithms (e.g., support vector machine—SVM, random forest—RF, boosting models) are being used in domains such as biology, genomics, and toxicology.18–20 The relation between machine learning models and the numeric nature of the results from blood tests is unclear, but is considered applicable to osteoporosis screening. 21 In this study, we developed a machine learning model for osteoporosis diagnosis based on BTMs (i.e., P1NP, OC, BAP, CTX, and NTX). We also determined the importance of various biomarkers in osteoporosis diagnosis and derived new parameters to increase the predictive power for osteoporosis. The proposed machine learning model based on various BTM values can contribute to diagnose osteoporosis and predict fracture risk.
Methods
Patients and data collection
We retrospectively examined serum samples from 88 patients with osteoporosis and 192 patients without osteoporosis from June to October 2019. Among the 88 patients with osteoporosis, 6 (6.8%) were male and 82 (93.2%) were female. Among the 192 patients without osteoporosis, 30 (15.6%) were male and 162 (84.4%) were female. Patients under 40 years old were excluded from this study. The diagnosis of osteoporosis was obtained from BMD analysis (osteoporosis group, T-score ≤ −2.5; non-osteoporosis group, T-score > −2.5). In this study, there were no missing values for the bone turnover markers (BTMs) used in the analysis. The dataset was carefully curated to ensure that all the data points for the selected parameters, including sex, age, and the specific BTMs (P1NP, OC, BAP, CTX, and NTX), were complete and available for all participants. Thus, there was no need for imputation or management of missing data. We used the COBAS e411 analyzer (Roche Diagnostics, Rotkreuz, Switzerland) to measure P1NP, OC, and CTX, UniCel DxI 800 system (Beckman Coulter, Brea, CA, USA) to measure BAP, and ELx800 reader (BioTek, Winooski, VT, USA) to measure NTX. We curated the dataset and selected seven parameters (i.e., sex, age, P1NP, OC, BAP, CTX, and NTX) based on osteoporotic features (BMD results). We expressed the osteoporosis and non-osteoporosis cases as categorical variables (output variables) based on the DEXA score of −2.5. Sex, age, and the selected BTMs (i.e., P1NP, OC, BAP, CTX, and NTX) were used as input variables for modeling.
Statistical analyses
The sample size for this study was determined through a power analysis for logistic regression models. Our objective was to attain a sufficient sample size to detect statistically significant differences in the performance of machine learning models in predicting osteoporosis using BTMs. Given the expected effect size, significance level (α), and desired statistical power (1–β), the sample size was calculated using established formulas for logistic regression. Specifically, we selected a significance level (α) of 0.05, corresponding to a 95% confidence level, and a desired statistical power (1–β) of 0.80. The expected effect size was estimated via preliminary data analysis. This sample-size calculation allowed us to ensure that the study had adequate statistical power to detect meaningful differences in model performance. The final sample size of 280 patients (88 with osteoporosis and 192 without osteoporosis) was deemed sufficient to meet the study objectives and yield meaningful results. Categorical variables were analyzed using the chi-square test. Numerical variables, such as age and BTM levels, were expressed as the mean ± standard deviation and analyzed using Student’s t-test. Linear correlations between BMD t-scores and BTMs were analyzed using the Spearman correlation. All statistical analyses were performed using IBM SPSS ver. 26.0 (SPSS, Chicago, IL, USA).
Machine learning model selection and development
In this study, we employed various machine learning models to predict osteoporosis using BTMs and clinical variables. The choice of machine learning models was based on the nature of the dataset and the objectives of the study. We selected machine learning models known for their effectiveness in classification tasks and their ability to handle both numerical and categorical data. The chosen models included extreme gradient boosting (XGBoost), light gradient boosting machine (LGBM), CatBoost, random forest (RF), support vector machine (SVM), and k-nearest neighbors (KNN). XGBoost is a widely used ensemble learning algorithm known for its good performance in classification tasks. It is robust to overfitting and can handle various data types, making it suitable for our dataset with both numerical and categorical variables. LGBM is another ensemble learning algorithm that excels in handling large datasets and is optimized for speed and efficiency. It is particularly effective for solving classification problems. CatBoost is a gradient boosting algorithm designed to handle categorical features efficiently. Given that our dataset included categorical variables such as sex, CatBoost was selected for its ability to work well with such data. RF is an ensemble learning method that combines multiple decision trees to make predictions. It is known for its versatility and robustness in handling various data types. SVM is a traditional machine learning algorithm that can be effective in binary classification tasks. We included it as a reference model to compare its performance with that of the ensemble models. KNN is a simple yet effective algorithm for classification tasks that relies on similarity measures between data points. It was included to assess its performance on our dataset.
We applied two optimization processes to improve the performance of the machine learning model. The area under the receiver operating characteristic curve (AUROC) was first optimized using hyperparameter tuning and feature extraction. As our data were not balanced (osteoporosis:non-osteoporosis cases, 82:192), F1-score optimization was also performed through cutoff adjustment and hyperparameter tuning. Hence, an ensemble model with improved performance was obtained. The ensemble model used soft voting to assign different weights to the results of the models. The optimal model was obtained by adjusting the cutoff.
Performance measurement
The F1-score, accuracy, and AUROC were used as performance measures. The model performance was evaluated using AUROC analysis through an implementation based on the “scikit-learn” Python library.
Feature extraction
Feature extraction is important for improving the performance of machine learning models. We analyzed the results for five BTMs (i.e., P1NP, OC, BAP, CTX, and NTX) and derived variables using the ratios between pairs of BTMs (e.g., NTX/P1NP, NTX/BAP, NTX/OC, and P1NP/BAP) to develop the machine learning model.
Feature importance
We used the feature importance technique to investigate the contribution of different parameters to the model predictive performance. We analyzed all the parameters including the extracted features and analyzed the importance of the features.
Data normalization
As preprocessing to train the machine learning model, the range of columns of the BTM data was normalized and scaled using the scikit-learn library in Python.
We investigated various machine learning models in this study, namely, tree-based models (i.e., LGBM, CatBoost, XGBoost, and RF) as well as the KNN and SVM models. Scaling was necessary for machine learning models in addition to the tree-based models. Because we also developed the KNN an SVM models, scaling was applied as part of preprocessing. Scaling is often necessary for preprocessing in non-tree models because these models are typically sensitive to the scale of input features expressed as numerical data. Non-tree models, such as the KNN algorithm, logistic regression, SVM, and neural networks, optimize the feature weights to make predictions. By scaling the input features to a similar range, optimization assigns similar weights to all the features (parameters) and prevents any feature from dominating prediction. Generally, scaling is an important preprocessing step in non-tree models to ensure that the input features are uniform, likely improving the model performance and diagnosis accuracy.
Stratified k-fold cross-validation
We applied stratified k-cross-validation to the models, trained on data from patients with osteoporosis, to obtain the output variable (osteoporosis), aiming to predict consistently across every fold. Due to the relatively small dataset (280 cases), we employed the “out of fold” method to divide the entire dataset into training and testing sets. Tenfold cross-validation, a widely recognized and robust approach for internal model validation, entails dividing the dataset into 10 subsets (folds). Each fold serves as a validation set once, while the remaining nine folds are used for model training. This process is repeated 10 times, ensuring each fold serves as a validation set exactly once. The results from these 10 iterations are then averaged to obtain a more reliable estimate of model performance. The selection of tenfold cross-validation aligns with best practices for model validation when dealing with relatively small datasets, allowing for the assessment of model performance while mitigating the risk of overfitting to the training data. While external validation with entirely independent datasets would have been ideal, the limited availability of such datasets in our research setting necessitated reliance on robust internal validation methods. Thus, a k-fold cross-validation sensitivity analysis22–26 was applied to improve the model performance.
Results
Patient characteristics and BTMs
Clinical characteristics and bone turnover marker values of osteoporosis and non-osteoporosis groups.
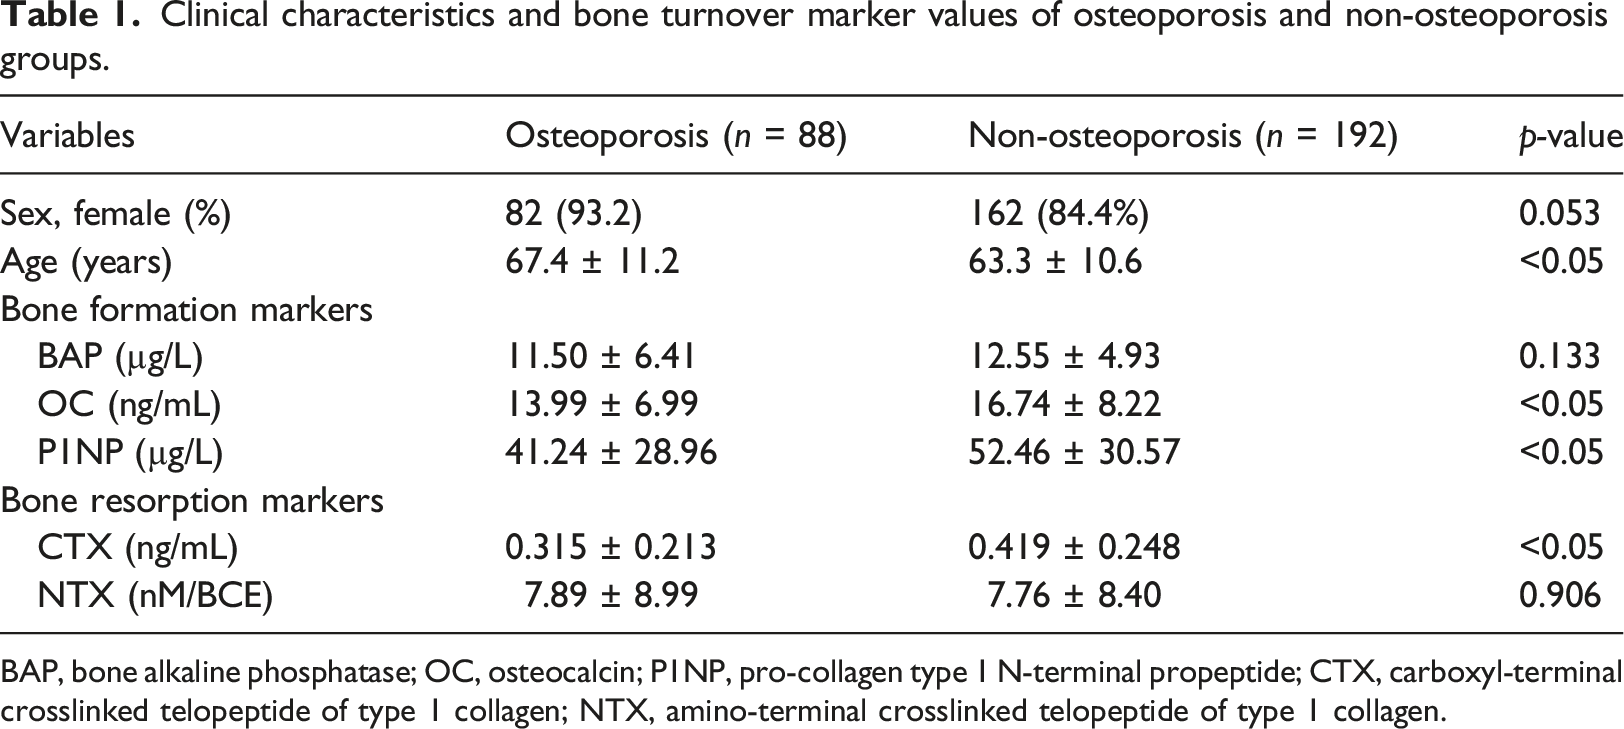
BAP, bone alkaline phosphatase; OC, osteocalcin; P1NP, pro-collagen type 1 N-terminal propeptide; CTX, carboxyl-terminal crosslinked telopeptide of type 1 collagen; NTX, amino-terminal crosslinked telopeptide of type 1 collagen.
Performance of machine learning models optimized by AUROC
Performance of each machine learning model by optimizing area under the receiver operating characteristic curve.
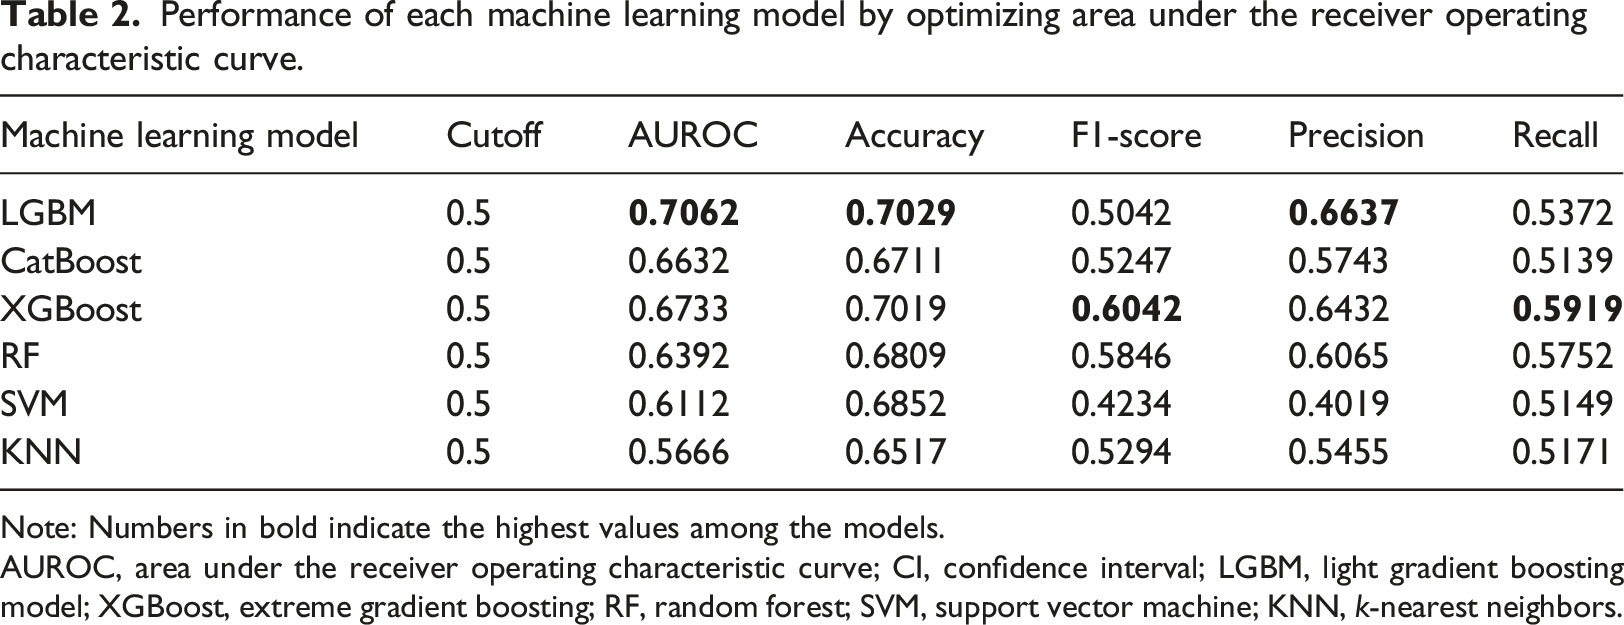
Note: Numbers in bold indicate the highest values among the models.
AUROC, area under the receiver operating characteristic curve; CI, confidence interval; LGBM, light gradient boosting model; XGBoost, extreme gradient boosting; RF, random forest; SVM, support vector machine; KNN, k-nearest neighbors.
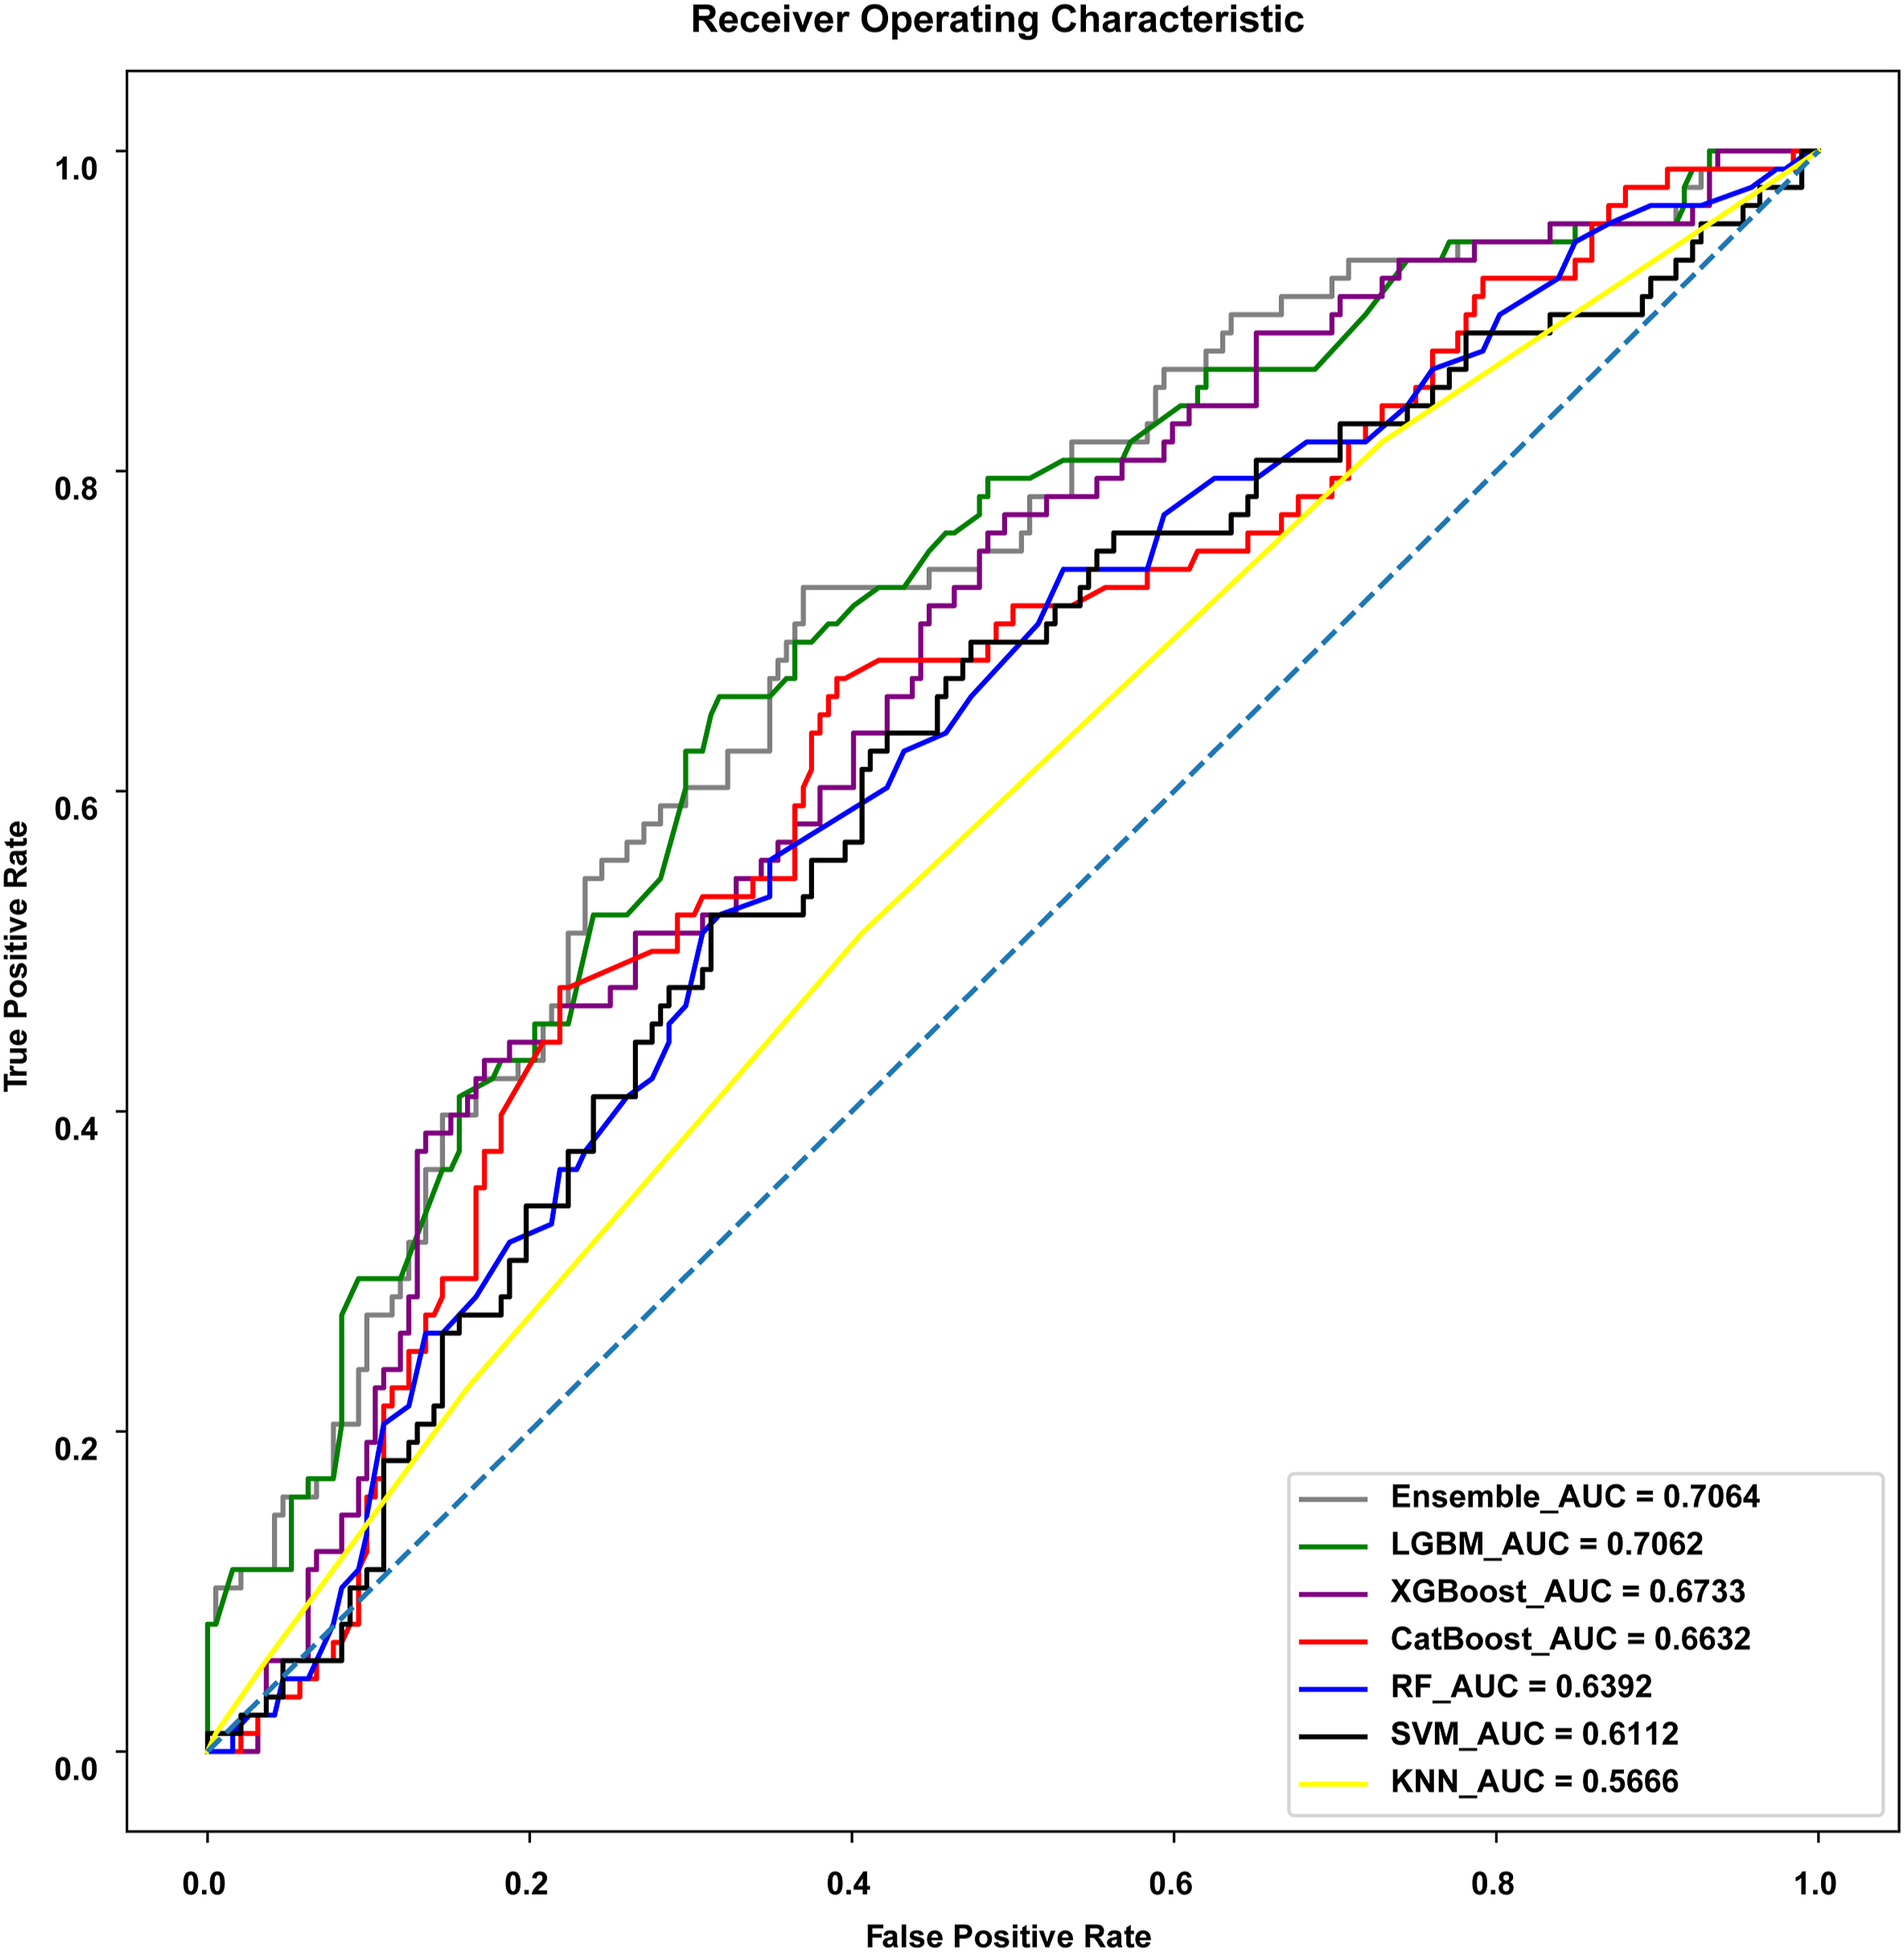
Area under the receiver operating characteristic curve (AUROC) of machine learning and ensemble models.
The AUROC of LGBM, a tree-based boosting model, was 0.7062, being the best among the evaluated machine learning models, followed by XGBoost (AUROC, 0.6733), CatBoost (AUROC, 0.6632), and RF (AUROC, 0.6392) (Table 2 and Figure 1). In addition, LGBM was the most accurate model (0.7029), followed by XGBoost (0.7019), SVM (0.6852), and RF (0.6809) (Table 2). Moreover, XGBoost showed the best F1-score of 0.6042.
Performance of machine learning models optimized by F1-score
Performance of machine learning and ensemble models by F1-score optimization.
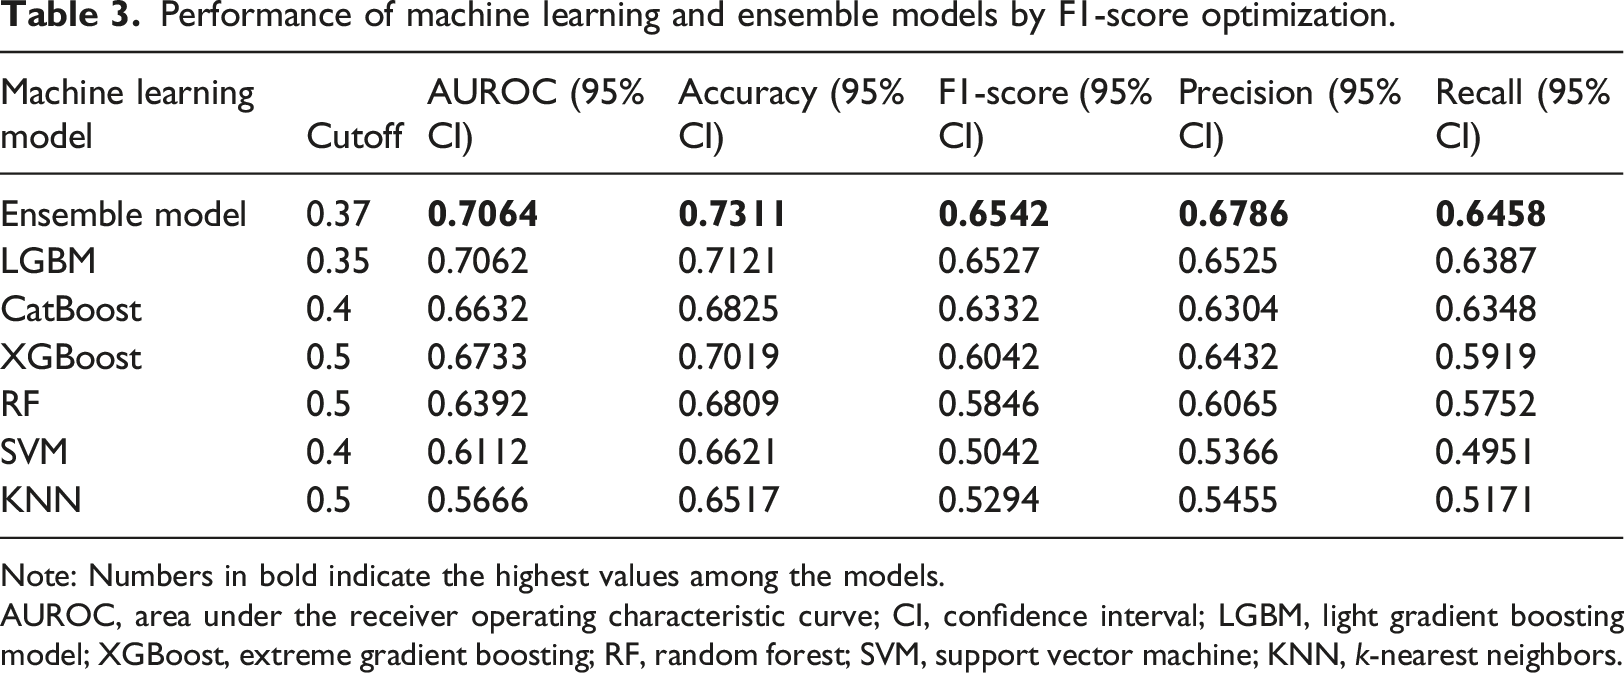
Note: Numbers in bold indicate the highest values among the models.
AUROC, area under the receiver operating characteristic curve; CI, confidence interval; LGBM, light gradient boosting model; XGBoost, extreme gradient boosting; RF, random forest; SVM, support vector machine; KNN, k-nearest neighbors.
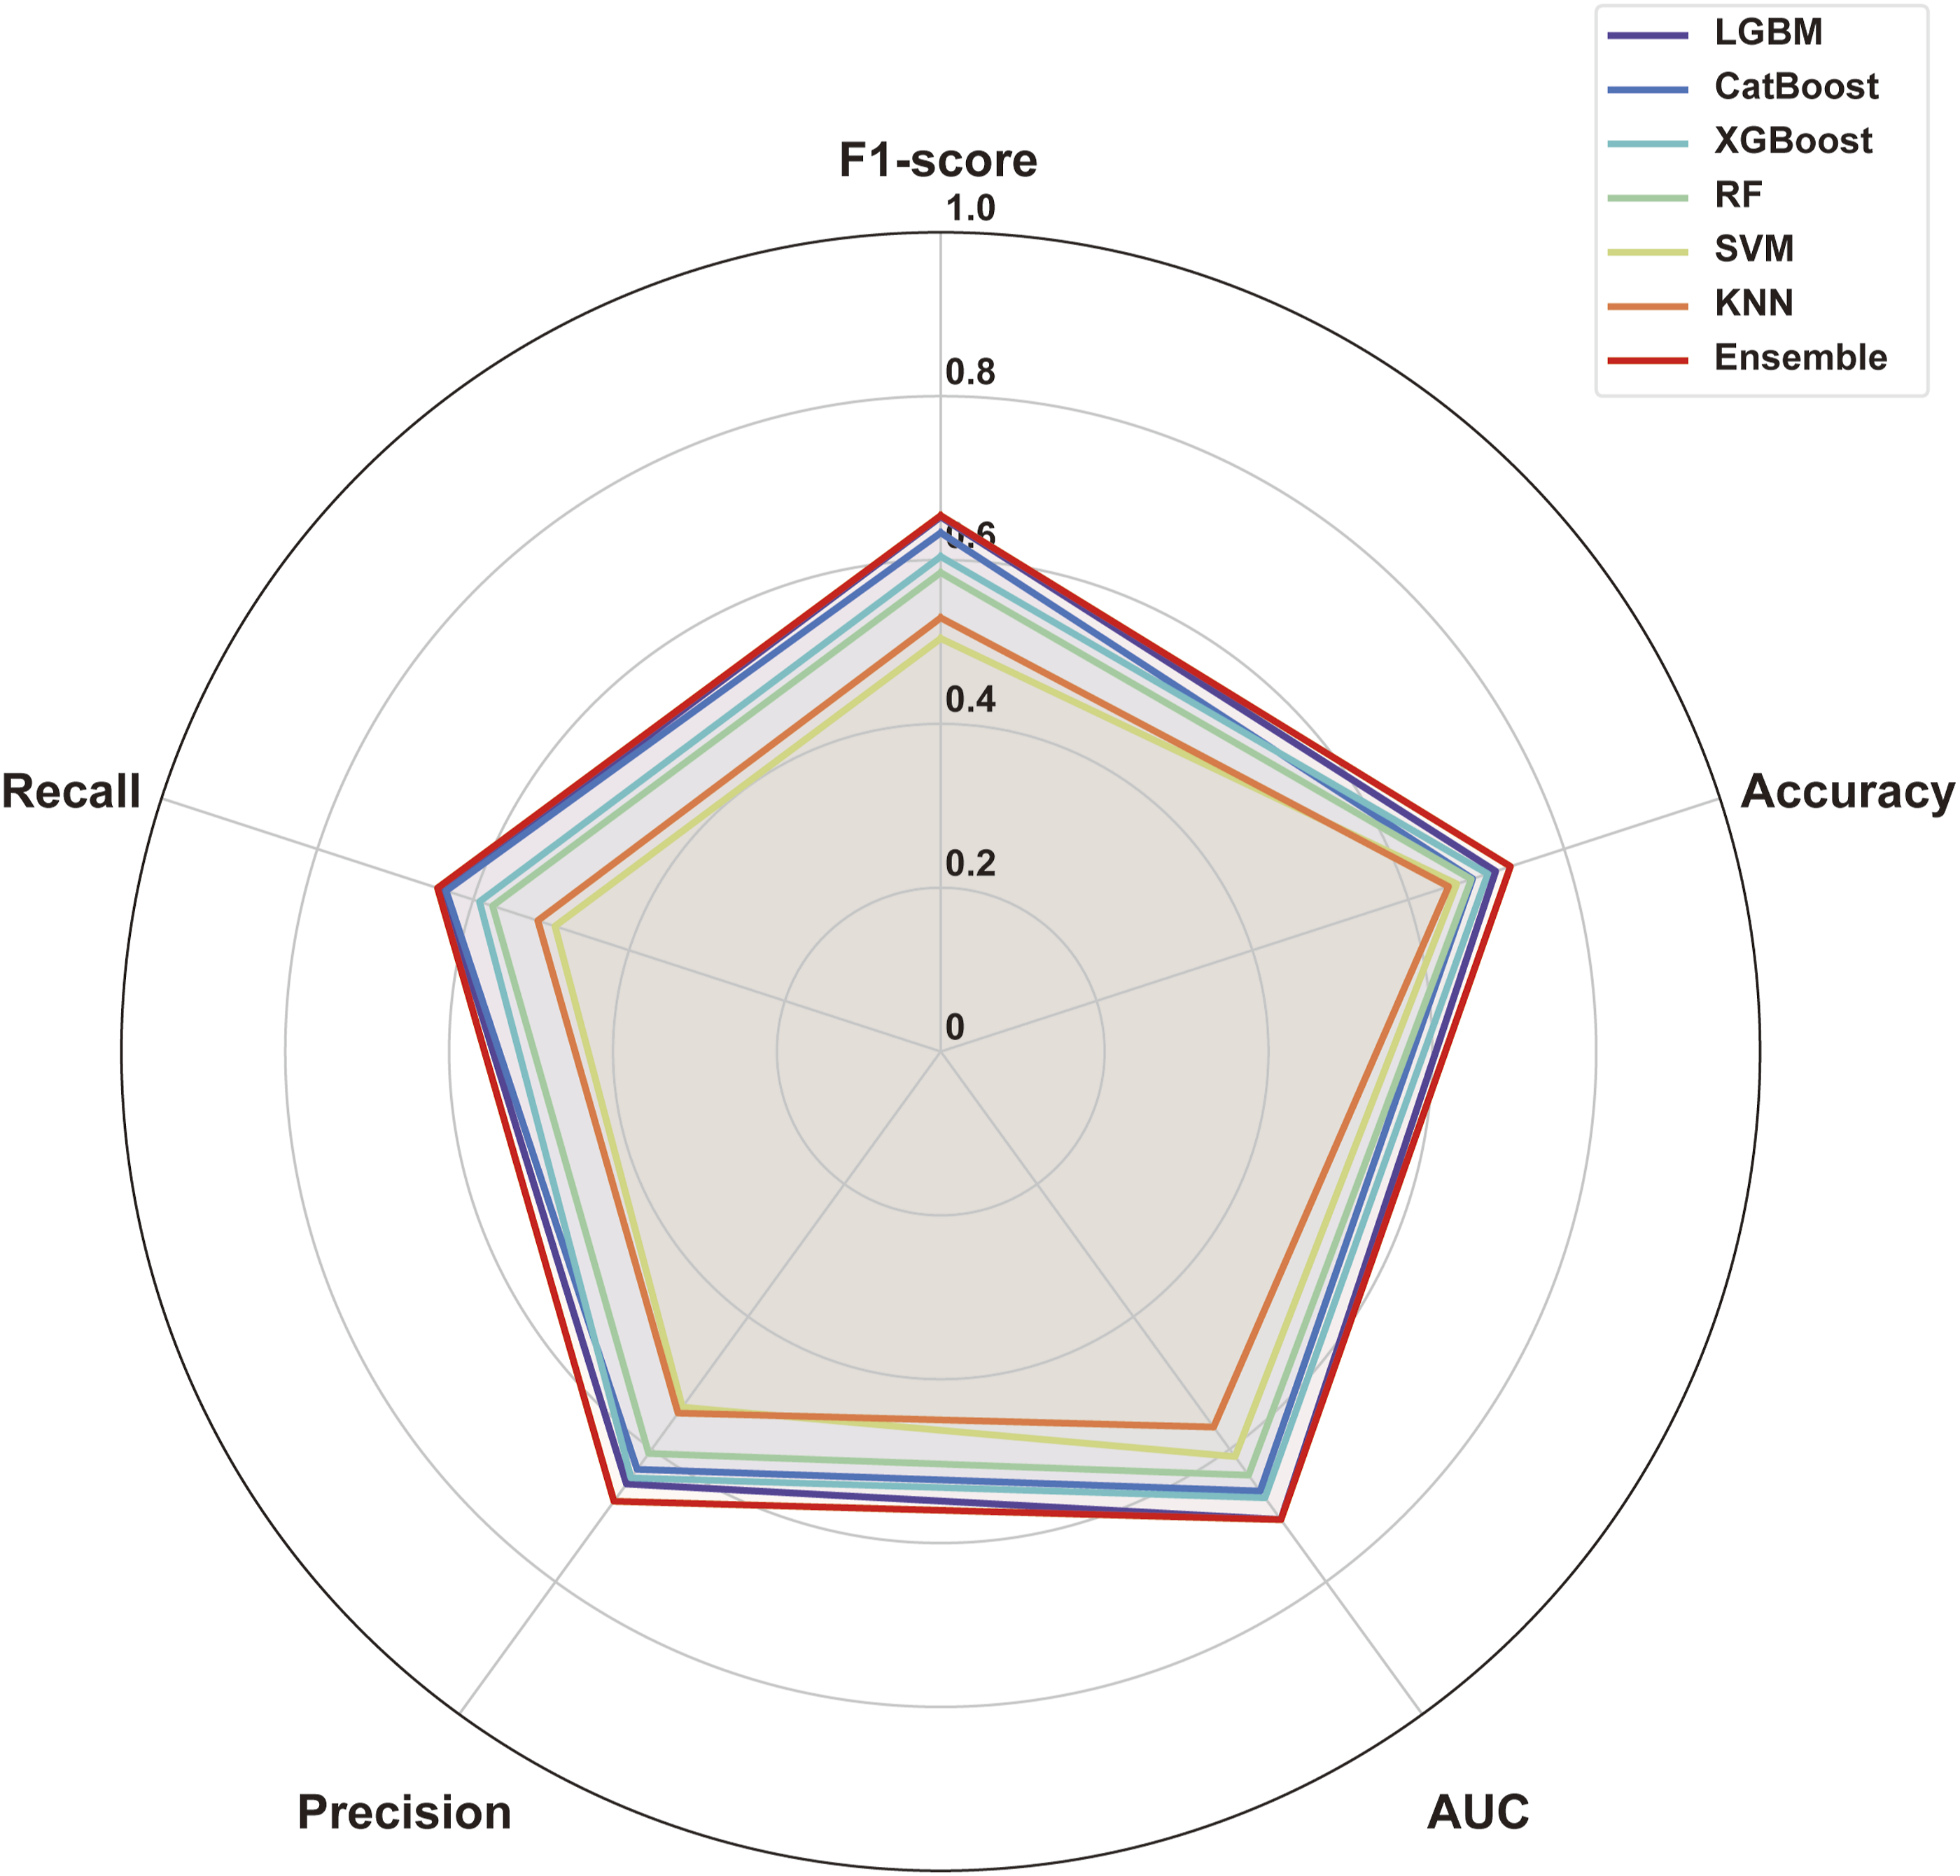
Performance of machine learning and ensemble models shown in a radar plot.
Performance of ensemble model
We selected three models (i.e., LGBM, XGBoost, and CatBoost) and blended them to develop an ensemble model, obtaining an AUROC of 0.7064, F1-score of 0.6542, and accuracy of 0.7311 (Table 3 and Figures 1 and 2).
Feature importance in machine learning models
We investigated the feature importance in LGBM, which provided the best performance, and in XGBoost and CatBoost, which provided reasonable performances. In LGBM, BAP had the highest feature impact, followed by CTX, P1NP, P1NP/BAP, and age. For CatBoost, P1NP had the highest impact, followed by age, BAP, sex, P1NP/BAP, and NTX/P1NP. In XGBoost, P1NP had the greatest impact, followed by sex, BAP, CTX, P1NP/BAP, and NTX/OC (Figure 3). Feature importance of (a) light gradient boosting machine (LGBM), (b) CatBoost, and (c) extreme gradient boosting (XGBoost).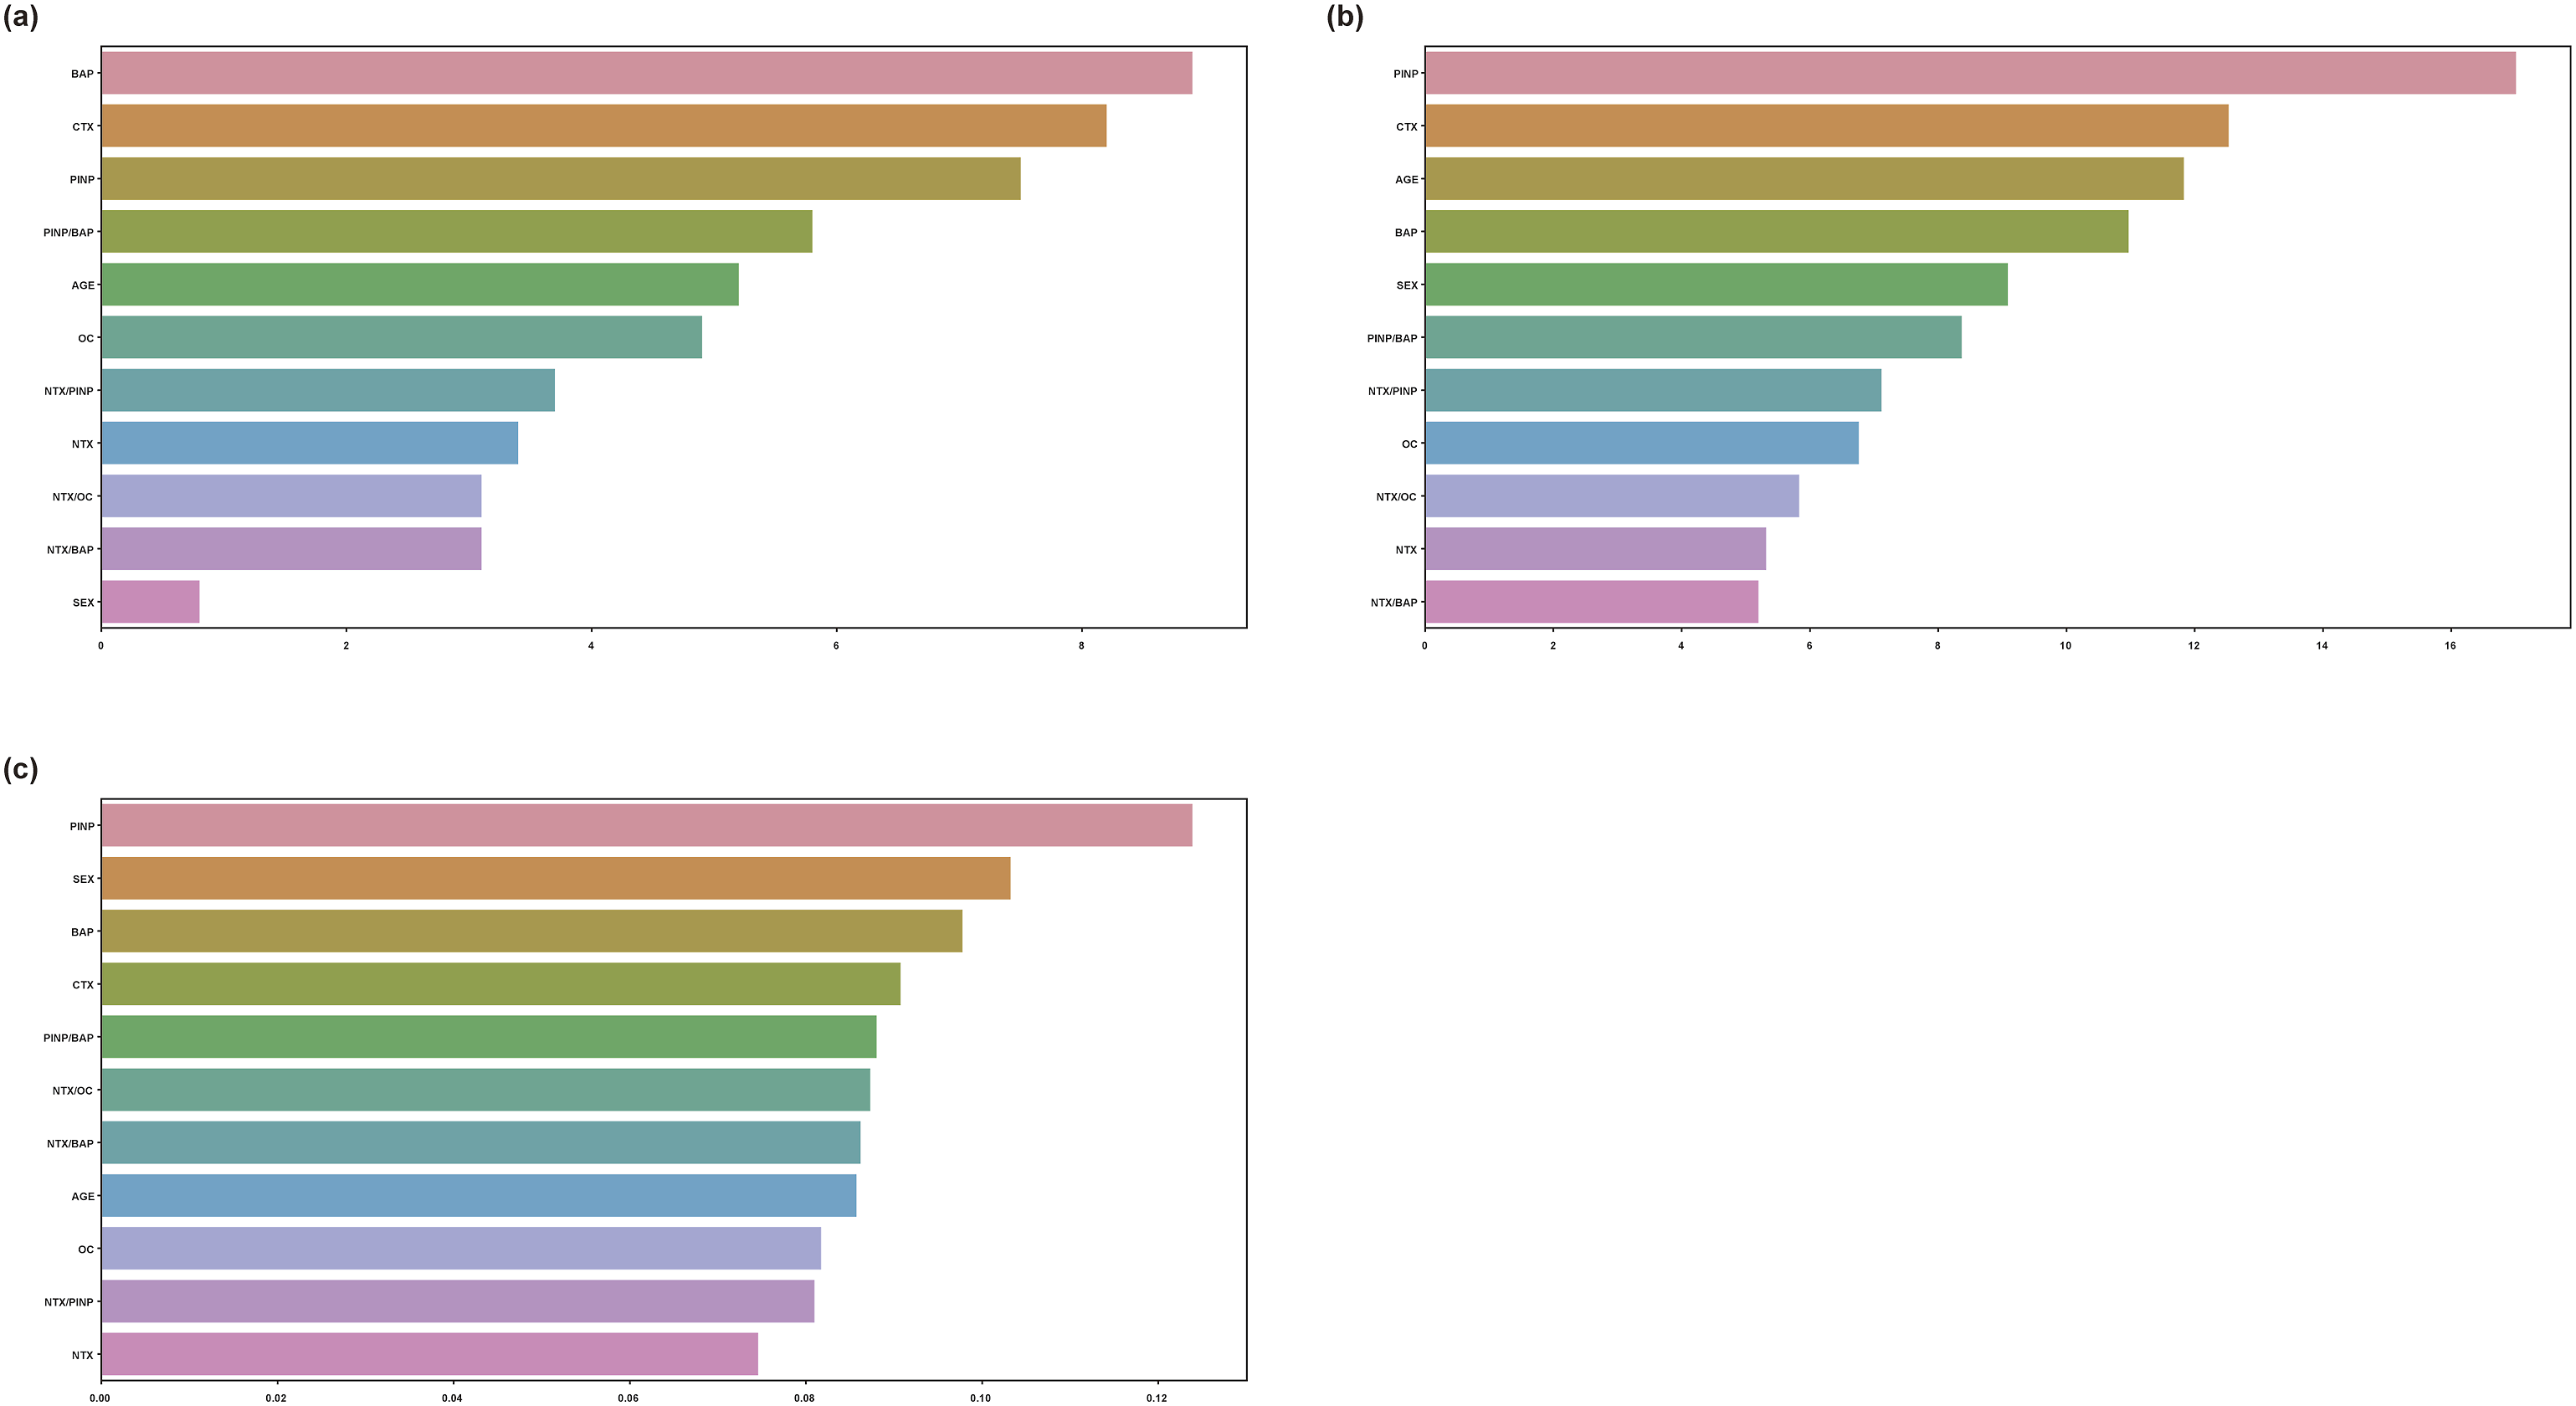
Parameter by feature extraction
We used only five BTMs to develop a machine learning model for predicting osteoporosis. To improve the model performance, we derived additional variables from the five BTMs. Of these, four parameters improved the performance of the machine learning model: NTX/OC, NTX/BAP, NTX/P1NP, and P1NP/BAP.
Discussion
Medical data come in various forms, including text, which physicians use when filling in patients’ medical records, audio, and image, such as chest computed tomography and magnetic resonance imaging scans. Most laboratory tests provide numerical data. We have previously examined disease prediction based on laboratory test results using artificial intelligence, deriving new parameters, and developing models through feature extraction. 21 In the present study, we developed machine learning models to predict osteoporosis using seven parameters: sex, age, P1NP, OC, BAP, CTX, and NTX. We also identified four new BTM-derived parameters (i.e., NTX/OC, NTX/BAP, NTX/P1NP, and P1NP/BAP) that contributed to optimize the machine learning models. Regarding feature extraction, the findings of the present study were consistent with our previous results. 21 Overall, our machine learning model performed well using tree-based models, particularly LGBM. The high AUROC confirmed the clinical utility of our model for predicting osteoporosis.
After evaluating the performance of the machine learning model in predicting osteoporosis, the overall accuracy was satisfactory (Table 2). Owing to the data imbalance between the osteoporosis and non-osteoporosis groups, we performed F1-score optimization using soft voting 27 and cutoff value adjustment, thereby improving the performance and significantly increasing the accuracy and F1-score. Data imbalance is common in controlled medical studies, and F1-score optimization can alleviate its adverse effects.
Machine learning tree-based models include bagging (e.g., RF) and boosting (e.g., XGBoost and LGBM) models.28–30 A bagging model creates multiple independent trees and trains them separately, while in boosting models, multiple trees look at and reflect on each other to improve the diagnosis performance; thus, errors are weighted. By reducing the rate of incorrect answers, error is mitigated because trees influence each other to achieve optimal performance.29,30
We improved the diagnosis performance through an ensemble model that integrated high-performance models.28,30 The ensemble model was implemented using weighted soft voting for three tree-based models (i.e., XGBoost, LGBM, and CatBoost) that exhibited high performance. Weighted soft voting provided an optimal result by weighting the results of the models.27,31 As a result, the accuracy, precision, and recall were improved. A DEXA of −2.5 or less is the traditional cutoff for diagnosing osteoporosis, but this score is not representative of all conditions that reflect the diversity of fracture risk. 32 Bone density testing using DEXA can have several problems. For instance, if a patient has obesity or a large amount of fat, the BMD may reflect a higher value than the actual one. In addition, the measurement posture may affect the accuracy of the results. Moreover, the proficiency of the examiner may affect the accuracy.33,34 In addition to DEXA, the fracture risk assessment tool and ultrasound examinations can be used to diagnose and evaluate osteoporosis.35,36 Compared with DEXA, the fracture risk assessment tool score and ultrasound are relatively inexpensive and accessible. Similarly, our machine learning model was developed using BTMs that may facilitate and contribute to osteoporosis diagnosis. The AUROC of the proposed diagnosis model was approximately 0.7, but it required only data collected through simple blood tests. The predictive performance may be satisfactorily improved by collecting more data from patients with osteoporosis, and related studies are worth considering.
We investigated the feature importance in LGBM, CatBoost, and XGBoost. The importance of each BTM in the diagnosis of osteoporosis was quantified as shown in Figure 3. Although age and sex (female) were major factors in osteoporosis diagnosis, 1 the BTMs had a significantly higher feature importance than age or sex in LGBM, CatBoost, and XGBoost. Therefore, our models with BTMs as their main parameters can effectively diagnose osteoporosis in low-risk osteoporosis groups. Additionally, the four derived parameters (i.e., NTX/OC, NTX/BAP, NTX/P1NP, and P1NP/BAP) improved the performance of the machine learning model and had high importance. These parameters have not been studied elsewhere, and their clinical applications are worth considering.
An essential aspect of integrating machine learning models into clinical practice is interpretability and the ability of clinicians to effectively use these results in their decision-making process. While our study focused on developing models to predict osteoporosis based on BTMs and demographic data, it is equally important that clinicians be able to interpret and implement these models. Using decision thresholds and probability scores can help clinicians make informed decisions. For example, a model output might indicate the probability that a patient has osteoporosis. Clinicians can set a threshold probability above which additional diagnostic testing or early intervention can be recommended. This approach allows for customized, data-driven decisions that are tailored to the individual patient’s risk profile. To further enhance interpretability, it is also possible to integrate visual aids such as decision trees that can visually represent the model’s decision-making process. These visualizations simplify complex model outputs and make it easier for clinicians to understand and explain the rationale behind a particular prediction. Additionally, integrating model outputs into Electronic Health Records and Clinical Decision Support Systems can streamline clinicians’ workflows. These systems can provide real-time risk assessments and recommendations based on the model’s predictions to facilitate timely and effective interventions. By focusing on the interpretability and clinical applicability of machine learning models, the gap between technological innovation and clinical practice can be bridged. To ensure that these models are successfully integrated into routine clinical practice and improve patient outcomes in osteoporosis management, it is important to ensure that they are understandable and actionable by clinicians.
While the current study focuses on the diagnostic utility of BTMs to identify existing osteoporosis, we recognize the potential for future studies to advance this diagnostic approach into a predictive model. Osteoporosis is a dynamic disease characterized by gradual changes in bone density and structure over time. Longitudinal studies that track BTM levels, demographic factors, and other relevant clinical variables over a long period of time can provide valuable insights into the progression of osteoporosis. Furthermore, integrating big data analytics and machine learning into comprehensive data sets, including electronic health records and genomic information, can further improve the predictive power of these models. By shifting from a diagnostic to a predictive approach, we can improve the management and outcomes of osteoporosis, ultimately reducing fracture risk and improving patient care.
In recent years, the healthcare field has been transformed by digital health technologies and innovative data collection methods. While current research relies heavily on traditional clinical data sources, we believe that exploring promising avenues such as the application of AI is essential for future osteoporosis diagnosis research. Digital health technologies offer several benefits, including real-time data collection, continuous monitoring, and improved patient engagement. These innovations can complement existing clinical data and improve the accuracy and timeliness of osteoporosis risk assessment. Potential avenues for future research on digital health for osteoporosis diagnosis include wearable devices, mobile health applications, telehealth, machine learning on wearable data, Big Data integration, fracture risk prediction analytics, and patient education and engagement. For example, wearable devices equipped with accelerometers and gyroscopes can monitor physical activity levels, gait, and balance, all important factors related to bone health. Incorporating data from these wearables into current models can track changes in activity patterns that precede bone density loss, enabling early intervention. mHealth applications allow patients to record their dietary intake, medications, and other lifestyle factors that affect bone health. This data can be continuously fed into a predictive model to provide real-time risk assessment and personalized recommendations. Hypothetically, a comprehensive model could combine BTM measures with data from wearable devices and mHealth apps. For example, patients with decreased physical activity and suboptimal dietary calcium intake, as recorded by their wearable devices and mHealth apps, could be flagged for earlier follow-up or a more aggressive preventive care plan. Telehealth platforms can enable regular virtual checkups so that changes in bone health can be addressed immediately. Additionally, integrating electronic health records with genomic data can provide a more holistic view of a patient’s health status and risk factors. Big data analytics can improve the predictive accuracy of models by uncovering patterns and correlations that are not apparent in smaller data sets. By embracing digital health and innovative data collection approaches, we anticipate that future research can enhance the accuracy, accessibility, and patient-centeredness of osteoporosis diagnosis, ultimately improving patient outcomes and the quality of osteoporosis care.
Limitations
This study had two main limitations. The first was the relatively small sample size. We analyzed data from 280 patients, providing valuable insights but potentially lacking full representation of the diversity of the population. A larger sample size would have facilitated more robust model development and validation. The second limitation was the absence of a suitable independent dataset to measure BTMs, hindering external validation. This limitation impeded our ability to assess the performance of the model in a distinct patient cohort. The primary reason for not conducting external validation with a separate dataset was the limited availability of suitable datasets containing the required BTM measurements and relevant clinical data that adhered to our study’s specific inclusion and exclusion criteria. Obtaining external datasets that met the specific inclusion and exclusion criteria of our study was challenging. In addition, the retrospective nature of our data collection limited our access to external datasets. Due to these limitations, we decided to perform internal validation with stratified k-fold cross-validation, which allowed us to rigorously evaluate the performance of the model on the available dataset while taking into account the limitations of the data. Although external validation is a crucial step in model evaluation, its feasibility relies on the accessibility of appropriate external datasets. To address these limitations, we will need to actively pursue future collaboration and data collection opportunities. We plan to build partnerships with other healthcare organizations and participate in data sharing initiatives to collect independent datasets that meet our research criteria. We also aim to conduct multicenter studies that incorporate digital health technologies, such as wearable devices and mHealth applications, to improve the predictive power and clinical utility of our models. In future studies, by performing external validation, the external validity and generalizability of the model can be improved.
Conclusion
We propose a machine learning model that uses only BTMs from blood tests along with age and sex to predict osteoporosis. The proposed model is useful for predicting osteoporosis based on accessible blood tests.
Footnotes
Author contributions
Conceptualization: H.J.K, D.J.P., and S.M.B.; Formal analysis: D.J.P. and S.M.B.; Methodology: H.J.K., D.J.P., and S.M.B.; Visualization: D.J.P. and S.M.B.; Validation: D.J.P., S.M.B., K.S.H., H.J.K., Y.K., Y.H.P., and J.L.; Writing—Original draft: S.M.B. and D.J.P.; Writing—Review and editing: all authors.
Declaration of conflicting interests
The author(s) declared no potential conflicts of interest with respect to the research, authorship, and/or publication of this article.
Funding
The author(s) disclosed receipt of the following financial support for the research, authorship, and/or publication of this article: The present study was supported by a grant from the Korea Association of Health Promotion in 2019 (grant number: KAHP-2019-03).
Ethical statement
Data availability statements
The data described in this manuscript may be made available upon reasonable request to the corresponding author (