
Abstract
Before a medical procedure requiring anesthesia, patients are required to not eat or drink non-clear fluids for 6 h and not drink clear fluids for 2 h. Fasting durations in standard practice far exceed these minimum thresholds due to uncertainties in procedure start time. The aim of this retrospective, observational study was to compare fasting durations arising from standard practice with different approaches for calculating the timepoint at which patients are instructed to stop eating and drinking. Scheduling data for procedures performed in the cardiac catheterization laboratory of an academic hospital in Canada (January 2020 to April 2022) were used. Four approaches utilizing machine learning (ML) and simulation were used to predict procedure start times and calculate when patients should be instructed to start fasting. Median fasting duration for standard practice was 10.08 h (IQR 3.5) for both food and clear fluids intake. The best performing alternative approach, using tree-based ML models to predict procedure start time, reduced median fasting from food/non-clear fluids to 7.7 h (IQR 2) and clear liquids fasting to 3.7 h (IQR 2.4). 97.3% met the minimum fasting duration requirements (95% CI 96.9% to 97.6%). Further studies are required to determine the effectiveness of operationalizing this approach as an automated fasting alert system.
Introduction
Clinical practice guidelines recommend that patients should not consume clear liquids for 2 h and not eat food or drink non-clear liquids for 6 h before medical procedures requiring anesthesia care such as general anesthesia, regional anesthesia, or procedural sedation and analgesia.1,2 Despite the fact that similar recommendations have been in place for over 20 years, it is still common for patients to receive a standardized instruction such as “don’t eat or drink anything after midnight”. Such instructions are typically not changed regardless of alterations in scheduling even when there are significant delays in procedure start time. As a result, fasting durations far exceed the recommended requirement for most patients undergoing medical and surgical procedures.3–5 A recent study, which was undertaken in departments where standardized fasting instructions are used, found that the mean duration of fasting from food and non-clear fluids was 12.7 h (SD = 3.8) and clear fluids was 9 h (SD = 4.5). 6 Of great concern is that extended fasting periods in frail older adults can result in significant harm such as dehydration and malnutrition 7 and increased mortality.8,9
A solution is needed to properly address this difficult and long-standing operational problem that affects the very large number of people undergoing medical and surgical procedures with sedation or anesthesia. Prior attempts to more closely adhere to the 6 and 2-h fasting duration recommendations that relied on additional workload for clinicians to communicate messages between departments have been ineffective (i.e., staff in the procedure department would need to contact a nurse on an in-patient ward who would then inform the patient about a change in fasting status).10,11 Compounding the problem is the difficulty clinicians face in trying to anticipate procedure start time when devising appropriate cut-offs for pre-procedure fasting. It is common for there to be several changes in procedure scheduling, and there is considerable variation in durations for even similar types of procedures. With the procedural and scheduling data available in the hospital’s system, it is possible to apply health informatics techniques to develop an automated solution where up-to-date fasting instructions are generated based on predictions of procedure start time. These instructions can be directly delivered to patients through mobile devices (e.g., sending the instructions as a text message to the patient’s cellphone), which reduces clinician workload rather than increasing it. The aim of this study was to develop different data-driven approaches for providing pre-procedure fasting instructions that could be operationalized into an automated system that takes variations in procedure duration and changes in scheduling into account. Utilizing information technologies, we believe the automated system can improve patient experience related to pre-procedure fasting.
Materials and methods
Design
A single-site retrospective observational design was used for this study. Approval from the University Health Network Research Ethics Board was received April 21, 2021 (ID: 21-25375). Machine learning and simulation techniques were used to predict procedure start times and the consequent fasting instruction alerts in an attempt to reduce overall deviation from the 2-h (clear fluids) and 6-h (food) thresholds.
Outcomes
The outcomes for this study reflect the requirements for an automated fasting instruction system, which are to limit violations of the recommended fasting duration thresholds and minimize the total fasting duration. To evaluate the different approaches to generating fasting instruction alerts, we compared: • Percentage of patients with a fasting duration below the 2-h clear fluids and the 6-h solid food fasting threshold. • Median fasting duration from clear fluids and food.
Setting
This study was undertaken using routinely collected procedure and scheduling data for the cardiac catheterization laboratory (Cath Lab) in a large academic hospital in Canada. The Cath Lab has six procedure rooms and performs diagnostic and interventional coronary procedures, the full suite of electrophysiology and cardiac implantable electronic device procedures as well as complex interventions for valvular and congenital heart disease. Procedures are scheduled to be performed in one of the six rooms in a specific proceduralist’s “session”. The time that each procedure within a session is estimated to start is included in the schedule. The proceduralists do not provide input to this estimation based on characteristics of the exact procedure to be performed. Instead, the estimated start times for procedures are based on the order of procedures in the schedule, with a standardized duration allocated to similar types of procedures. For example, if a morning session begins at 8 a.m. and there are four coronary angiogram procedures scheduled to be performed, the procedure start times would be listed as 8 a.m., 8:45 a.m., 9:30 a.m. and 10:15 a.m. for the first to fourth procedure, respectively. If one of these procedures is completed early or is cancelled, the next procedure would be performed as soon as practically possible, even if this is before the scheduled start time. If a procedure takes longer to complete, the estimated times in the schedule will not be corrected. In this study, the standard fasting instruction is defined as follows. Patients who are scheduled for a procedure in a session that starts in the morning are instructed to not eat or drink anything from midnight before the procedure. If the procedure is scheduled for a session that starts after midday, patients are instructed to have a light breakfast before 6 a.m. and then not eat or drink afterwards. However, the exact instructions provided to each patient are not routinely documented at Cath Lab.
Data
The procedural data contained patient research IDs, basic demographic information, and procedure details such as procedure start time and participating staff members. Duplicate records with the same IDs were removed and missing values of patient heights and weights were filled by the means of these two features, calculated based on patient gender. The scheduling data contained 6,918 records from June 2020 to April 2022. Each record corresponded to a snapshot of the planned schedule for procedures in the Cath Lab on weekdays at every hour from 6 a.m. to 8 p.m.. The snapshots included a unique identifier, scheduled date and start time for the procedure, procedure type, name of the proceduralist, and room number as well as procedure notes made by the cardiac triage nurse. Entries in the schedules that did not have an assigned proceduralist were randomly assigned one based on an empirical proceduralist distribution for a specific procedure type.
To combine the procedural data and the scheduling data, we used a mapping file connecting the research IDs in the former dataset and the patients’ medical IDs in the latter. Only records that exist in both sources were selected and the final dataset contains one-to-one mappings between the two datasets and 8,200 unique procedures.
Fasting instruction strategies
We compared the standard practice against the following four approaches for sending alerts directly to patients with instructions to stop either eating or drinking: 1. Fasting alerts are sent exactly 2 and 6 h before the scheduled start times. 2. Fasting alerts are sent with a buffer added to the 2 and 6-h time-points before the scheduled start times, where the buffer accounts for the deviation between scheduled and actual procedure start times observed in historical data. 3. Procedure start times are predicted with simulation and fasting alerts are sent 2 and 6 h earlier. 4. Procedure start times are predicted with simulation and fasting alerts are sent with a buffer added to the 2 and 6-h time-points before the predicted start time, where the buffer accounts for the deviation between scheduled and actual procedure start times observed in historical data.
Specific details about each approach are outlined below.
Predicting start times with simulation
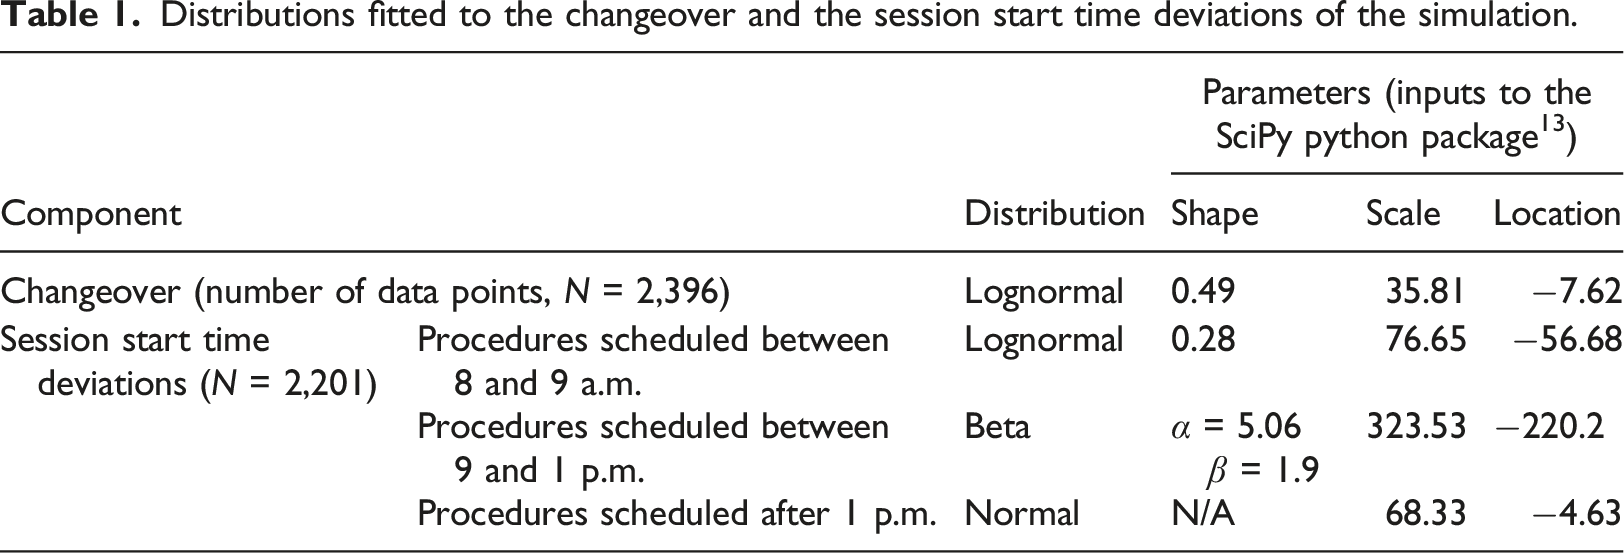
Distributions fitted to the changeover and the session start time deviations of the simulation.
We split the data into training and test sets based on the dates of the procedures: procedures before October 23, 2021 are in the training set while the rest of the procedures are in the test set. There were 5,382 data points in the training set and 2,368 in the test set. We split the dataset temporally to be more aligned with the real-world scenario where we can only use past information to predict the future. We also tested the robustness of our approach on different data splits as shown in Appendix II.
Machine learning methods for procedure duration prediction
One key input to the simulation process was each procedure’s duration. The duration of one procedure contributes to the start times of the subsequent procedures in the same session and, sometimes, in the following session. We used machine learning (ML) to predict procedure duration and included these predictions in the simulation approach.
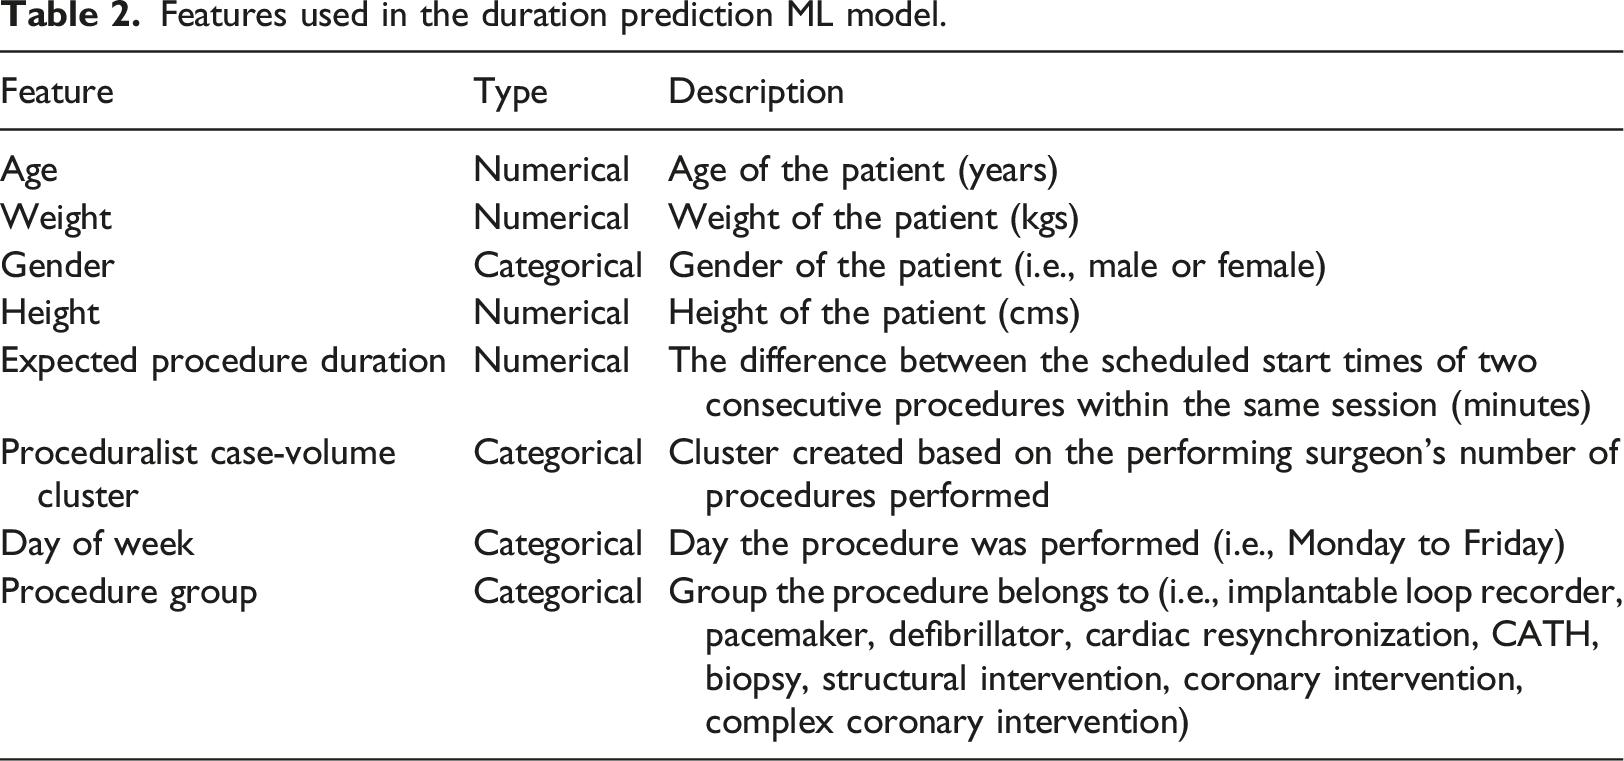
Features used in the duration prediction ML model.
Six ML models (linear regression, lasso regression, 14 support vector regression, 15 a decision tree regressor, 16 a random forest regressor, 17 and a gradient boosting regressor) 18 were evaluated. The root-mean-square error (RMSE) was calculated for the performance metric following different surgical duration prediction studies in the literature.19–21
Procedure schedule simulation
The simulation process is described in Algorithm 1. The simulation takes the schedule of
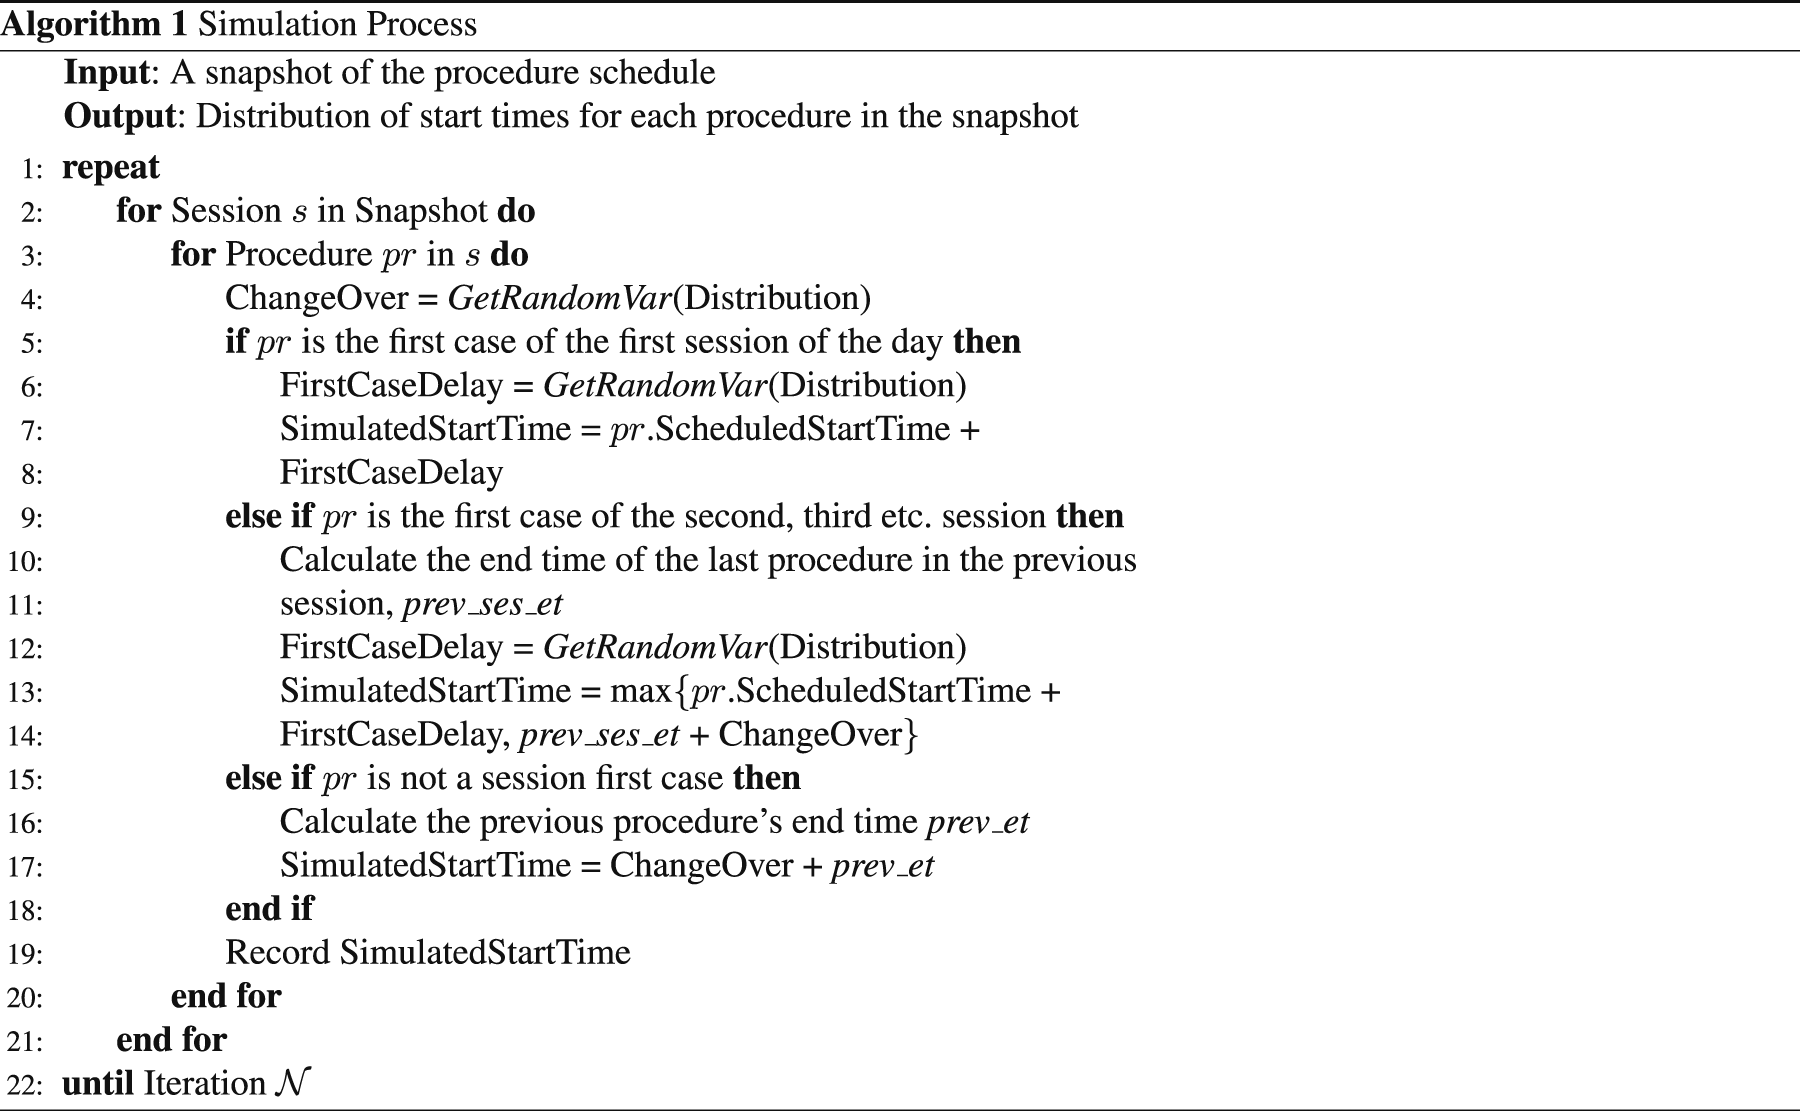
The GetRandomVar(Distribution) function (in line 4, 6, and 12) generates a random value based on the distributions described in Table 1. The end time of a procedure is calculated by adding the predicted duration to its simulated start time.
For each procedure in a session, there are three possible scenarios: 1. The procedure is the first case of the first session. 2. The procedure is the first case of a later session. 3. The procedure is not a session-first case.
The start times of procedures in Scenario 1 are calculated based on the generated deviations from the scheduled start times. For procedures in Scenario 2, the duration of the last procedure from the previous session is taken into account. Thus, the simulated start time is the maximum time between the end time of the previous procedure (prev_ses_et) plus changeover time, and the session’s scheduled start time plus the deviation. For Scenario 3, the changeover time is added to the end time of the previous procedure (prev_et) to obtain the start time. The process is repeated
The simulation produces a start time distribution for each procedure in the snapshot and the p th percentile of the distribution can be selected as the procedure’s predicted start time. The p th percentile start time is the time, t, such that p% of the simulated start times for the procedure are earlier than or equal to t. For example, if we want the expected proportion of fully fasted patients to be 98%, we would select the second percentile as the predicted start time.
Determining fasting alert time
After obtaining the predicted procedure start time, the timing of the fasting alert can be determined. One approach is to assume the predicted start times are accurate and subtract 2 and 6 h directly from the start times. This approach is denoted as “no buffer”. A second method to determine the fasting alert times is based on the historical differences between predicted and actual start times for procedures grouped by the scheduled hour j (j ∈ {8, 9, …, 16}) and we denote these buffers as “historical buffers”.
The method for calculating the historical buffers is described as follows. Let f be the minimum fasting duration requirements (2 or 6 h) and b
j
be the fasting requirements with an added buffer for scheduled hour group j, where group j represents the procedures that were scheduled to start within hour j. For each historical procedure, its prediction error e is the difference between the actual start time and the predicted start time. Thus, for each group j, we can obtain a prediction error distribution, f
j
(e). Next, a threshold, w, is defined as the minimum acceptable proportion of patients that would be fully fasted (w ≤ 1) and we determine a set of historical buffers that satisfy this threshold by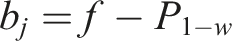
Hourly approaches
Recall that a new schedule snapshot is published every hour, thus, we can also use the fasting instruction strategies presented in this section with the later snapshots during the day. At each hour, we use one of the four approaches to obtain the fasting alert times. The final alert time comes from the last snapshot used that outputs a feasible time (i.e., we only update the procedure’s fasting alert time if it is later than when the snapshot is captured). However, we did not choose to pursue this direction since the hourly approach is more complicated to implement and, as discussed later in this paper, did not result in significantly better performance.
Results
Procedure duration prediction
A gradient boosting regressor 18 had the lowest RMSE (37.23 min) in 5-fold cross validation and was selected as the duration prediction model. The gradient boosting regressor has 64 estimators, a maximum depth of 5, a learning rate of 0.1, the minimum number of samples required to split an internal node is 10, the minimum number of samples required to be at a leaf node is 4, and the proportion of features to consider when looking for the best split is 30%. A summary of the results for the models that were evaluated is in Appendix I in Table 4.
Comparison of simulated fasting instruction alert strategies
We evaluated the performance of the proposed approaches for a test set of procedures performed between October 25, 2021 to April 22, 2022 and compared the results against standard practice. For the simulation-based approaches, we selected the second percentile from the procedure start time distribution as the predicted start time. For the historical buffer approaches shown in this section, we set the threshold defined in the Determining Fasting Alert Time section, w, to be 98%. That is, the historical buffers obtained ensured that 98% of the patients in historical data were fully fasted.
Proportion of fully fasted patients (in percentages) and the median fasting duration (in hours) for clear liquids by scheduled hour.
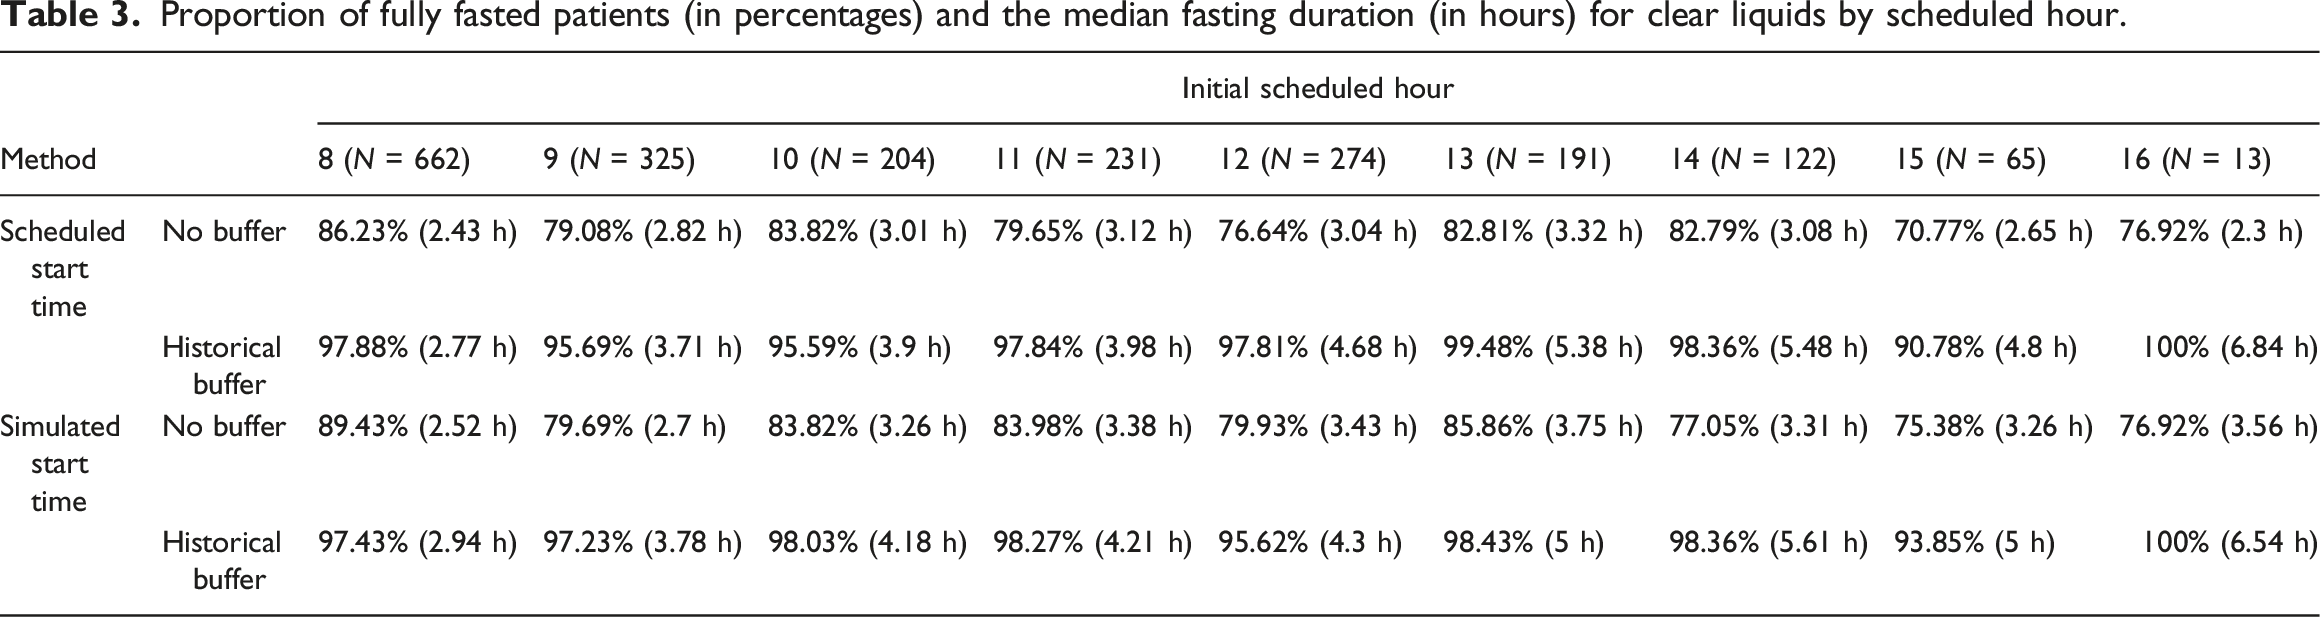
Table 3 shows that the percentage of fully fasted patients for the historical buffer approaches was higher than the approaches without buffers. However, median fasting duration was higher, especially for procedures scheduled in the afternoon. To compare the two start time prediction approaches, if we choose to not use any buffer to determine the fasting alert times, the simulated start time approach generally performed better than simply using the scheduled start time, though the simulated start time approach had longer median fasting durations for the afternoon procedures compared to scheduled start time. If we choose to use the historical buffers, both start time prediction approaches had similar fully fasted rates and median fasting durations.
Figures 1 and 2 illustrate the aggregated results of the percentage of patients fasting for more than x hour(s) (x ∈ {0, …, 12}) for solid food and clear liquids intake, respectively. An ideal approach for would have 100% at x = 6 (or 2) followed by an immediate drop to zero. Percentage of patients fasting for more than x hours for solid food intake by approaches. Percentage of patients fasting for more than x hours for clear liquids intake by approaches.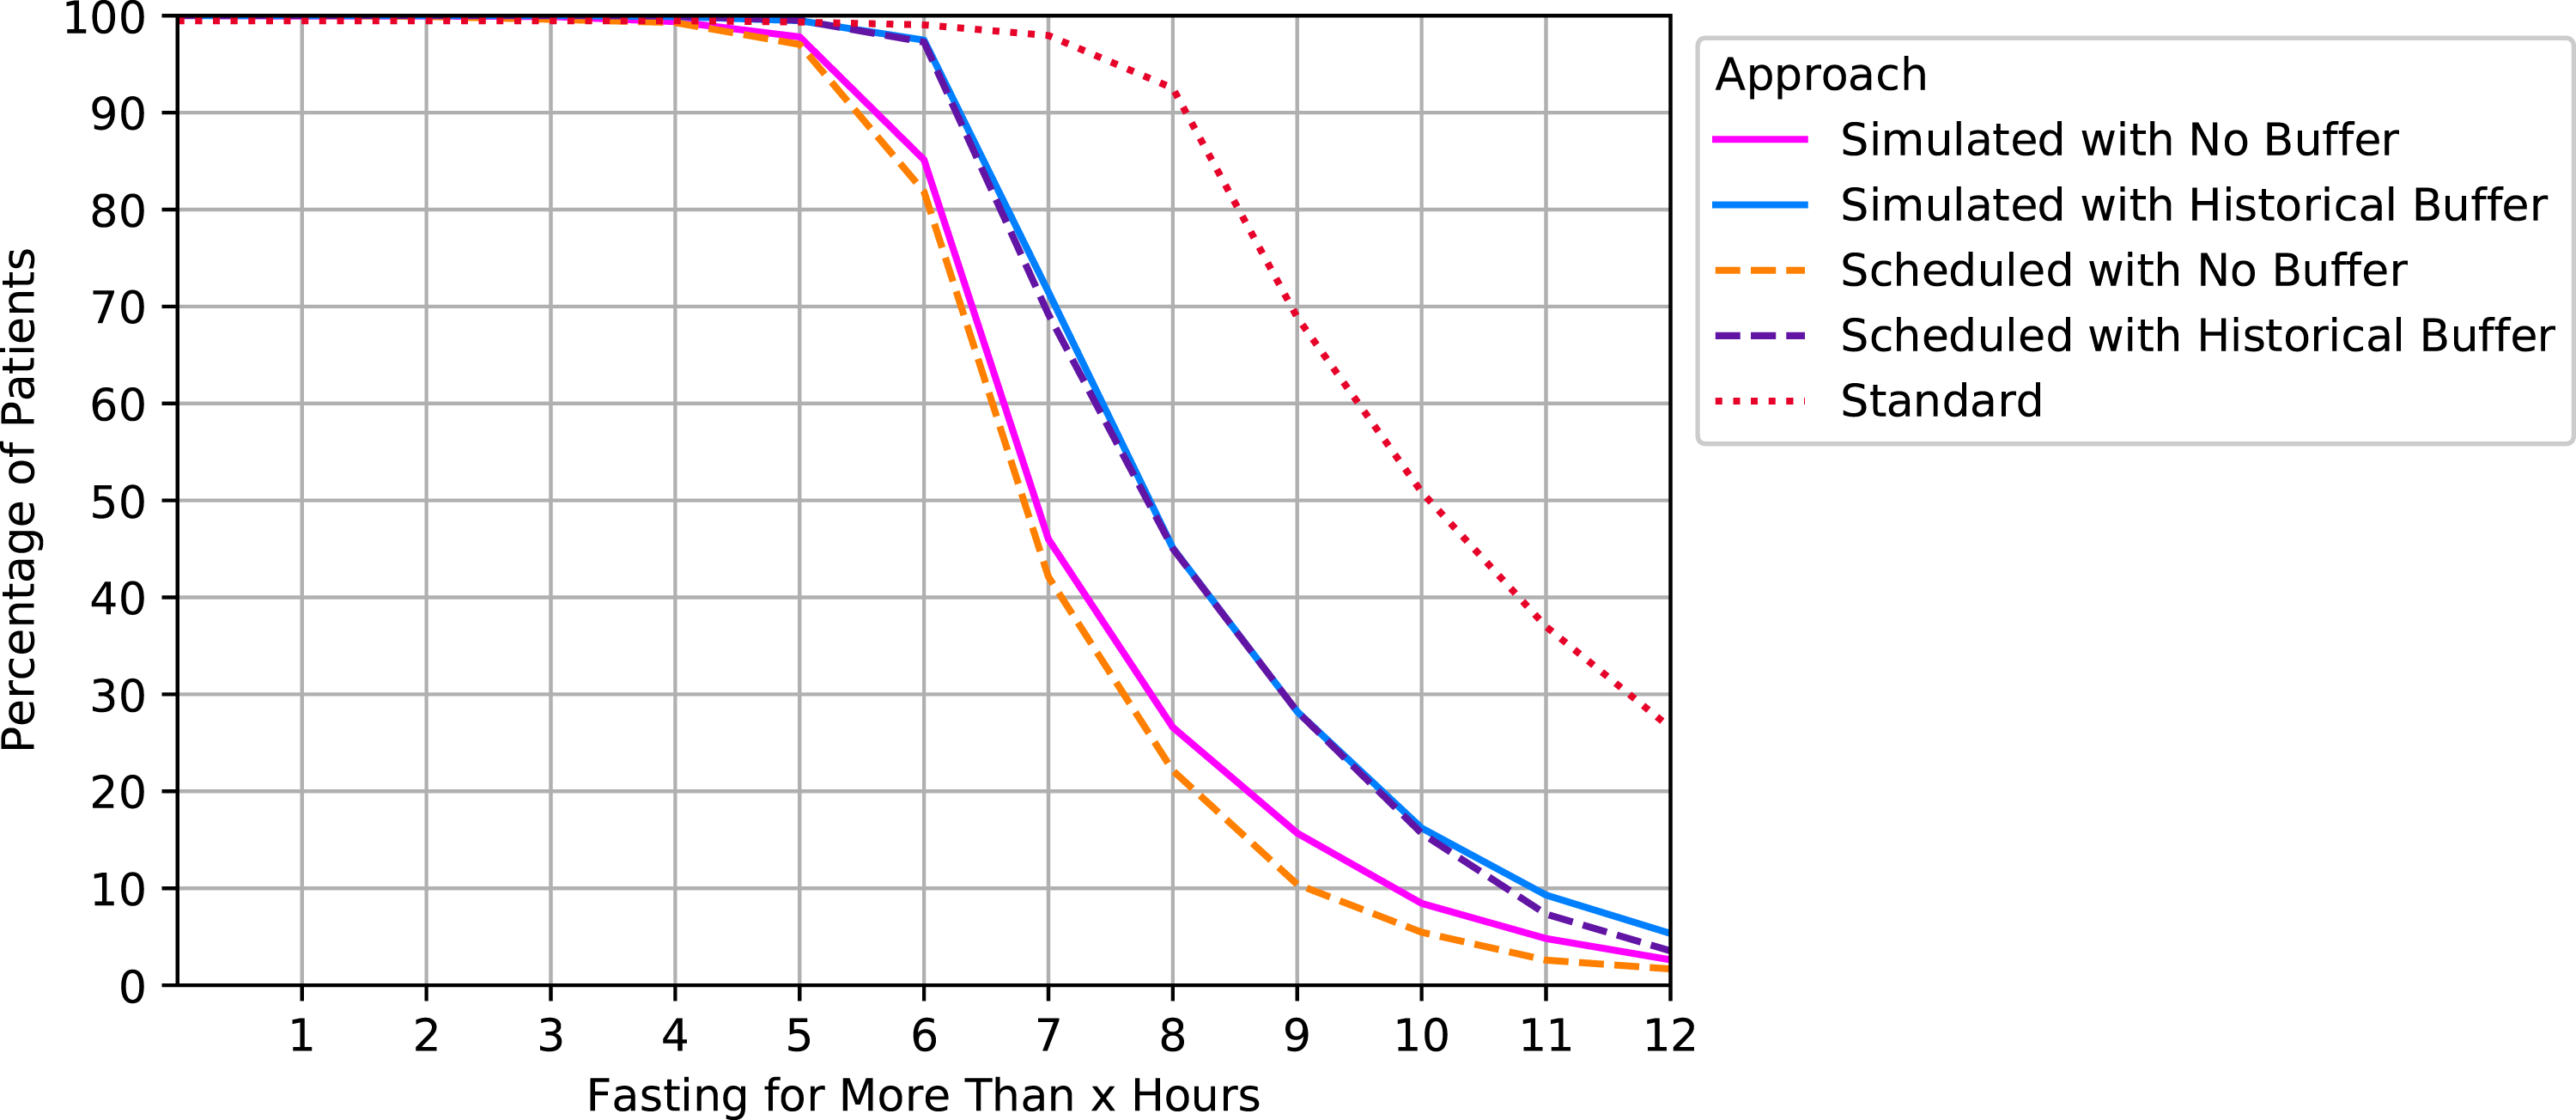
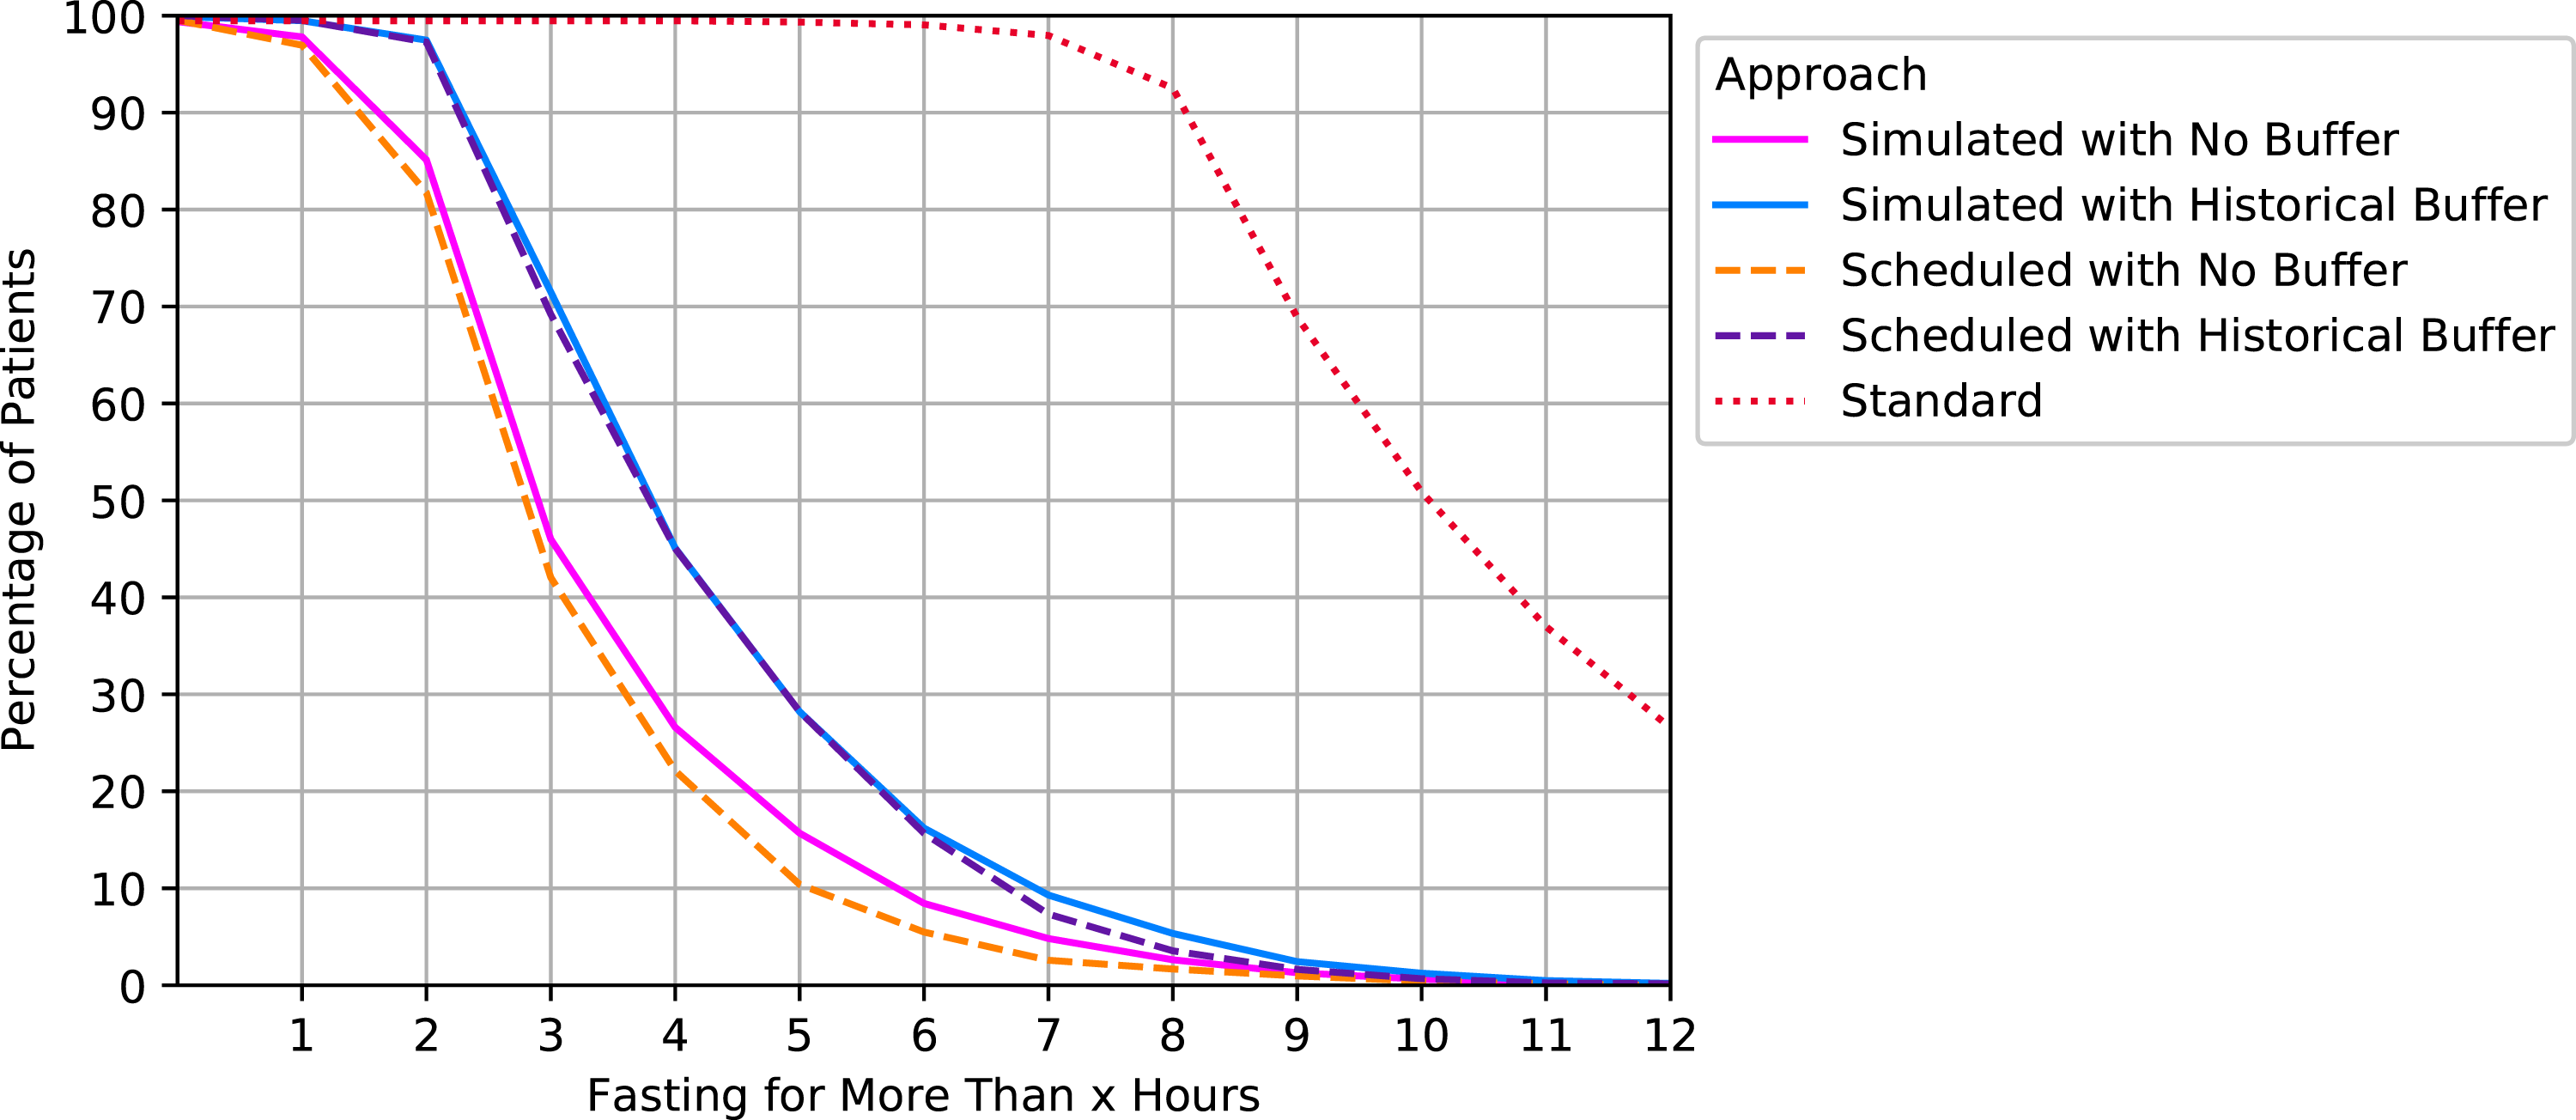
Consistent with the results shown in Table 3, the approaches that applied a buffer using historical data had the best performance: 97.28% of the patients in the test set were fully fasted for the approach where simulated start times were used (95% confidence interval (CI) using a normal approximation: [96.92%, 97.64%]). For the no buffer approaches, 83.94% and 81.84% were fully fasted for simulated and scheduled start times, respectively (95% CI: [83.14%, 84.74%], [81%, 82.68%]). Note that the results from Figure 2 are essentially the same as Figure 1 but shifted 4 h to the left because the only difference is the timing of the fasting alert for solid food and liquids.
Figures 3 and 4 compare approaches for both outcomes. The x-axis corresponds to each approach’s percentage of underfasted patients at x = 6 or 2 and the y-axis shows the median fasting duration. The ideal points are (0,6) and (0,2), respectively (i.e., all patients exactly meet the requirements). Standard practice resulted in the longest fasting duration: 10.08 h (Interquartile range (IQR) = 3.45) for both food and clear liquids intake. The median fasting duration and the proportion of underfasted patients for solid food. The median fasting duration and the proportion of underfasted patients for clear liquids.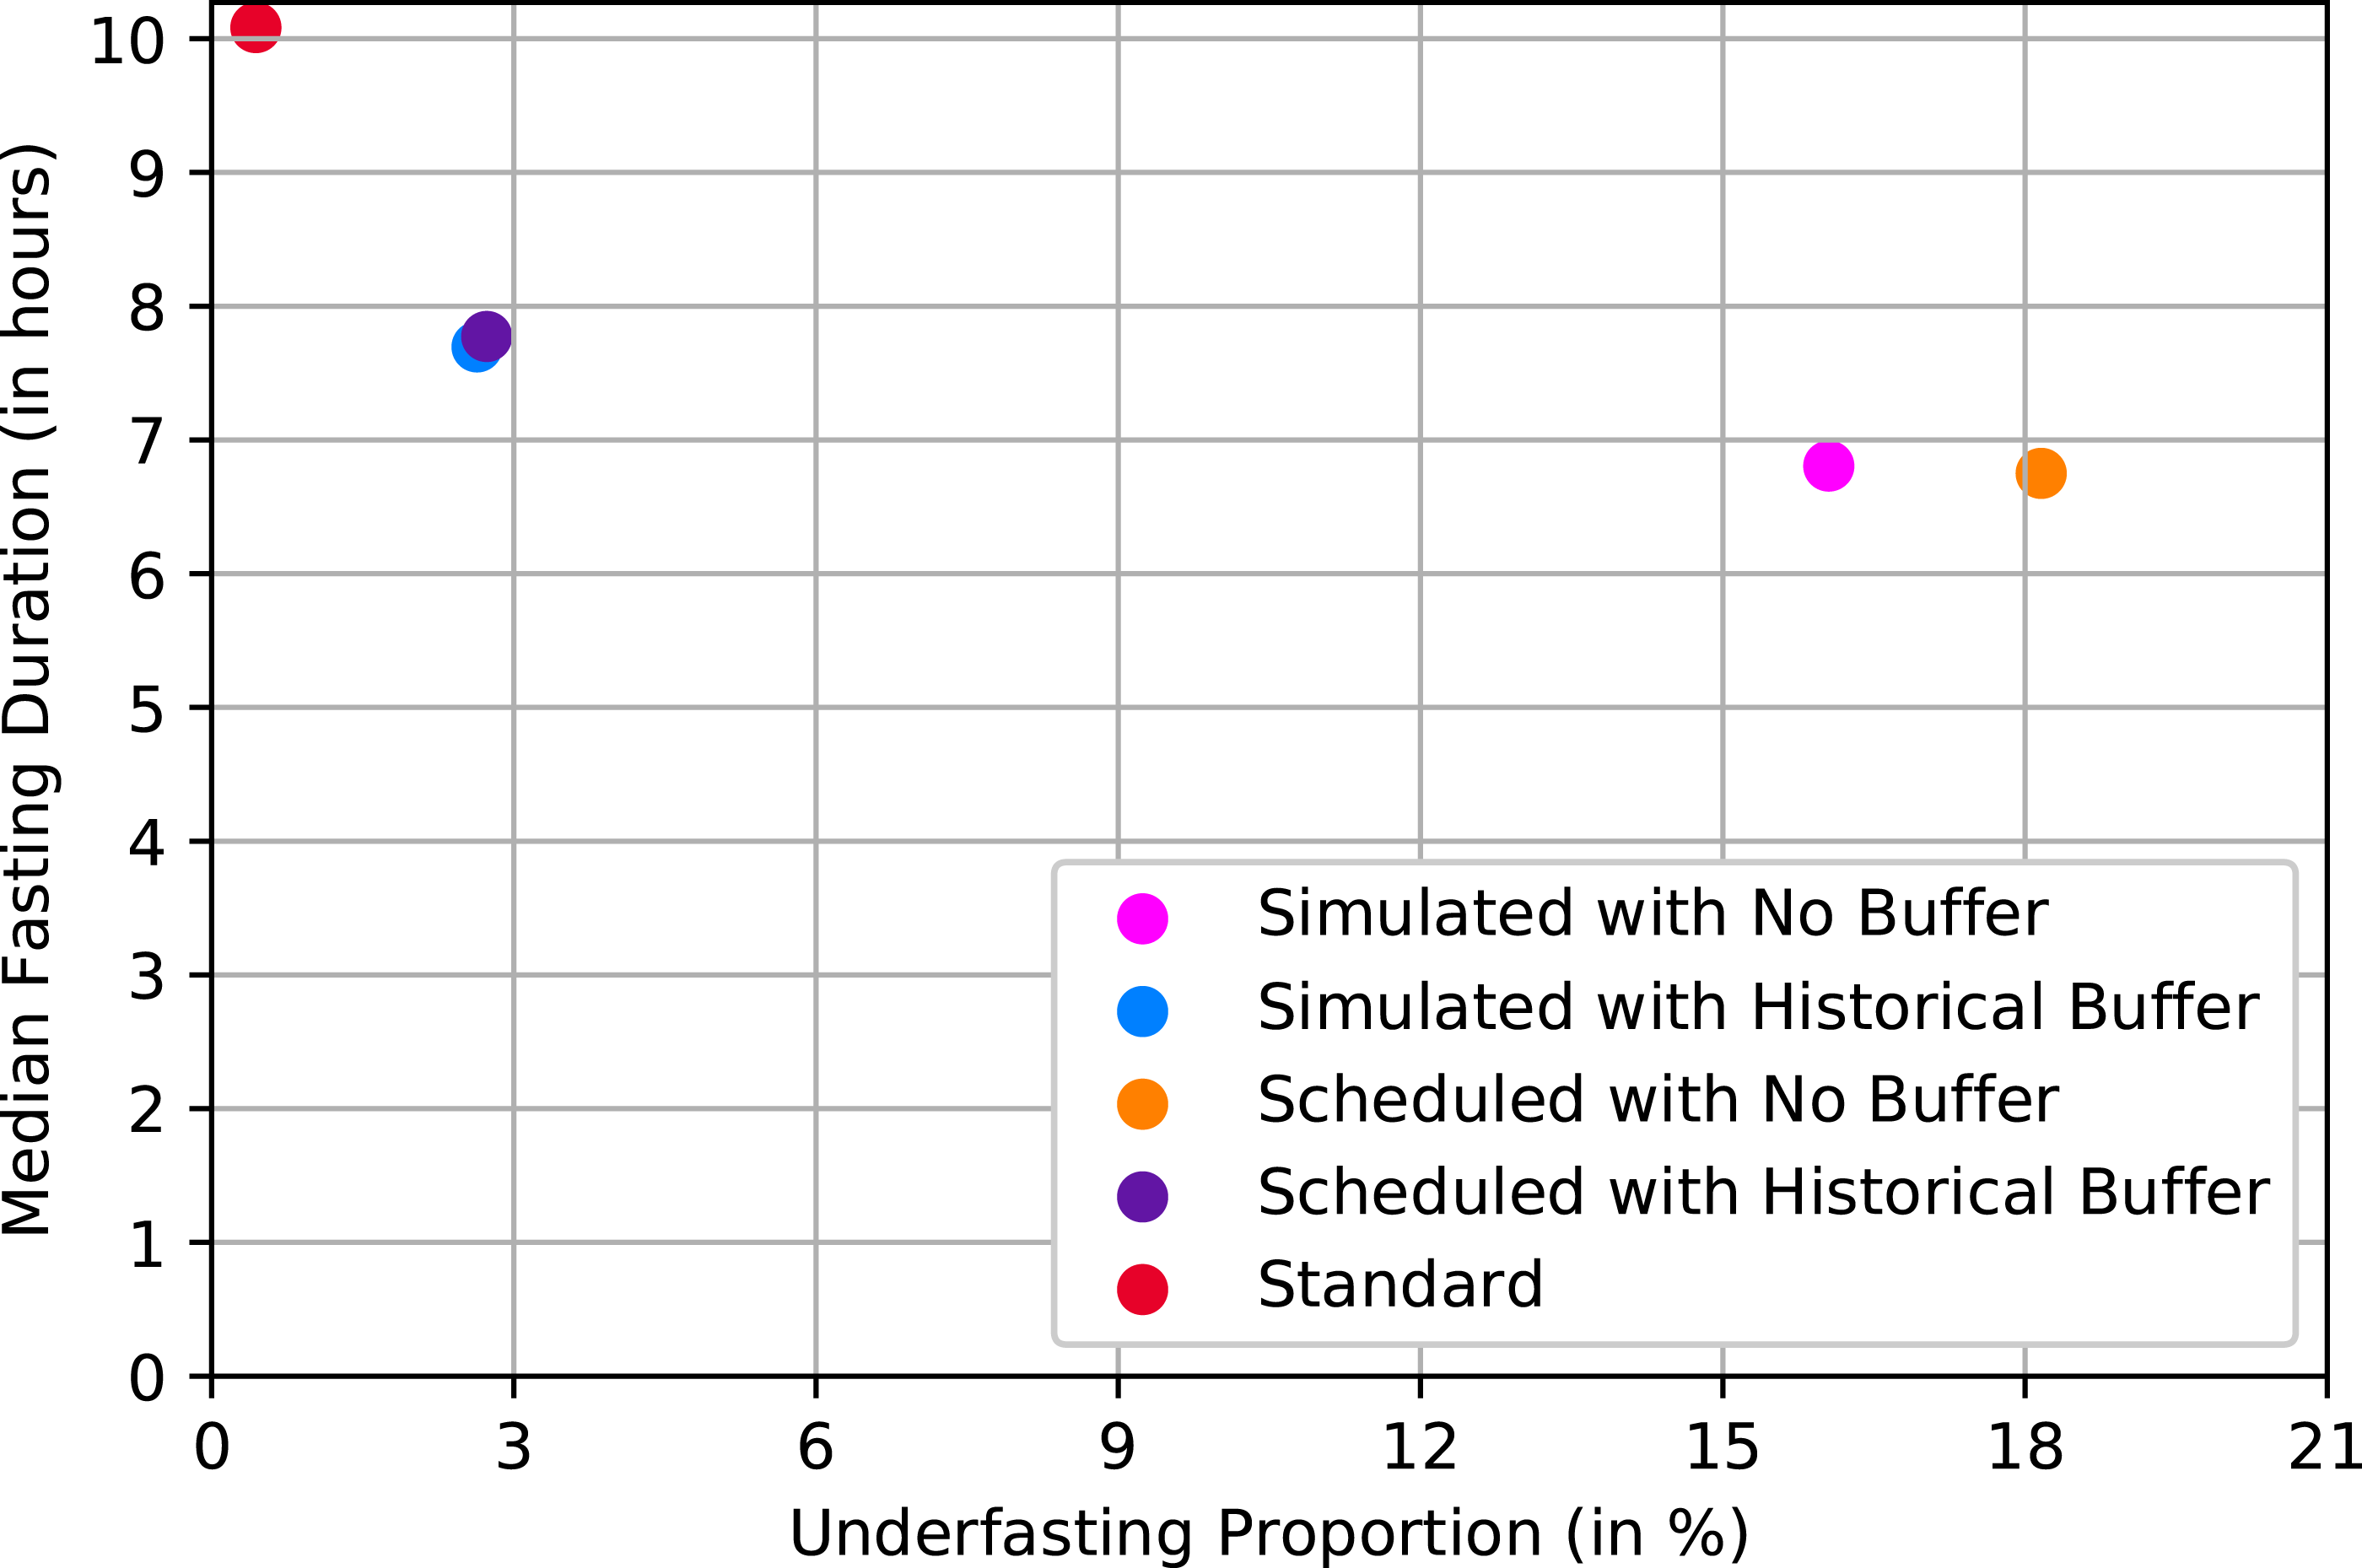
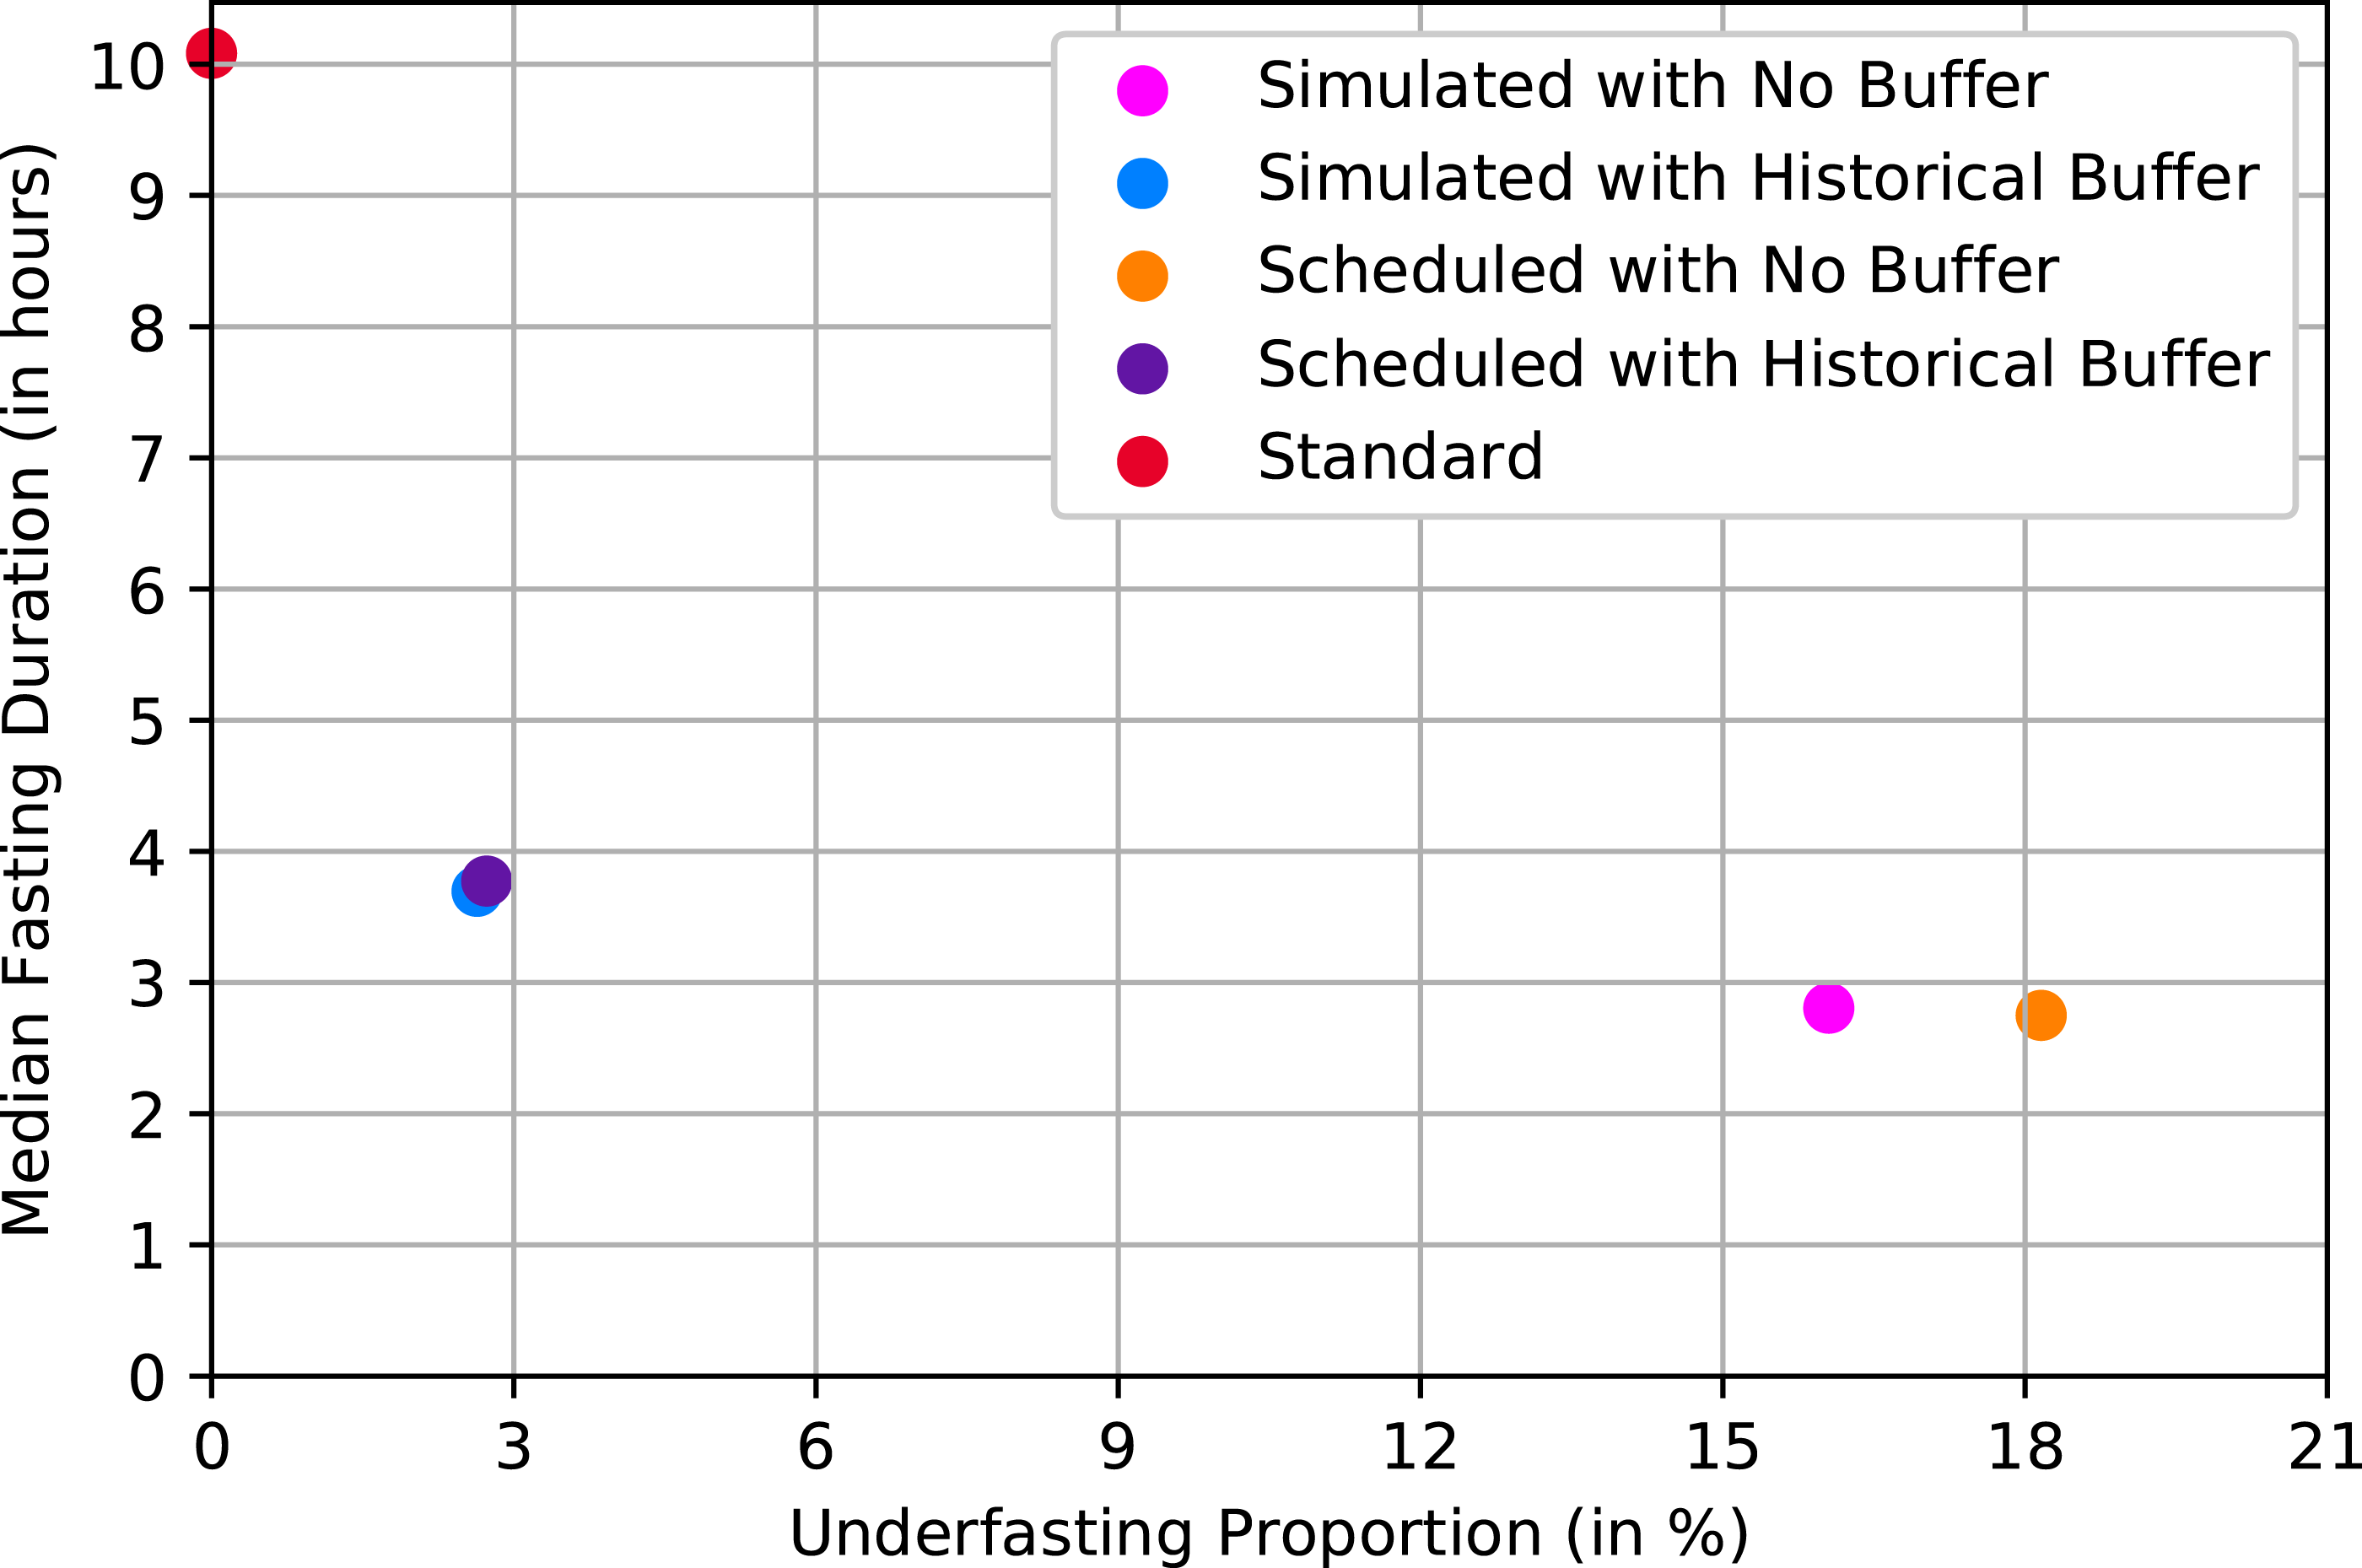
The approaches that applied a historical buffer had shorter median fasting durations than standard practice. The average fasting from solid food duration was 7.77 h (IQR = 2.43) for the scheduled start times, and 7.7 h (IQR = 2.35) for the simulated start times. Clear liquids median fasting durations were 3.77 h (IQR = 2.43) and 3.77 h (IQR = 2.35), respectively. The approaches that directly used 2 and 6 h resulted in shorter fasting duration but a higher proportion of underfasted patients, which is consistent with the results shown in Figures 1 and 2.
Performance of the hourly approaches
We also tested rerunning each of the four approaches presented above every hour to calculate the new fasting alert times and the results are shown in Appendix IV.
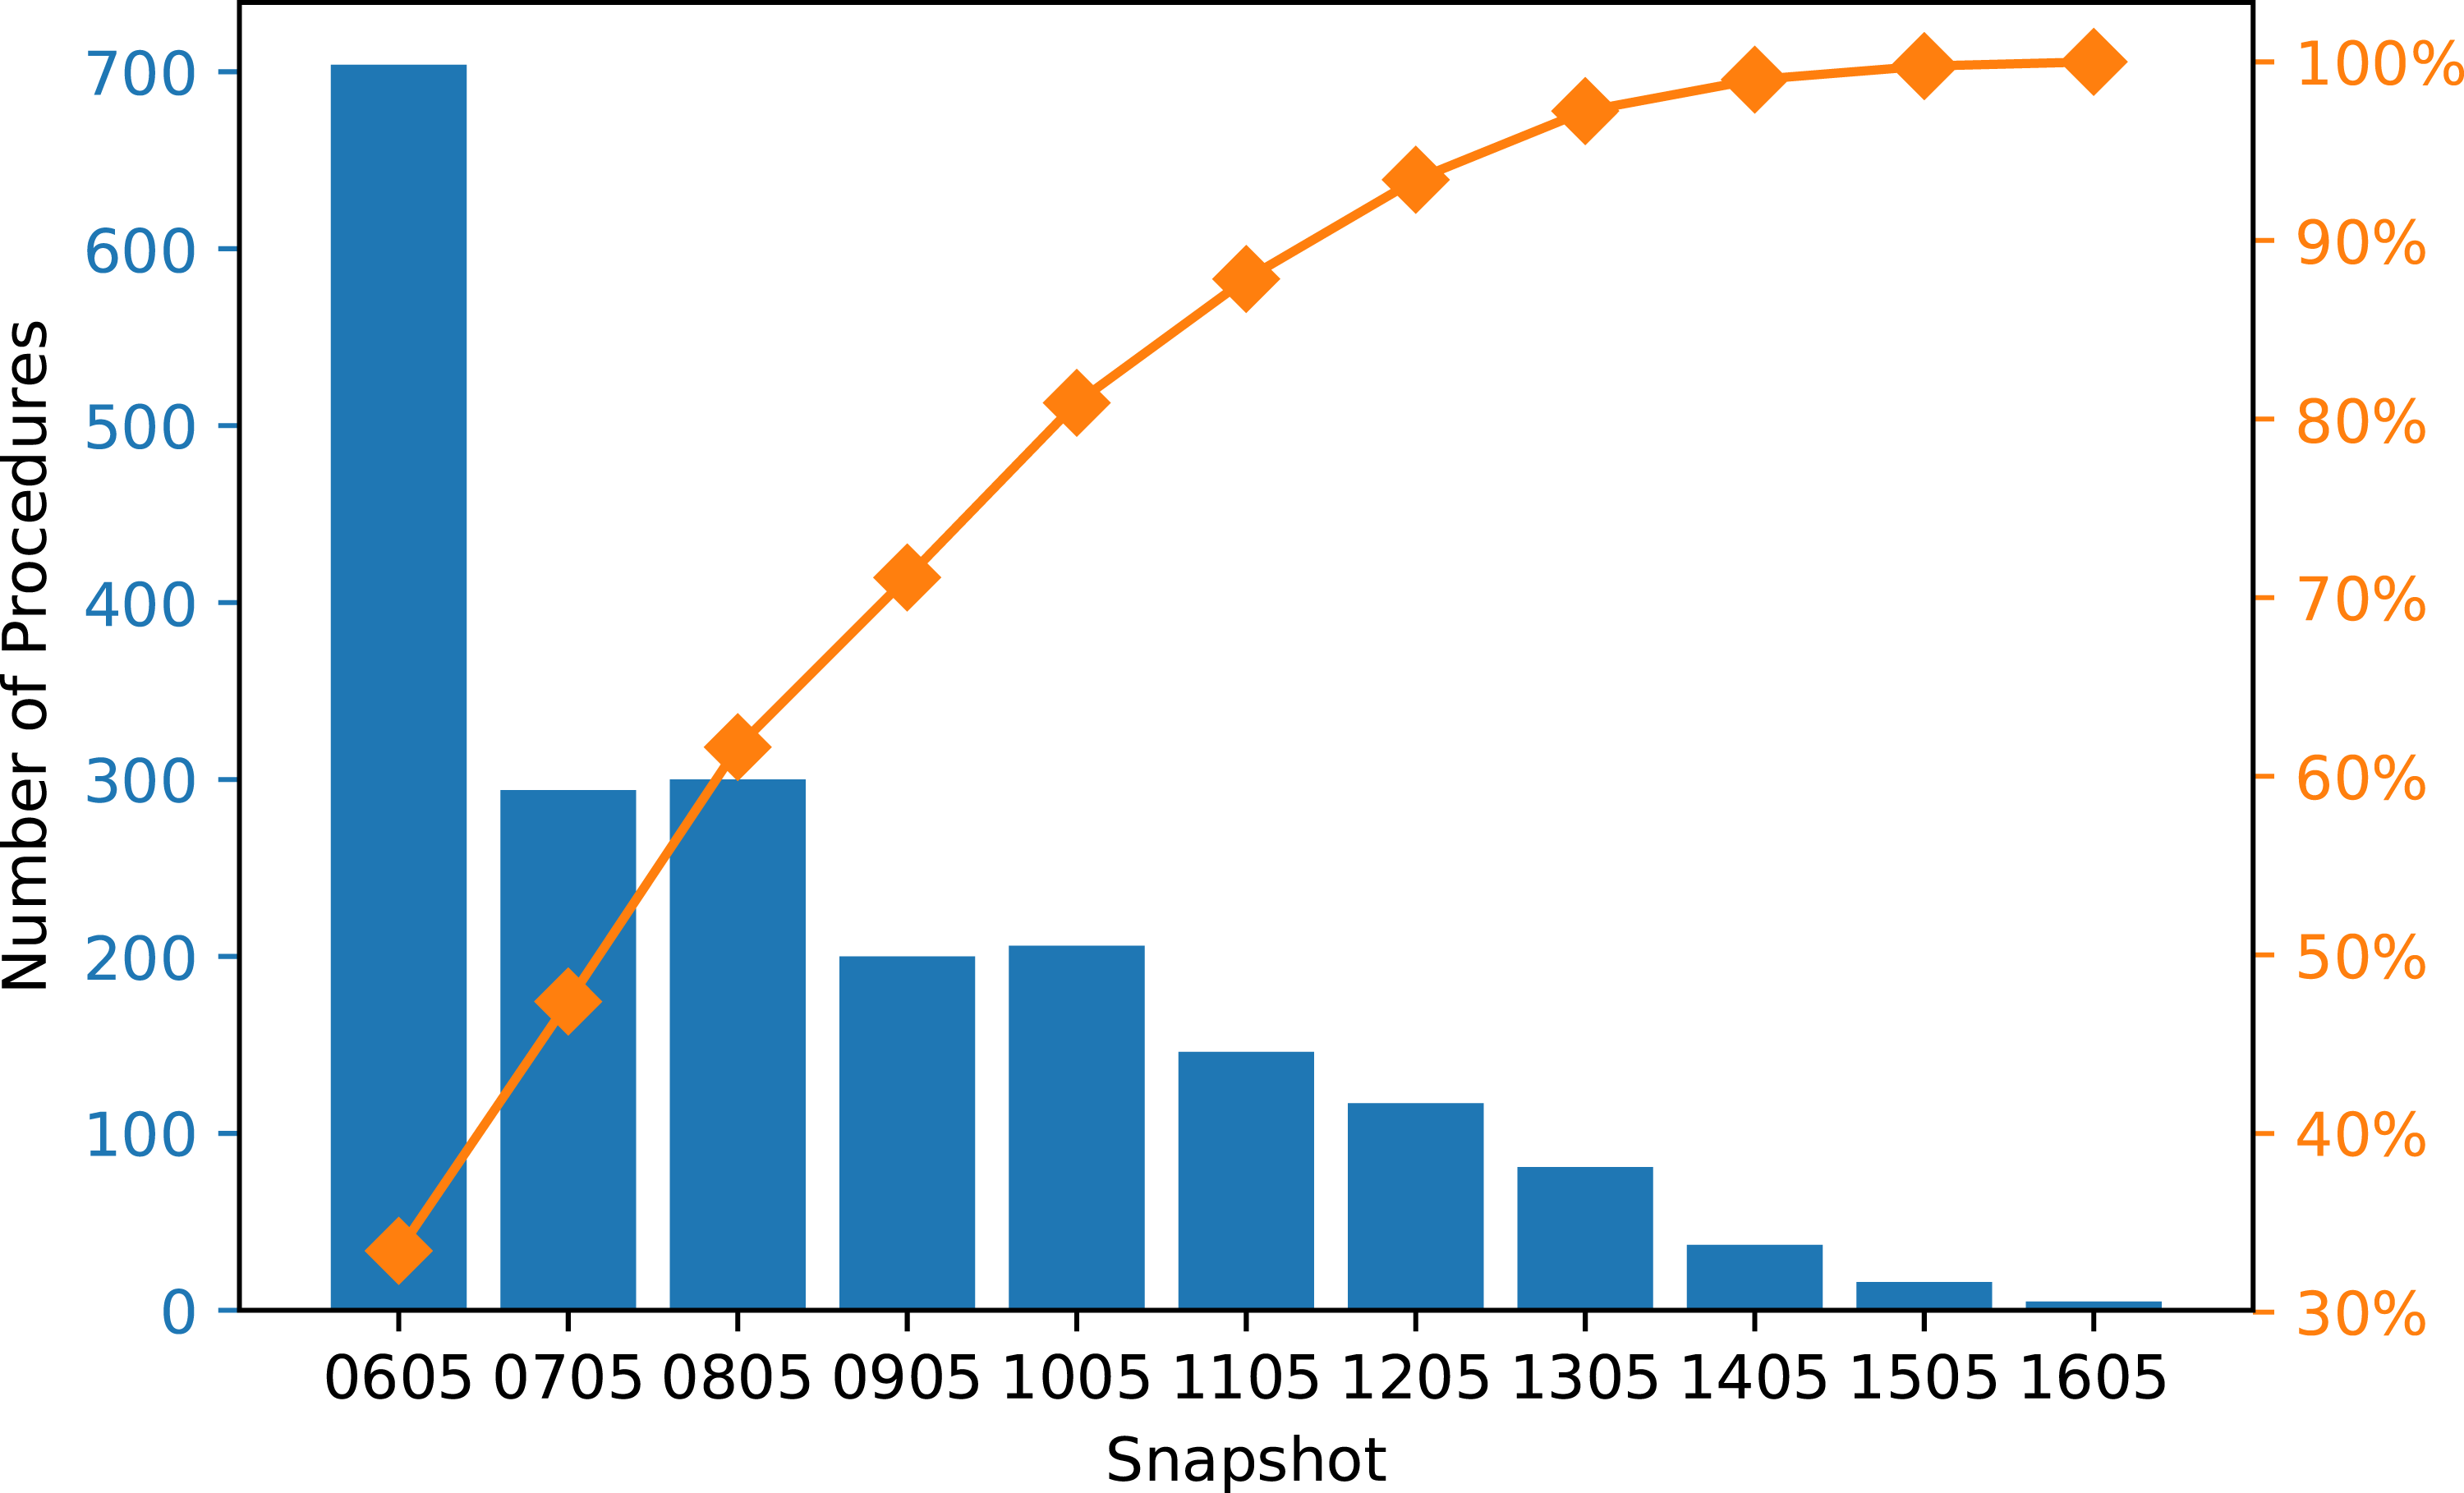
Since the final alert time is based on the last snapshot that produced a feasible time, we recorded the snapshot used for the fasting alert time of each procedure in the test set, and we aggregated the results by each snapshot. Figure 5 shows the frequency of snapshots used when fasting alerts were generated from simulated start times with no buffer at every hour. It shows that 84% of the solid food fasting alerts were generated from the initial snapshot of the day (i.e. the 6 a.m. schedule). Figure 6 shows the frequency of the snapshots used for clear liquids fasting alerts, which is less right-skewed compared to Figure 5. Although more procedures used the later snapshots to determine the fluid fasting alert times, Figure 8 (Appendix IV) indicates that using the hourly snapshots led to little or no improvement compared to only using the initial snapshot. Pareto chart of the frequency of snapshot used for solid food fasting alert (hourly approach with simulated start times and no buffer). Pareto chart of the frequency of snapshot used for clear liquids fasting alert (hourly approach with simulated start times and no buffer).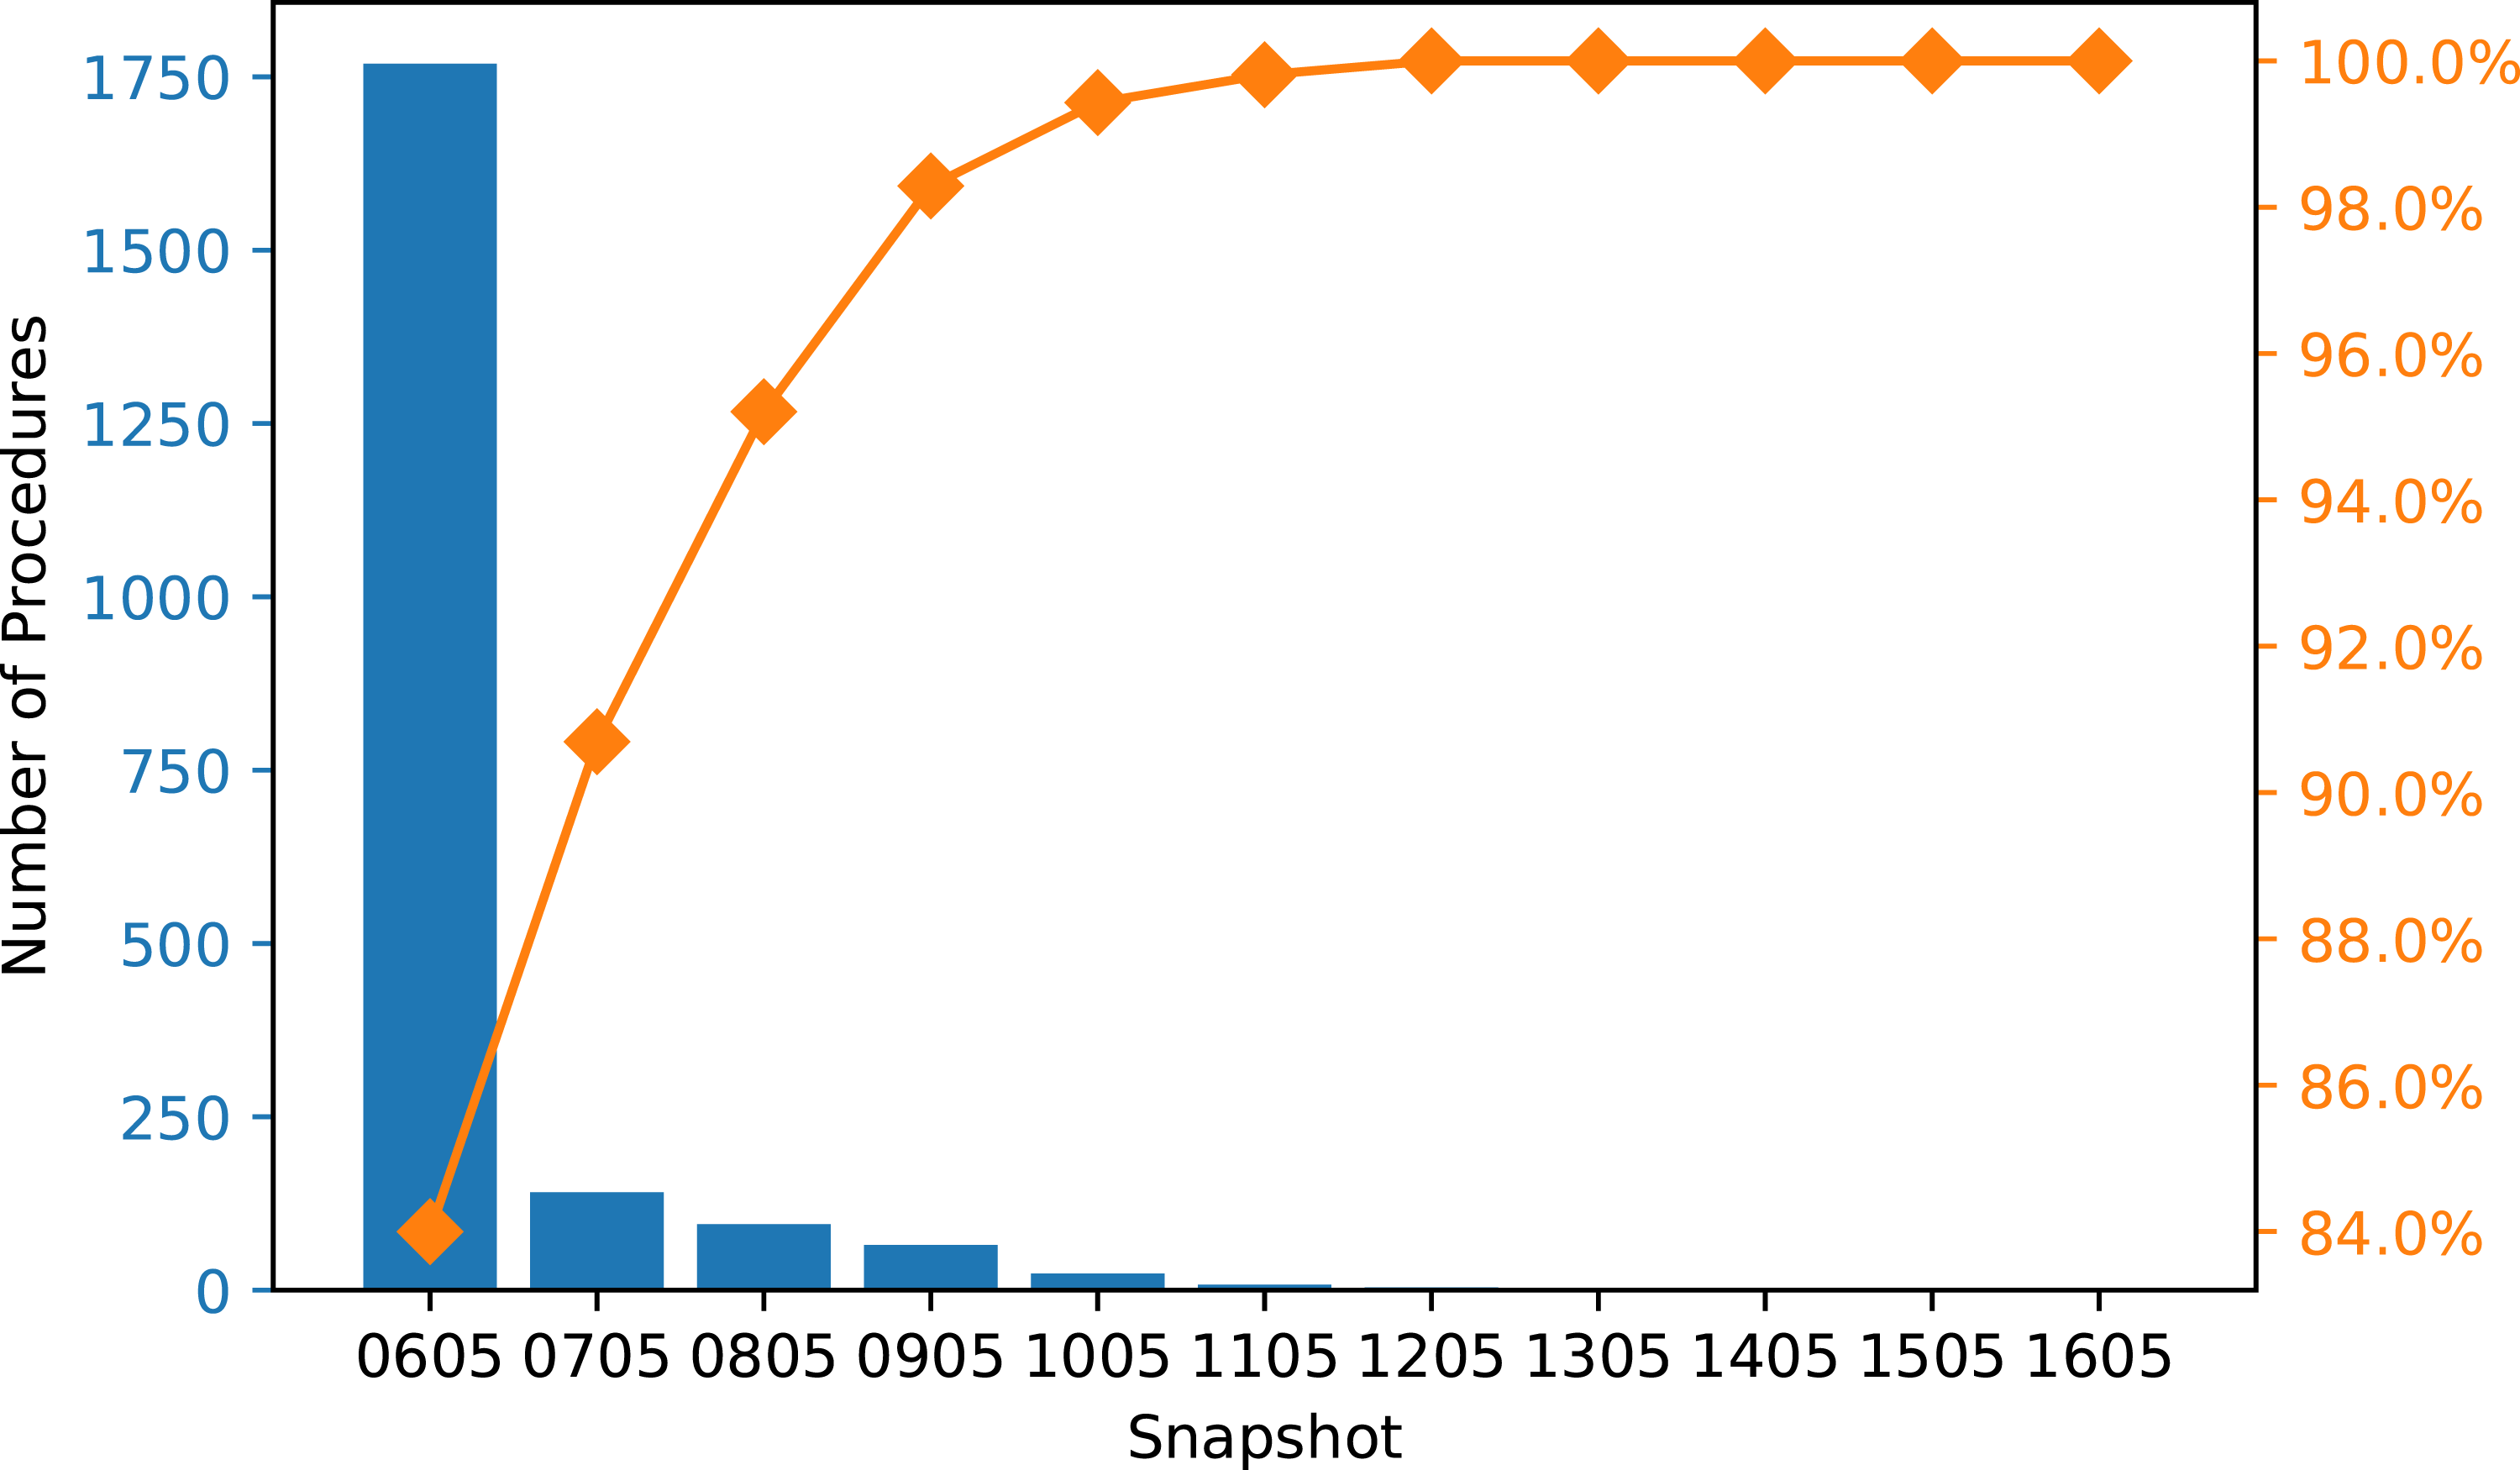
Discussion
All four approaches for generating times for fasting alerts shortened the total fasting duration considerably for both clear liquids and solid food intake compared to standard practice. The solution using scheduled start times and historical buffers had the best overall performance in terms of limiting the number of patients who violate the 2 and 6-h fasting recommendation and minimizing total fasting duration. In addition, as long as scheduled start times are readily available in a hospital’s database, integrating this solution would be simpler than the simulation-based approaches because the algorithm computes the solution quickly and requires few computational resources. The logic behind the protocol (i.e. “subtract 2 or 6 h with a historically calculated buffer time from the scheduled start time”) is also more readily understood by patients and staff. Additional research would be needed to determine the best frequency for rerunning the buffer calculation algorithm with more historical data of the differences between scheduled and actual procedure start times (e.g. once every month or once every 3 months).
Instead of directly predicting the start times of procedures, we decided to use simulation to represent our knowledge of how the daily procedure schedule is executed. We did so by breaking the schedule down into several components using historical data. One of the components was to predict the durations of the procedures, for which there are two major lines of research in the literature. The first direction is fitting the data to a known distribution, such as normal22,23 or log-normal.24–27 While studies show that such models can produce accurate predictions and increase operating room efficiency, 27 they did not offer insight into the factors that may impact the predictions. Therefore, we chose to focus on the second direction, which uses statistical and machine learning models to identify important features and produce predictions. The features selected for our prediction model are all known prior to the procedure and can be divided into two categories: patient factors and clinical factors. Basic information about the patients such as age and gender is often selected for the modeling process.21,28,29 Some other features that are popular in the literature such as American Society of Anesthesiologists score (ASA class)28,30,31 were not available in our datasets.
Common ML models used for procedure duration prediction include linear regression,21,30,32–36 tree-based algorithms such as regression trees, bagged trees, and random forests,19–21,31,34,37 neural networks, 34 and Support Vector Machines (SVM).20,37 Of the features that were selected (Table 2), Table 6 in Appendix III indicates that the expected duration feature has higher impact on the tree-based models than on the linear regression models, while the procedure group feature is important for all models tested. In this study, we chose to focus on classical machine learning algorithms instead of more involved models such as neural networks due to the issue of interpretability. Since the target users for this application are clinicians and nurses, we believe the ML models should be easy to understand and apply. We chose a gradient boosting regressor because the model has the lowest RMSE, and combining tree-based models with boosting techniques is also fairly common in literature.20,28,31,38,39
When using historical buffers, the more complicated simulation-based approach had nearly identical results with the scheduled start time approach. The exact cause of the comparative performance is not known since there were multiple components used in the simulation process. One hypothesis is that this lack of difference may be a result of little variability in procedure durations in different procedure groups. However, Table 7 in Appendix V shows that there is considerable difference in procedure duration means and standard deviations, indicating that the similar performance between the two approaches are not related to the duration variability. One observation is that the simulation process relied on the order of procedures in each snapshot. Thus, similar to the approach with scheduled start times, the simulation was built on the assumption that the procedures were executed in that exact order, which may not be true. While the simulation captured the uncertainty in procedure durations and changeovers, information such as a procedure being moved from the morning to an afternoon session is not available in the initial snapshot. Even if these changes were included in the later snapshots, since most of the fasting alerts were determined using the initial snapshot, neither of the approaches could use the new information when predicting procedure start times. Further, note that the two start time prediction approaches are not independent: to produce the start time distributions, we used the scheduled start time for each session’s first procedure to start the simulation process. As such, one of the reasons for the similar performance may be that both methods depend on the schedule in the snapshots. To improve the simulation-based approach, we would need to develop an additional component for the system that can accurately predict, or, actually specify, the order of procedures and use this prediction instead of the snapshot as the input to the simulation process.
The approaches that applied a historical buffer to generate fasting alerts reduced fasting duration, but it is important to consider the implications arising from the small proportion of patients in the test set who had not yet reached the 2 and 6-h minimum fasting requirements before the “actual” procedure start time. When a patient has not fasted for the minimum recommended duration, there are two potential actions that can be taken: i) delay the procedure until the patient meets the minimum fasting period; or ii) change the schedule to start a procedure for a patient who has met the fasting requirement. These two approaches have their trade-offs in terms of costs, risks, and patient experience. For the first option, leaving the procedure room idle is costly and would delay subsequent procedures. Further, this option may not be applicable to urgent or emergency procedures as they may not need to be delayed to accommodate fasting requirements. 40 The second option may not be ideal for the hospital either, since changing the schedule may lead to logistical difficulties and confusion among staff and patients.
It is interesting that using schedules at each hour throughout the day to generate fasting alerts did not result in improved overall performance of the system in comparison to approaches using the first schedule. One reason why the hourly approaches did not outperform the single snapshot approach is that the majority of procedures were scheduled before noon. Therefore, most of the patients would start fasting for solid food early in the morning, which means that the alerts would be sent out based on the start times generated using the initial snapshot. Another reason is that the snapshots of each day remained mostly unchanged compared to the initial snapshot, meaning that even if the alert comes from a later snapshot in the day, it would be very similar or identical to the one from the initial snapshot.
Limitations
The data used in this study were extracted during the COVID-19 pandemic, which may have impacted how the Cath Lab schedules functioned during that time. As the hospital returns to its operation level before the pandemic, the procedure schedule may change as well. Additionally, as more data becomes available over time, the changeover time distribution may change as COVID-19 cleaning protocols related to ventilation may no longer be in place.
Nonetheless, the approaches to generating fasting instruction alerts in this study have the flexibility to be refined with new data and have the potential to adapt to changing trends. Other aspects of the context in which the study was conducted should also be considered. This study was conducted at a single-site in the cardiac catheterization laboratory setting. Further studies are required to confirm the effectiveness of the approaches we have evaluated in other similar settings that require pre-procedure fasting, such as peri-operative suites and diagnostic and interventional radiology departments.
Another limitation of our approach is the lack of use of more advanced ML models such as neural networks for the procedure duration prediction task. Although tree-based models are widely used in the literature and have achieved good results,20,31,34,39 neural networks can model more complex relationships between variables and therefore potentially produce better predictions than the classical ML models implemented in this study. For neural networks, we can compute the features’ Shapley values to gain some insights into how much each feature contributes to the model’s predictions. 41 Future work includes further investigation and testing to determine the suitable neural architecture for procedure duration prediction.
Conclusion
In this study, we identified four approaches for generating fasting instruction alerts that would shorten pre-procedure fasting duration for Cath Lab patients in comparison to standard practice. We found that using scheduled start times and historical buffers had the best overall outcomes: this approach has the minimum total fasting duration while limiting the number of patients who did not meet the 2 and 6-h fasting requirement. If implemented in a system that automates the delivery of these instructions to patients, the unnecessary discomfort and distress arising from symptoms associated with fasting could be reduced or avoided entirely. Utilizing the procedural and scheduling data available in the hospital’s system, an implementation of our proposed approach has the potential to create a positive impact on patient experience and an improvement in the efficiency of healthcare delivery. Further studies are required to determine the effectiveness of operationalizing the proposed fasting alert system approach into practice.
Footnotes
Declaration of conflicting interests
The author(s) declared no potential conflicts of interest with respect to the research, authorship, and/or publication of this article.
Funding
The author(s) disclosed receipt of the following financial support for the research, authorship, and/or publication of this article: This work was supported by AMS Healthcare.