
Abstract
Using data from two ED. departments of 773 patients admitted with SARS-CoV-2, ICD-10 codes derived from the General Practitioner - Summary Care Record (GP-SCR) and Emergency Department (ED.) records were analysed for code discrepancies and whether this related to increased mortality. The average number of ICD-10 codes in both GP-SCR and ED. records was higher for patients who died than patients who survived (all p < .0001). Pre-existing GP digital data provides a better prediction of mortality than data collected manually during admission clerking in the ED. Up to 78.47% of GP-SCR codes were missed in the ED. records and up to 45.49% of the ED. record codes were not in the GP-SCR. A subset of missed ICD-10 codes were identified as being able to predict outcome; a trend towards increasing death rate as the proportion of missed codes increases. Initiatives to make the GP-SCR available to the wider healthcare community should improve patient care and reduce bias during development of machine learning based algorithms.
Keywords
Introduction
During the first wave of the on-going SARs-CoV-2 pandemic to 30th June 2020, the UK Office of National Statistics data, on deaths registered within 28 days of SARS-CoV-2 diagnosis, recorded that over half had occurred in hospitals and a high-proportion in care homes. 1 This created new challenges for NHS services that necessitated a rapid re-deployment of staff and resources. Throughout the pandemic, the Emergency Department (ED.) has been the interface for patients between primary and secondary care and represents the point in the patient treatment pathway where data sharing can be tested.
Electronic patient records facilitate access to patient information in primary and secondary care settings.2,3 The first NHS IT strategy advocating a single electronic care record for patients was published in 1992.4,5 Subsequent strategies have sought to share electronic records between primary, secondary and social care.6–8
By 2011, many GPs had computerised their patient systems to digital Summary Care Records (GP-SCRs). In theory, the GP-SCR can be updated by other healthcare workers. However, not all secondary care teams currently access or update the GP-SCR. For example, when a patient is discharged from hospital, the GP’s team update the GP-SCR with information provided in the hospital discharge letter.
Entries in the ‘Active Problems’ and ‘Significant Past’ sections of GP-SCRs required selection of textual descriptions from drop-down lists that were recorded as ‘Read Codes’ until Systemized Nomenclature of Medicine Clinical Terms, SNOMED CT, was adopted in 2018. 9 The I-Magic algorithm can be used to convert SNOMED CT entries to ICD-10 codes. 10
Clift et al used the I-MAGIC algorithm to interrogate the GP-SCRs of 8.25 Million UK patients to generate ICD-10 codes in their development of an algorithm (QCOVID) to predict the risk of hospital admission and mortality from Severe Acute Respiratory Syndrome – Co-Variant - 2 (SARS-CoV-2). 11 During 2020, age, deprivation, asthma, diabetes and ethnicity have been identified as important determinants for the risk of death from SARS-CoV-2 and by 15 March 2021 more than 125,000 UK deaths had occurred within 28 days of this diagnosis. 12
We have investigated whether ICD-10 codes generated from Emergency Department (ED.) records identify conditions already recorded in the patient’s GP-SCR, whether the ED. information provided as good a measure of patient vulnerability to dying from SARS-CoV-2 and whether missed GP-SCR codes in ED. were associated with an increased mortality. Understanding these differences in patient outcomes, based on the access to different medical records, will improve healthcare and result in the development of better clinical tools including those based on artificial intelligence.
Methods
A retrospective service evaluation using STROBE guidelines was undertaken on 801 consecutive SARS-CoV-2 positive diagnoses made at or following the admission of 773 patients to Epsom and St Helier’s University Hospitals NHS Trust, through one of our hospital’s two sites (the Trust has two ED.’s), between 9 December 2019 and 17 June 2020. An NHS Trust is a type of organisation within the UK National Health Service. Each Trust provides a specific range of health services such as emergency, urgent and specialist care and is accountable to the UK Department of Social Care.
The data sources used were GP-SCRs, the Trust ED. records and electronic database (Clinical Manager Version 2.0, vMware Horizon Client, iSOFT). Following a PCR confirmed diagnosis, each patient’s General Practitioner (GP) was contacted by email and telephone to request a copy of their patient’s GP-SCR. The Trust’s scanned, paper ED. records were also accessed and outcome data (death or discharge) from the Trust’s electronic hospital database was downloaded.
As our data was derived from GP-SCRs, from 142 GP practices, that were not all generated using the EMIS Health System, we could not be sure that I-Magic would be equally accurate for text entries from non-EMIS, GP-SCR providers. Also, the ED. records were hand-written and not generated using the textual options available on electronic systems and ICD-10 codes were therefore manually allocated to diagnoses. New diagnoses made during the subsequent hospital admission were not included. We validated our coding with those generated using I-Magic by comparing the I-Magic generated codes for 10 EMIS system GP-SCRs with codes that we generated by manually assigning the ICD-10 code that best correlated with the free text description of the condition as it appeared in the GP-SCR. None of the ICD-10 codes generated by I-Magic were missed in our analysis and all the codes appeared similar. Where records were unavailable, patients were excluded from the study.
For ICD-10 analysis, the patients were divided into two groups; those who died in hospital within 28 days of a positive SARS-CoV-2 diagnosis (died) and those who were discharged to home, a care home or to other facilities (survived). The survived group may have included people who subsequently went on to die after 28 days or before 28 days if discharged earlier from hospital. Significant ICD-10 codes were examined individually and were also sub-grouped according to related conditions.
As the data analysed for this service evaluation is routinely collected as part of direct clinical care, ethical committee approval for the evaluation was not required. Data was tabulated using Microsoft Excel (Microsoft, Redmond, WA). Data analysis was undertaken using Microsoft Excel (Microsoft, Redmond, WA) and Python version 3.9. For data analysis t test (unpaired, 2-tail) was used to determine whether there was a significant difference when comparing demographics. Fisher’s exact test was used to compare differences in death rate of patients with a specific condition or group of conditions to those not in the group. Odds-ratio, relative risk, standard error and 95% confidence intervals were reported where appropriate. Multivariate analysis using logistic regression to predict death rates based on the number of missing codes, age above and below 75 and gender as control variables was undertaken. An age of 75 was arbitrarily chosen because an increased age was/is a known risk factor, however, the literature reported increased mortality for ages raging from 65 to 85 years.13,14 Male gender is also a known risk factor. 15 Corelation was reported using R2. Patient confidentiality and information governance were adhered to throughout this service evaluation and data analysis. No additional contact was made, or information collected from the patient, next of kin, GP or any other health care professional.
Results
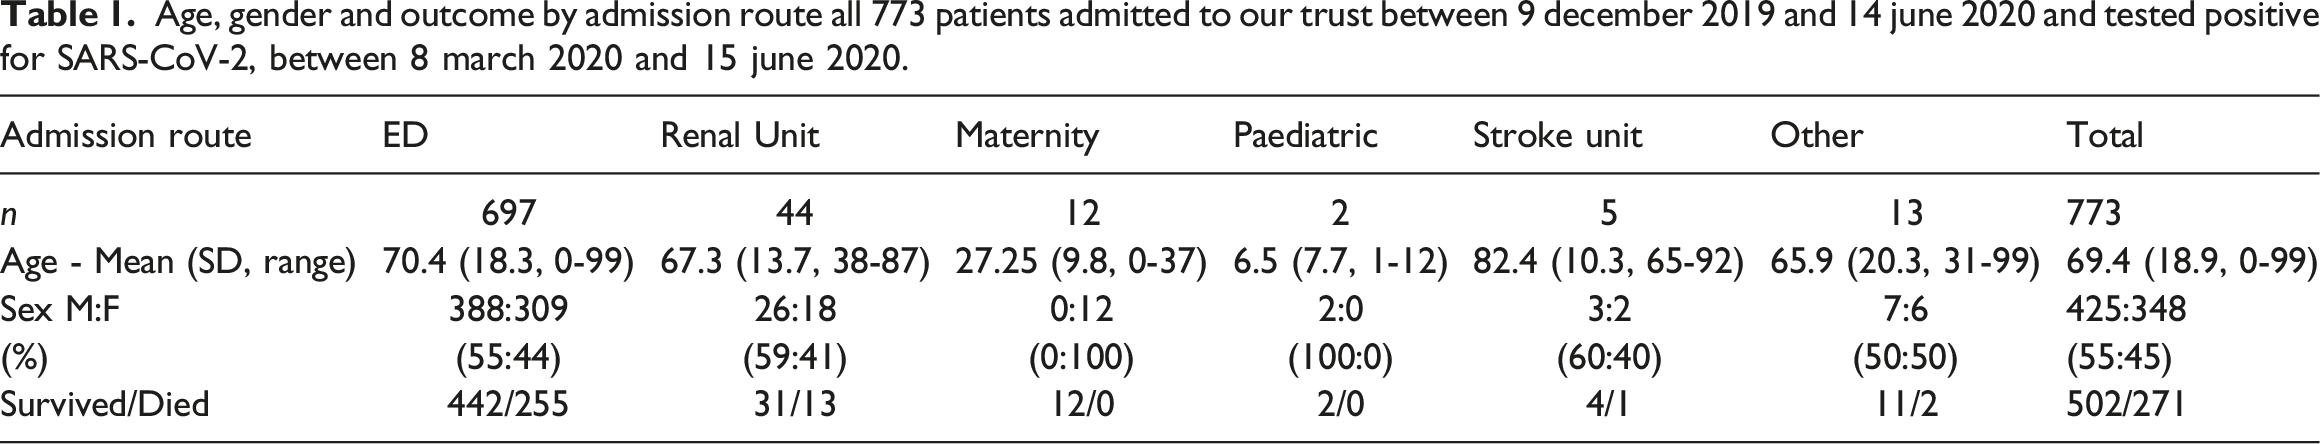
Age, gender and outcome by admission route all 773 patients admitted to our trust between 9 december 2019 and 14 june 2020 and tested positive for SARS-CoV-2, between 8 march 2020 and 15 june 2020.
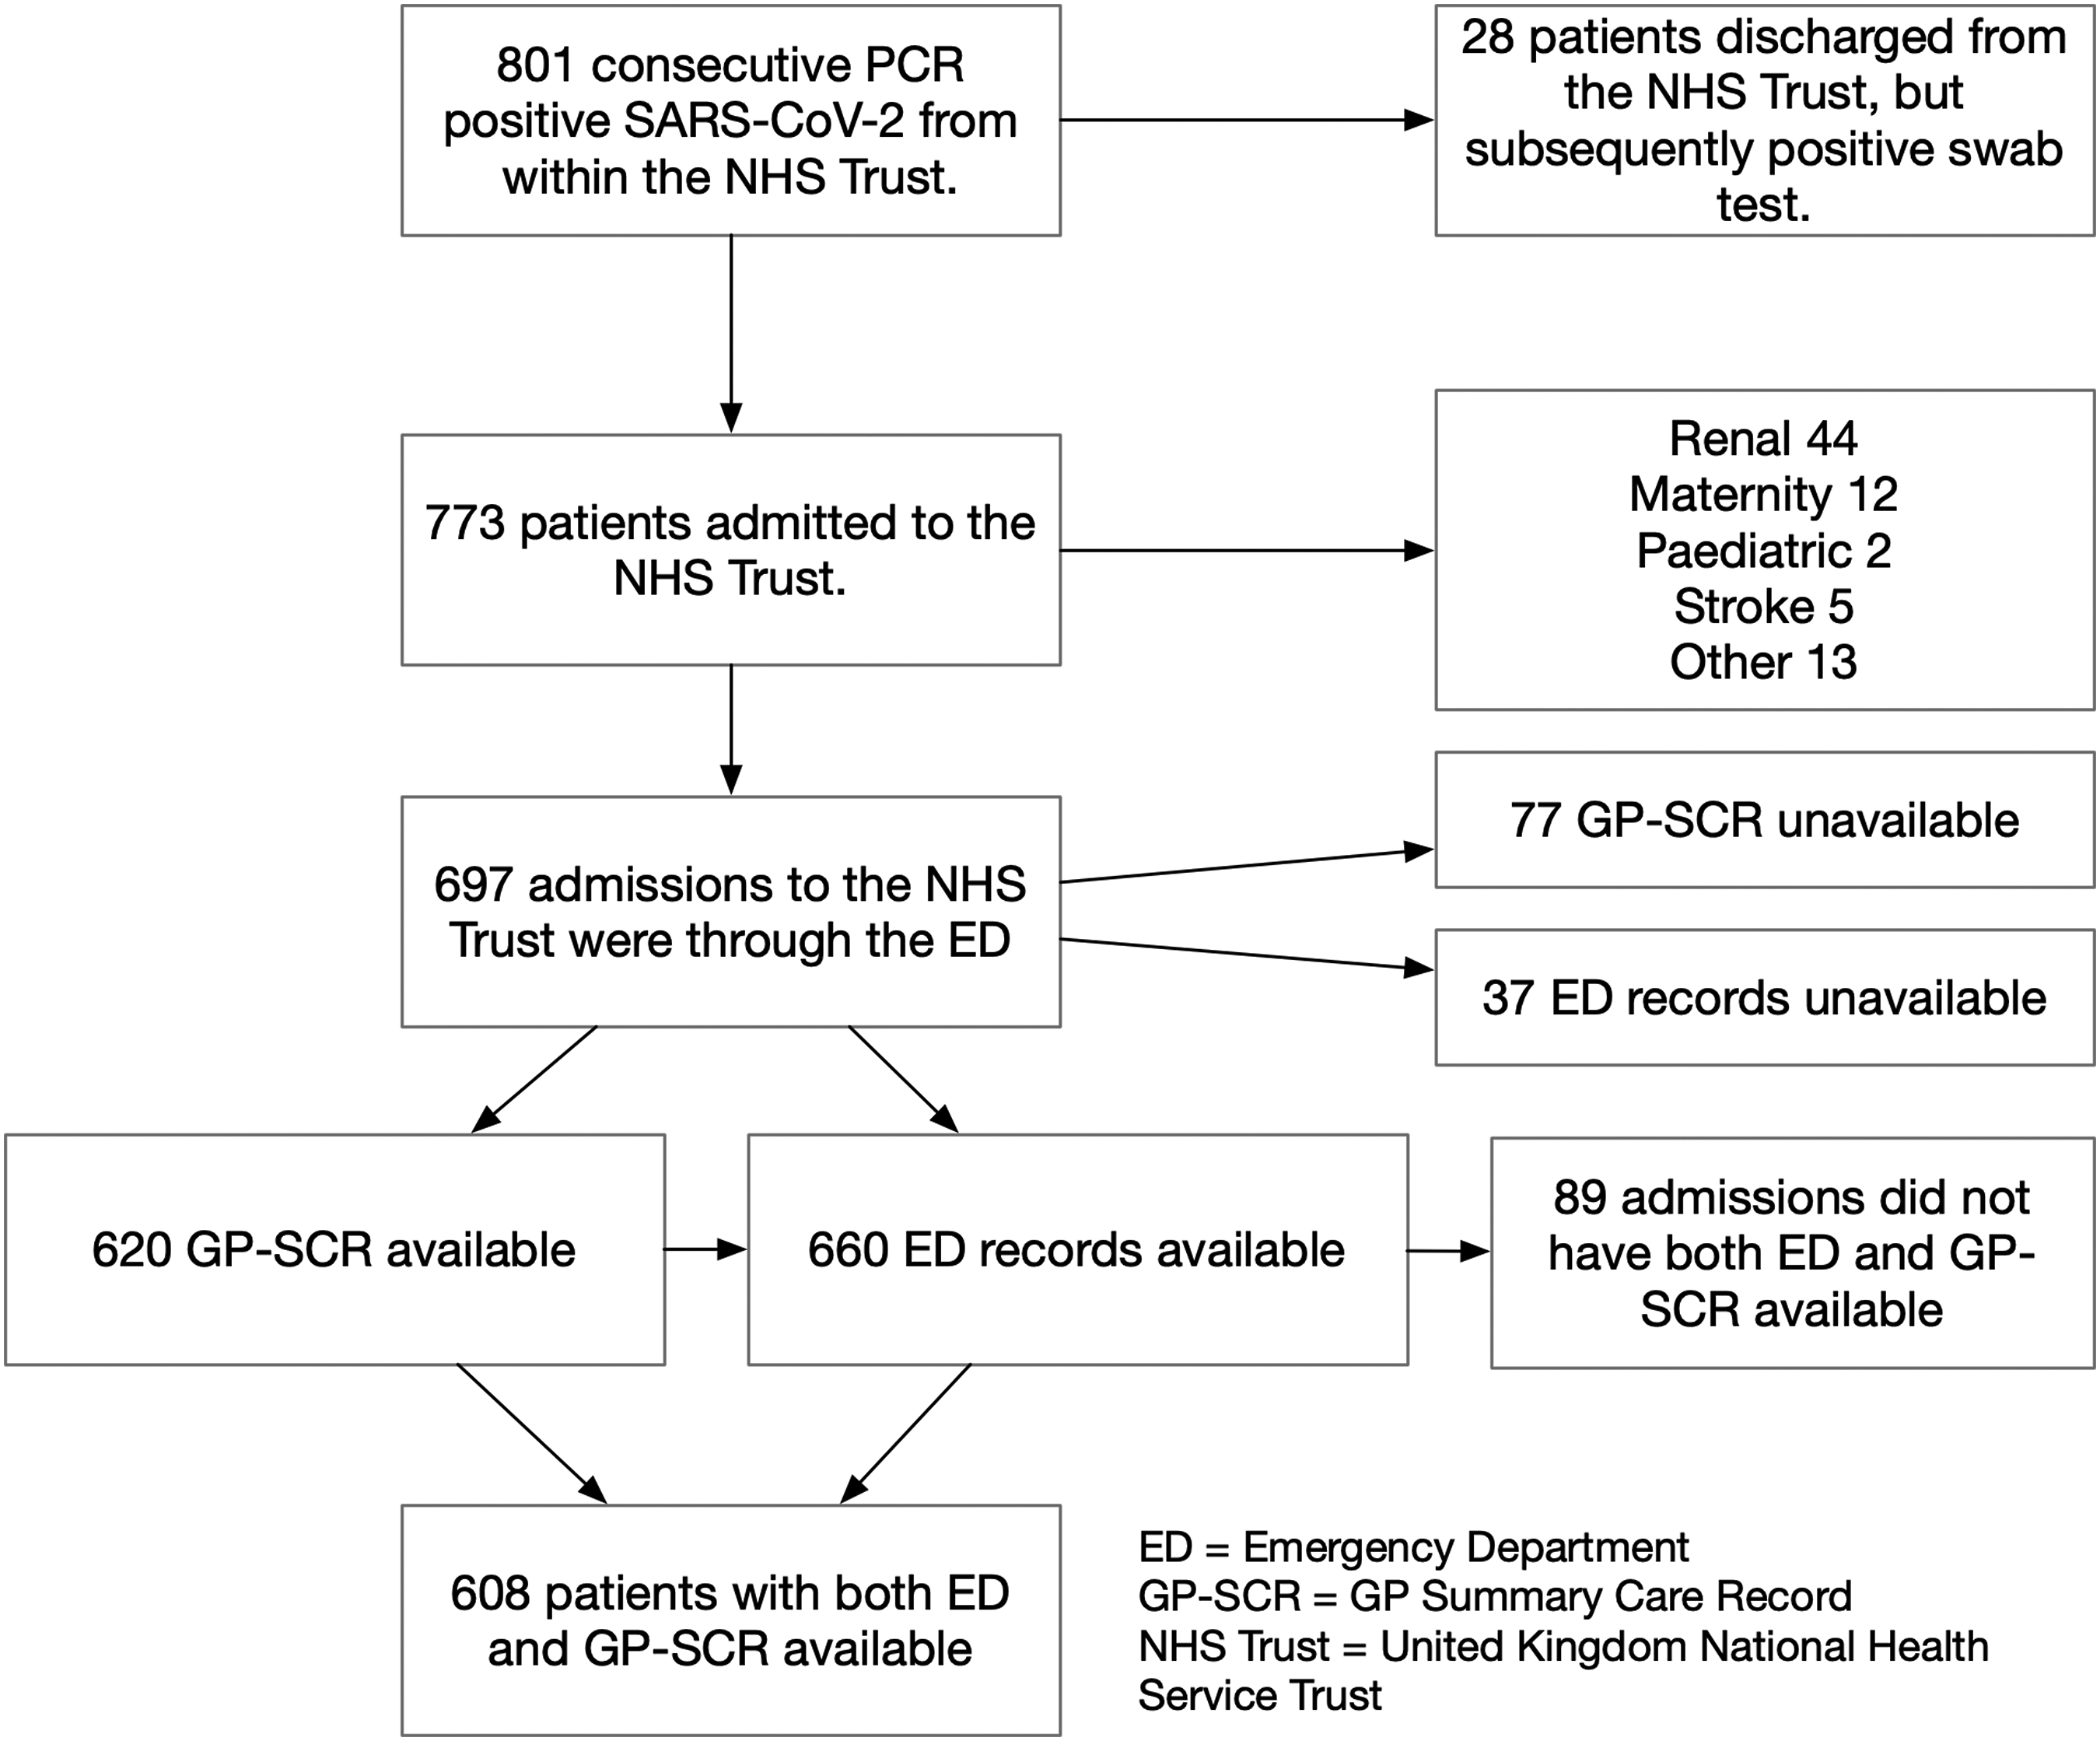
Flow chart showing route of admission for SARS-CoV-2 positive patients.
For the 697 patients admitted via the emergency department we were able to obtain 660 ED records and 620 GP-SCRs. The ED data contained 2864 entries in the “past medical history” section from which we were able to extract 2802 ICD-10 codes, for 328 different conditions. Of the 620 GP-SCRs included, a total of 12,547 entries were extracted from the “Problems active” and “Significant past” sections, which coded for 6700 ICD-10 codes representing 661 different conditions. The average number of conditions for each patient, along with the range and SD, is given for each group as well as the death rate.

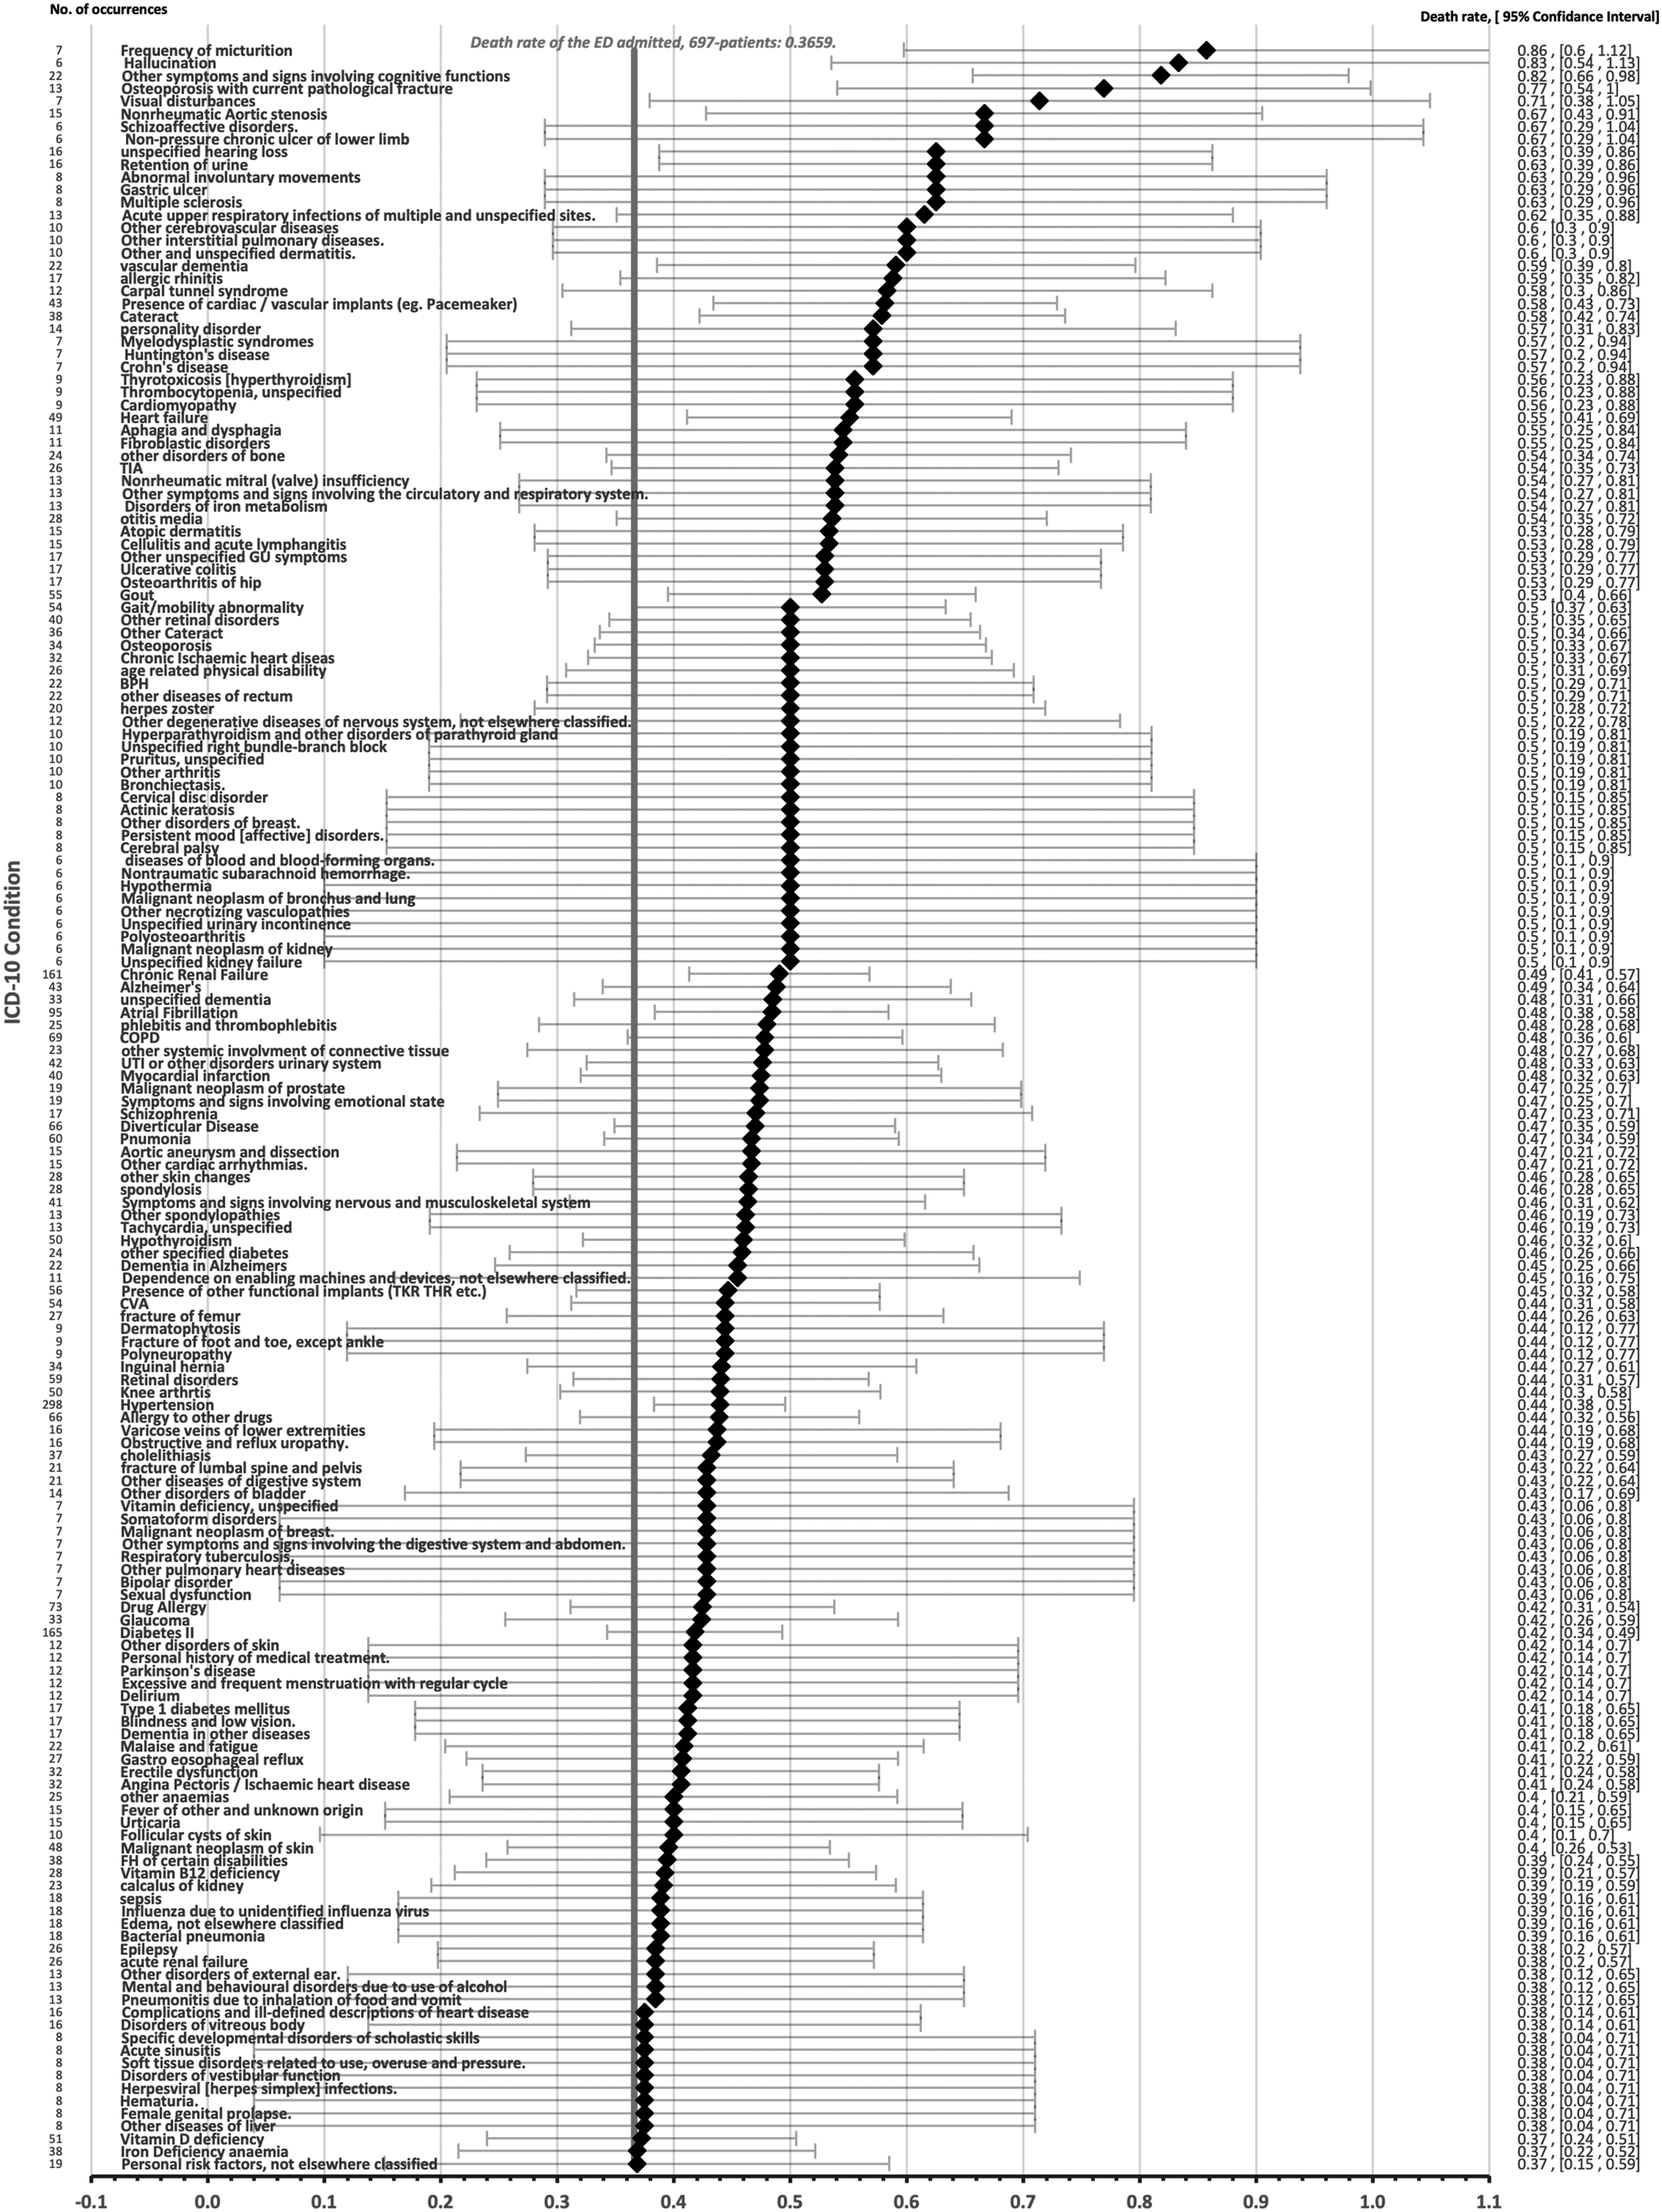
The GP-SCR dataset contained 661 different ICD-10 codes. Figure 2 shows how these codes were subsequently processed and analysed. Of the 661 codes, 257 were recorded six or more times and these accounted for 5793 (86.46%) recorded codes. When the outcome of the patients was examined, a subgroup of 168 codes were associated with a death rate above the ED. admitted, 697 patient average of 0.3659 (Figure 3). Flow chart showing the source of ICD-10 codes used for analysis of the 620 patients who had GPSCRs available and who were admitted through the ED with reference to the tables showing results of analysis. For the 620 GP-SCRs analysed, this figure shows the death rate and 95% confidence interval for each of the 168 ICD-10 codes that were associated with death rate above that of the population mean.
The 168 ICD-10 codes were divided into 17 sub-groups.
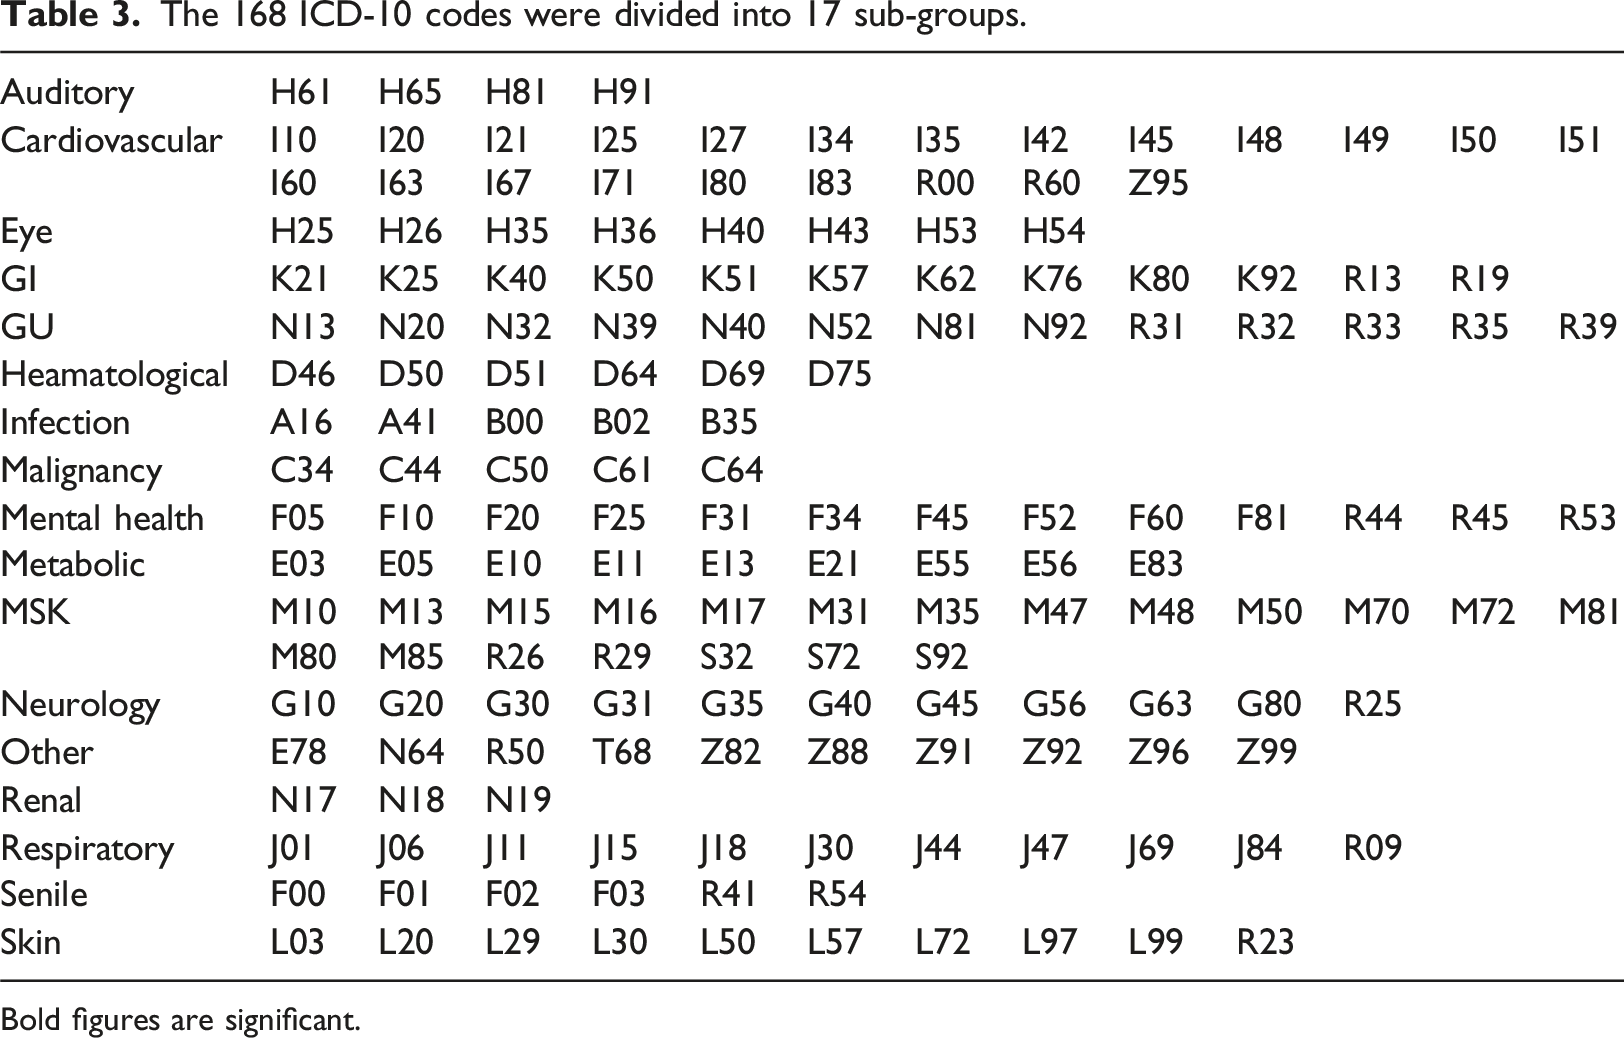
Bold figures are significant.
Statistical significance of the 17 groups of ICD-10 codes.

Bold figures are significant.
13 statistically significant ICD-10 codes with death rate above the population average. These accounted for 824 occurrences, representing 12.3% of total ICD-10 codes for this group.

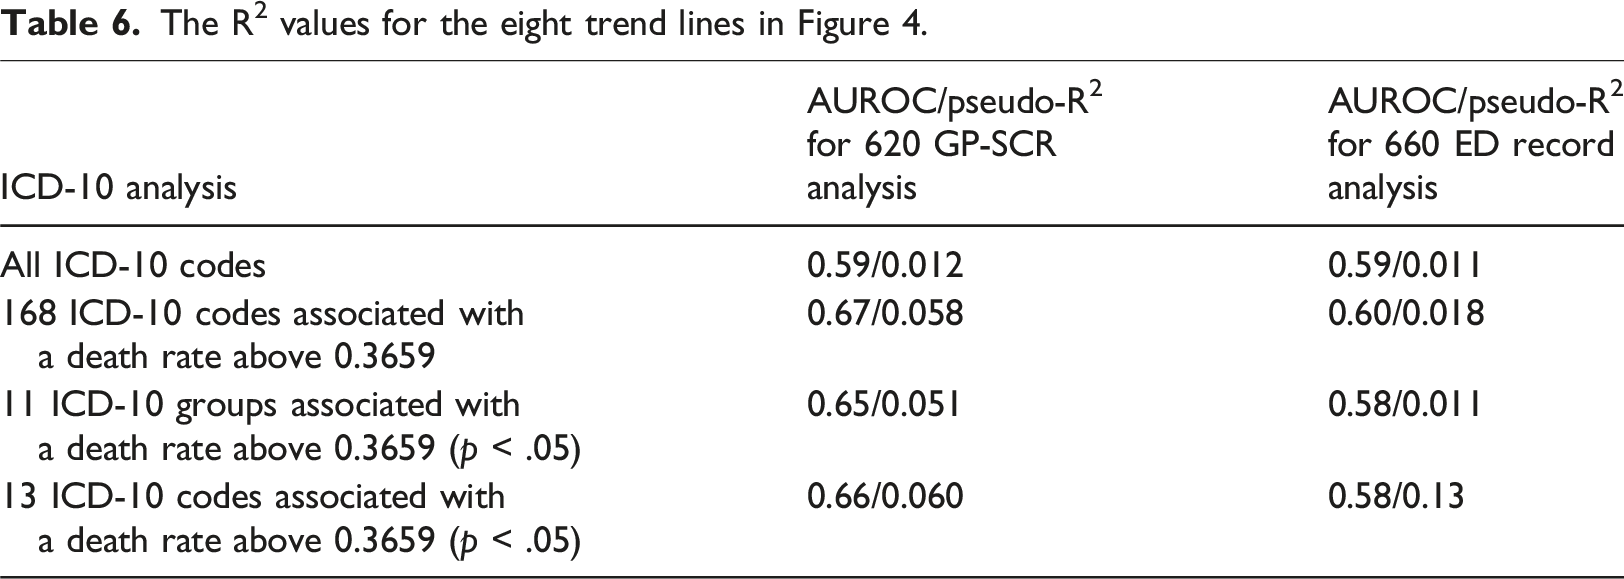
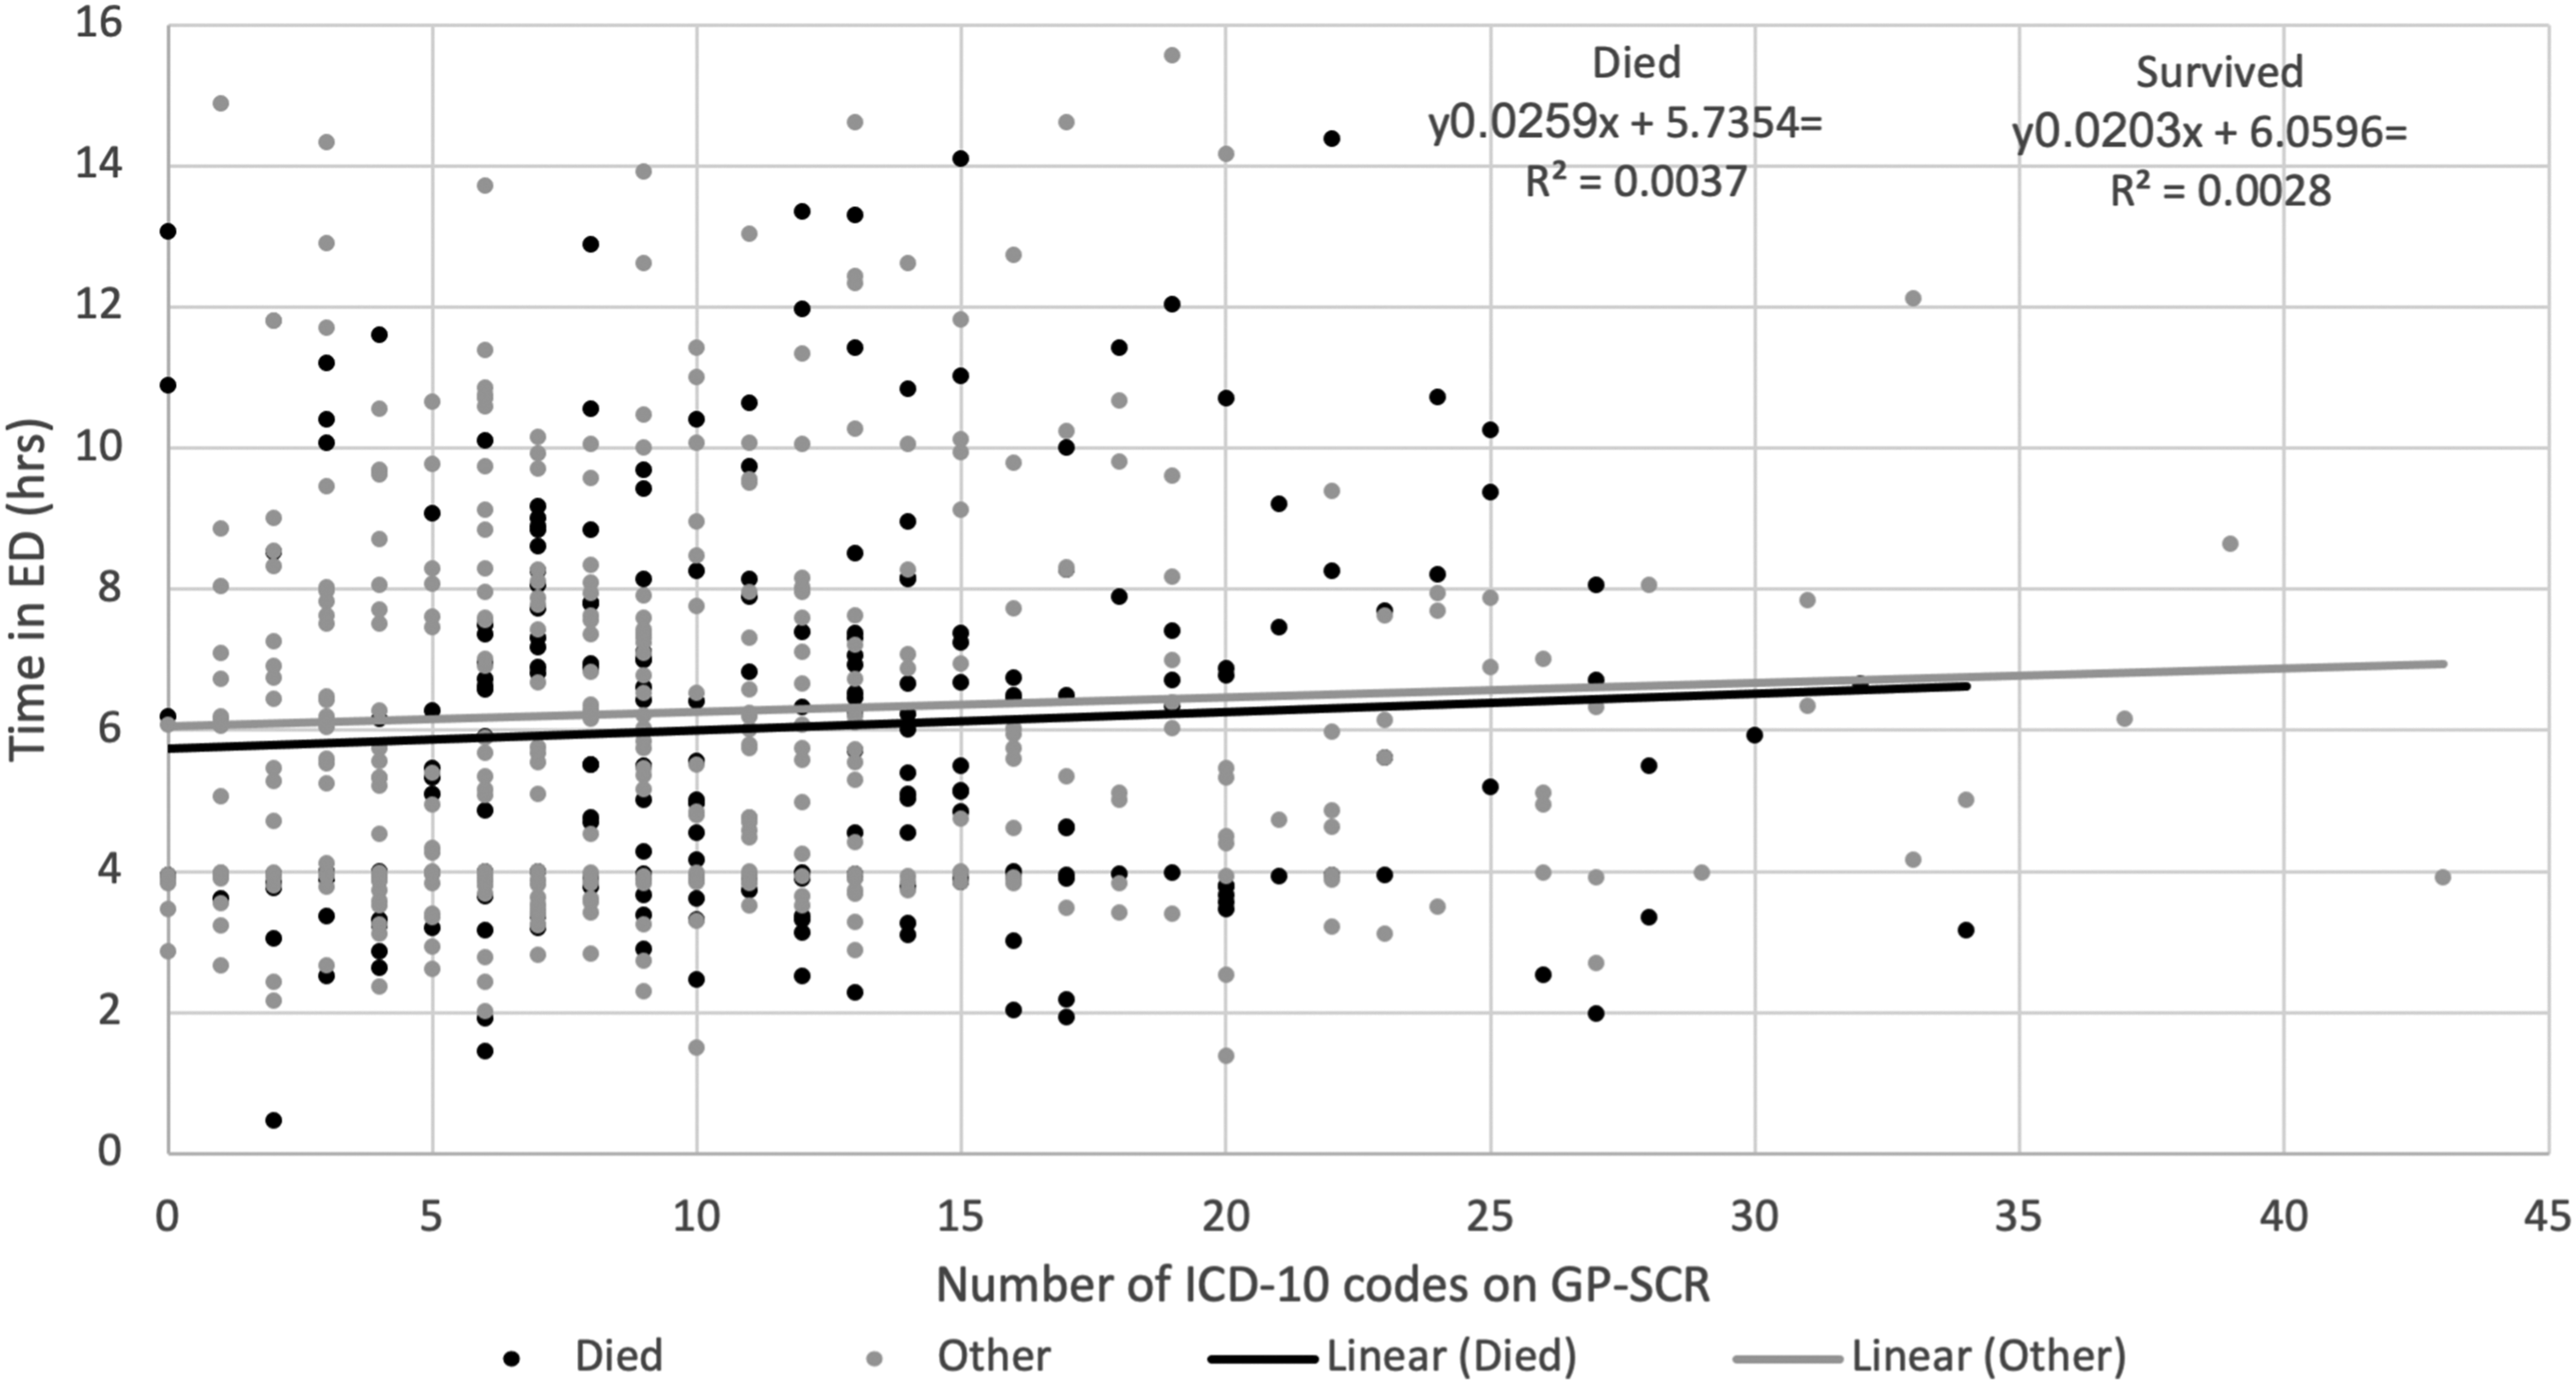
When the number of ICD-10 codes recorded in the 620 patient GP-SCR cohort and the 660 patient ED. cohort were plotted against death rate (Figure 4), increasing death rate with increasing ICD10 codes was observed for the full dataset and the three subgroup ICD-10 scenarios. For the 11-subgroup analyses, logistic regression suggests a positive correlation for both the GP and ED. records with the death rate. However, when the 13 individual codes were analysed, the correlation for GP records was stronger (AUROC (Area Under Receiver Operating Characteristic) = 0.66, pseudo-R2 = 0.060) than that for ED. records (AUROC = 0.58, pseudo-R2 = 0.013) and the difference between AUROC was greatest. This indicates that for individual ICD-10 codes that are known to be associated with higher death rate, the pre-existing GP digital data repository provides a better prediction of mortality than data collected manually during admission clerking in the ED. Furthermore, only 12 ED. derived codes were significantly associated with a death rate above 0.3659. Of these, five matched the most prevalent diagnoses identified in the GP-SCR analysis. The remaining seven were infrequent diagnoses. The AUROC and pseudo-R2 values for the eight analysis trend lines are shown in Table 6. Graph showing the number of GP-SCR ICD-10 codes plotted against death rate for the 620 patients for whom a GP-SCR was obtained (black) and the number of all ED ICD-10 codes for the 660 patients ED admitted patients with an available ED record (Gray). The different lines represent different subgroups defined in the main text and below the graph. The graph excludes cases with occurrences of 3 or less patients. The R2 values for the eight trend lines in Figure 4.
For the 620-patient group, 57.74% were male. The death rates for the male and female patients were 0.49 and 0.32 respectively. The average age of the patients who died was 77.53 (SD 13.2, range 22-99) and the average age of the survivors was 66.61 (SD 18.5, range 0-97). Ethnicity background was declared for 581 patients. Of these, the average age of the BAME population was 57.5 (n = 132, SD 18.1, range 0-94), and for the White population, 75.0 years-old (n = 449, SD 15.2, range 0-94), (significance p < .0001). The average Index of Multiple Deprivation Decile score for the BAME population was 6.47 (SD 2.6, range 0-10) and for the White population, 7.6 (SD 2.6, range 0-10, p < .0001). Death rate for the BAME population was 0.27 and for the white population 0.42 (p = .0031).
While the number of ICD-10 codes increased slightly with increasing age for the patients who survived, the trend was less marked for the patients who died (Figure 5). Furthermore, the duration of time that patients with differing numbers of ICD-10 codes (or age, data not shown) spent in the ED. (prior to admission to the main hospital) did not correlate to outcome (Figure 6). Age at admission vs. No. of ICD-10 codes on GP-SCR for patients who died or survived (n= 620). Number of ICD-10 codes vs. the time each patient spent in ED.
Patient matches were obtained for 608 of the 620 GP-SCRs and the 660 ED. records. This reduced the total number of ICD-10 codes in the GP-SCRs to 6604 (Average 10.86, SD 7.05, Range 0-43). The ED. records of the 608 patients provided 2600 ICD-10 codes (Average 4.28, SD 3.21, Range 0-24). Of the 608 matched patients, 230 died (37.83%) and 378 (62.17%) survived.
Analysis of 608 patients with matched GP-SCR and ED records.


A multivariate analysis using logistic regression to predict death rates based on the number of missing codes, including age and gender as control variables was undertaken using the 11 groups data set, for the influence of the number and proportion of codes missed in the ED. records. The visual trend seen in Figure 7 suggests an association between the number of missing codes and the death rate. When this analysis is undertaken for patients over 75 years, the lowest line shows the death rate when a patient had only one GP-SCR code that was either recorded or missed. As the number of codes recorded on the GP-SCR increases the number of possible missed codes also increases providing more data points for the line. With roughly 600 data points, our regression analysis clearly finds an association between the number of missing codes and the death rate. However, more data points would be needed to find more specific relationships, for example which missing codes resulted in the highest increases in death rates. Such an analysis is left for future work. Multivariate analysis using 11 groups data set looking at the influence of number and proportion of codes missed in the ED records. The graphs show death rate against the proportion of missed codes according to the number of codes on the GP-SCR for patients aged over 75 years.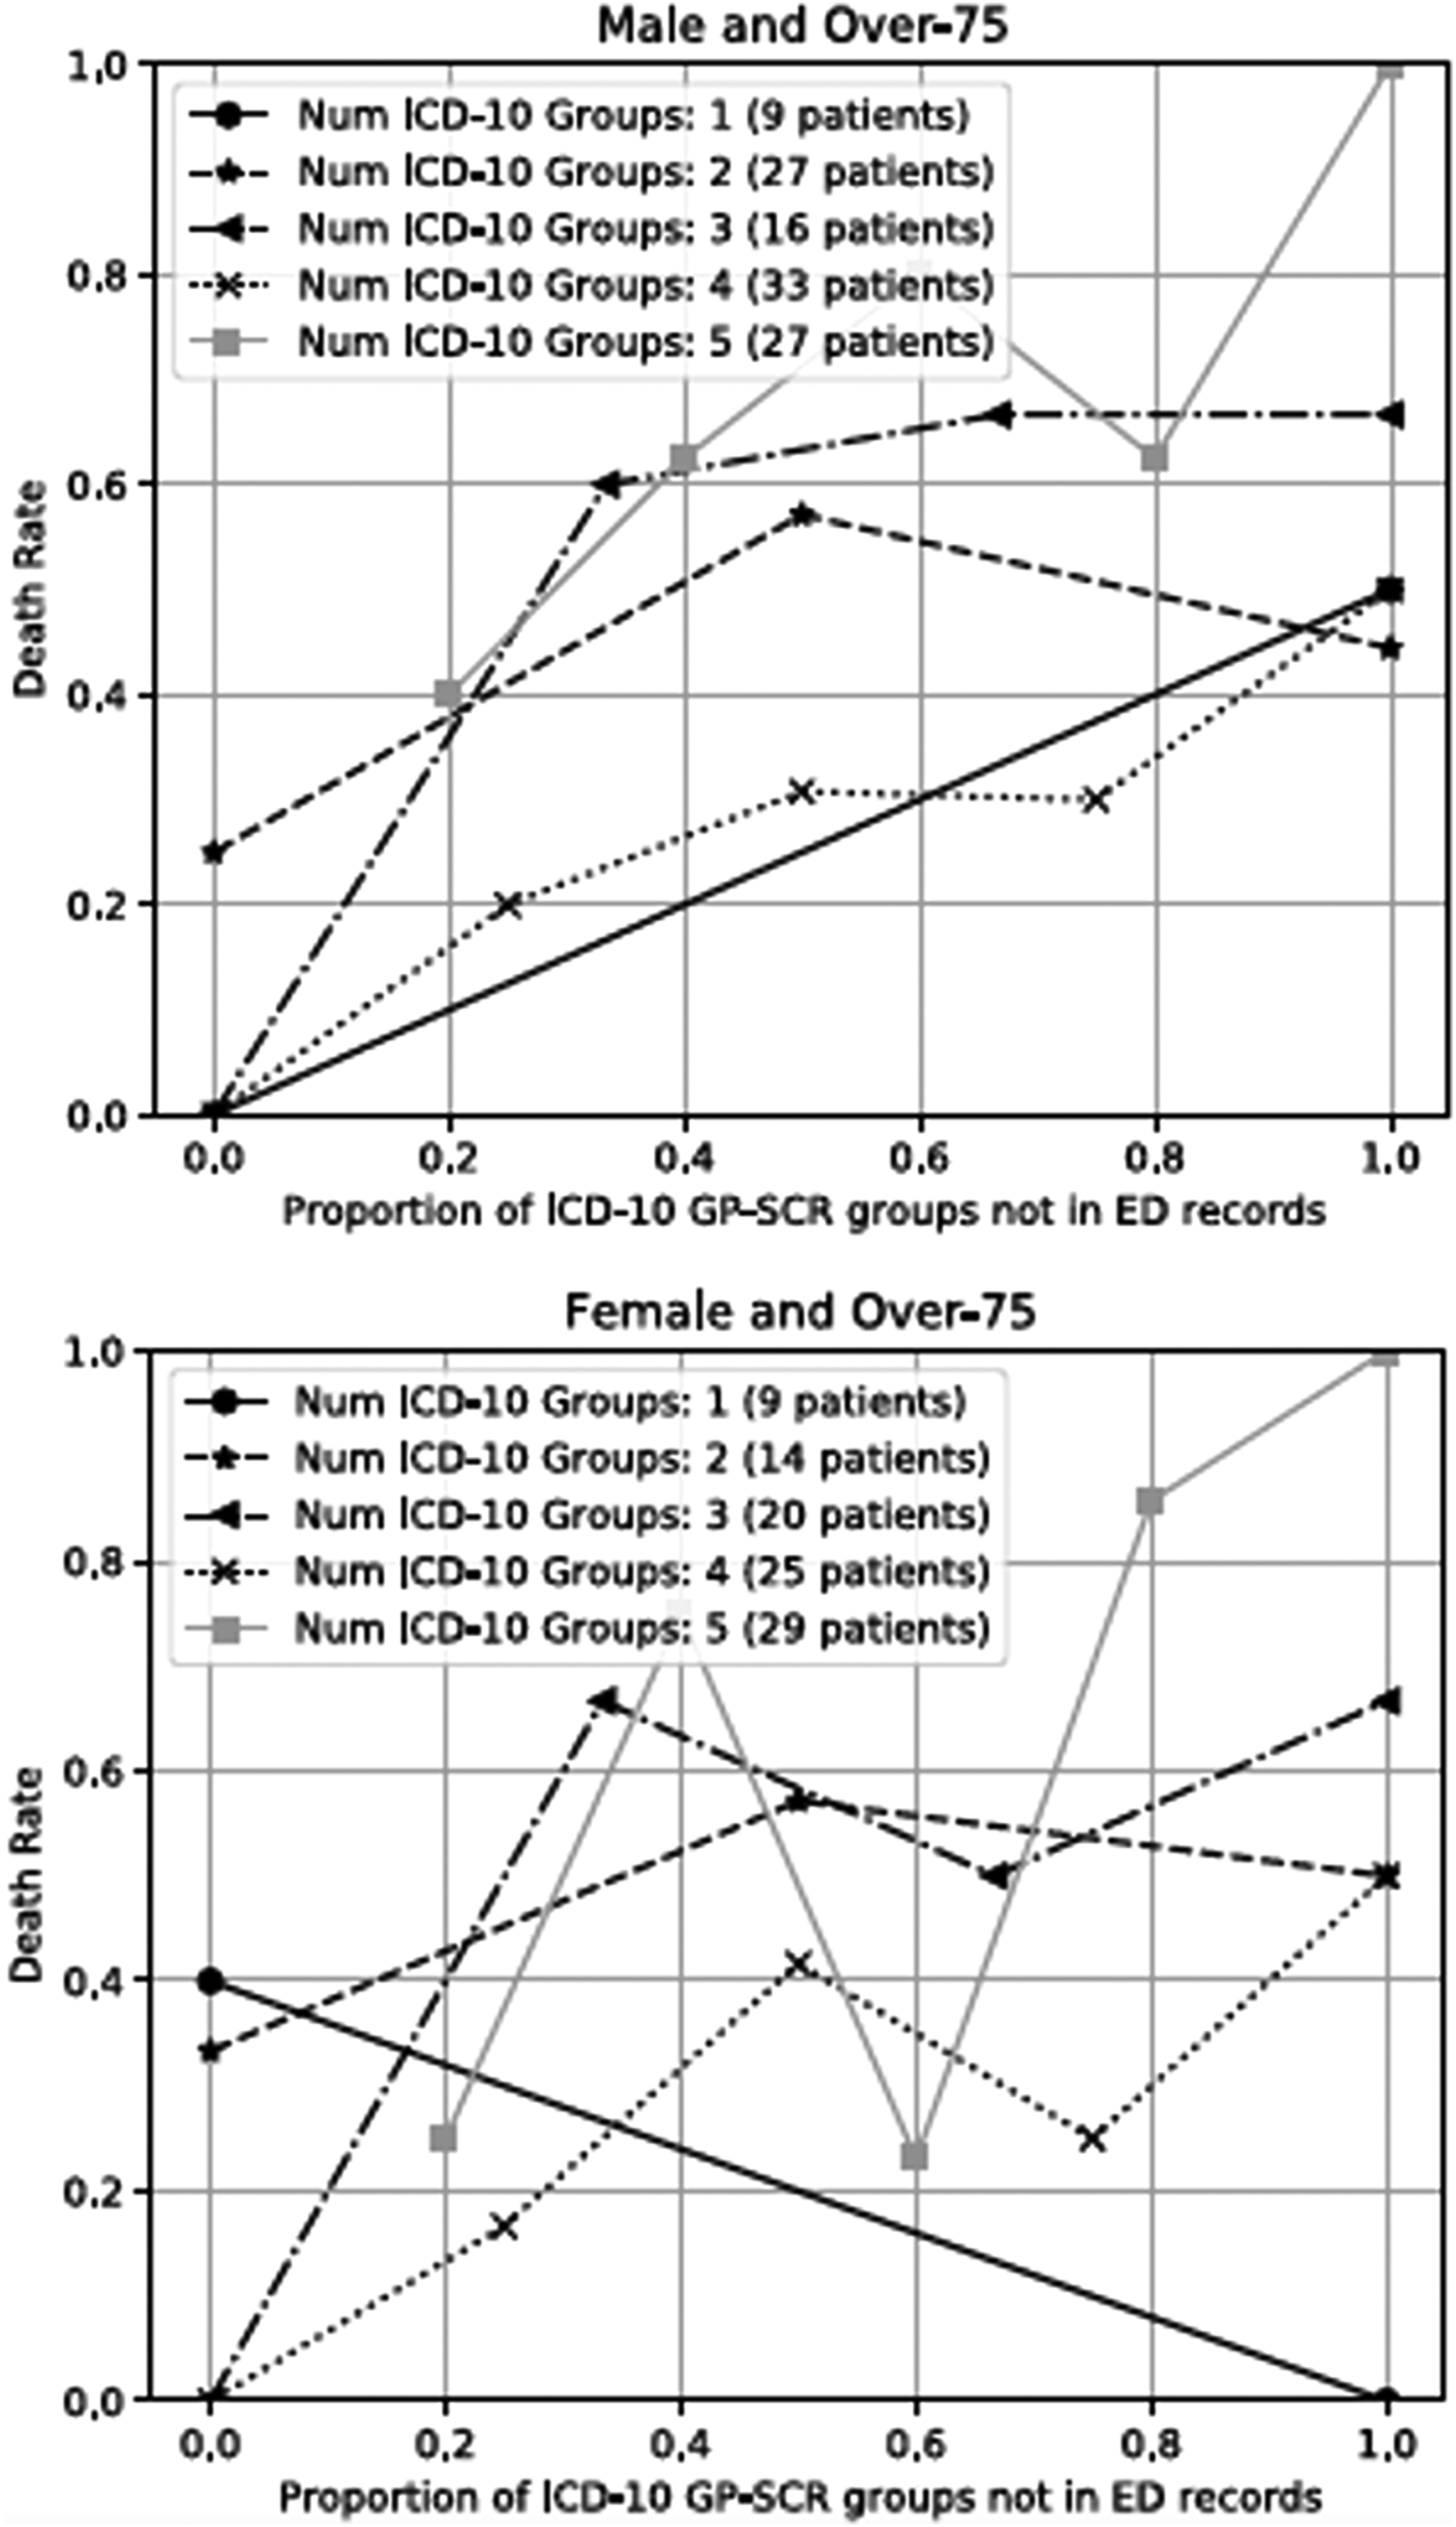
Discussion
We have confirmed that, for patients admitted to hospital with SARS-CoV-2 infection, vulnerability to death increases with increasing ICD-10 codes in their GP-SCR. This is unsurprising as we accumulate more ICD-10 codes with increasing age and deteriorating health. This trend was less marked in those who died than those who survived, suggesting a greater vulnerability to dying with particular pre-existing medical conditions. On both counts, improved ED. access to the GP-SCR would be advantageous because this would allow accurate determination of the relevant co-morbidities associated with higher death rate, that are otherwise missed in the ED. (access to more codes alone will not help).
When all codes are included, the GP-SCR is a better predictor of mortality than the ED. record (See Figure 4 and Table 6). This advantage is perpetuated through all our subset analyses. In all scenarios, ICD-10 codes were recorded in the ED. records that had not been recorded in the GP-SCR. This may reflect inefficiencies in updating GP-SCRs with new diagnoses from the secondary and social care settings.
When we analysed ED. records (rather than GP-SCRs), we did identify some differences in the most significant codes; only five matched the diagnoses in the GP-SCR, suggesting that GP-SCR records contained more relevant information that better predicted death.
While our data did not allow us to calculate the number of excess patient deaths related to failed identification of known ICD-10 codes in the GP-SCR, our multivariate analysis does indicate a trend towards increasing mortality as the proportion of missed ICD-10 code groups increases with increasing GP-SCR, ICD-10 diagnoses. One explanation for this relationship may be that as the number of codes increases so does the probability of codes being missed. To mitigate this, we used proportion of missed codes instead of absolute numbers for the analysis. However, if our observation is correct, better data sharing within the NHS could have avoided some of the SARS-CoV-2 related deaths.
A strength of this study was the allocation and analysis of ICD-10 codes for 608 GP-SCR and ED. records. However, we experienced some difficulties with the categorisation of past medical history and active problem sections in the GP-SCR. Combining these categories may have resulted in the inclusion of some historic information of little current relevance. Another potential weakness was the possibility of errors during manual data transcription. Also, our survived group may have included people who subsequently died before or after 28 days outside hospital. Another limitation of this study is the modelling assumes that there is no difference in the data from different (multi-level) GP practices. Additionally, time to event analysis was not possible because the exact start of the infection was not known, patients were admitted to the hospital at different time points during the infection and with differing severity (some patients also developed SARS-CoV-2 infection in hospital). Recording fidelity of GP-SCR may have been reduced during the SARS-CoV-2 pandemic. However, this is unlikely to be a limitation since most medical conditions would have been recorded the pre-pandemic. If the fidelity of the ED. records was reduced during the pandemic, this only supports the need for better access to GP-SCR data. Finally, some of the differences seen in our results were non-significant.
Clift et al’s study was undertaken on a population derived from 1205 GP practices, with 8.25 million registered patients and 6727 Covid-related deaths. 11 Ours only analysed 255 deaths from 142 different GP Practices. Clift et al 11 investigated ICD-10 codes that were anticipated to be most relevant for patients with SARS-CoV-2 infection. In contrast, we included all possible codes and identified codes and code groups that were most associated with an adverse outcome. Unlike Clift, we do not know how many patients are registered to the practices or how many patients from these practices were admitted to other hospitals. Also, we do not know how the GP-SCR records of our patients compare with those of patients who did not contract SARS-CoV-2 infection or patients who did contract the infection but did not require hospital admission. Additionally, our methodology for ICD-10 code assignment was different.
Like Clift et al., we have shown that a relatively small subset of ICD-10 codes can be used to identify increased vulnerability to death following admission with SARS-CoV-2 infection. 11 If specific ICD-10 code combinations provide indicators of vulnerability to poor outcome for other medical conditions, the application of machine learning to GP-SCRs may identify ICD-10 code associations for these conditions and would provide both primary and secondary care health providers insight into a spectrum of patient vulnerabilities. Tsang et al. reported increased algorithm accuracy to detect cardiac amyloidosis when using training data based on a combination of GP and Hospital Episode Statistics (HES) ICD-10 code data instead of HES data alone (AUROC = 0.86 vs 0.78). 16 Our study supports their findings that data sharing can lead to the development of improved artificial intelligence algorithms by reducing bias.17–20
Although a previous study investigated discrepancies between GP-SCR data and medications identified in ED. records,
21
we believe this study is novel because it is the first to compare ICD-10 data derived from the GP-SCR with the information gathered by ED. staff. ED. records only comprised 39% of the ICD-10 codes that were extracted from the full GP-SCR dataset, when subset analyses were undertaken for the 168 code, 11 code groups and 13 code subsets, the proportion of ICD-10 codes most pertinent for SARS-CoV-2 increased to 47%, 55% and 67% respectively. These 13 conditions can be broadly divided into two groups, cardiovascular and age related conditions, in agreement with known risk factors.
22
Diabetes was not one of our 13 statistically significant ICD-10 codes. This may be attributed to the relatively small size of our study population and conditions associated with diabetes, such as cataracts and chronic renal impairment were found to be significant. Regarding BAME patients, we attribute our finding to relative youth outweighing slightly greater deprivation.23,24
Unlike pre-pandemic times, patients attending the ED. with SARS-CoV-2 cannot be accompanied by relatives or carers. In consequence, history taking may be more challenging particularly for patients with more complex past medical histories and impaired cognitive function. While factors such as respiratory compromise may have negatively influenced the ability of ED. staff to obtain a full history from the patients, we did not observe any difference in duration of ED. stay for the patients who died and could not attribute the higher rate of missed diagnoses to a shorter time in ED. for patients requiring more urgent in-patient care.
This study has been undertaken during a period of extreme stress on national healthcare services and highlights one of the benefits that shared electronic patient records would provide. The aspiration to share electronic patient records across primary, secondary and social care sectors has driven IT developments for almost two decades. While saving lives is normally associated with the work undertaken by frontline healthcare staff, this study clearly demonstrates that management initiatives to improve data sharing across the healthcare sectors and IT systems, to support clinical activity, also have a vital role in optimising patient care and will allow the development of more accurate algorithms in the future.
Footnotes
Author contributions
All authors contributed to the methodology of the paper, data analysis and draft review. AS participated in collection, cleaning and analysis of the data, graph formatting and manuscript reviewing and drafting and preparation for submission. VA (corresponding author) and RF did majority of the drafting and writing of the paper as well as in depth data analysis. BM, FG and IA collected, cleaned and tabulated the data. They assisted in the planning and writing of the manuscript and the preparation for submission. MS is an accredited clinical coder, who helped and guided with the ICD-10 coding. CK is a data analyst who contributed to the data analysis and writing of the paper. DS and RF are senior authors who critically reviewed the study process including data collection, analysis, writing and reviewed the drafts and helped with editing of the manuscript.
Declaration of conflicting interests
The author(s) declared no potential conflicts of interest with respect to the research, authorship, and/or publication of this article.
Funding
The author(s) received no financial support for the research, authorship, and/or publication of this article.