
Abstract
The objective of this study was to apply the Knowledge Discovery in Databases process to find out if beneficiaries of a private healthcare insurance would belong, at least once, to the ‘very high cost’ and ‘complex cases’ groups throughout the 12 months after the month when algorithms were applied. Datasets were built containing information on beneficiaries’ effective use of their health plan, as well as their characteristics. Five machine learning algorithms were used, namely Random forest, Extra tree, Xgboost, Naive bayes and K-nearest neighbor. The K-nearest neighbor algorithm had a recall rate of 81.12%, 83.77% precision and an Area Under the Curve (AUC) value of 0.9045. The study also revealed that categorization occurs, on average, 8.11 months before a beneficiary entering, for the first time, a high-risk group, considering the dataset classification from January 2019 to June 2020.
Introduction
Health is a fundamental right and instrument of citizenship. In 1946 the World Health Organization (WHO) defined health as a state of complete physical, mental and social well-being, and not just the absence of disease or infirmity. 1 In Brazil, the guarantee of access to health is determined by the Constitution and, according to the Organization for Economic Co-operation and Development (OECD), Brazil allocated 9.6% of its GDP to health expenditures in 2019. 2
The health system in Brazil is composed of the public and private subsystems. The public subsystem is characterized by the Unified Health System (SUS), which aims to ensure full, universal and free access for the entire population of the country, 3 with a tripartite financing model, in which the Union, states and municipalities are responsible for transferring resources to the SUS. 4 Meanwhile, the private subsystem is represented by two models: the classic model, in which the patient makes direct payment to the service provider through their own resources, and also by the supplementary health model, which is formed by the services financed by the health plan providers. 5 The performance of the private sector in health enables access to health services for a significant portion of the Brazilian population, as it makes up for the inefficiencies of the public sector. In 2019, health plan providers were responsible for serving 47.07 million beneficiaries, 6 representing 22.2% of the Brazilian population. In addition, health in Brazil is more dependent on the private subsystem when compared to other countries, 2 financing 55% of health expenditures, while the total observed in OECD countries was 25%.
However, despite the economic representativeness and the number of beneficiaries assisted, health care providers in Brazil face a scenario of uncertainty. The loss ratio of providers, which is the expenditure-to-revenue ratio, was 83.24% in 2019. 6 In recent decades, 564 health care providers have ceased their activities, with the number of providers dropping from 1289 in December 2000, to 725 in December 2019. 6 In addition, between 2014 and 2019, Brazil went through a period of economic downturn, in which GDP shrank on average 0.3% per year, 7 impacting the generation and maintenance of jobs, seeing a decrease of 3.46 million beneficiaries in the same period. 6
From a financial standpoint, projections indicate that Brazil’s health expenditure in relation to GDP can grow from 9.6% in 2019 to 12.6% in 2040, perhaps even up to 13.3% considering additional cost pressures. 2 This increase surpasses the estimates for the OECD countries, which averages at 10.8% in 2040.
Given this scenario, techniques should be adopted that enable the creation of effective strategies and assist managers in decision making. In health, data is an important raw material and is present in the various stages of the process, from the request for health services by individuals and execution of care by health professionals, to the allocation of goods and human resources. KDD (Knowledge Discovery in Databases) is the nontrivial process of identifying patterns in valid, novel, potentially useful and understandable data. 8 Applied to the context of health, the KDD process can assist in interpreting consumption patterns, predict deterioration in a patient’s general health condition, or even determine the transition between risk levels of a hospitalized patient, etc.
Studies show that a small group of beneficiaries tends to have high representation in medical expenses and, consequently, should be evidenced and analyzed in relation to the others.9–11 Given this perspective, in recent years, initiatives can be observed in the use of algorithms for the identification of high-cost patients.12–18
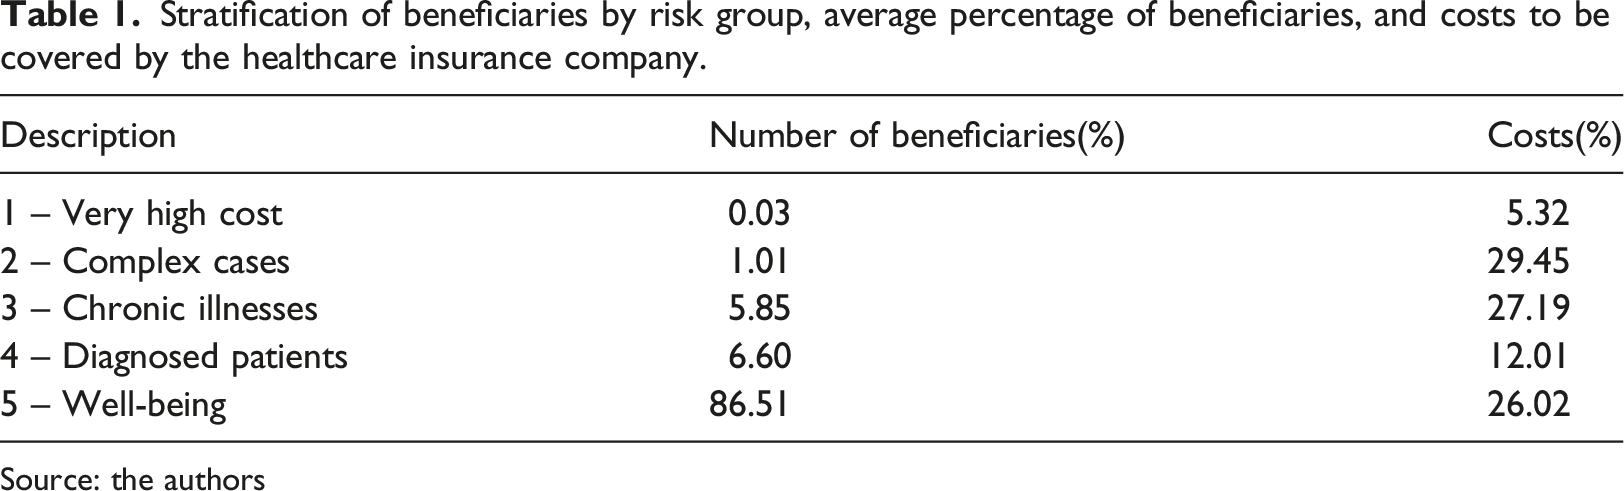
With this, motivation emerged in identifying high-cost beneficiaries in a private health insurance company. In September 2021, the provider in which the study was conducted had 161,893 beneficiaries, and 1.04% of the beneficiaries with the highest care expenditure represented 34.77% of the costs. The purpose of this work was to identify high-risk beneficiaries using the knowledge discovery process in databases. Thus, with the use of mechanisms to highlight a small group of beneficiaries, the effort of the professionals involved tends to become centralized, in addition to enabling more personalized decision-making.
Materials and methods
This study was carried out in a private healthcare insurance company, in the State of Paraná, Brazil. In 2021, the organization had 161,893 beneficiaries, and its entire network consisted of 843 doctors, 50 clinics and 13 hospitals in 23 different cities. Nevertheless, since the company in question is part of a national private healthcare system, its beneficiaries can be assisted in health care facilities spread across the country. Considering the age range proposed by the National Supplementary Health Agency,
19
which is the entity that regulates private healthcare in Brazil, the profile of the company’s beneficiaries in September 2021 was as shown in Figure 1. The company’s beneficiaries in september 2021, divided into age groups. Source: the authors.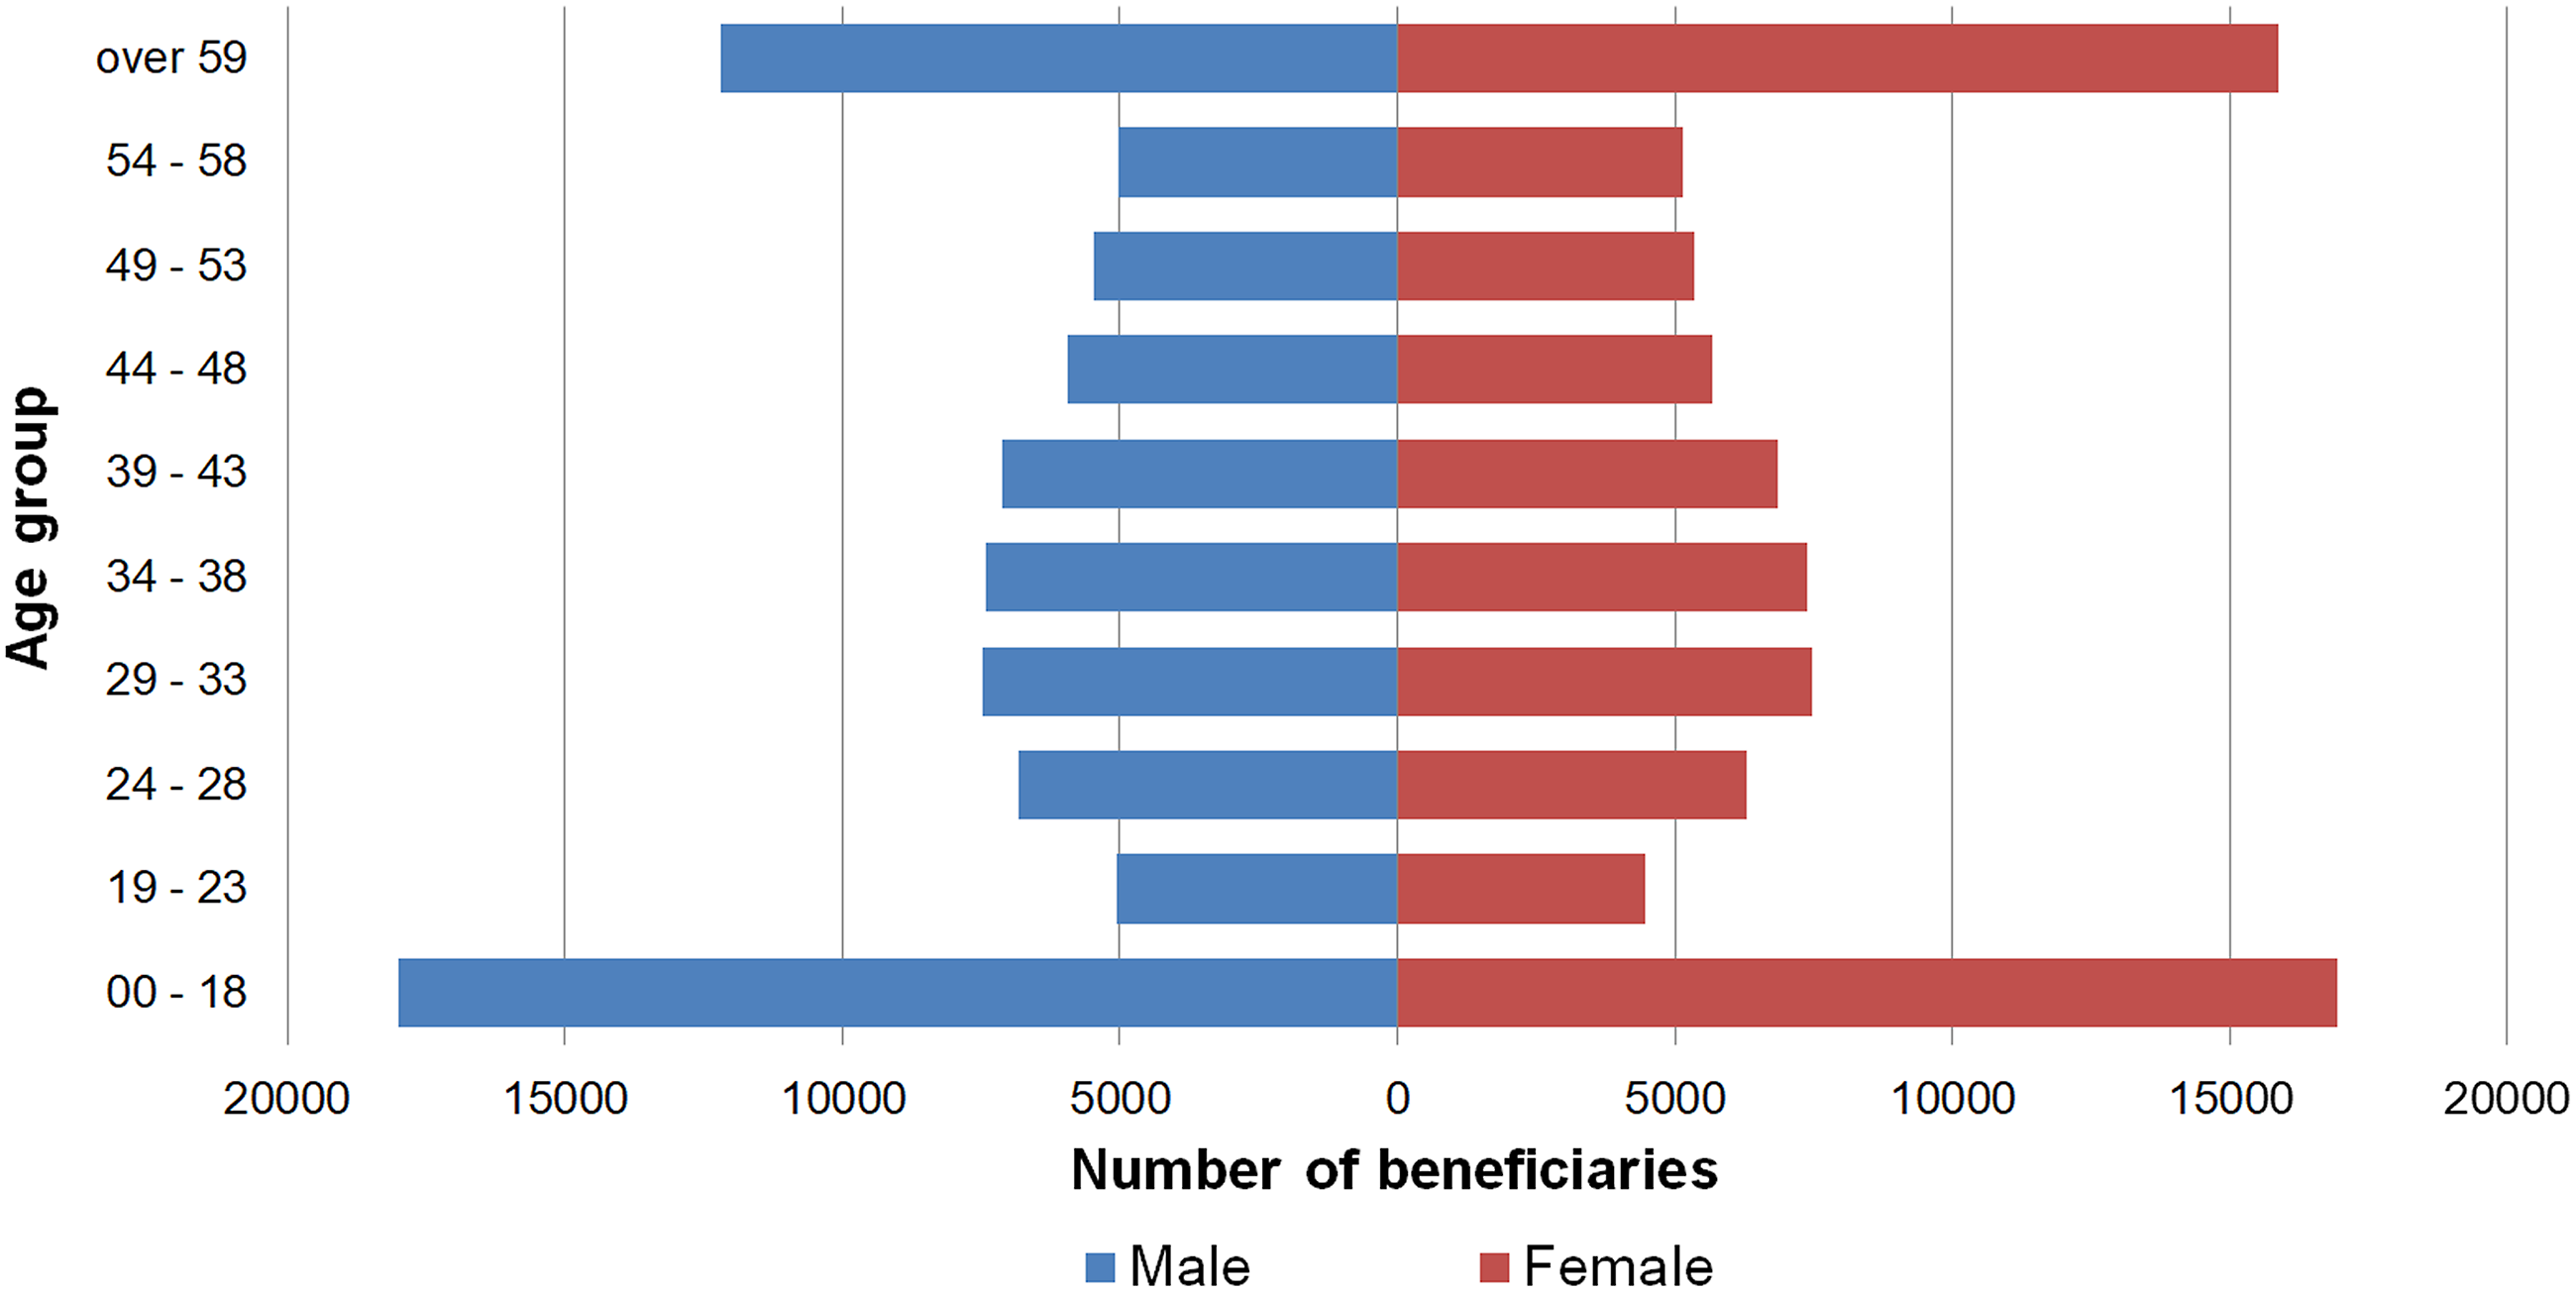
Stratification of beneficiaries by risk group, average percentage of beneficiaries, and costs to be covered by the healthcare insurance company.
Source: the authors
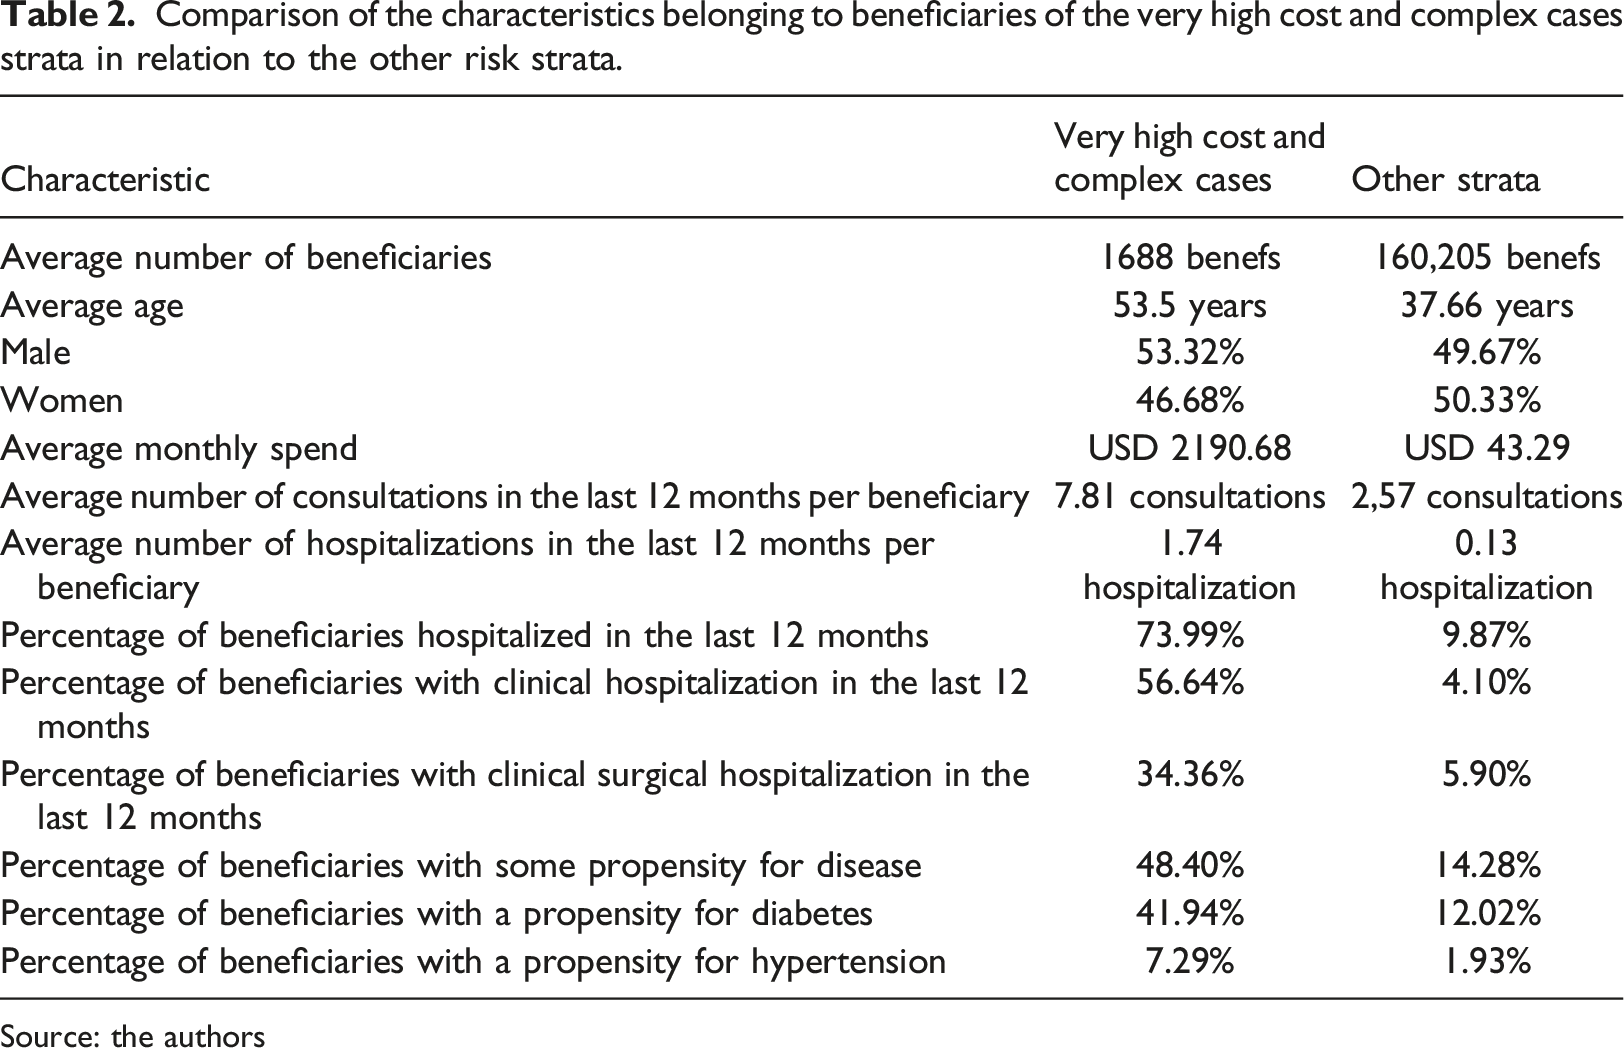
Comparison of the characteristics belonging to beneficiaries of the very high cost and complex cases strata in relation to the other risk strata.
Source: the authors
The objective of this study was to discover if beneficiaries would belong, at least once, to the ‘very high cost’ and ‘complex cases’ groups in the 12 months after the month when machine learning was applied. For the execution of the study’s experiments, we adopted a process based on KDD (Knowledge Discovery in Databases), 8 thus following the steps: selection, preprocessing, transformation, data mining and interpretation.
Selection
Data selection consists of creating a dataset on which knowledge discovery must be performed. 8 For the formation of datasets for the period between January 2019 and June 2020, for the training, testing, classification activities, in addition to the validation of the values obtained by the machine learning process, data from the period between January 2017 and July 2021 were used, provided by organization, collected from the organization’s management system and data warehouse, totaling 54 different data files. All the data was anonymized to avoid exposing sensitive beneficiaries’ data.
The dataset was built from the information referring to the 18 months prior to the month analyzed, consisting of 118 variables divided into eight information groups, namely, information on the beneficiaries, medical specialty of the professional who requested assistance, assistance procedures, frequency of claims, types of assistance, categories of hospitalization, disease propensity and the International Classification of Diseases (ICD-10) found in medical records. In the dataset, each line represents an active beneficiary in the target month. For example, in January 2019, 139,833 active beneficiaries are observed. Therefore, the dataset used for the classification task consists of 139,833 lines (ignoring the header). To assess the accuracy of the algorithm, the target class was entered, informing whether the beneficiary will be in the “Very high cost” and “Complex cases” risk groups in the next 12 months. In Figure 2, it is possible to observe the schematization of the formation of the data file using the month of January 2019 as an example. Schematic of a record present in the dataset. Source: the authors.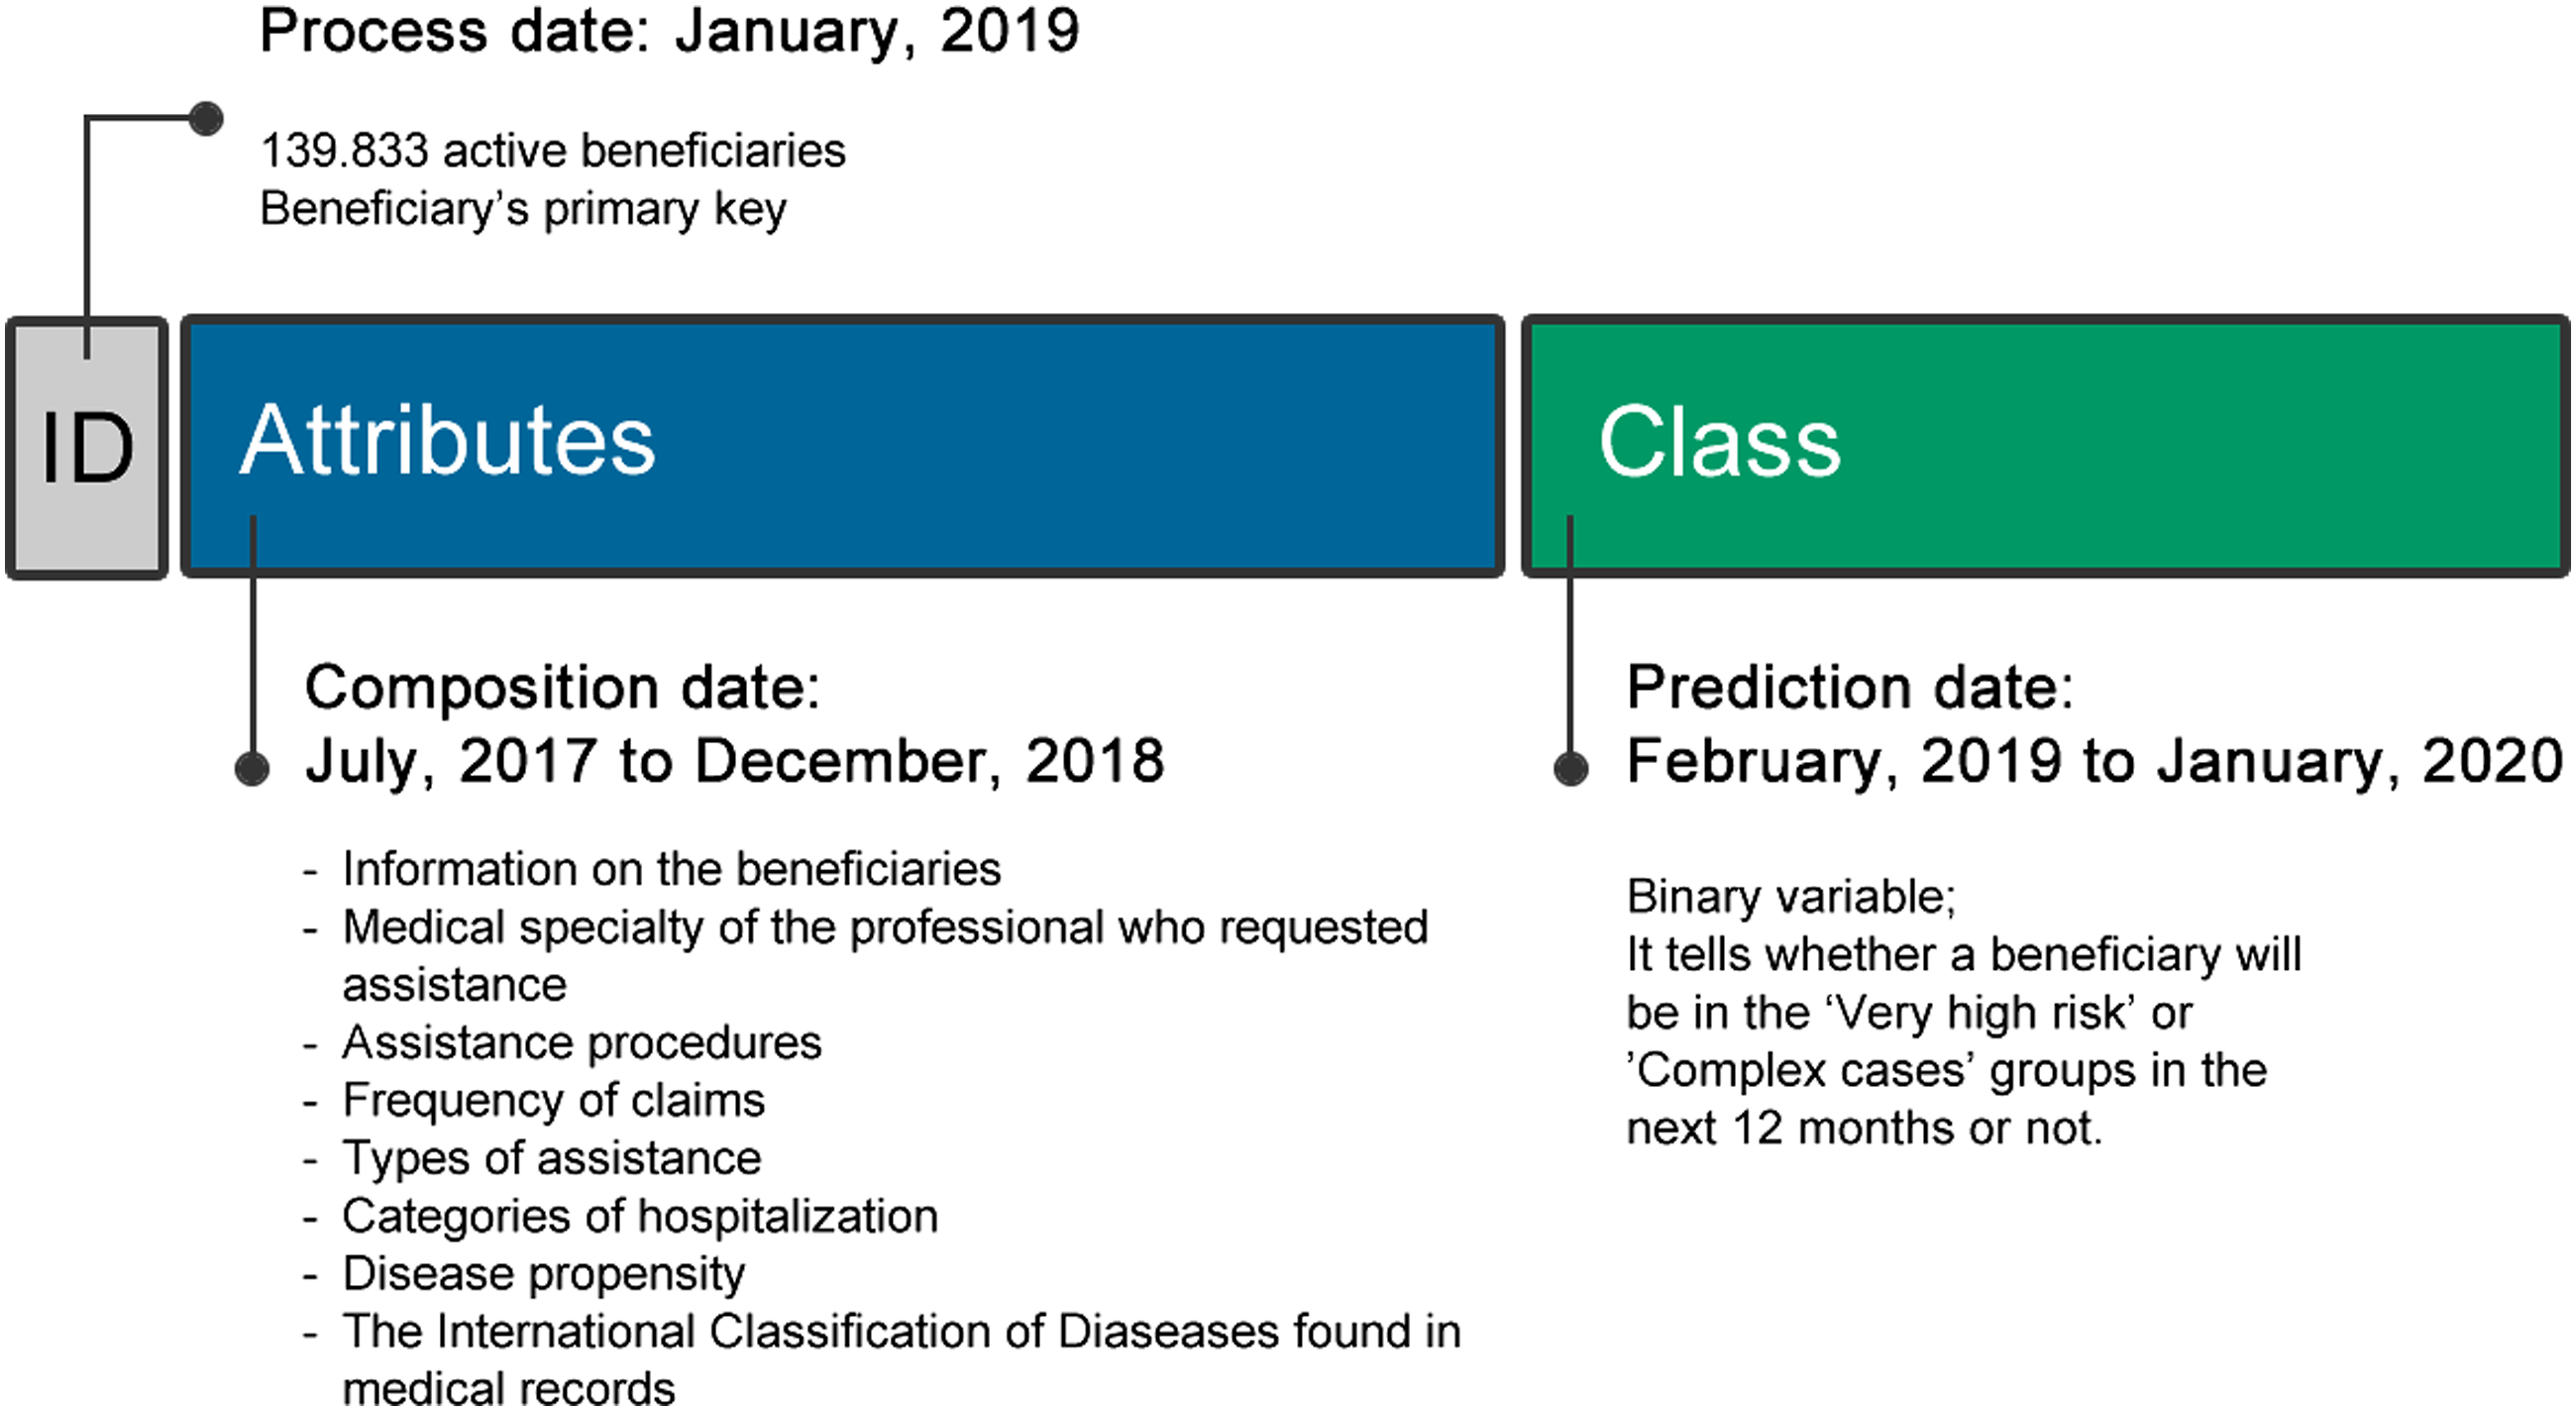
Regarding training tasks and tests of the machine learning process, information related to 18 months prior to the month analyzed was used, and the records for each month were randomly divided into a 90/10 proportion (90% training and 10% testing). This balanced division of records over time aims to reduce the impact of claims’ seasonality on the classification process. In this study, we chose to divide the datasets for the classification and testing tasks, instead of using cross-validation. This is due to the fact that the dataset for training is on average 9 times larger than that of tests and on average 16 times greater than the set used for the classification task, and preliminary tests showed that the gain in recall rate was not significant enough to justify the computational increase by the use of cross-validation.
The datasets (training, testing and classification) involved in the process have the same characteristics, meaning active beneficiaries in each month, variables, risk class etc. It is worth noting that all active beneficiaries in each month are included in the dataset, with no chance of any of them being removed for any reason. Therefore, beneficiaries who had joined the plan recently and those excluded before the end of the 12-month period were also considered in the analysis. Furthermore, no process of dimensionality reduction or treatment of unbalanced data was applied to the datasets.
Preprocessing
The preprocessing stage aims to improve the quality of the data that will be used for the transformation, applying operations such as noise elimination, missing value treatment and outlier correction. 8
The data were extracted from the operator’s data warehouse environment, so it was only necessary to process some records, as the process of noise elimination and consolidating information had already been carried out previously by the organization. Regarding the treatment of missing values, 67 beneficiaries were observed who did not have the age group information, consequently causing an error during the execution of the machine learning algorithms. For these cases, the missing value was replaced by the number 0 (zero). It is worth noting that the number of records with a missing age group was not very representative in the study. Considering all datasets from January 2019 to June 2020, 2.5 million beneficiaries are observed that make up these datasets.
Regarding outliers, it was not necessary to carry out any type of treatment since, with the exception of the primary key of the beneficiary and the age group, all other variables are binary, evidently preventing the presence of values outside the 0 and one range.
Transformation
The data transformation step consists of finding useful resources to represent the data that will be used in the data mining step. 8
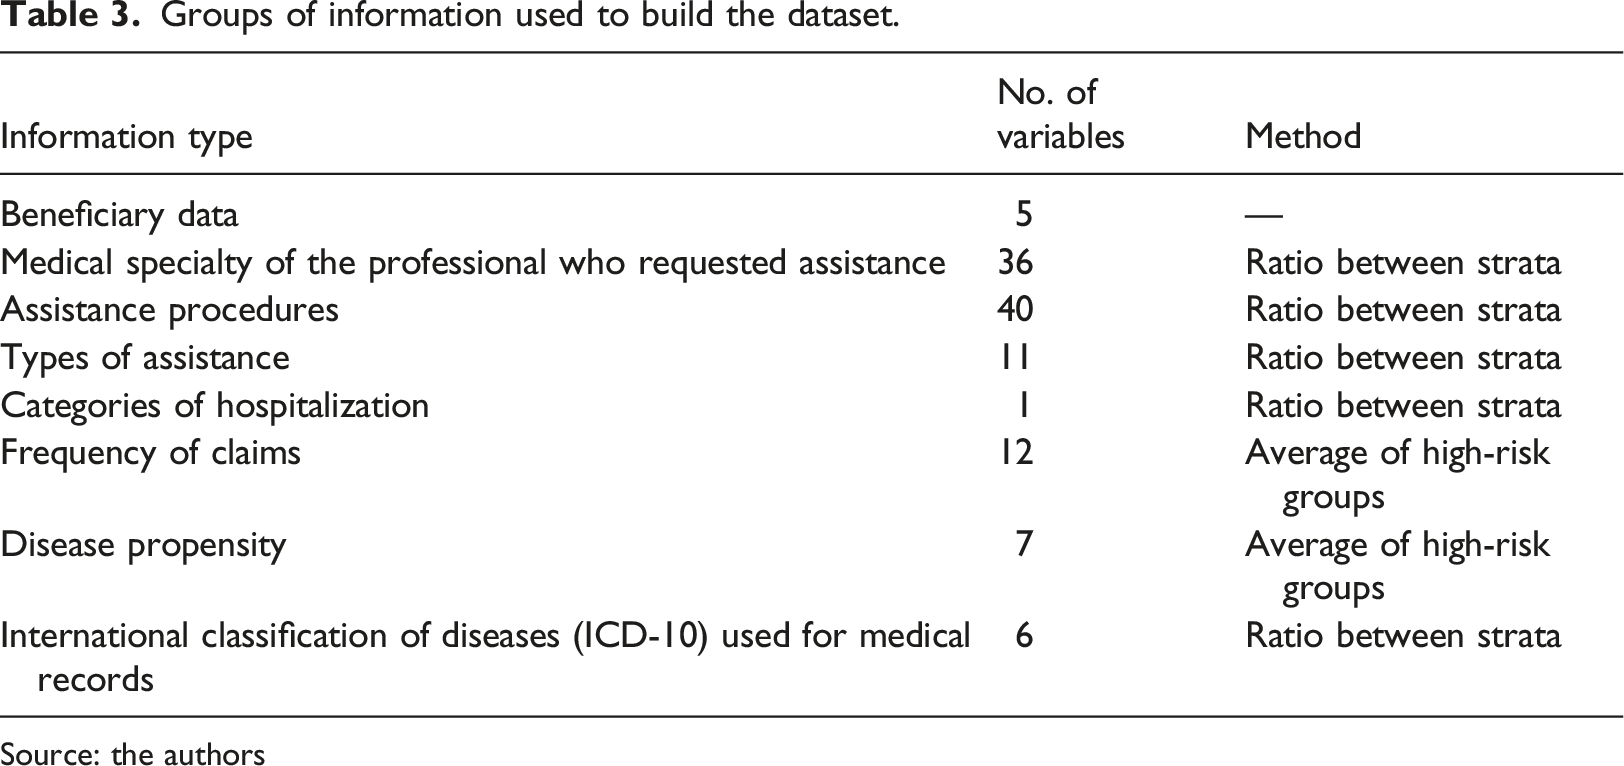
Groups of information used to build the dataset.
Source: the authors
For information related to the “medical specialty of the professional who requested assistance”, “Assistance procedures”, “Types of assistance”, “Categories of hospitalization” and “International Classification of Diseases (ICD-10) used for medical records” the difference in proportion between the risk strata was used, and the greater the difference between the proportions, the greater the priority of the variable in the dataset. While for the “frequency of requests for assistance” and “propensity to disease” types, the observed average for beneficiaries belonging to the “Very high cost” and “Complex cases” classes was defined. Regarding the ICD-10, only a small number of medical bills have it (about 10% in the observed period), this is due to the fact that the ICD is not mandatory information.
As discussed earlier, with the exception of attributes related to the primary key and age group, all other attributes were represented using binary values, with the number 1 (one) representing the existence of the value, while the number 0 (zero) represents the absence of the value. This decision was made so that values present in certain attributes don’t negatively impact the learning of the model. In Figure 3, it is possible to observe the process of extracting the data sets, using the month of January 2019 as a pivot. Creation of the dataset used in the machine learning process. Source: the authors.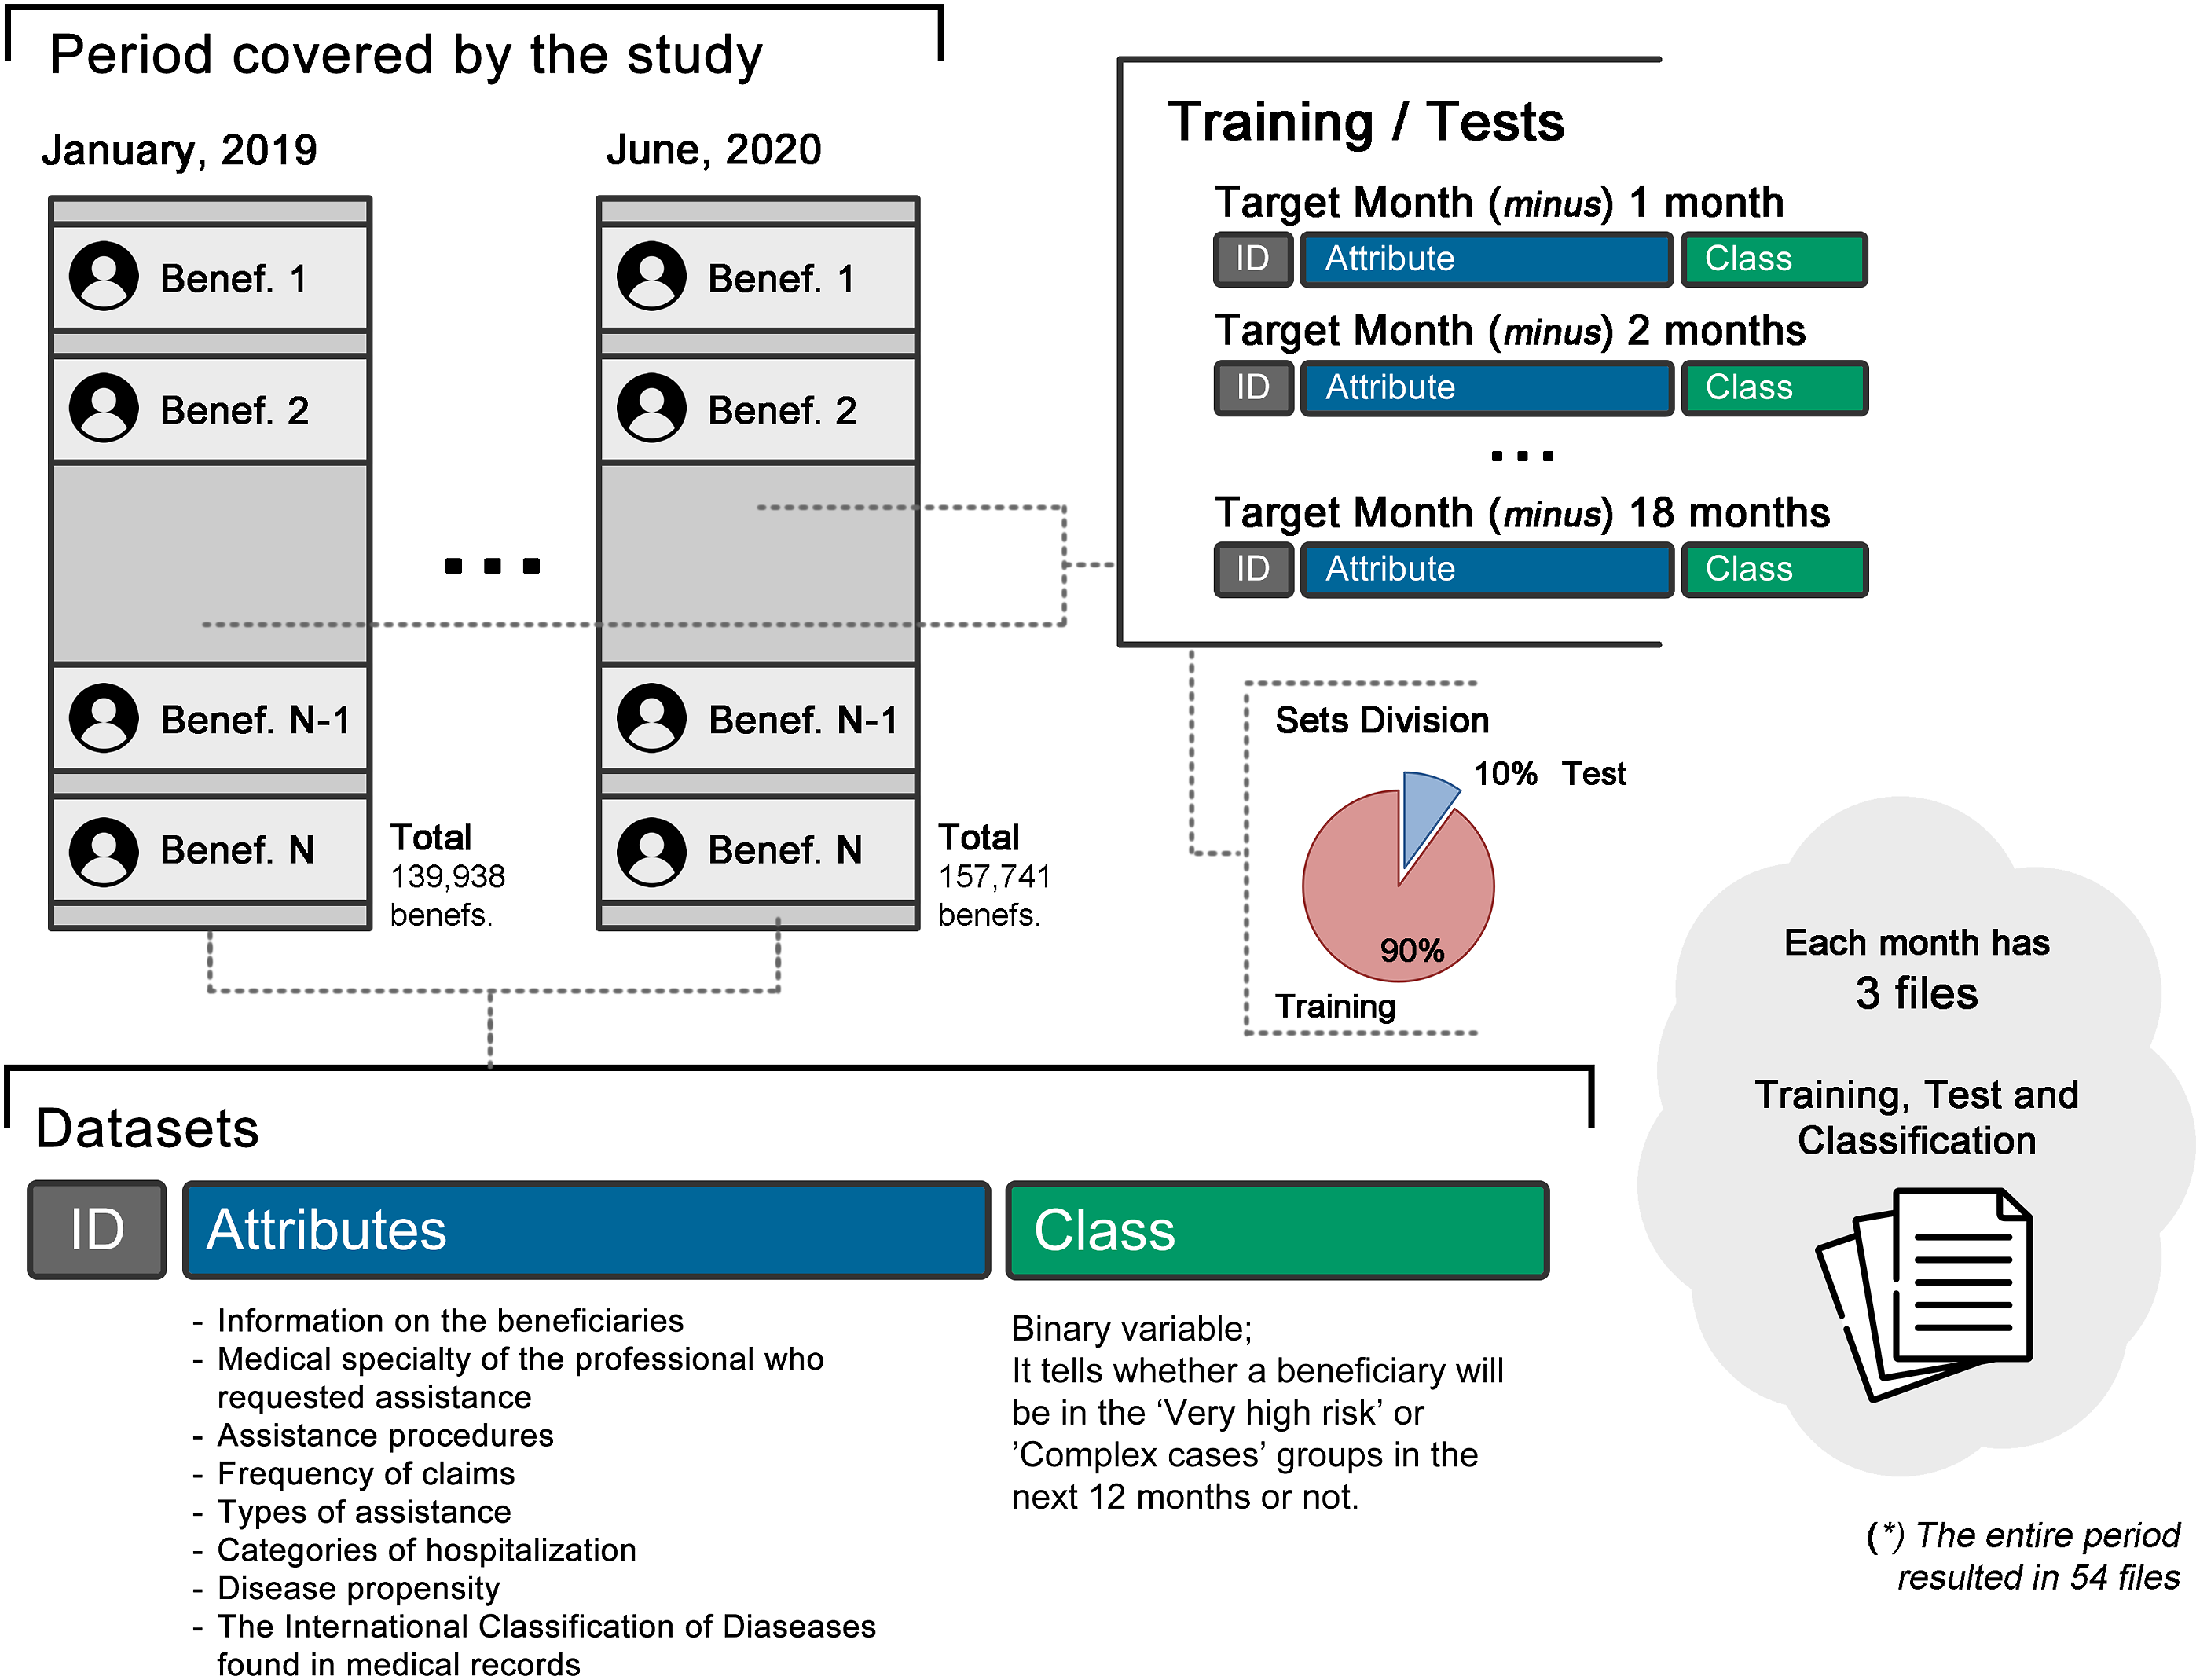
Data mining
The data mining step is the search for patterns of interest according to the objective established for the activity, such as classification, regression, association and grouping. Emphasizing that the proper execution of the previous steps can significantly help in this step. 8
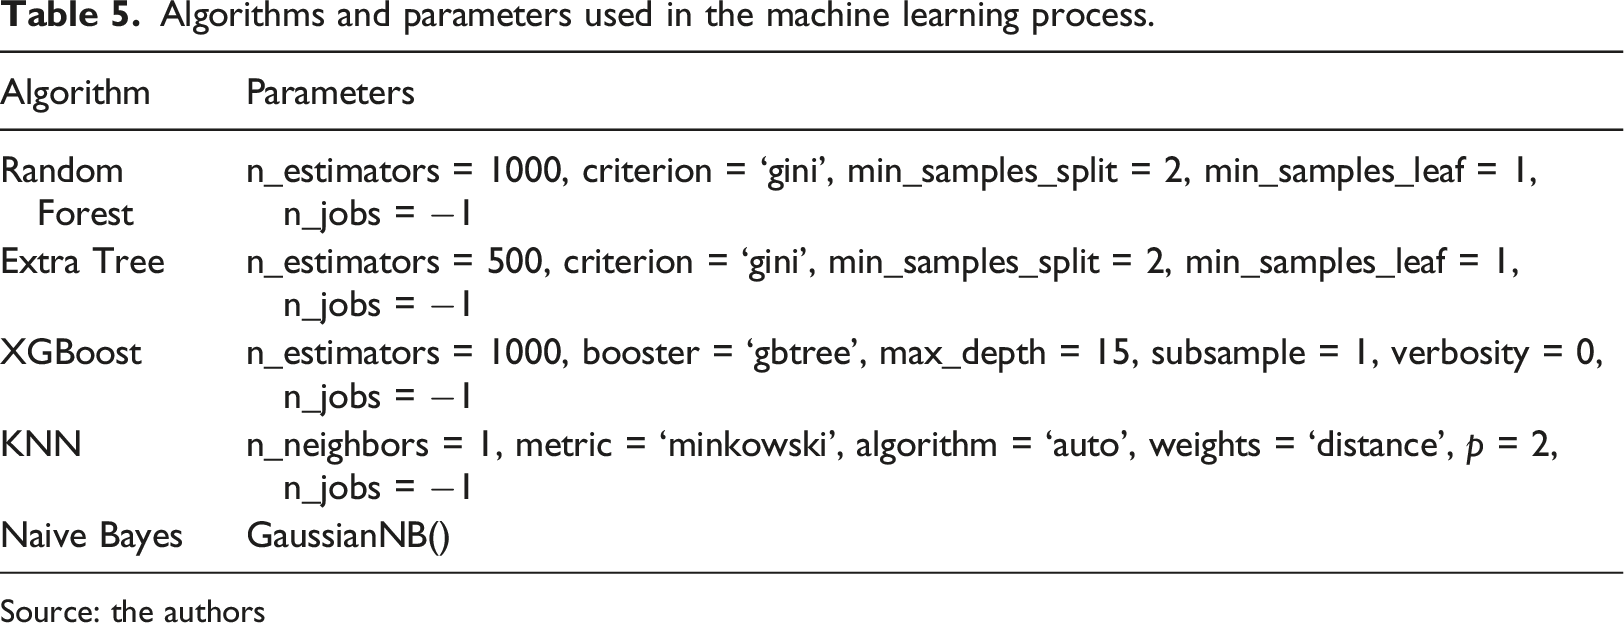
After the datasets were created, the machine learning algorithms Random forest, 20 Extra tree, 21 Xgboost, 22 K-nearest neighbor 23 and Naive bayes 24 were used to classify all beneficiaries. It is worth mentioning that preliminary tests showed that these algorithms obtained the best results. Python 3.6.8 was used for the experiments. Extra tree, Random forest, KNN and Naive bayes algorithms are present in the scikit-learn library (version 0.24.2) and Xgboost (version 1.5.1).
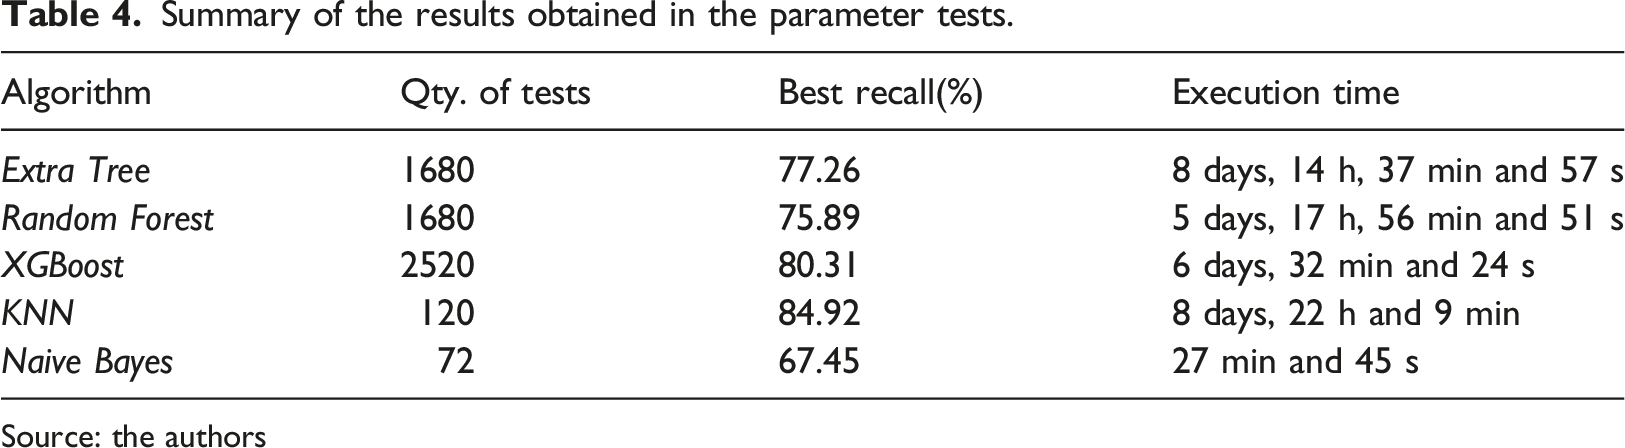
First, it was necessary to define what the best parameters for the execution of the algorithms would be. To automate the parameter testing process, GridSearchCV was used for the Extra tree, Random forest, Xgboost and KNN algorithms. The tests used cross validation, which consists of dividing the dataset into equal parts defined by the value “k” and the training, and evaluation activities are performed so that each iteration uses a part of the dataset. 25 To conduct the tests, the value “k = 10” was used in the training set for the month of June 2020. The process of evaluating the parameters for the algorithms took a total of 27 days, 7 h, 16 min and 51 s. On the other hand, to analyze the performance of Naive bayes, four different implementations were tested (BernoulliNB, CategoricalNB, GaussianNB and MultinomialNB), using the data sets for the period from January 2019 to June 2020, totaling 72 tests. This decision was made due to the fact that different Naive bayes implementations do not have a wide variety of parameters and values. The computational time of all tests related to Naive bayes was 27 min and 45 s.
Summary of the results obtained in the parameter tests.
Source: the authors
Algorithms and parameters used in the machine learning process.
Source: the authors
After defining the best parameters, machine learning algorithms were used to classify the information present in the data sets from January 2019 to June 2020, and the results obtained were used to compare the algorithms and to assess the beneficiary transition across risk groups and cost evolution.
Interpretation
Interpreting the data involves viewing the extracted patterns and models or viewing the data provided by the models.
8
Since this study used machine learning algorithms to classify health plan beneficiaries as part of high risk groups, its confusion matrix was the resource used to evaluate the algorithms’ execution. A Confusion Matrix is an effective descriptive resource for organizing and presenting results,
26
combining observed values with predicted ones. Based on the confusion matrix, four metrics, namely recall, accuracy, precision and F1-Score were chosen to evaluate the results (Figure 4). Confusion matrix layout. Source: the authors.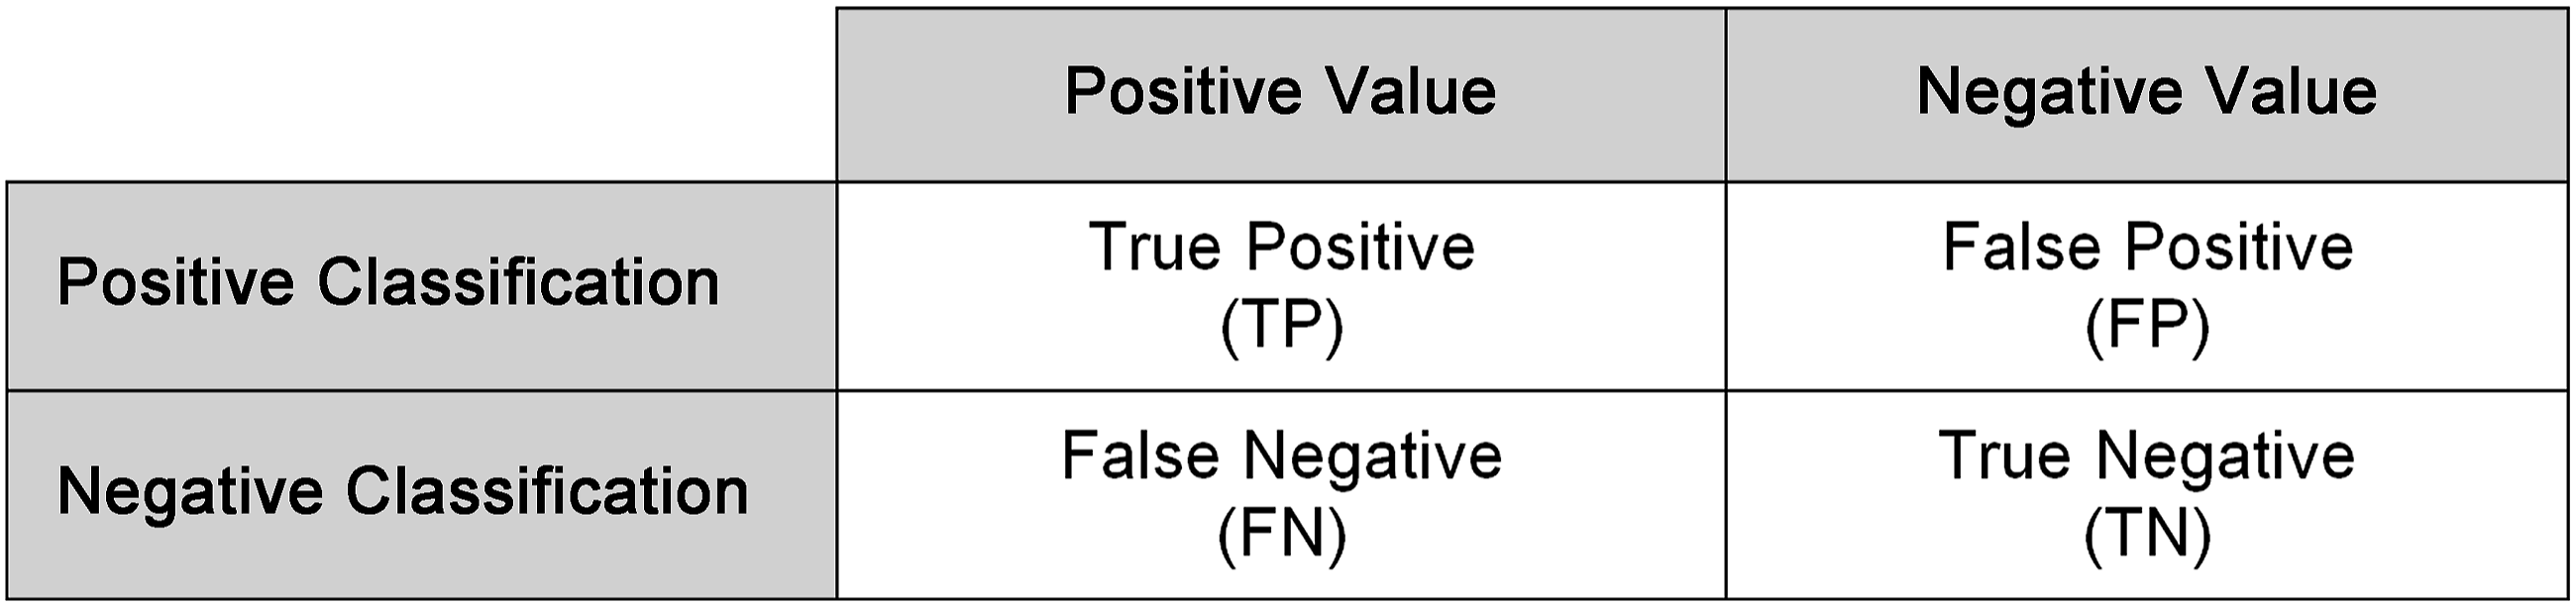
As discussed earlier, in the present study, the positive classification is represented by the incidence of the beneficiary’s entry into the very high cost risk groups and complex cases in the next 12 months in relation to the base month. The formulas of the metrics chosen for the evaluation of the algorithms can be seen in equations (1) through (4), adapted from.
27


In addition to the confusion matrix and the aforementioned metrics, the ROC/AUC curve was used to evaluate the machine learning algorithms. The ROC curve (Receiver Operating Characteristic Curve) is obtained by the true positive rate and the false positive rate, whereas the AUC (Area Under the Curve) is determined by trapezoidal integration, after obtaining the points on the ROC curve. The AUC represents the probability of obtaining true-positive and true-negative results, at random.27,28
Results
Machine learning algorithms were used to classify the information present in the data sets from January 2019 to June 2020, and the results obtained were applied to the confusion matrix. Due to the fact that binary values (1-Yes; 0-No) are used to represent the incidence of the beneficiary in the strata of greater assistance risk (target class), only four logical values are possible: true-positive, false-positive, false-negative and true-negative. Figure 5 shows the average results obtained by each algorithm over the analyzed period applied to the confusion matrix. Results of the algorithms applied to the confusion matrix. Source: the authors.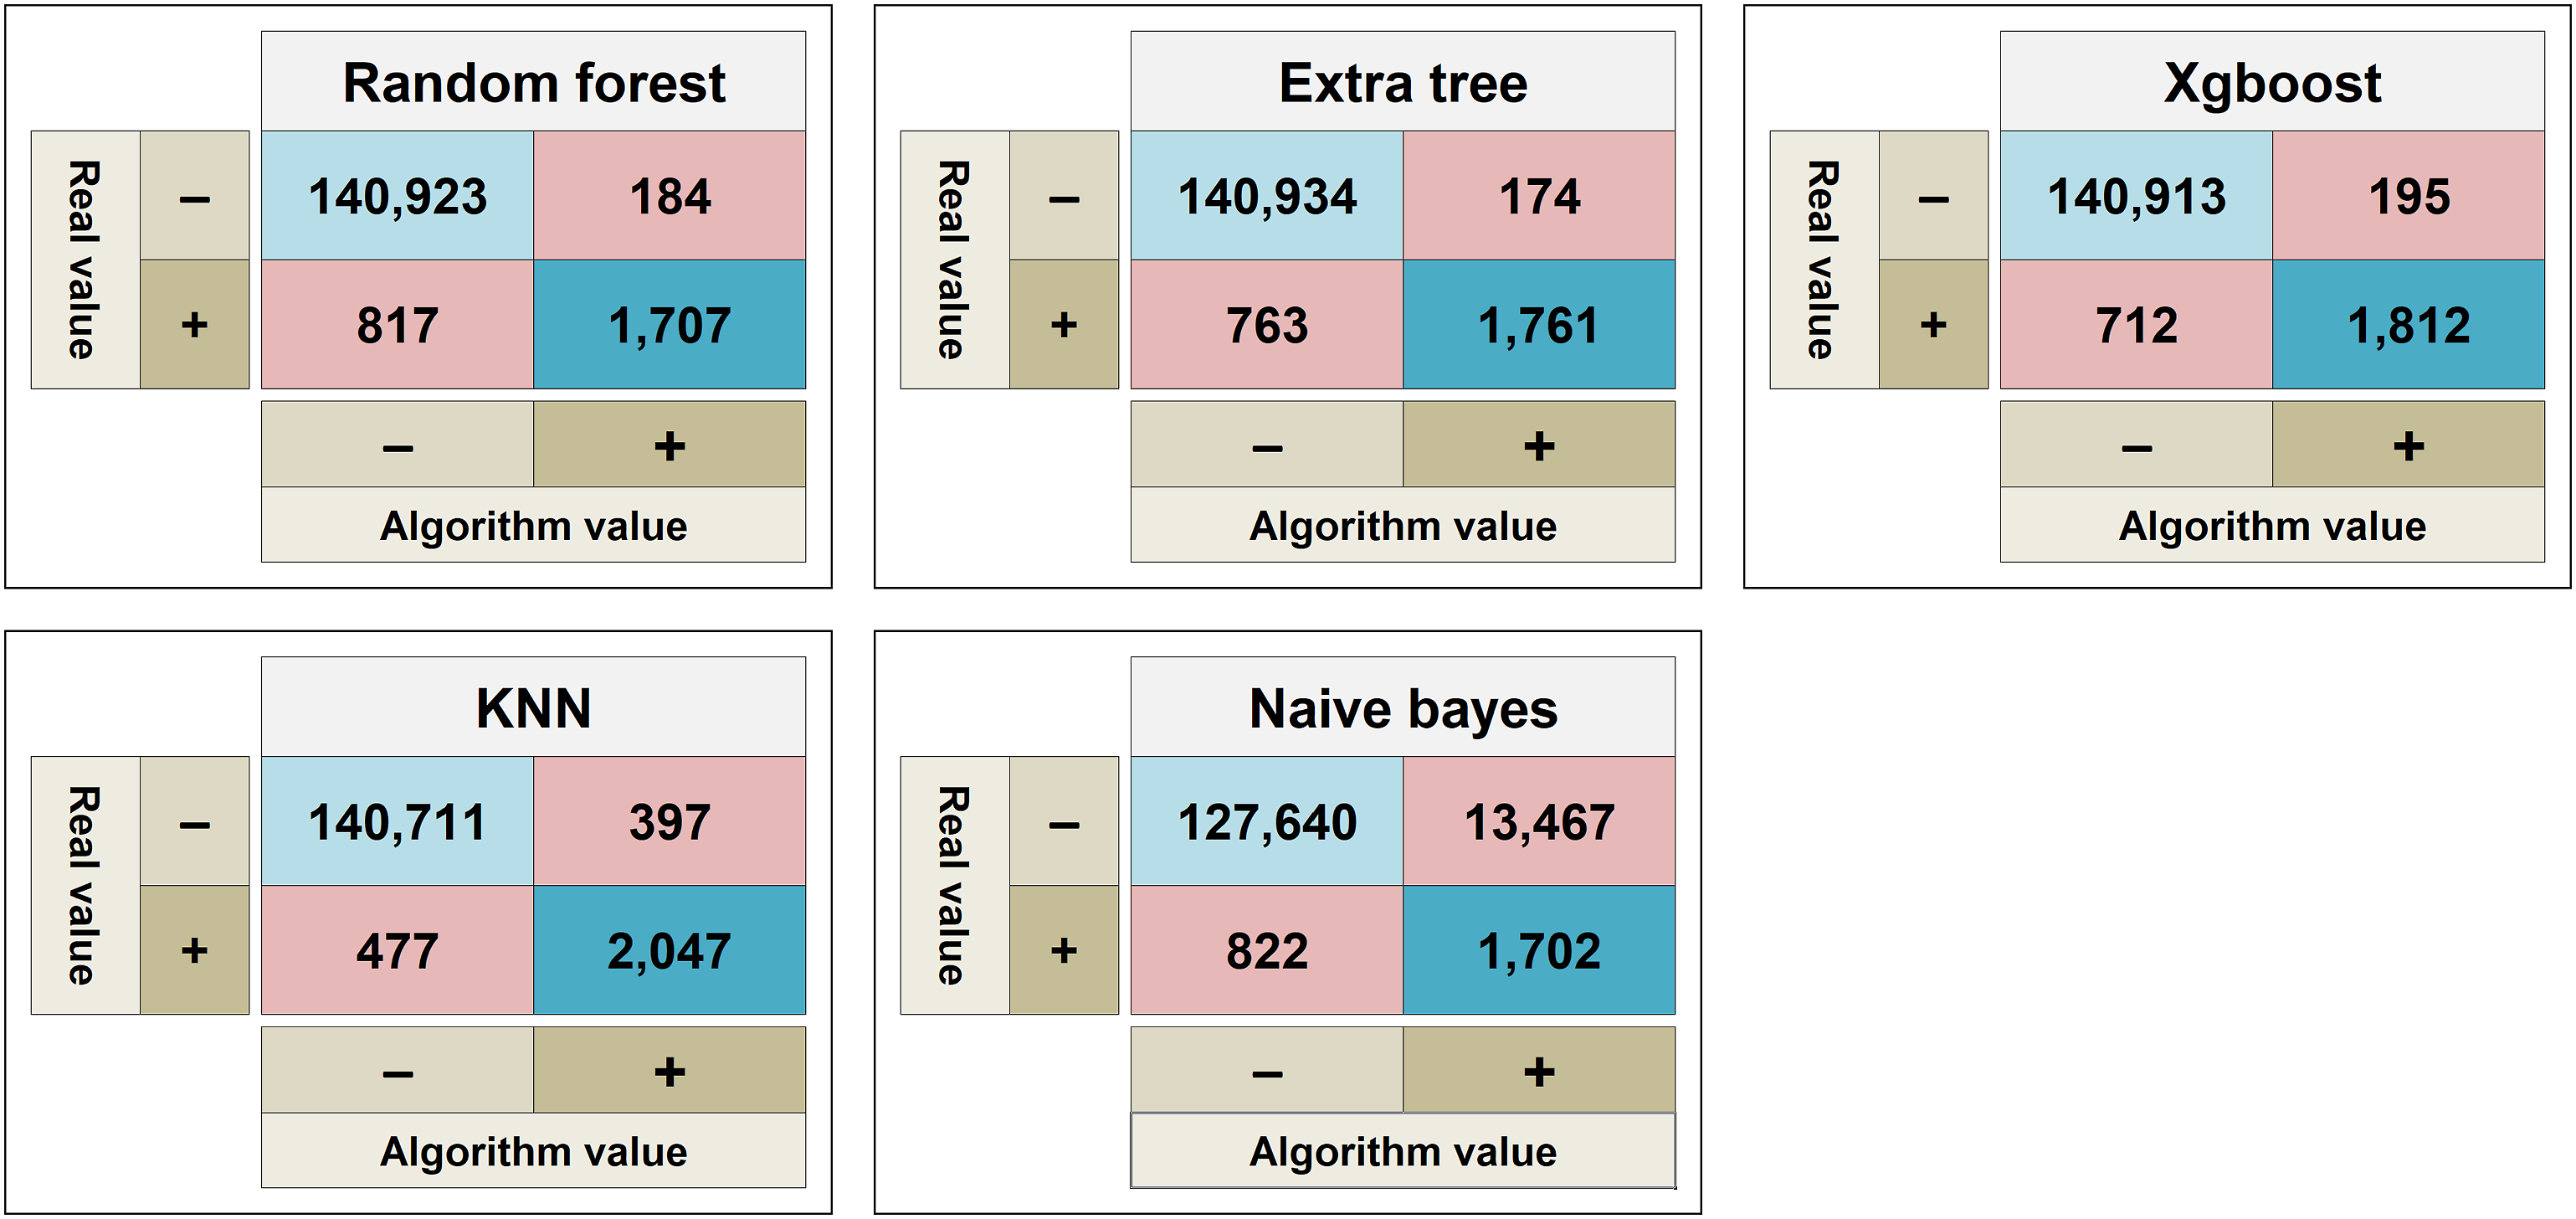
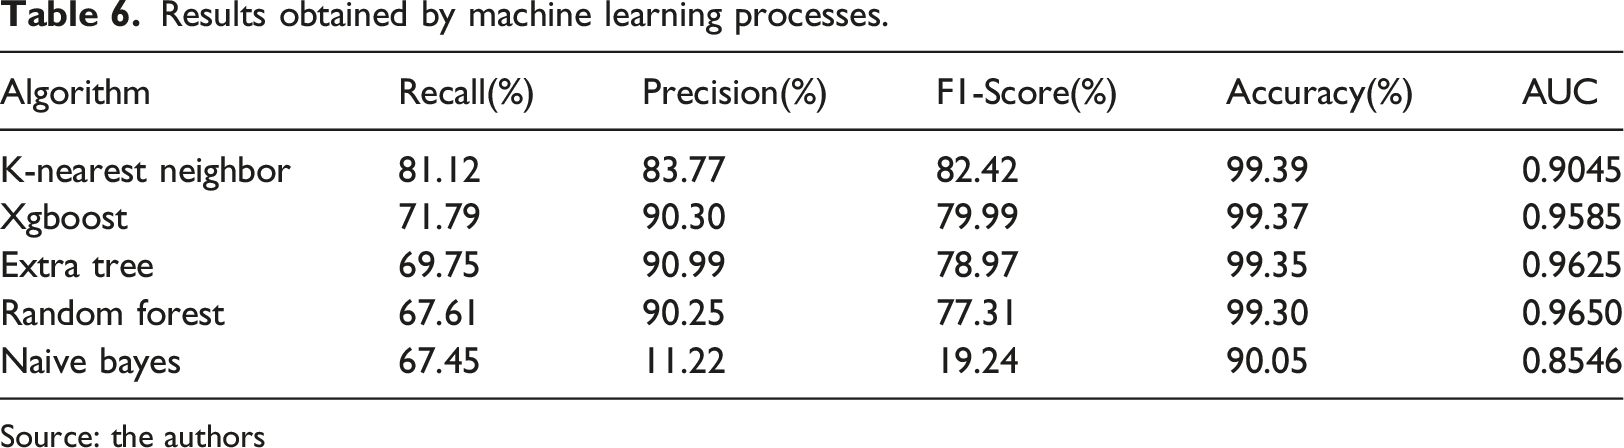
Recall helps to understand the number of beneficiaries who are correctly classified within the high-risk groups (true-positive) in relation to all beneficiaries classified (false-negative and true-positive). It is the most relevant metric, taking into consideration the objective of this study. Regarding execution of the machine learning algorithms throughout the analysis period, the average values are shown in Table 4. The recall rate ranged from 67.45% to 81.12% (values obtained by the Naive bayes and KNN algorithms, respectively).
Precision represents the number of true-positive results in relation to all positive classifications (true-positive and false-positive). It is an important metric for the study, as it characterizes the probability of a beneficiary classified as positive for incidence in the high-risk groups to have been correctly classified. Extra tree was the algorithm with the best precision (90.99%) rate, while Naive bayes had the worst one (11.22%).
The F1-Score is the combination of precision and recall, combining them into a single value. K-nearest neighbor had the best average rate (82.42%). Random forest, Extra tree and Xgboost achieved rates similar to each other, with little variability over the months. Naive bayes had the worst performance (19.24%).
Accuracy aims to evaluate the quantity of correct values (true-positive and true-negative) obtained during the classification process in relation to the dataset. Except for Naive bayes (with an average of 90.05%), the average accuracy rate of all the other algorithms was equal to or greater than 99.3%. The unbalance within the dataset helps to explain the accuracy rate obtained by the algorithms, since beneficiaries from the high-risk groups represent about 1% of the total number of beneficiaries.
Based on the execution of the learning algorithms during the evaluation period, the mean AUC values ranged from 0.8546 to 0.9650, respectively obtained by the Naive bayes and Random forest algorithms. Random forest, Extra tree and Xgboost had similar values.
A comparison of the performances of the best and worst algorithms for each of the metrics of the confusion matrix indicates that K-nearest neighbor had the best average rates for recall (81.12%), F1-Score (82.42%) and accuracy (99.39%), while Extra tree was the best algorithm regarding precision (90.99%). Random forest, however, had the best AUC value (0.9650). Conversely, Naive bayes had the worst results for all metrics evaluated.
The values of the metrics obtained by the classification processes of the algorithms in the evaluated period can be observed in Table 7, and Figure 6 presents the ROC curve obtained by the machine learning algorithms for the training/test and classification processes for the months of January 2019 and June 2020, which represent the first and last months analyzed, respectively, noting that each of the months of the observed period has its respective ROC curve. Table 6 shows the average values obtained by the algorithms in the evaluated period. ROC curve obtained by the algorithm classification process for the month: (a) january, 2019; (b) june, 2020. Source: the authors. Results obtained by machine learning processes. Source: the authors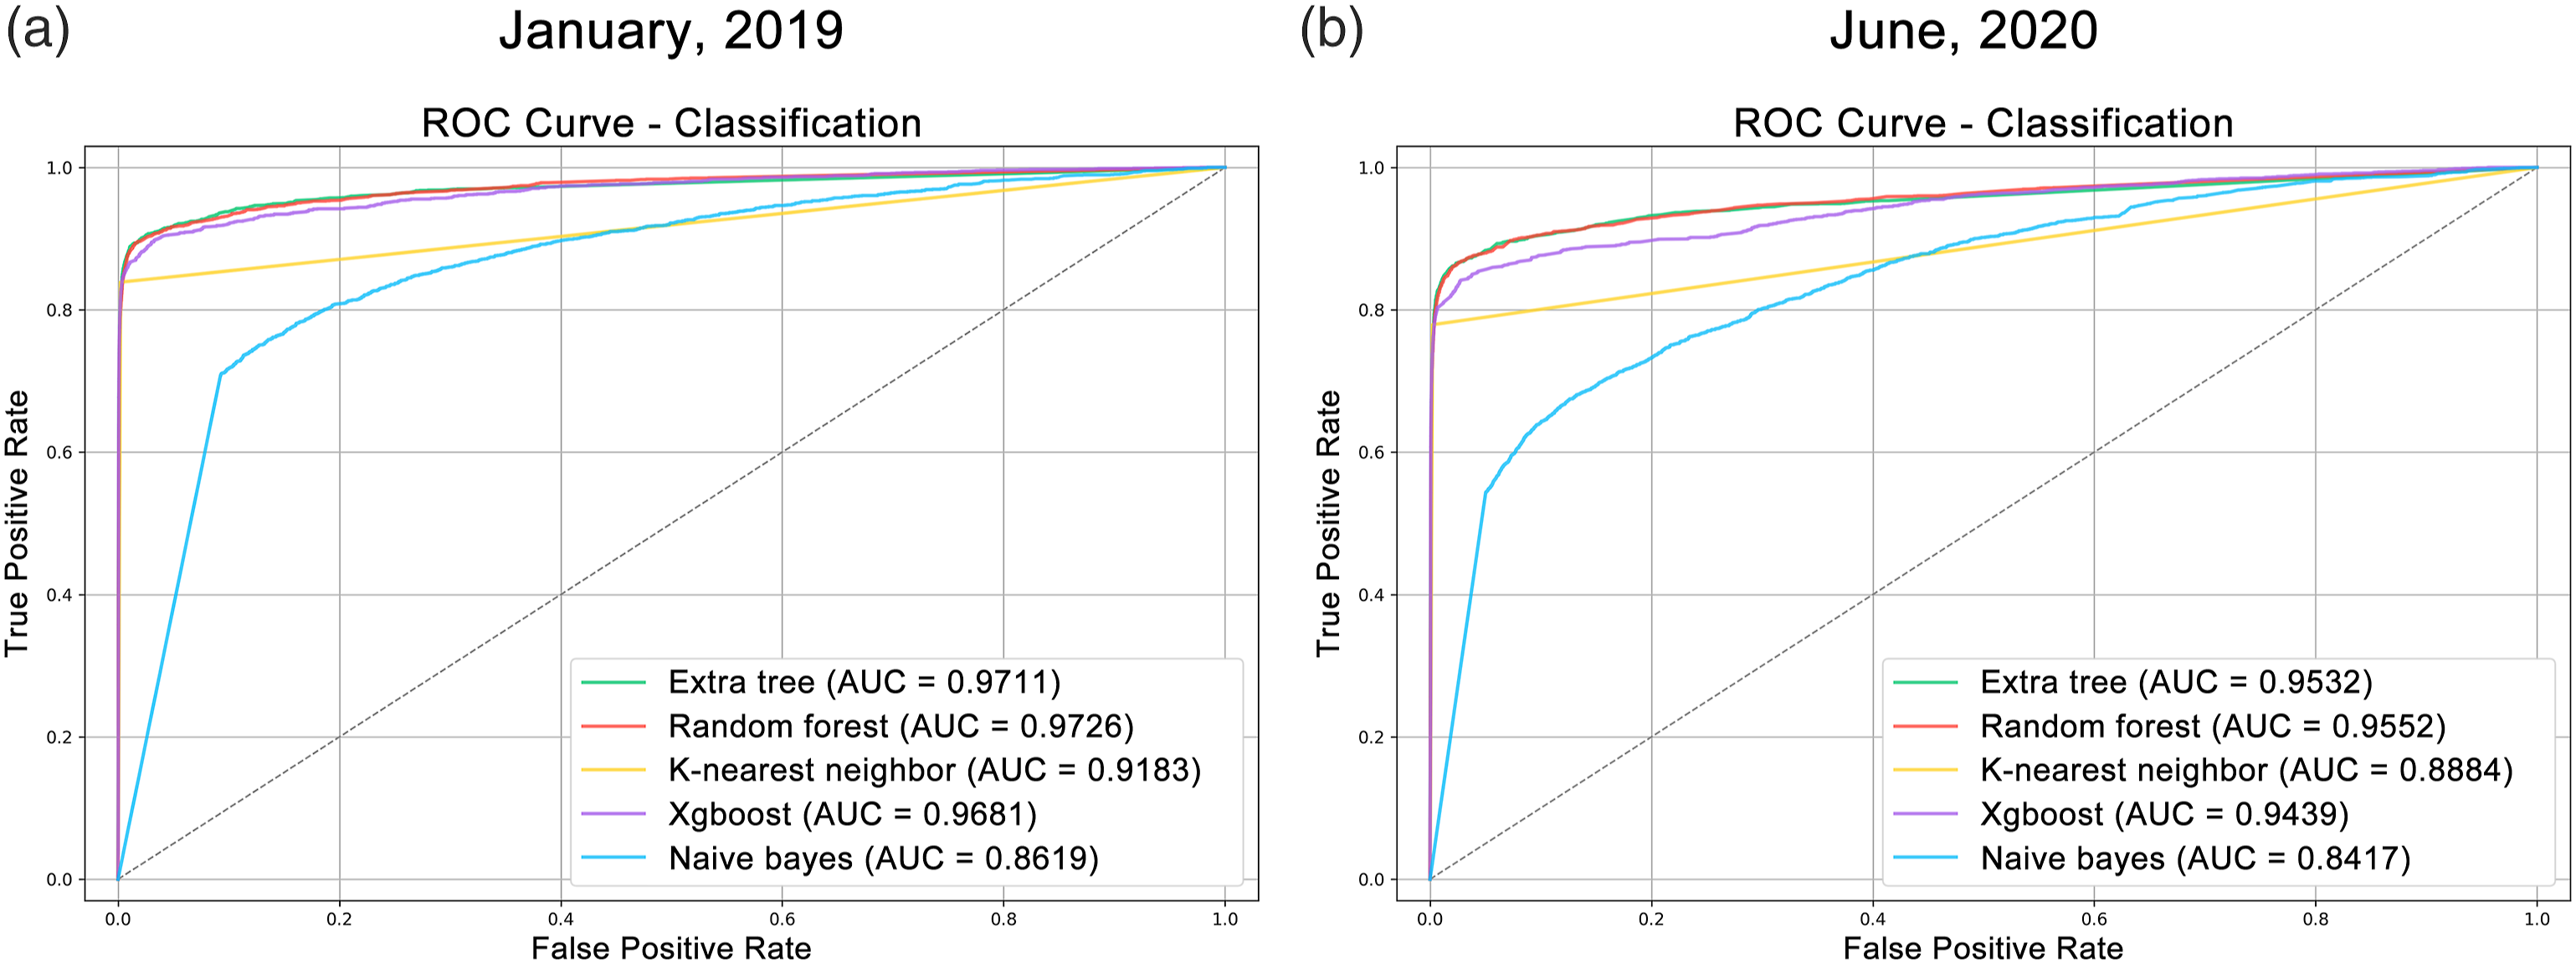
Discussion
As previously observed, machine learning algorithms were used to classify the information present in the datasets, and the values obtained were applied in a confusion matrix. In this section, the types of “true-positive” classifications, the time interval of classifications, the displacement of the beneficiary between the risk strata and the evolution of expenditures will be presented. The analysis considered only the first true-positive classifications for each beneficiary, and only those classifications in which the result preceded an event. This is due to the fact that the same beneficiary may have been classified several times during the analysis period (Figure 7). Example of the distribution of true-positive classifications over time for the same beneficiary.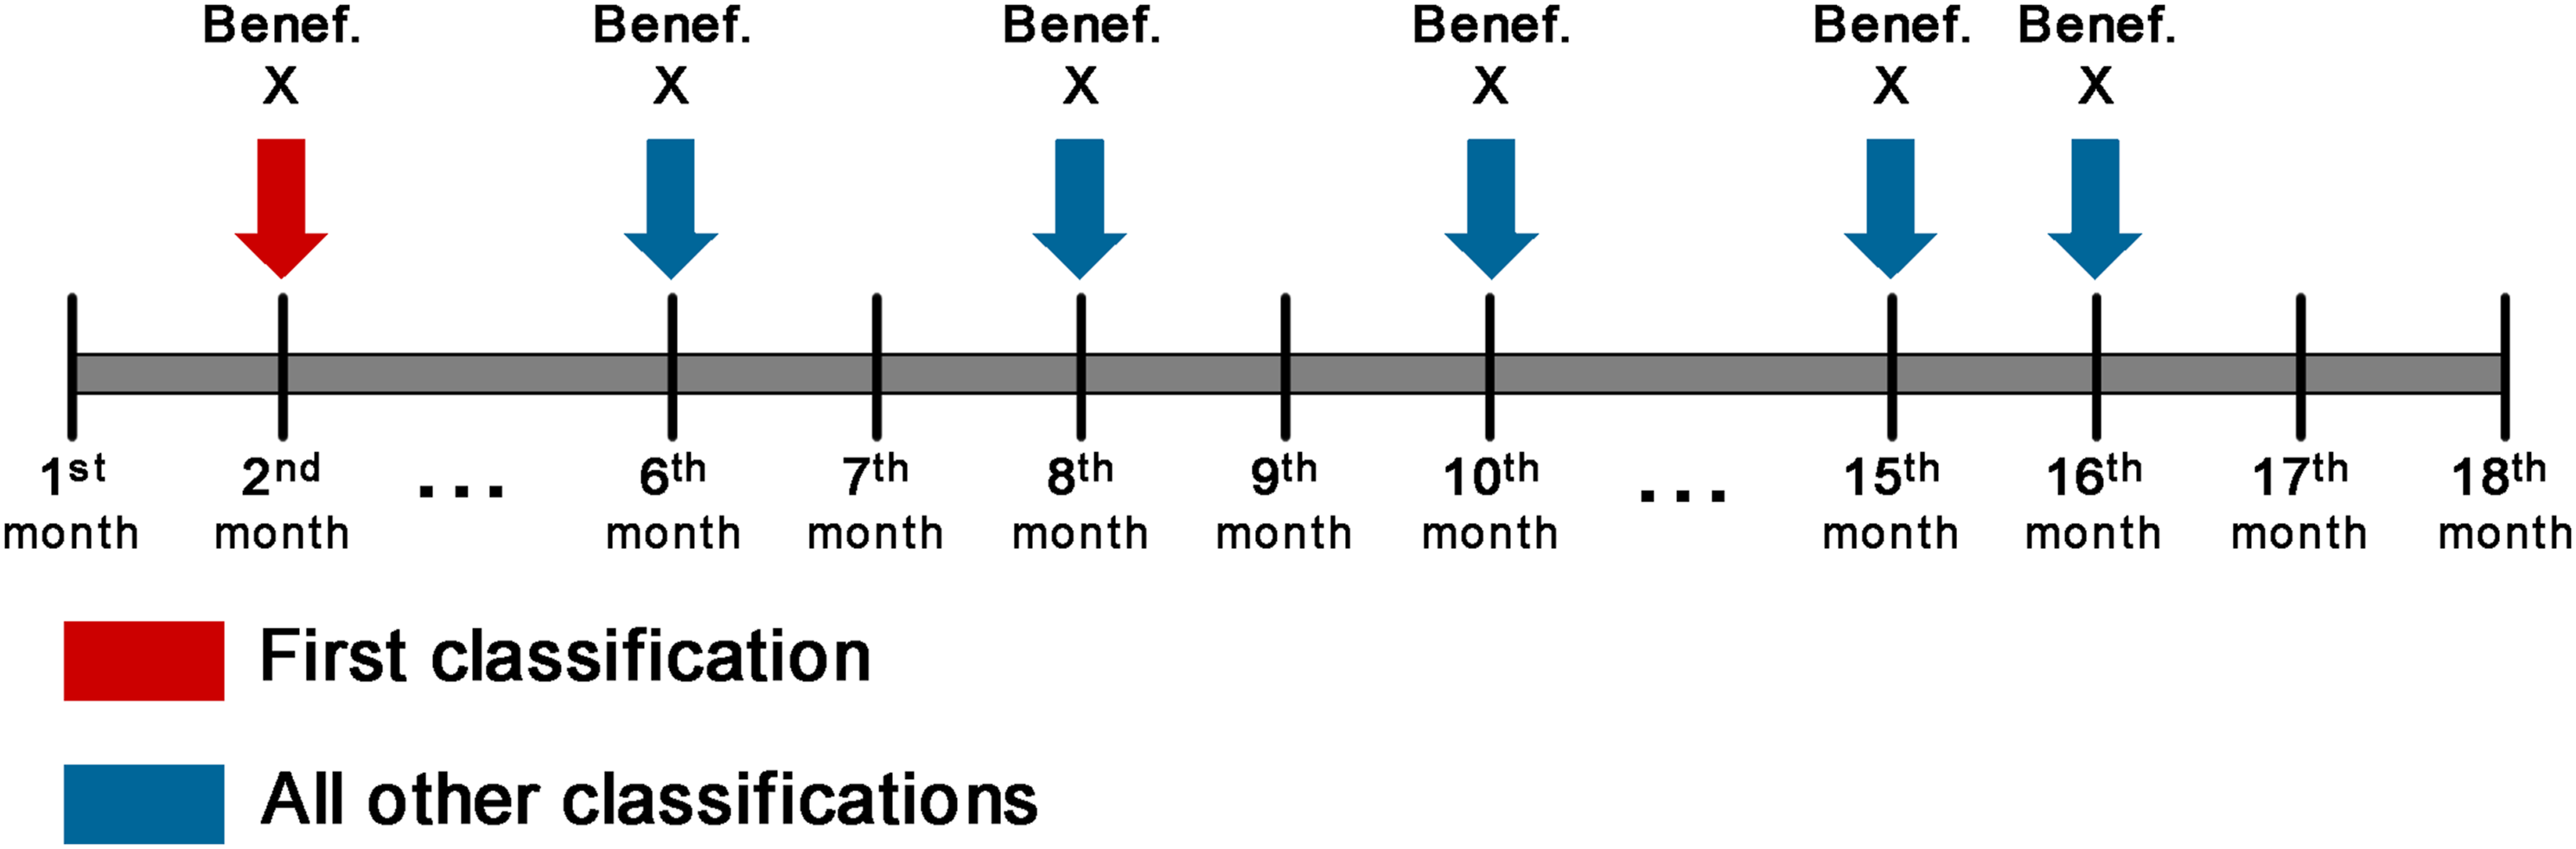
Classification types
The values applied to the confusion matrix only compare the classification obtained by an algorithm with the actual value. Therefore, in this study, a distinction was made to define the moment in time when the true-positive classification was obtained in relation to the occurrence of an event. It is also necessary that classification precedes an event, so that professionals have time to take the necessary measures. Thus, the true-positive results are divided as follows: (1) legitimate, if classification was prior to the occurrence of an event; (2) obvious, for classification within the month when a beneficiary entered the high-risk groups; (3) lagged, when classification comes after the event.
Evidently, obtaining legitimate classifications is the objective of the study, as they correspond to the beneficiaries toward which it is possible to take action aiming at mitigating future problems. However, the obvious results are also relevant, as they help to ensure that the model is correct.
Division of the true-positive results of the algorithms.
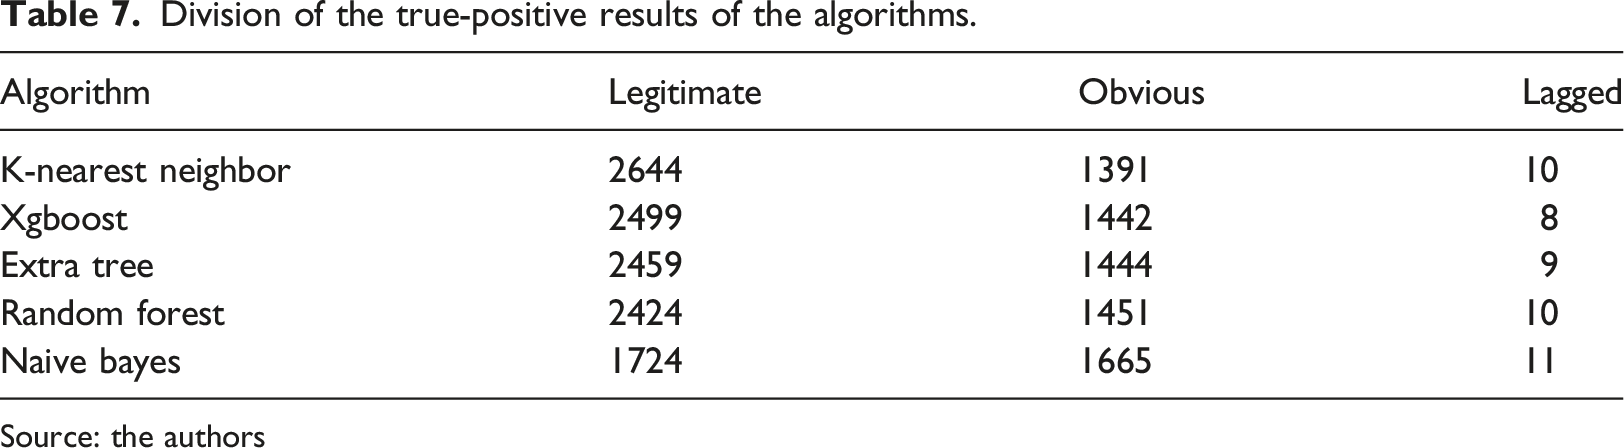
Source: the authors
Time interval
Average time interval between classification and event occurrences.
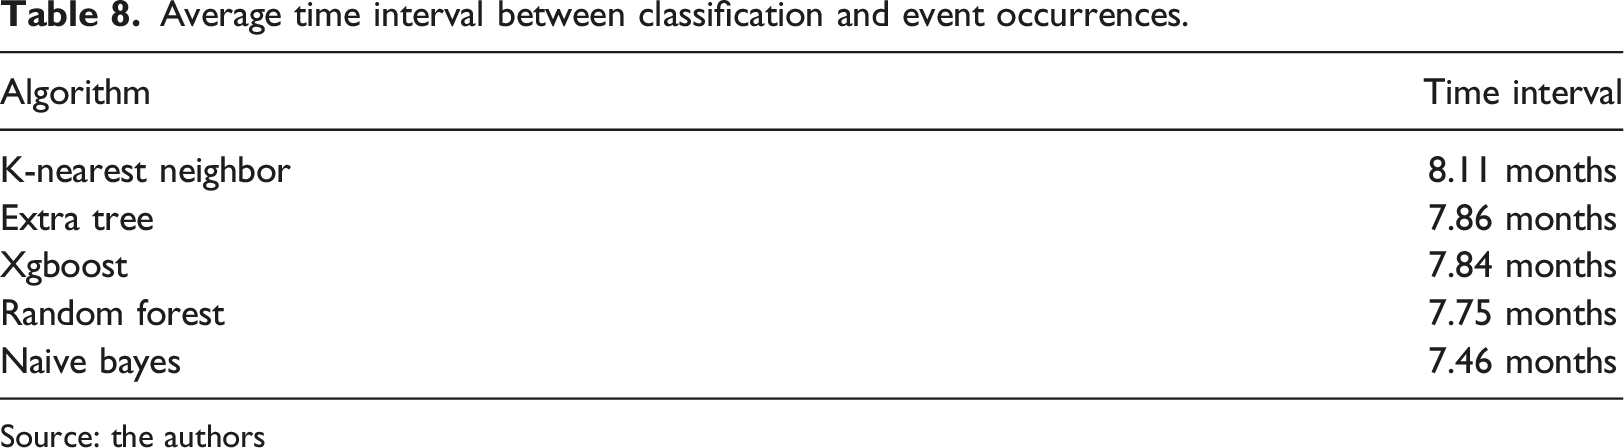
Source: the authors
By expanding the analysis to verify the number of beneficiaries in relation to the number of months between the algorithms, it is possible to note that, within a 1-month interval, the algorithms are able to classify 132 beneficiaries on average. As for an interval of 10 months, the average increases to 422 beneficiaries. Finally, an 11-months interval allowed for an average of 452.4 beneficiaries, although KNN managed to classify 811 beneficiaries within this same period. Although Naive bayes had considerably worse results compared to the other algorithms, it was able to predict a large number of beneficiaries within the 12-month period (564 beneficiaries), whereas the other algorithms managed to classify few beneficiaries. Figure 8 shows the distribution of the number of months between classification and incidence obtained by the algorithms. Distribution of month differences between legitimate classification and event occurrence. Source: the authors.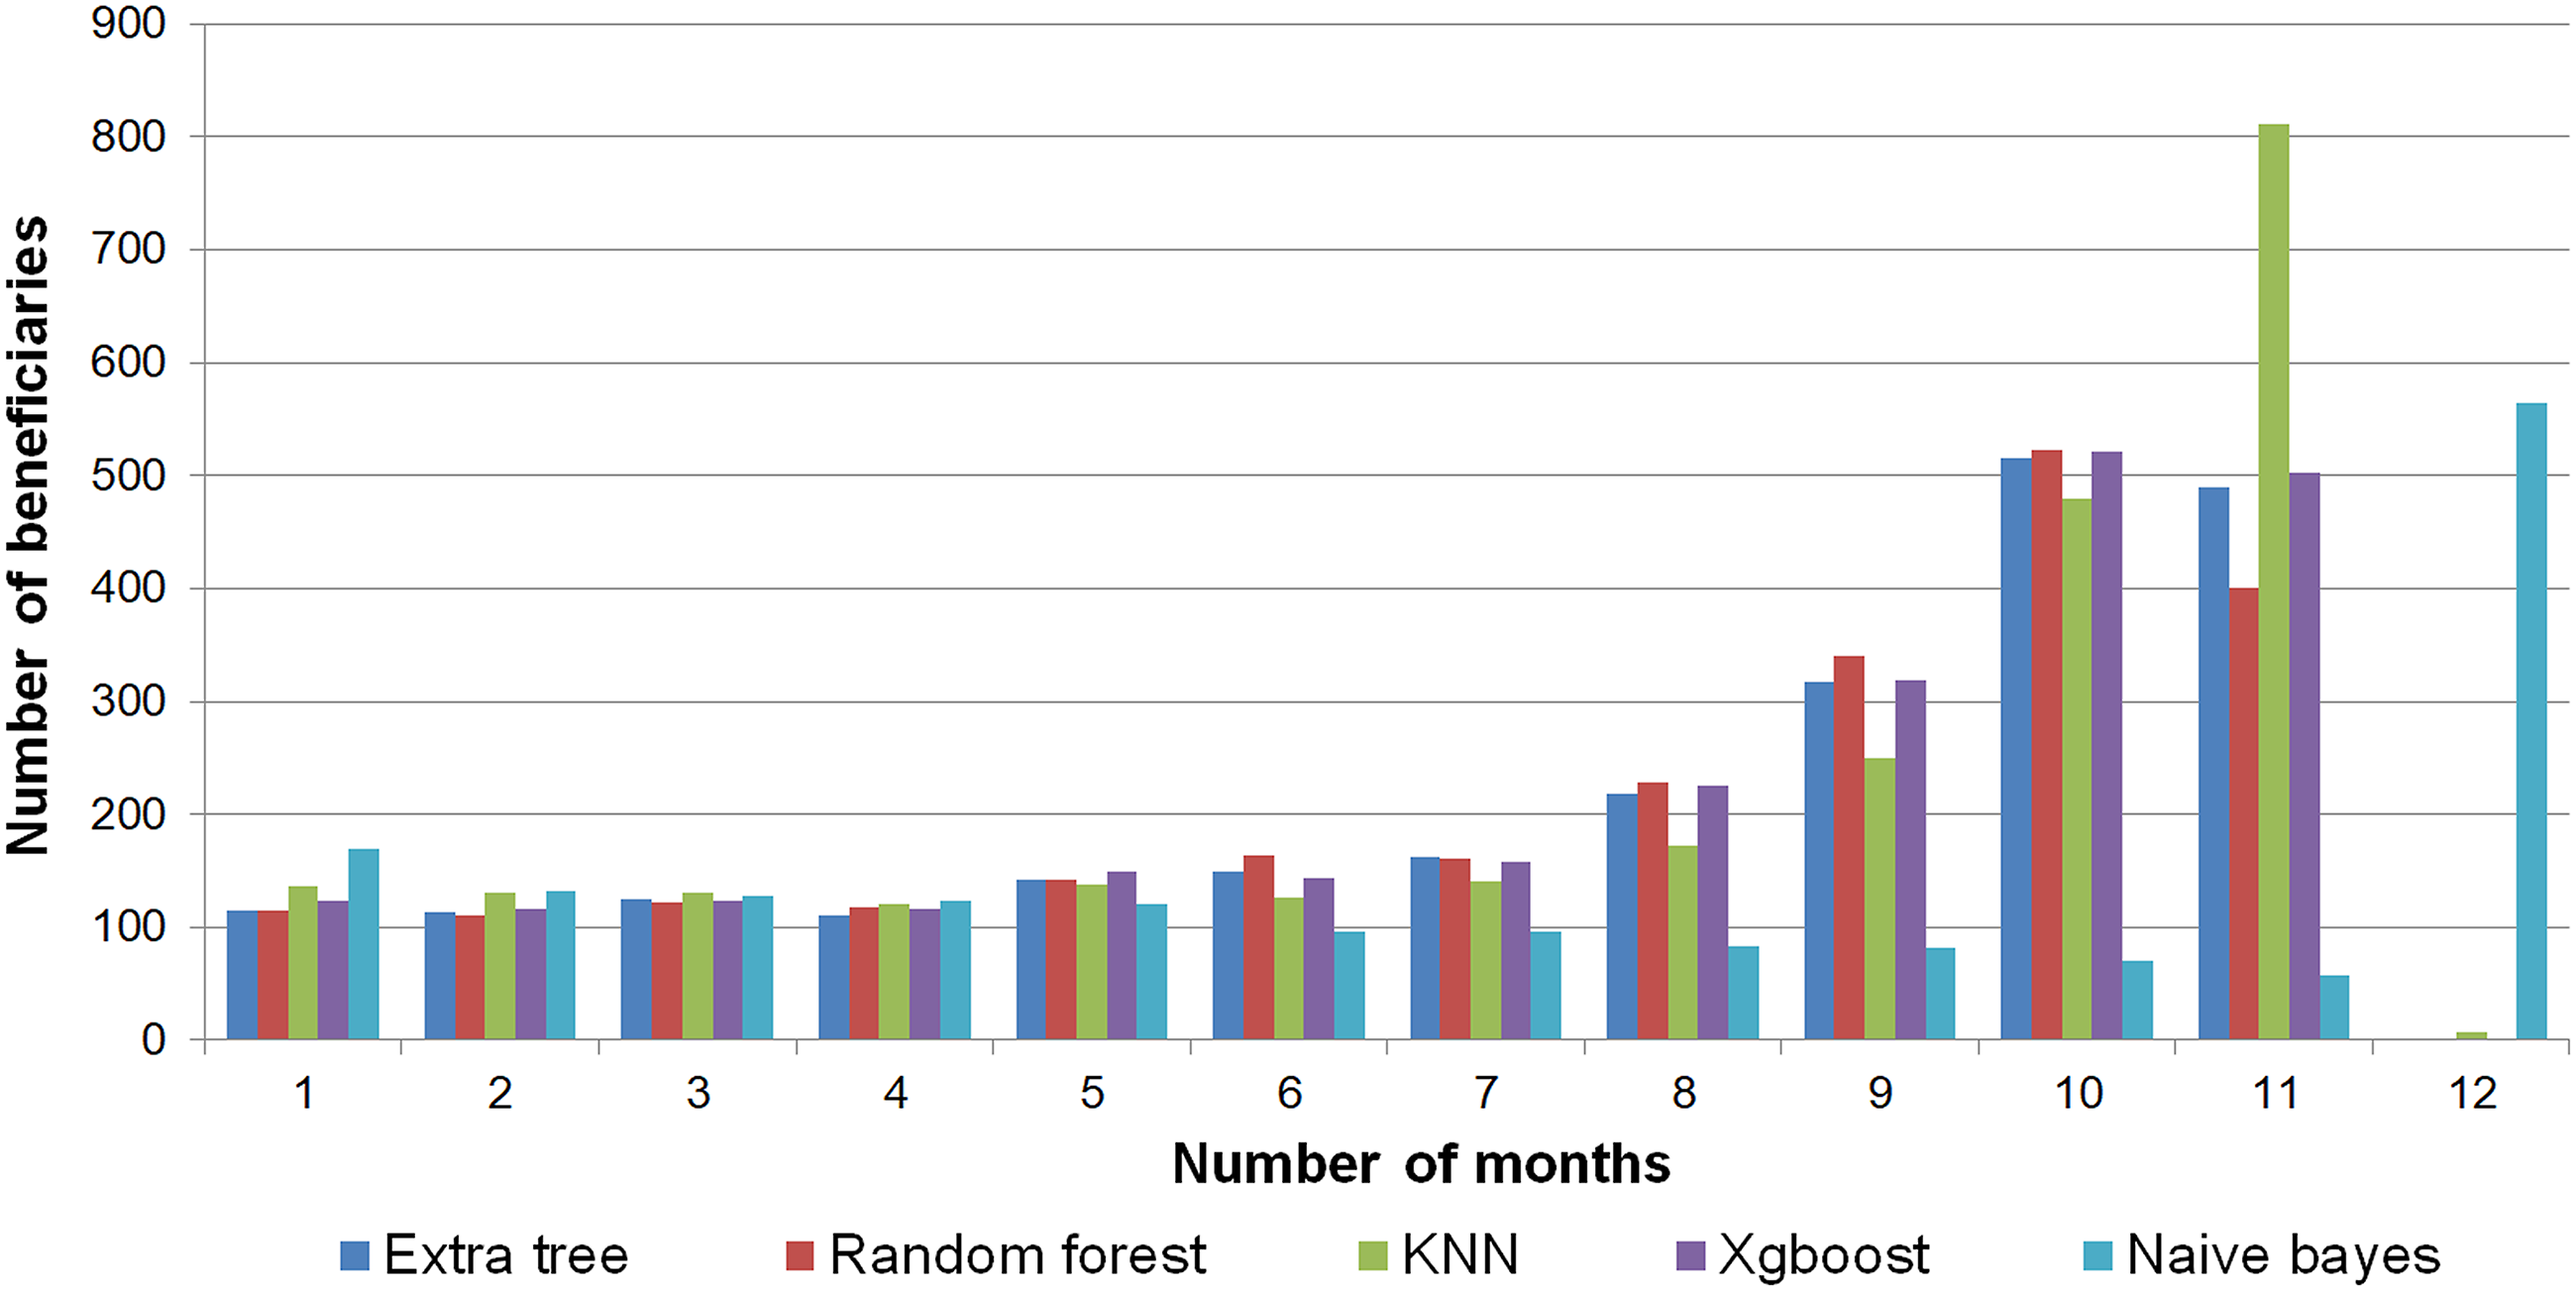
Strengths, limitations and future work
A positive aspect of the work, by design choice, variables and attributes belonging to the TISS standard were used, which aims to establish the standard for electronic data communication between different health promotion agents 29 and are used nationwide and defined by the National Supplementary Health Agency (ANS), thus facilitating the replication of the study. In order to make this experiment replicable by researchers from other countries, it would be recommended to translate procedure codes and terminology based on international standards, such as HL7.30,31
Another strength to be highlighted is the variability of the metrics evaluated during the analysis period, especially considering that, since March 2020, Brazil has been facing the SARS-COV-2 pandemic, 32 which has had a strong impact in healthcare, due to the restrictions imposed by social distancing, and also to the abrupt increase in the costs generated by beneficiaries whose health conditions were worsened by the disease. For example, K-nearest neighbor presented a 5.98% difference for the recall rate, considering the subtraction between best and worst results. Extra tree and Random forest, however, reached 7.25%, while Xgboost presented 7.32%. The algorithm with the greatest difference in results was Naive bayes, with 15.32%.
This study faced some limitations, such as the fact that the company provided data from January 2017 to July 2021. Therefore, the datasets for the learning process (training/testing) were created after 18 months, and not until January 2020 could they be considered complete. For instance, in a study by, 33 it took 36 months to create the dataset. Some studies15,17,34–36 have added anthropometric information, test results, information from medical records and even socioeconomic information related to beneficiaries. However, this study relied mostly on information related to the use beneficiaries make of the health care provided by their carrier.
Conclusions
The objective of this study was to classify beneficiaries of a healthcare insurance by using machine learning methods, defining classes by the presence of beneficiaries in high-risk groups during a period of 12 months after the month under analysis. Information obtained by machine learning processes can reveal the beneficiaries who are more susceptible to serious health problems than others, which helps health professionals to take action before the occurrence of an event, in order to mitigate future problems.
The datasets were based on actual information regarding beneficiaries’ use of their healthcare plan. Even though the company in question provided consolidated information, it was necessary to choose the most relevant attributes and treat them in order to avoid negative impacts on the model learning. In addition, no active beneficiaries were eliminated from the dataset. A beneficiary could be excluded before the 12-month period, thus, impacting the measurement of the event incidence, or they could be included at any point, and without any previous usage information that could assist in the machine learning process.
Five machine learning algorithms were analyzed, namely, Extra tree, Random forest, Xgboost, K-nearest neighbor and Naive bayes. The best parameters for the algorithms were chosen by using GridSearchCV and, after that, the algorithms were run for the 18-months datasets, which allowed us to see the variation over the analysis period.
Due to the characteristics of the study, recall is considered the most important metric, and its average rate ranged from 67.45% to 81.12%. The time interval between classification and the occurrence of events ranged from 7.46 months to 8.11 months, which are results obtained by Naive bayes and K-nearest neighbor, respectively. The results of the classification processes indicated that K-nearest neighbor had the best results for three metrics, they being recall, accuracy and F1-Score. Moreover, it had the longest time interval between the result and the incidence of events. Extra tree, in turn, had the best precision rate, while Random forest had the best AUC value. On the other hand, Naive bayes had the worst results for all metrics, in addition to the greatest recall loss.
With the information obtained, we hope to facilitate the establishment of health care processes and the identification of beneficiaries’ characteristics. In addition, the mechanisms for extracting information, forming datasets and executing machine learning algorithms, when applied on a monthly basis, tend to create a flow of new beneficiaries to the analysis, thus enabling real-world application and the combination with other data visualization mechanisms available by organizations.
Footnotes
Declaration of conflicting interests
The author(s) declared no potential conflicts of interest with respect to the research, authorship, and/or publication of this article.
Funding
The author(s) disclosed receipt of the following financial support for the research, authorship, and/or publication of this article: This work was supported by the Coordenação de Aperfeiçoamento de Pessoal de Nível Superior - Brasil (CAPES) - Finance Code 001.
Ethical statement
Data Availability Statement
The data that support the findings of this study are available on request from the corresponding author. The data are not publicly available due to privacy or ethical restrictions.