
Abstract
Background
Nowadays, functional tests (FTs), expert-assessment methods (EA), self-reported assessments (SA), and accelerometer-based assessments (AC) are common but seldom routinely used for assessing physical functioning and physical activity (PA) in older adults. Several standardized FTs exist for assessing mobility and balance for older adults. Among them are Timed Up and Go (TUG), 30-s chair stand (30sCST), and 4-stage balance test (4SBT). The FTs procedure usually involves trained personal (healthcare professionals) to assist with the test. In addition, an EA method 1 has been developed for assessing qualitative aspects of the movement performance, in which the movement performance is assessed by an assessor in the form of a score or a rate. SA methods are performed by individuals (older adults) through questionnaires, surveys, or interviews and are used for assessing mobility and balance status and measuring daily life PA. With AC methods, individuals should wear an accelerometer device for a period of at least seven days in order to measure daily life PA. As result, the accelerometer raw data is collected and a daily life physical activity data report is provided (e.g., hours of sitting, walking, biking, sit-to-stand transition, etc.). Accelerometers for assessing PA in older adults are still not commonly used by community care due to the cost, lack of information about upper body movement, and age-related accelerometer cut-off points that are not established and reliable. In general, every assessment method has its own advantages, disadvantages, and limitations. Clinicians must decide or make a compromise on which assessment or measurement methods to use based on several aspects: the individual (health and functional status), the objective of the evaluation, resource availability, time availability, and cost. Thus, a new method is needed to complement self-assessment methods that can reduce clinical resources (an assessor), be performed independently, and be used in clinical studies more frequently and repetitively with less technological effort for health professionals and older adults.
In our previous studies,2-5 we have developed a tool called the skeleton avatar technique (SAT) for automated assessment of human movements. In 3D SAT, a 3D sensor camera (Kinect) records human movements, estimates the joint position in each frame of the motion recording, and maps this information to a movement quality score with help of AI techniques. This tool was tested and validated for the assessment of mobility and balance among healthy older adults, 1 and for measuring PA in healthy older adults. 6 Both studies show that the 3D SAT is a good tool for predicting the results of the FTs and accelerometer-based assessed PA. These studies show the predictive potential of 3D SAT and suggest a wider application for elderly care. However, in order to use the 3D SAT, the Kinect camera must be used in a hospital or at home, which is inaccessible to people with mobility difficulties and is dependent on technical personnel. With the recent technological advancement in single or multi-pose estimation in 2D video tracking software, it is possible to record human movements with a mobile camera (2D) and to receive reliable estimates for the position of body joints. One of the fast and highly accurate tracking software is MoveNet 1 provided by Tensorflow Hub. It has proven to be useful for fitness, health, and wellness applications. 7 In this study, we have used the pre-trained MoveNet model to obtain the 2D positions of body joints and developed a 2D-based SAT. This, in turn, enables SAT to become handier, i.e., to be used in mobile phones.
The aim of this study was to explore whether 2D SAT yields accurate results in physical activity and functioning assessment in healthy older adults, statistically compared to the accuracy of 3D SAT. Comparing 3D SAT with 2D SAT performances will show us which technology is more accurate for which type of assessment (FTs, PA). In addition, we compare the different settings (cut vs. uncut, direct vs. indirect features) of 2D SAT in order to explore which of these settings are important or informative for which type of movements or assessments (FTs, PA).
Method
Study design and participants
This work is a comparative study based on two previous cross-sectional studies.1,6 We have repeated the two previous studies using 2D SAT data and compared the results with 3D SAT data in terms of their estimation error in the respective predictions.
As in the previous studies, this present study was performed on 54 community-dwelling older adults (65+, 38 females, and 16 males). The Ethical Review Authority approved the study after all participants signed informed consent.
Collected data
In this study, we have used assessment and measurement results collected from our previous studies1,6 as shown on Figure 1. It includes: three supervised FTs (TUG, 30sCST, and 4SBT) performed in a controlled environment, EA of the sit-to-stand movement performed on video recordings by an experienced physiotherapist using the Instrument for movement analysis of person transfer and mobility (IRAF) in daily living,
8
daily life PA collected by an ActivPAL device within 7 days, and completed SA questionnaire about daily life PA. The SA questionnaire contains questions about sitting and lying activities per day (in hours), the duration of physical activities per week (in minutes), exercises per week (in minutes), the duration of one exercise (in minutes), the frequency of exercising (e.g., few times per week, every day, sometimes per week, no training program), and the degree of strenuous of the exercising (not, little, moderate, very strenuous). The collected information from the SA questionnaire is presented in our previous study.
6
General overview of collected data.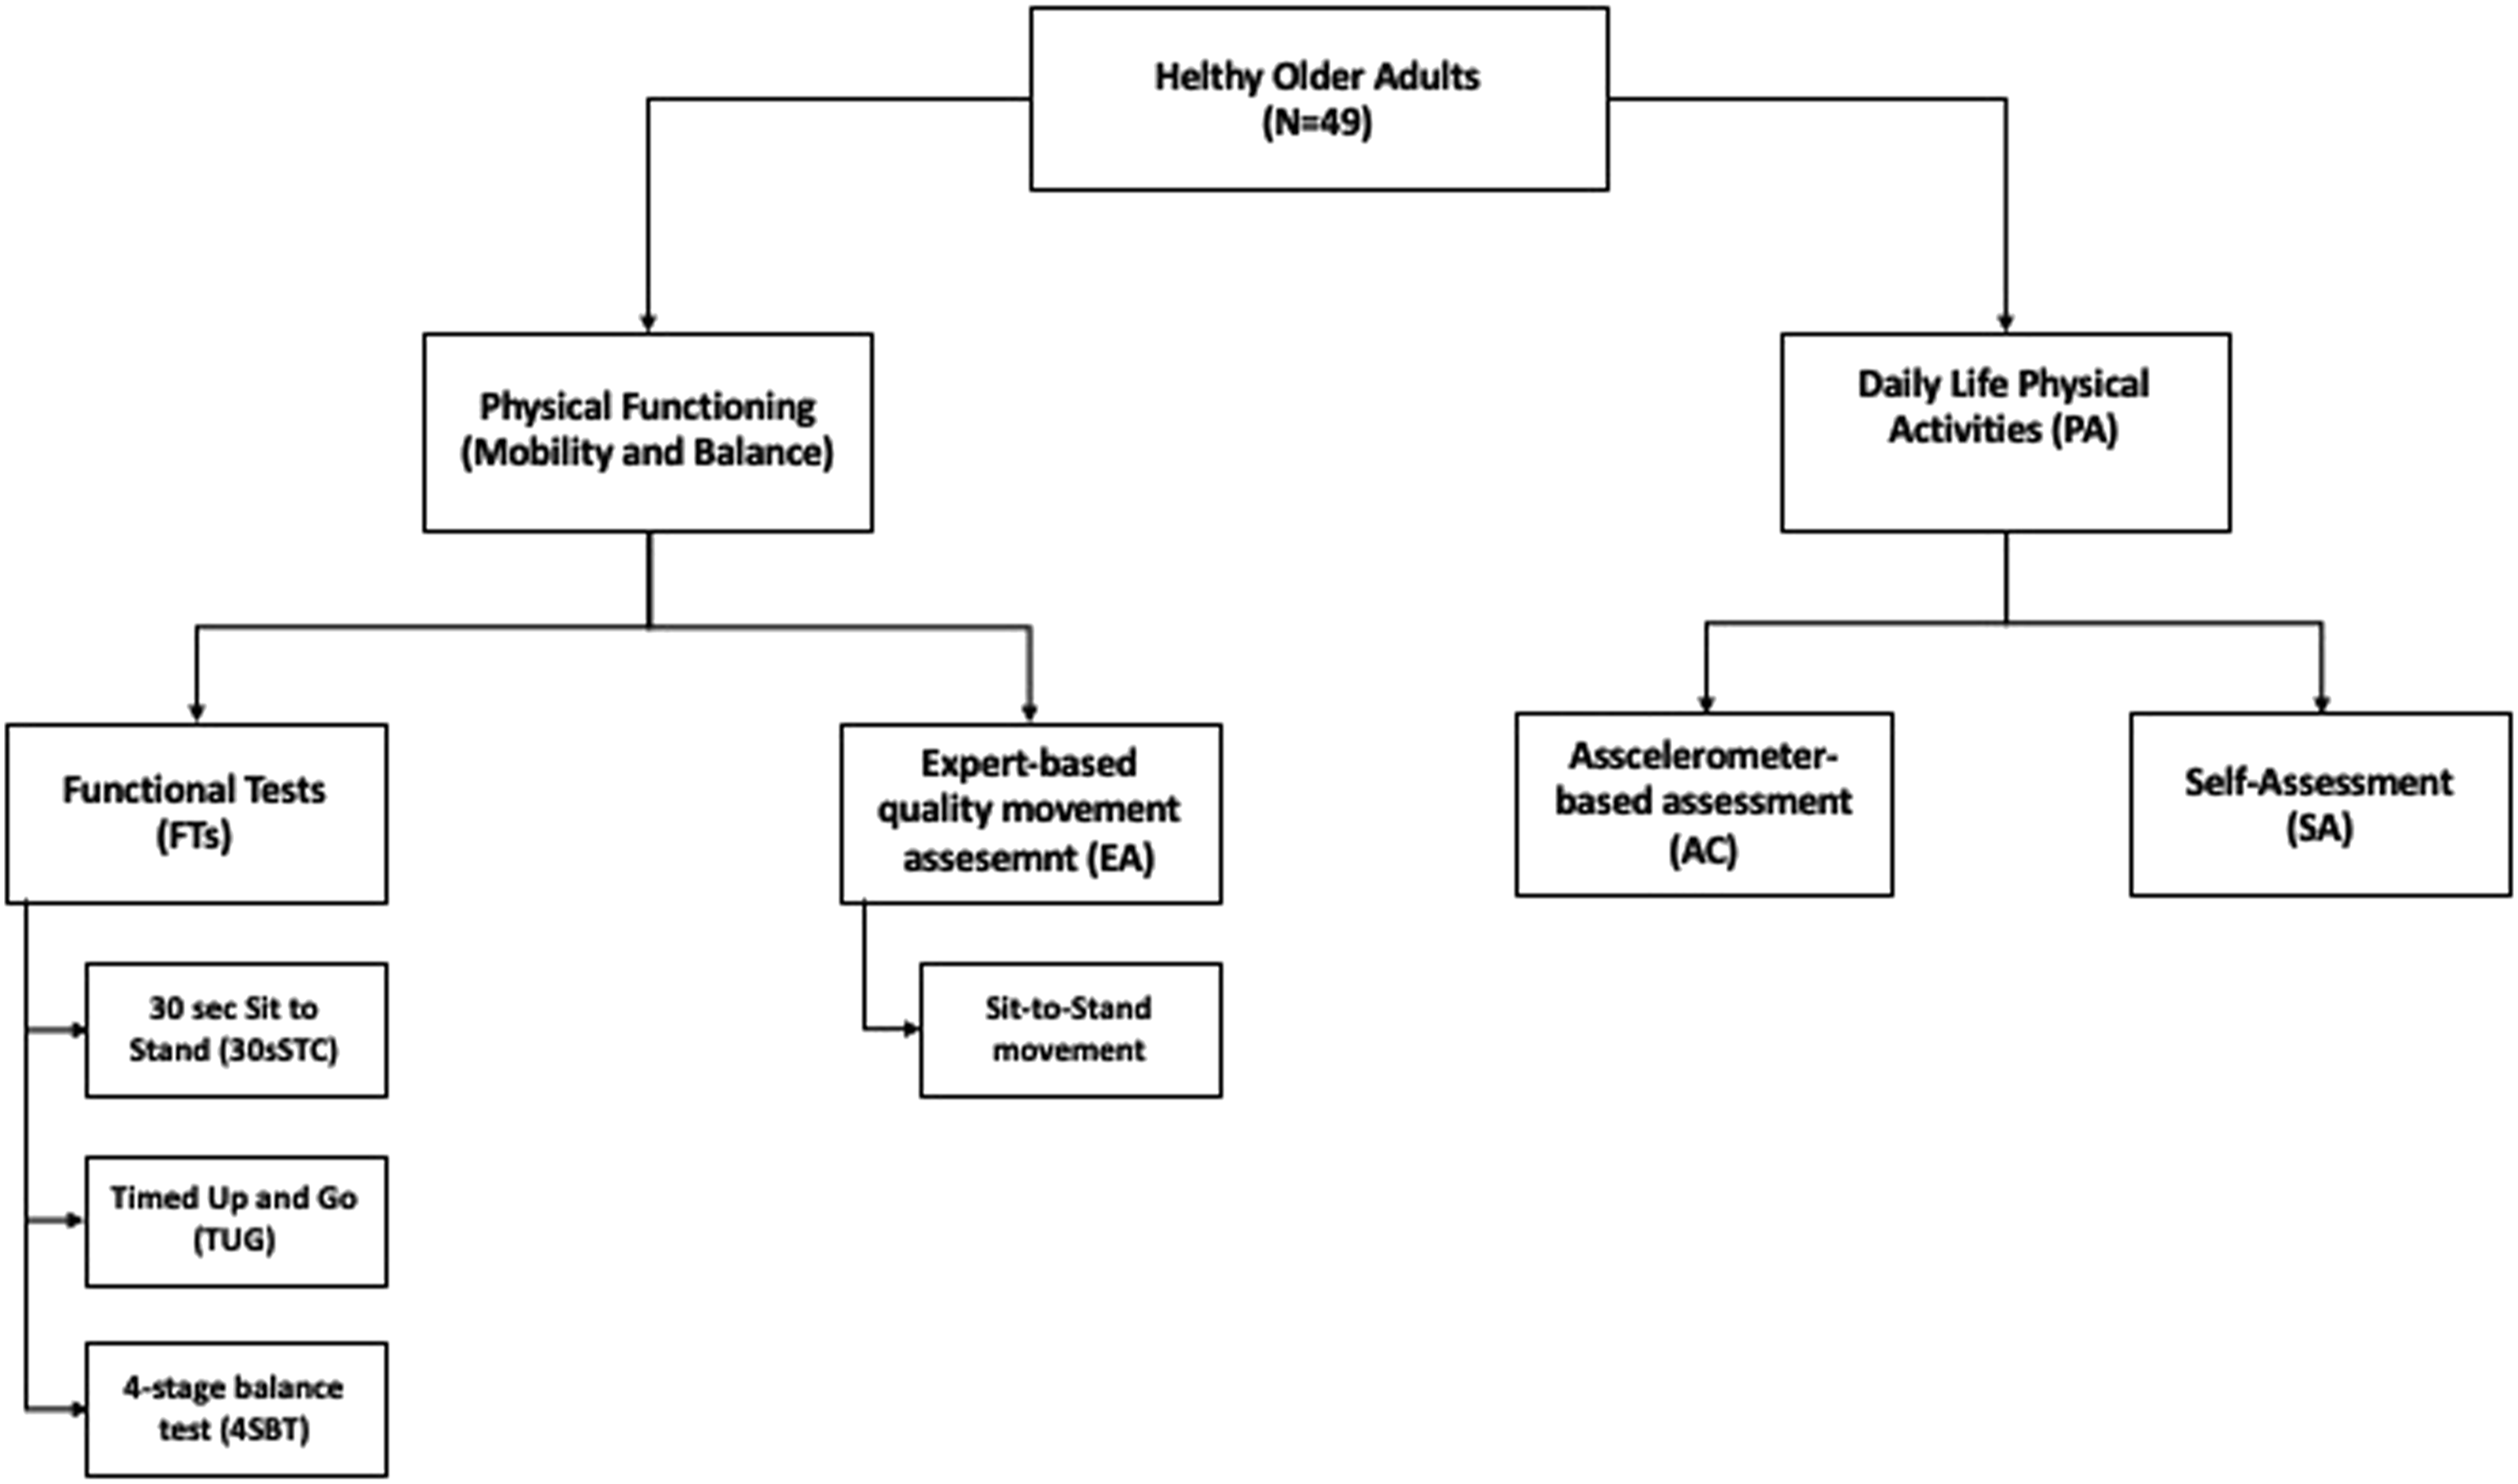
In addition to the standard FTs assessments, the execution of each functional test was recorded with a Kinect 3D sensor camera (Microsoft), with an RGB camera resolution of 1920 x 1080 pixels. In this study, we have used only the video recordings produced by Kinect camera of participants performing FTs. Few videos were corrupted (or contained the execution of a movement), thus in total 49 adults participated in this study. Then each video was transformed to mobile camera video size (256 x 256 pixels) and processed by MoveNet’s single pose lightning model 2 to obtain 13 key points with a frequency of 20Hz. 2D SAT data consists of movement sequences captured from 2D skeleton avatars of the individual performing FTs.
Data preprocessing
There are 13 key points (mostly joints) in total identified by the MoveNet model: nose, left/right shoulder, left/right elbow, left/right wrist, left/right hip, left/right knee, and left/right ankle. Each key point is represented with a 2D coordinate (x, y) and is called direct features. The features that were computed from direct features are called indirect (such as angles between different limbs and the axes of the 2D coordinate system).
Videos that are uncut contain frame sequences when subjects are getting into position before either starting a movement or leaving the scene. Only frames containing actual movement from start to finish are included in the cut videos. The cutting of sequences was performed automatedly using the winning dynamic time wrapping (DTW) approach. 9 More detailed information about data preprocessing and preparation can be found in our previous studies.1-2,5
Machine learning
In order to compare the 2D SAT with the 3D SAT approaches, we applied the same number of experiments (8 settings: indirect/direct features, cut/uncut sequences, normalized/not normalized features) with the same deep-learning models: convolutional neural network (CNN) and recurrent neural network (RNN) as in our previous studies,1,6 and shown on Figure 2. Machine learning experiments overview.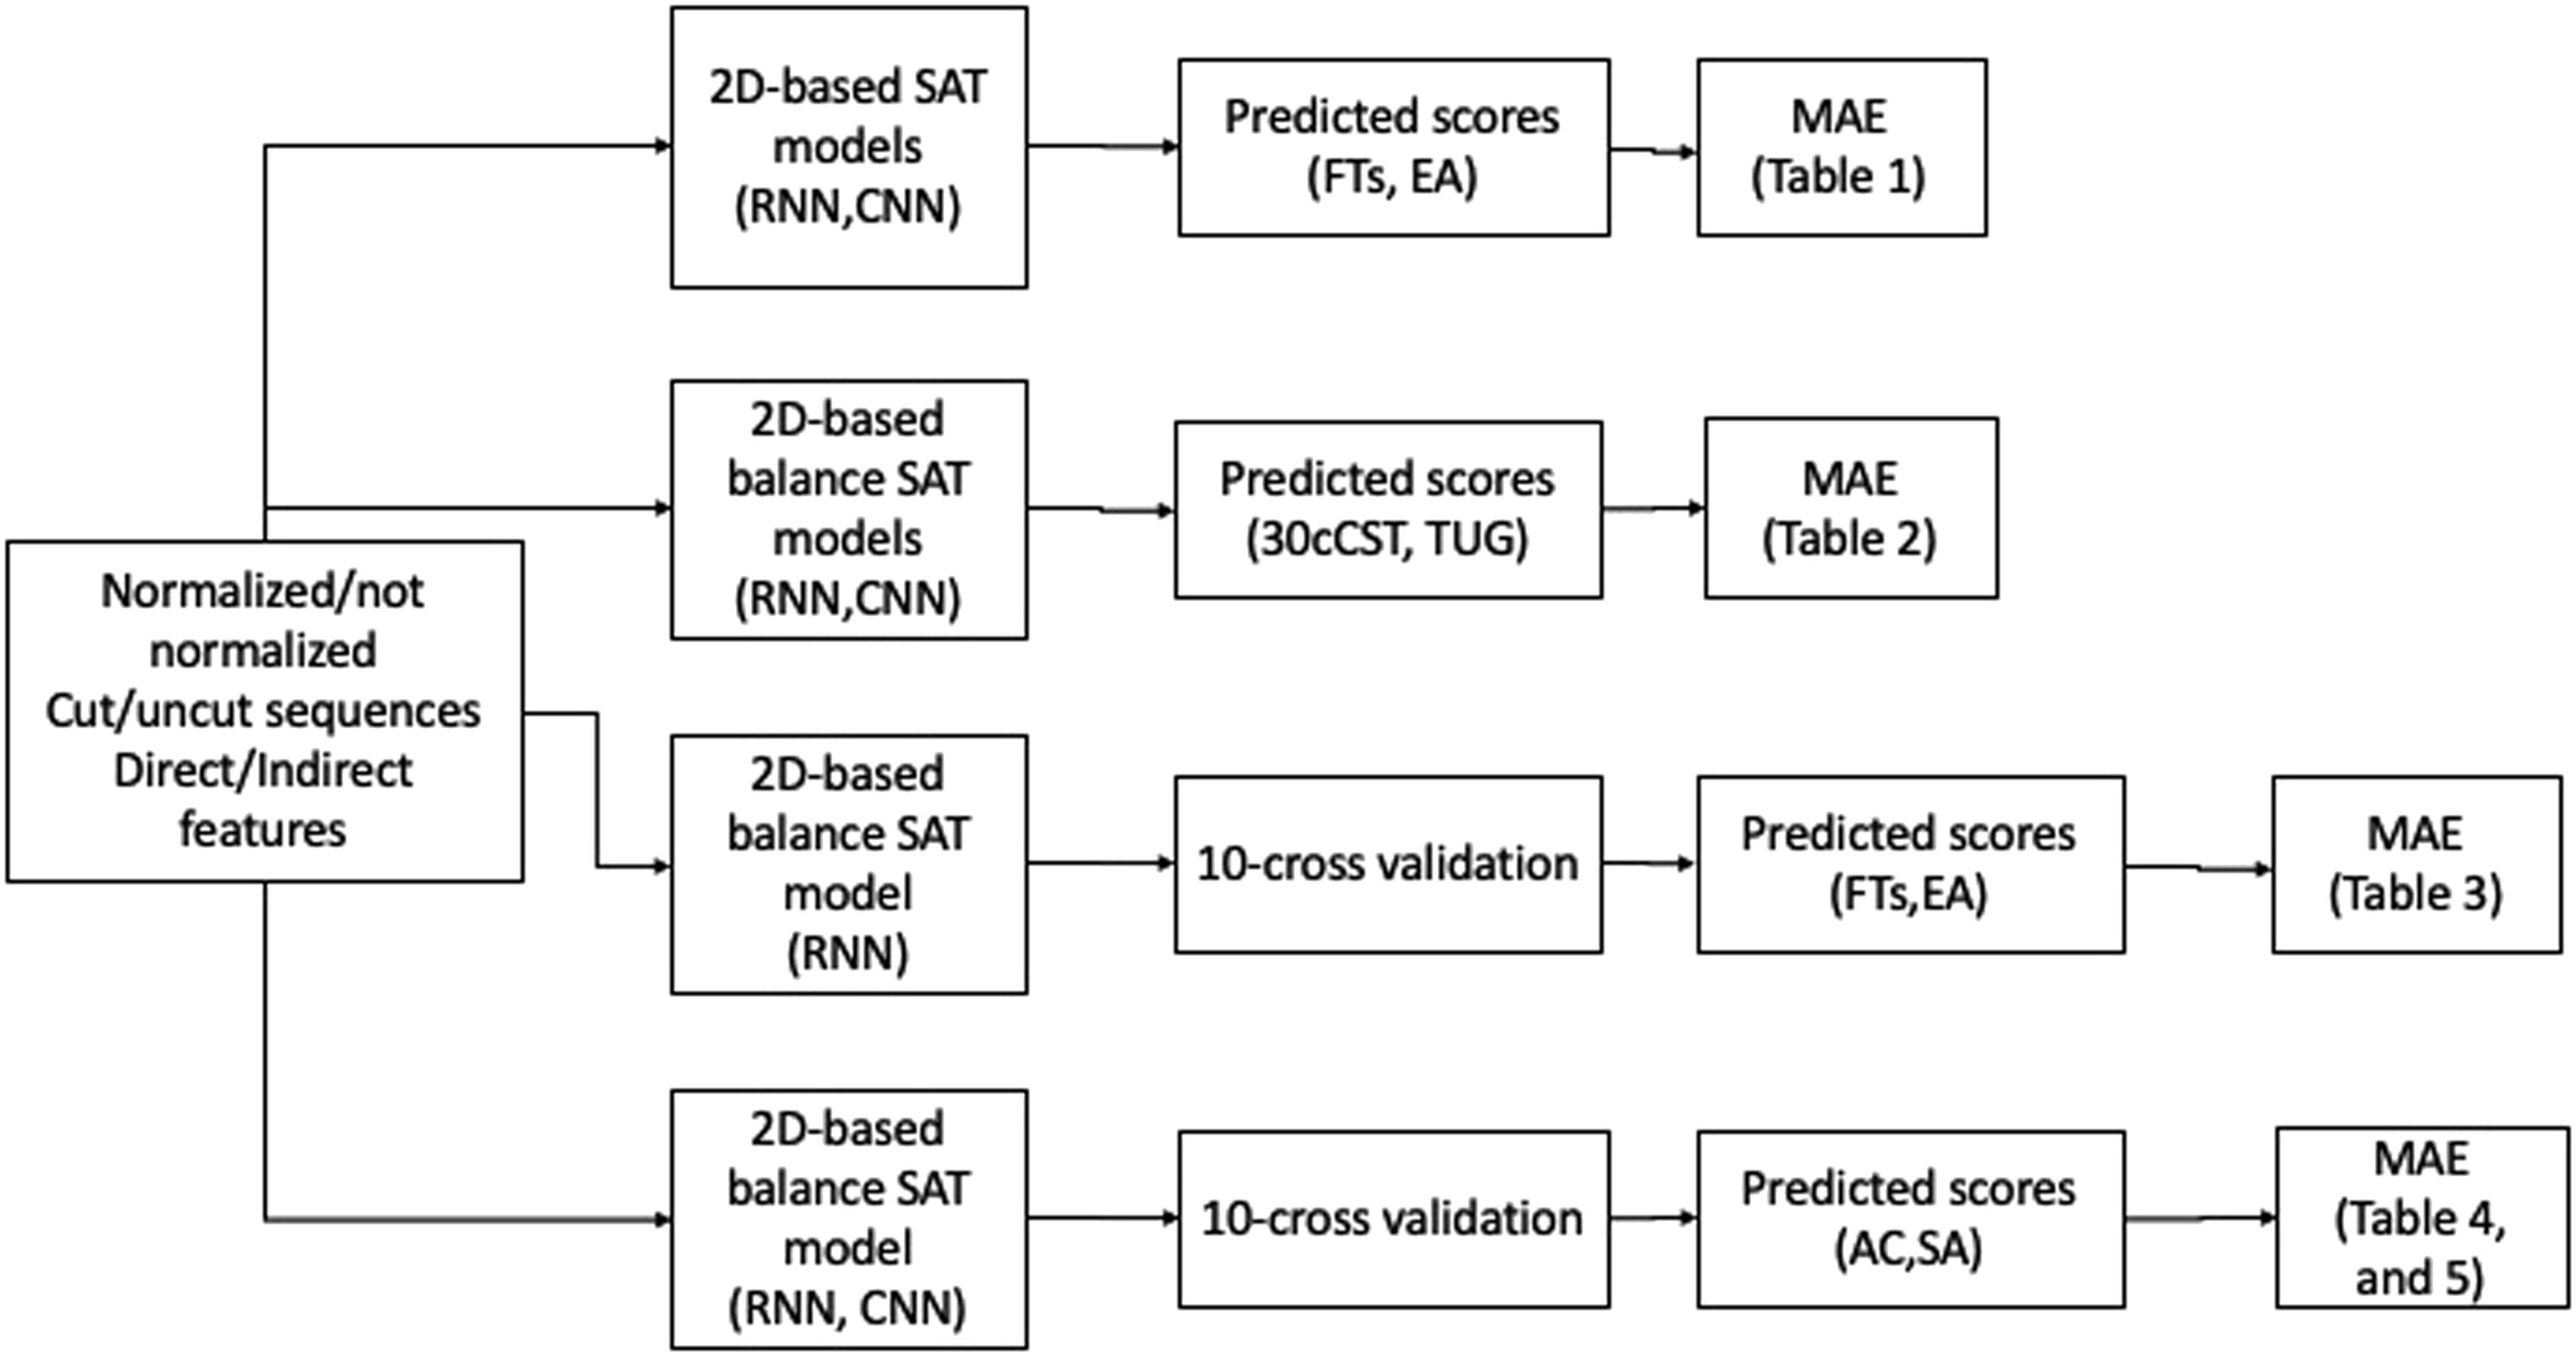
The input variables are the 2D join position sequences of the FT’s execution. The response variables are the normalized FTs scores (4SBT, 30sCST, TUG), expert assessment scores (EA), self-assessed daily life physical activity scores (SA), and accelerometer-based assessed score (AC), which were collected in previous studies.1,6
In the RNN model, 10-fold cross-validation was only performed on combinations of preprocessed data that were found to be promising due to the high computational effort. To compare the model performances, we used the mean absolute error (MAE) as the loss function. The machine learning results were interpreted as good (MAE < 10%), moderate (10% ≤ MAE < 20%), or bad (MAE ≥ 20%). The MAE values reported in the results are the averages of the predictor functions applied to the test data using cross-validation.
Our experiments applied standard neural network technology 10 implemented in Python 3 using the Tensorflow framework. 11
Statistical analysis of machine learning results
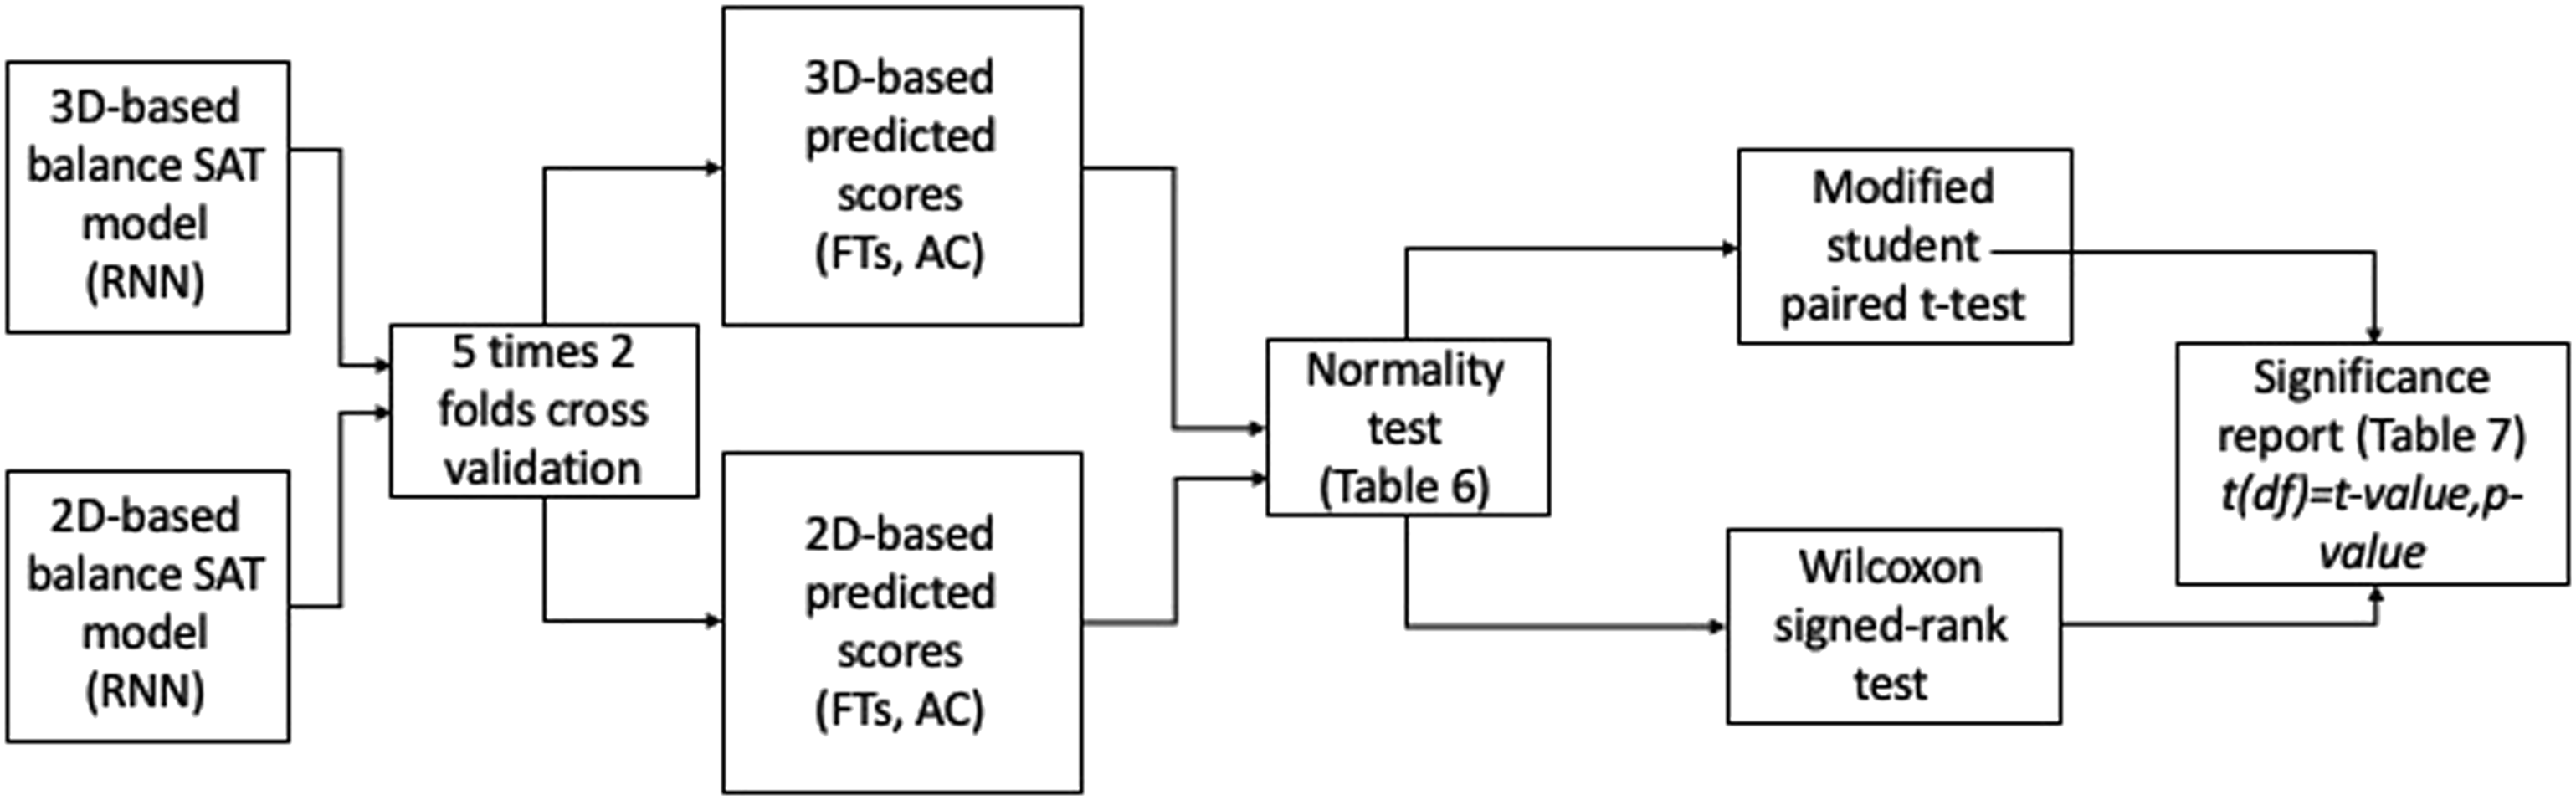
Comparisons between the 2D- and the 3D-based SAT results were made using the modified paired Student's t-test proposed by Nadeau and Bengio
12
(for the outcomes following Gaussian distribution) and Wilcoxon signed-rank test (for the outcomes not following Gaussian distribution) on the 10 repeats of 2-fold cross-validation results (as shown in Figure 3). In total, 20 values of MAE are used to compare the models’ accuracy. According to Dietterich,13,14 in the k-fold cross-validation method, the test and training datasets overlap in different k folds, thus violating the independence assumption of the paired t-test. Thus, for appropriate significance testing, only two folds are chosen to be sure that each observation appears only in either the train or the test dataset. The following hypotheses were tested: • H1. There is no statistically significant difference between cut and uncut sequences for predicting FTs and PA scores (for 2D-based SAT). • H2. There is no statistically significant difference between the use of direct and indirect features for predicting FTs and PA scores (for 2D-based SAT). • H3. There is no statistically significant difference between the performance of 2D and 3D-based SAT models in predicting FTs and PA. Statistical analysis overview.
Results
This section presents first the prediction results of physical functioning (mobility and balance: FTs and EA scores) using the 2D SAT. Then, it presents the prediction results of PA using 2D SAT of a standardized functional (balance) test (the stage four (one-leg-stand) exercise of the 4SBT test). Finally, we present the statistical results of the comparison of 2D SAT balance and 3D SAT balance models.
Prediction of FTs and EA scores using the corresponding 2D SAT
MAEs for predicting FT results and EA scores.
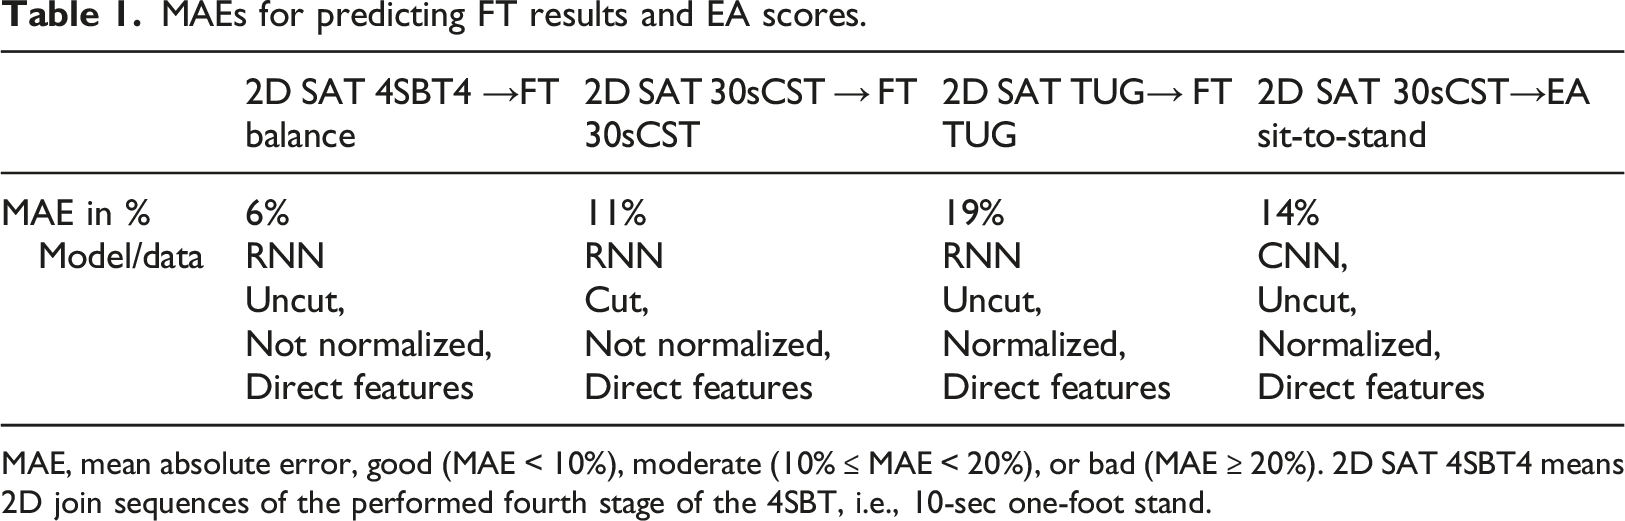
MAE, mean absolute error, good (MAE < 10%), moderate (10% ≤ MAE < 20%), or bad (MAE ≥ 20%). 2D SAT 4SBT4 means 2D join sequences of the performed fourth stage of the 4SBT, i.e., 10-sec one-foot stand.
MAEs for predicting FT and EA sources using 2D SAT balance data.
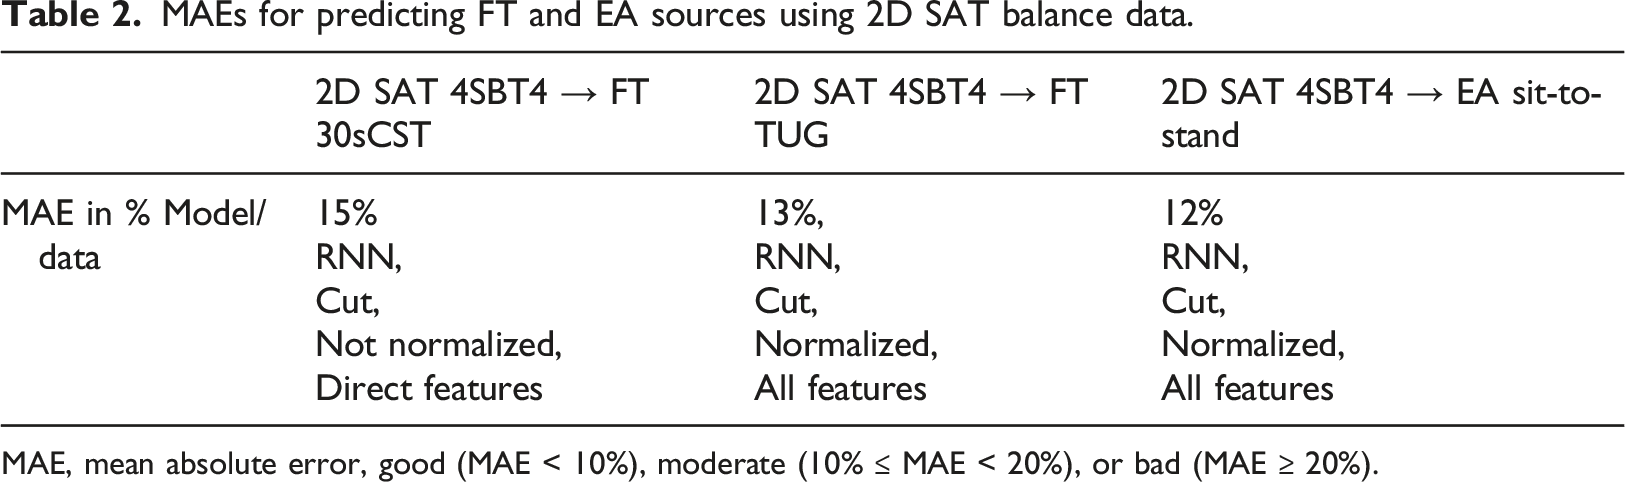
MAE, mean absolute error, good (MAE < 10%), moderate (10% ≤ MAE < 20%), or bad (MAE ≥ 20%).
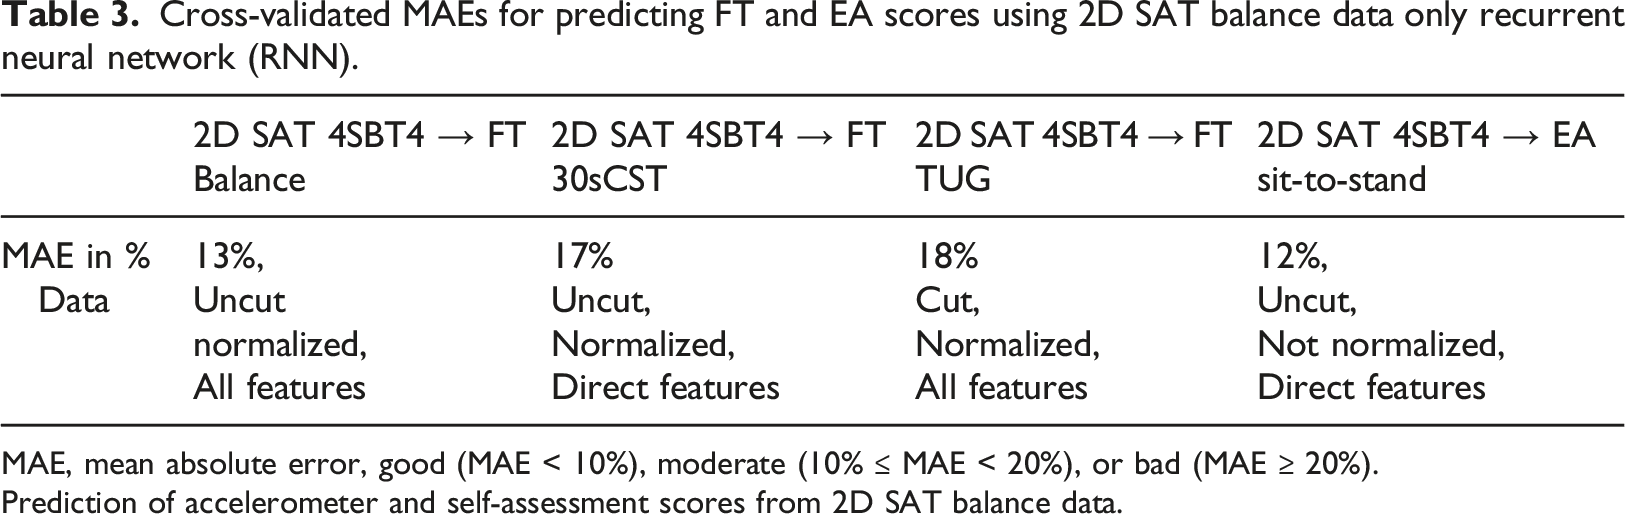
Cross-validated MAEs for predicting FT and EA scores using 2D SAT balance data only recurrent neural network (RNN).
MAE, mean absolute error, good (MAE < 10%), moderate (10% ≤ MAE < 20%), or bad (MAE ≥ 20%).
Prediction of accelerometer and self-assessment scores from 2D SAT balance data.
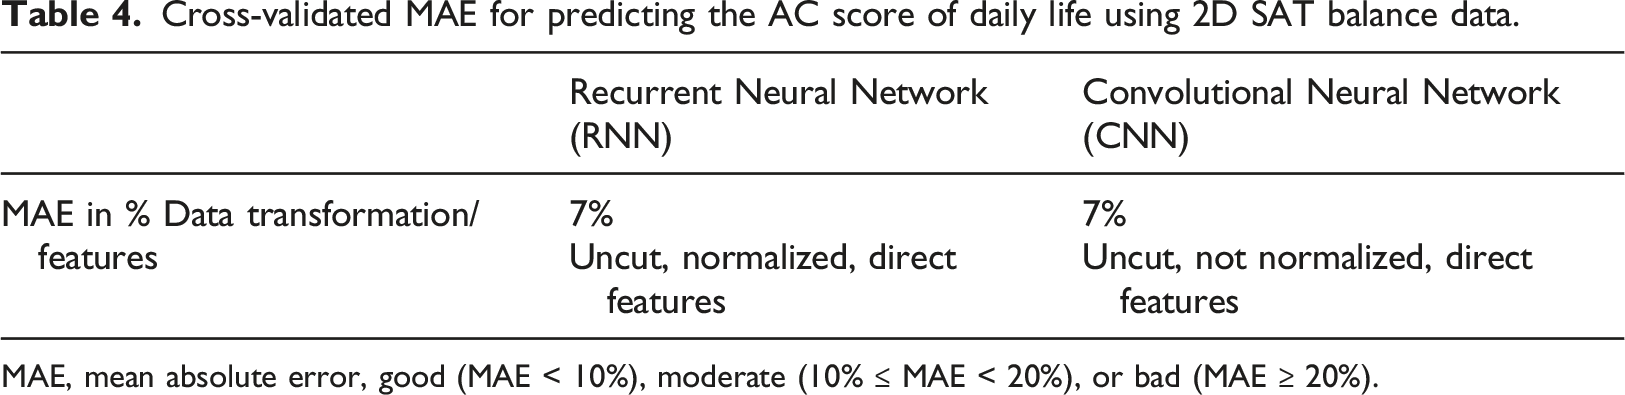
Cross-validated MAE for predicting the AC score of daily life using 2D SAT balance data.
MAE, mean absolute error, good (MAE < 10%), moderate (10% ≤ MAE < 20%), or bad (MAE ≥ 20%).
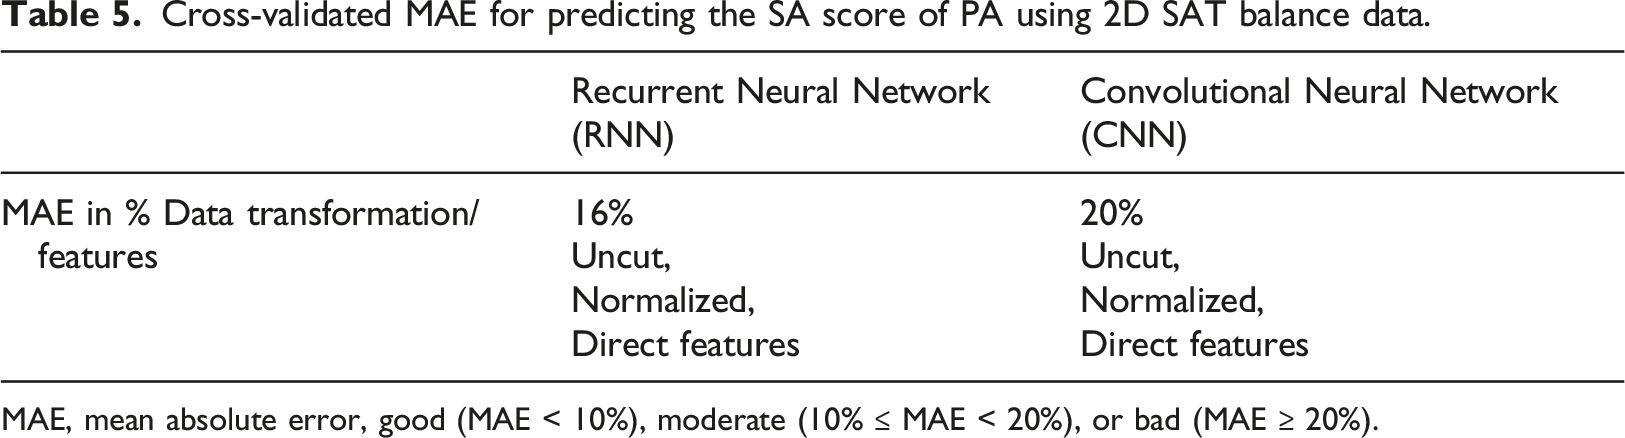
Cross-validated MAE for predicting the SA score of PA using 2D SAT balance data.
MAE, mean absolute error, good (MAE < 10%), moderate (10% ≤ MAE < 20%), or bad (MAE ≥ 20%).
Statistical Results
Shapiro-Wilk normality test results with test statistics t and p-values (t, p).
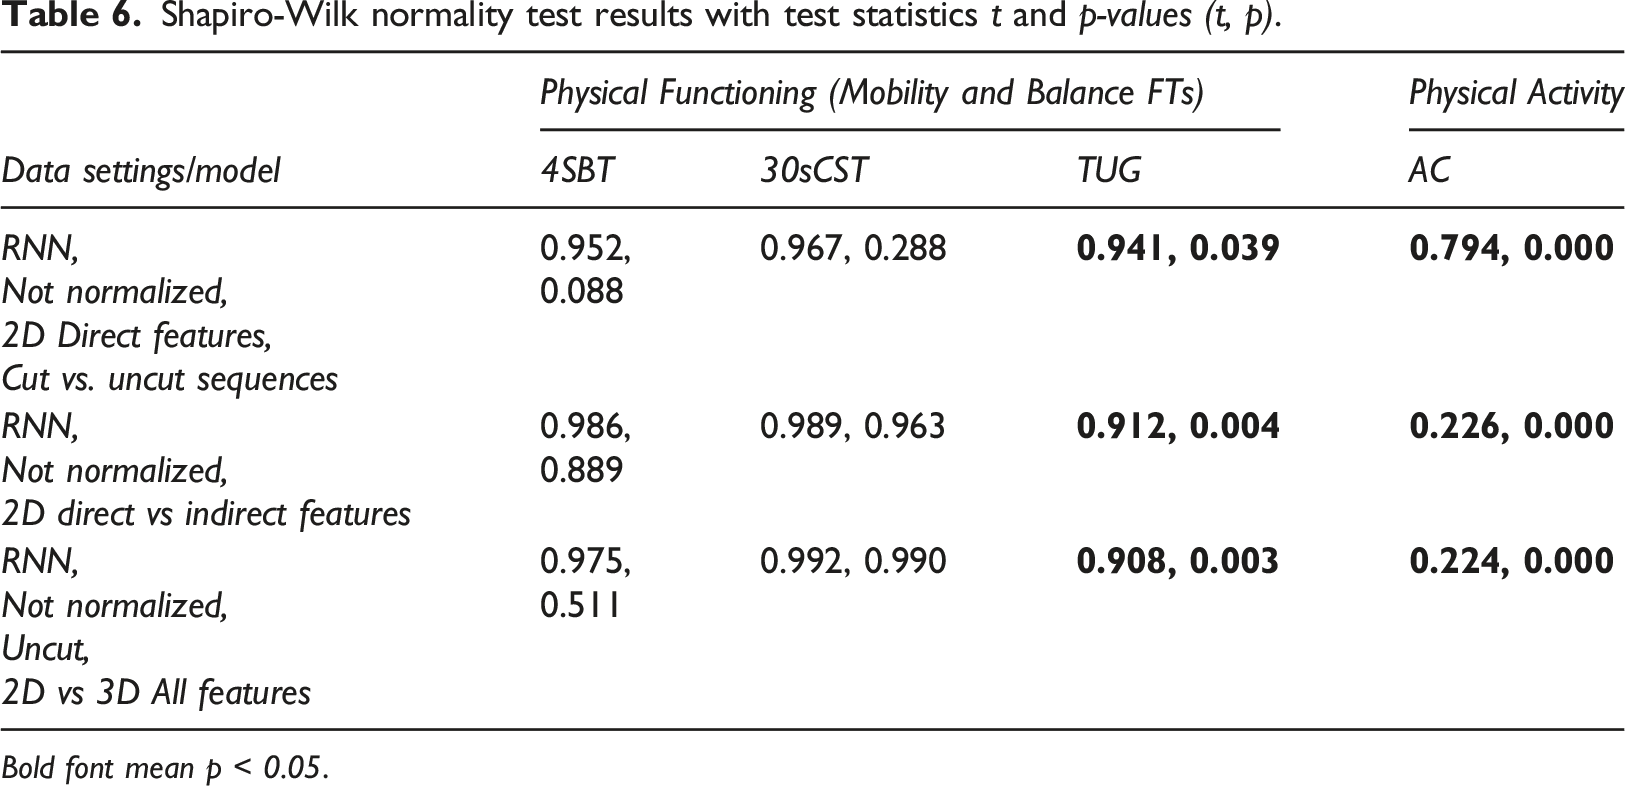
Bold font mean p < 0.05.
As can be seen from Table 6, the normality test results for 4SBT and 30sCST indicate that the machine learning results are sampled from the normal Gaussian distribution, whereas the results provided by TUG and AC indicate the non-normality of the data. Thus, for the 4SBT and 30sCST data, the modified paired t-test [16,18] was applied to compare the differences, and for TUG and AC data, a non-parametric significance test, i.e., the Wilcoxon signed-rank test, was conducted.
Significance test results: t(df) = t-value, p-value, Accept/Reject of null-hypothesis.
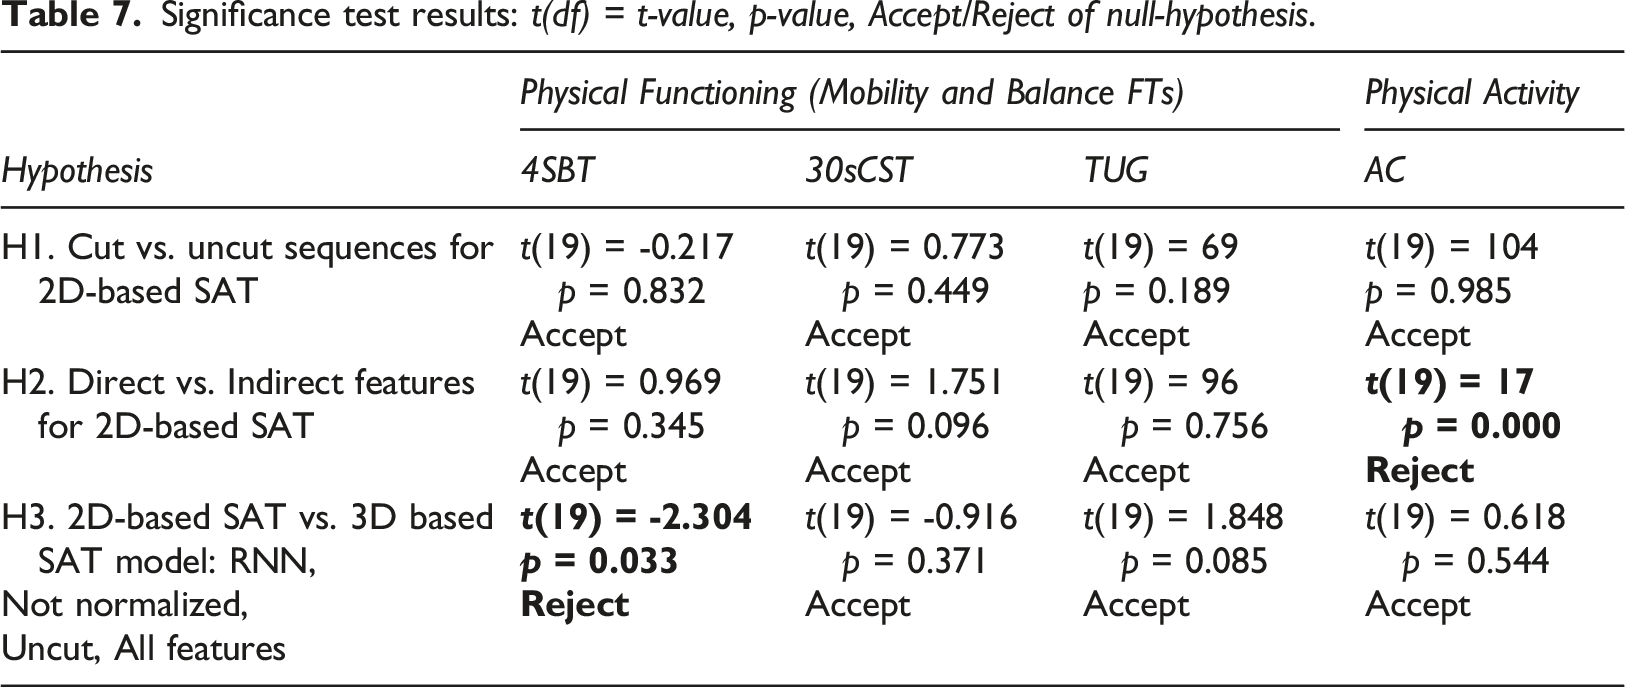
From the data in Table 7, there was no significant difference found in the machine learning outcomes for cut and uncut sequences for FTs and PA (H1 row of Table 7). Also, no significant differences were found in the machine learning outcomes for direct and indirect features for FTs. In contrast, there was a significant difference in the machine learning results predicting PA measured by the accelerometer, with direct features (M = 0.079, SD = 0.011) and indirect features (M = 0.131, SD = 0.194); (H2 row of Table 7). Mean, and standard deviation are denoted by M and SD, respectively. This means that the addition of the indirect features (angles between joins) is important to consider for assessing PA in older adults. As there is no significant influence on the 2D SAT model accuracy for using cut or uncut sequences, we can use uncut sequences for FTs and AC and not need to calculate indirect features for FTs, to increase the model accuracy. Finally, there was no significant difference found in the machine learning outcomes for 2D vs. 3D sequences for two of three FTs (30sCST and TUG) and for PA (H3 row of Table 7). For predicting the balance test (4SBT), 3D SAT sequences led to significantly better predictions (good results) than the corresponding predictions based on 2D SAT sequences (moderate results).
Discussion
Based on the results presented in the previous section we first discuss the 2D SAT machine learning results for assessing physical activity and functioning in healthy older adults in comparison to 3D SAT. Then we discuss the results obtained from the statistical comparison of 2D and 3D SAT accuracy. Finally, we summarize this section by discussing the potential usability of 2D SAT for assessing physical activity and functioning in clinical studies and practice.
Comparison of the 2D SAT performance with the 3D SAT
The results of this study (Table 1-3) indicate that the 2D SAT still needs accuracy improvements (the desirable MAE<10%) for assessing physical functioning in healthy older adults. Comparing 2D SAT results with 3D SAT results showed that the accuracy (MAE) decreases on average by 6% for physical functioning and 4% for physical activity. These differences can be explained in part by having less information for the join positions (only x and y coordinates), smaller image resolution (256x256 pixels of the simple mobile camera), the use of a lightning version of MoveNet model (recommended for mobile devices), and the 2D indirect features (angels between the limbs) were less informative than 3D features.
However, the 2D SAT data of a functional balance test (fourth stage of the 4SBT, i.e., the 10-s one-foot stand) might be used to predict PA assessed with an accelerometer with good accuracy (MAE < 10%). This is also in accordance with our previous studies, which showed that SAT 4SBT based data predicts the AC score better than SA scores, and RNN outperformed CNN (Table 5) or yielded similar results (Table 4). These results confirm the association between balance and daily life activities in healthy older adults. However, 3D SAT achieved better accuracy than 2D SAT (MAE 3,89% for PA, and 11,07% for SA). Still, the 2D SAT based model accuracy for predicting PA is good (MAE 7%).
Statistical Comparison of 2D and 3D SAT Accuracy
This study’s results show a significant difference between 2D SAT and 3D SAT models only for predicting 4SBT FT scores (cf. H3 in Table 7). The small t-value indicates that it is a relatively small (but significant) difference thus both models perform similarly. It is interesting to note that normality test results show relatively consistent values for 4SBT and 30sCST (that the data comes from Gaussian distribution), and for TUG and AC (that the data does not come from Gaussian distribution) for both 2D and 3D based model outcomes (see Table 6). A possible explanation for these results may be a small sample size, and that 4SBT and 30sCST tests are a movement at one spot, while the TUG exercise requires a person to walk, and daily life activities measured by AC include a lot of movements (walking, sit-to-stand transition, etc.).
In summary, the comparison of 2D SAT with 3D SAT showed a decrease in the accuracy using 2D SAT for all experiments, which is not surprising due to having less information in the datasets (two coordinates instead of three). Overall, both 2D and 3D SAT performed better for predicting PA assessed with an accelerometer than physical functioning (mobility and balance assessed with functional tests). A possible explanation for this might be that the z-coordinate (in 3D) is not informative for predicting everyday life activities. Since a significant difference was found between 2D and 3D SAT for the 4SBT test, the sources of improvements in 2D SAT should be further investigated. As a suggestion, other key point models (or MoveNet model variants) should be assessed, along with other data augmentation transformations (rotation, mirroring), and identifying possible outliers.
Implications of the 2D SAT and Future Research
2D SAT may be used to complement the assessment of physical activity in healthy older adults. Based on the results from this study, the 2D SAT might be a possible method to use to evaluate PA among older adults in upscale clinical studies. For instance, using 2D SAT as a sensitive complementary assessment tool for physical activity and functioning in population-based studies and in home care settings.
To use 2D SAT in clinical studies, we need: (a) to develop a mobile and web application for health care professionals to assess PA, visualize, and store the results; (b) introduce this application to the health care professionals and older adults and explore how they can use it; (c) and collect more research data which can be used for further improvements of SAT. In the long-term perspective, an application of 2D SAT provides a possibility for older adults to measure PA independently by using their mobile camera, which furthermore increases availability reduces costs (no need to buy an accelerometer device), and time (no need to wear the accelerometer device for 7 or more days), can be repeated on a routine basis.
More research and studies on accuracy improvements of 2D SAT for assessing physical functioning (mobility and balance) are needed to overcome the reduced information compared to 3D SAT. The study results indicate that using only balance movement data (4 stage 4SBT) is not enough to assess the mobility (TUG, 30CST) and balance (4SBT test). Further research is needed to explore other movements, including other assessment methods, indexes, and self-assessments which can contribute positively to the overall accuracy of 2D SAT.
Conclusion
There is a need to simplify the assessment of physical functioning (mobility and balance) and physical activity among older adults both in clinical studies and practice. In this study, we compared the use of 2D and 3D SAT tools for assessing functional activity and functioning in healthy older adults. This study has found a significant difference between the 2D and 3D SAT model’s accuracy only for predicting the outcome of the balance 4SBT test, not for other tests of physical functioning and activity. However, the prediction accuracy is moderate with a mean absolute error of 10-20%. This means that the sources of accuracy improvements of 2D SAT for assessing functional functioning should be further investigated. Altogether, this study shows promising results for the use of 2D SAT for assessing physical functioning and activity in healthy older adults in future clinical studies and clinical practice. In future work, we will continue to develop the 2D SAT (e.g., improving the accuracy, and adding qualitative aspects of movement analysis) for using it in clinical practice and studies.
Footnotes
Declaration of conflicting interests
The author(s) declared no potential conflicts of interest with respect to the research, authorship, and/or publication of this article.
Funding
The author(s) received no financial support for the research, authorship, and/or publication of this article.
Informed consent
All participants signed informed consent, and the study was approved by the Swedish Ethical Review Authority (Dnr: 2019-02553).