
Abstract
How to deal with multi-modality data from different types of devices is a challenging issue for accurate recognition of human activities in a smart environment. In this paper, we propose a multimodal fusion enabled ensemble approach. Firstly, useful features collected from Bluetooth beacons, binary sensors, and smart floor are extracted and presented by fuzzy logic based-method with variable-size temporal windows. Secondly, a group of support vector machine classifiers are used to perform the classification task. Finally, a weighted ensemble method is used to obtain the final prediction. Especially, by applying the geometric framework, we are able to obtain the optimal weights for the ensemble. The proposed approach is evaluated on the UJAmI dataset. The experimental results demonstrate the efficacy and robustness of the proposed method.
Keywords
Introduction
Human Activity Recognition (HAR) systems have grown increasingly important as a part of the daily life in a smart home/environment. In many countries, there is increasing amount of elderly people. To monitor human Activities of Daily Living (ADL), especially regarding cognitive or other impairments experienced by disabled individuals and the elderly living alone, is very helpful for providing timely health-related services to them.1,2 It is even more demanding when the COVID-19 pandemic is spreading around the world, many people have to live in isolation. Home monitoring can be used as a possible solution to provide information on behavioral deviations and cognitive assistance.3,4
Up to date, three types of sensors have been used to monitor ADL: vision-based,5,6 non-invasive sensor-based,7–9 and hybrid methods. 10 Vision-based approaches depend on video cameras or depth cameras for accurate activity recognition.11,12 Non-invasive sensor-based approaches utilize monitoring data from non-vision-based devices such as binary sensors 13 or IMU sensors.14,15 Hybrid approaches combine vision-based and non-invasive sensors for recognizing human ADL and behavior. 10 In many situations, non-invasive sensors are preferred due to their advantages such as easy installation and maintenance, privacy protection, low storage requirements, and fast data transmission and processing. 16 Therefore, Human Activity Recognition (HAR) systems that recognize ADL from non-invasive sensor-based monitoring data are now an active topic of research.
This piece of work focuses on non-invasive sensor-based monitoring to predict human activities in a smart environment. The UJAMI dataset is used17,18 and it was collected in the UJAmI Smart Lab at the University of Jaén (Spain). Multi-modal data were collected from three types of sources including binary sensors, Bluetooth Low Energy (BLE) beacons, and smart floors.
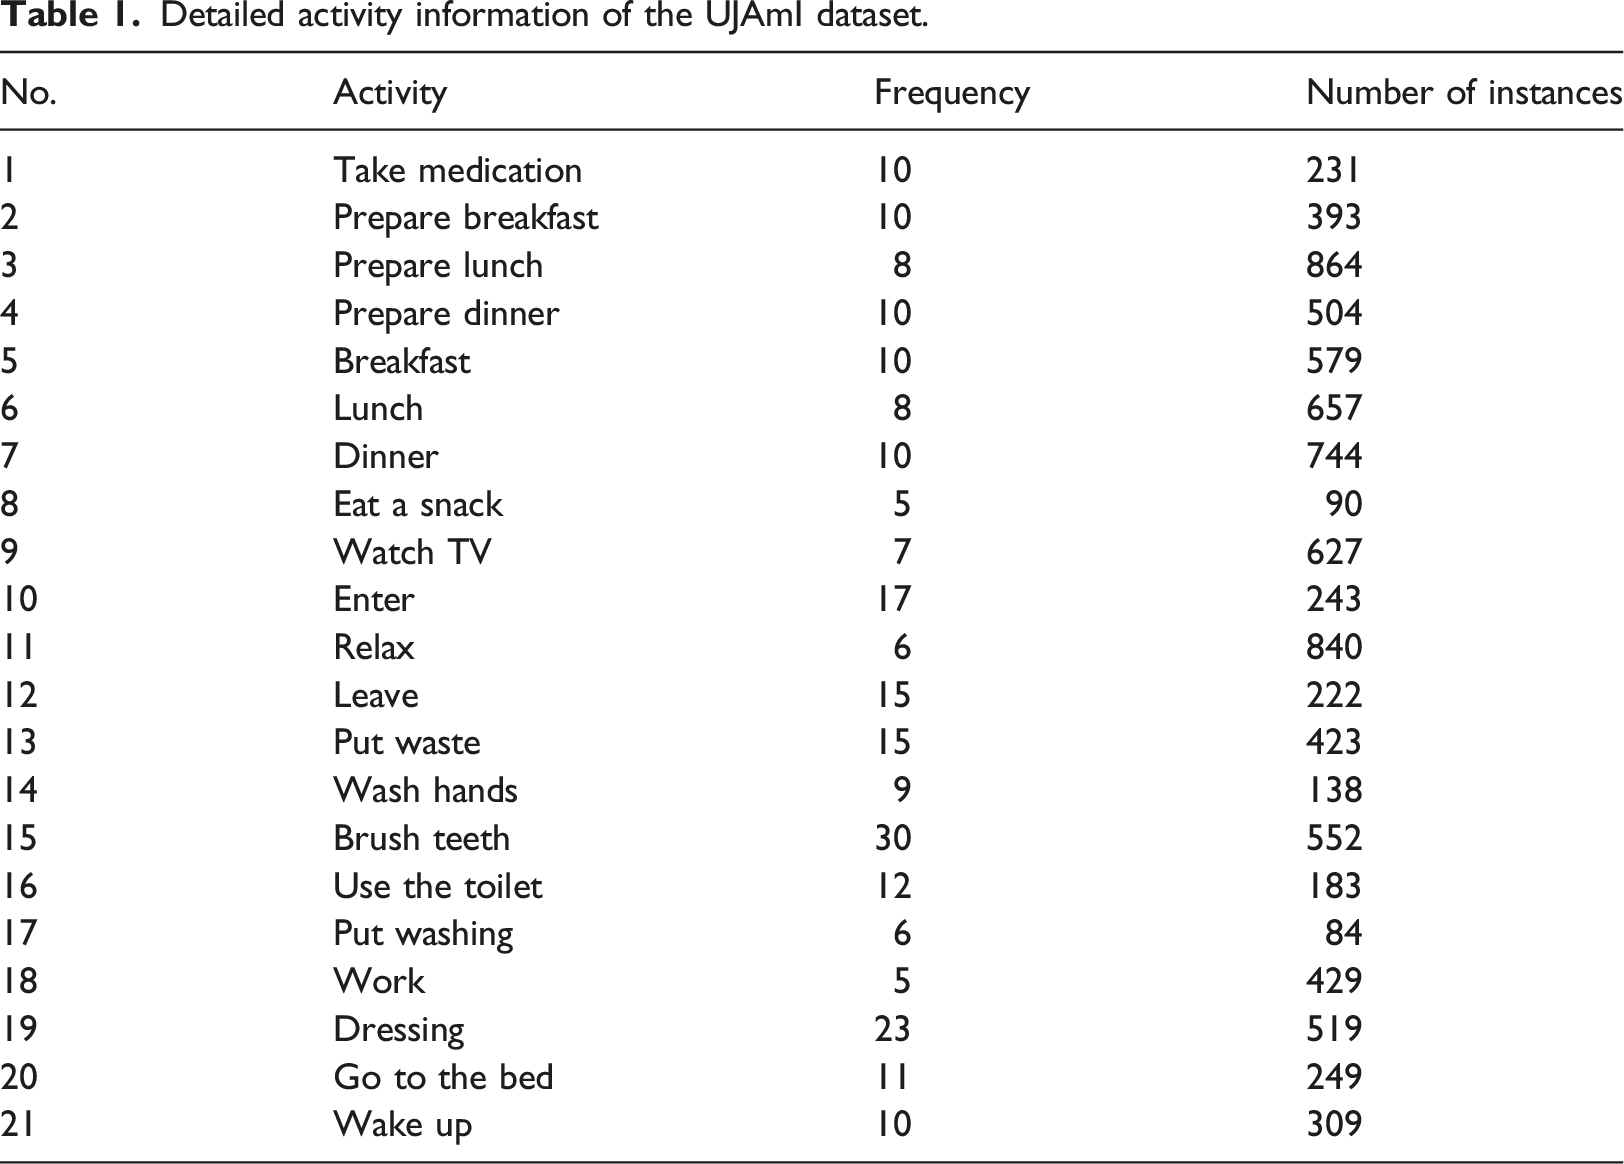
It is a challenging task to deal with the UJAMI dataset for better human activity recognition. First, the number of classes in the dataset is relatively large. Twenty-four quotidian activities were performed by the inhabitant over a 10-day period. Second, some low-quality and noisy data were collected from those sensors. For example, there were missing values from binary sensors that were expected to activate during certain activities. Third, many existing methods of feature representation focus on binary sensors, whereas very few methods are able to deal with data from Bluetooth beacons and smart floors.
To deal with these challenges, we take quite a few measures at different levels. For the extracted data, fuzzy logic-based feature representation is defined on variable-size temporal windows to help represent temporal connections between activities. In the data set, there are quite a few such activities: preparing breakfast and breakfast, preparing lunch and lunch, preparing dinner and dinner, breakfast, lunch, and dinner, go to bed and wake up, and so on.
The second measure is to generate a group of strong and diversified base classifiers. To make base classifiers stronger, we use feature-level fusion. Using all available features, rather than a subset of them, is more likely to obtain stronger classifiers. Support vector machine is chosen for the realization of all base classifiers because its superior performance. Sampling with replacement is used to make the generated base classifiers with higher diversity.
Finally, based on those base classifiers, the third strategy is to use an ensemble to combine their predictions. Under a geometric framework, optimal weights are calculated for the classifier ensemble to achieve the best possible results. Our experiment with the UJAMI dataset shows that the above strategies combined are effective for improving classification performance.
In short, the major contributions of our research are as follows: (1) A multimodal fusion enabled ensemble is proposed. At feature level, a few fuzzy logic based-methods with variable-size temporal windows are used to extract various features from multi-modular data. At base-classifier level, a group of support vector machines are trained with bagging for more diversity. At combination level, a weighted ensemble method is proposed with the optimal weights. (2) The optimality of the weighted solution is discussed. (3) The proposed method works well on the UJAMI dataset. It demonstrates that the method has good potential for HAR tasks with multiple modular data.
The remainder of this paper is organized as follows. Related Work section discusses related work. The proposed approach is presented in Methodology section. Experimental Setup section presents the settings of the experiment for performance evaluation on the UJAmI dataset. The results are discussed in Results and Discussion section. Conclusion section concludes the paper.
Related work
Many studies on human activity recognition have centered on one type of sensors such as binary sensors, BLE beacons, and so on. Temporal window definition 19 and feature representation are the main topics in this process. Banos et al. found that using windows with fixed size is a good temporal division for evaluating daily activities based on binary-sensor data. Also using temporal windows with fixed size, Ordóñez et al. applies Artificial Neural Network and Support Vector Machines within a framework of Hidden Markov Model to perform activity recognition. 20 Hoffmann et al. calculated human body positions by using fixed-size temporal windows.21,22 Mean movement distance distribution was used as features to recognize persons with a high versus low risk of falling in [21]; trajectory localization updates were used as features to recognize the movement patterns of humans and cats in [22]. A few studies23,24 used multiple and/or variable-size windows to represent long-term and short-term dependence between activities. Espinillal et al. proposed three temporal sub-windows in the sensor data stream, where temporal sub-windows keep a partial order from the end time of the activity in the short term, medium term, and long term. 23 Their results suggest that multiple temporal windows outperform a single temporal window in terms of accuracy. Medina et al. proposed using multiple windows to express long- and short-term binary-senor activation information.24,25 Fuzzy features were used to represent binary sensors in [24], and aggregated spatial and temporal features were used in [25].
Various machine learning methods have been used to recognize human activities. Neural networks, support vector machines, and decision trees are commonly used as base classifiers. 26 Bagging, boosting, and stacking are commonly used ensemble learning methods. It is observable that in almost all the cases an ensemble is more effective than an individual classifier-based approach. 27 In the following we review several ensemble approaches in the domain of HAR. Peng et al. 28 proposed a classifier-level fusion method to recognize complex activities by using acceleration, vital sign, and location data. In their study, base classifiers were built on different-context data separately. Muzammala et al. proposed a data fusion approach for medical data obtained from wireless body sensor networks in a fog computing environment. 29 In their solution, the daily activity data was first fused together, and then a novel kernel random forest ensemble classifier was developed for heart disease prediction. Garcia-Ceja et al. proposed a multi-view ensemble method to fuse the data collected from sound and accelerometer sensors. 30 Their base models for each of the sensor views were combined via a stacking framework. Irvine et al. 31 proposed a homogeneous ensemble with four multi-layer perceptions to investigate the solution of predictive conflicts between base models.
In this study, we propose a multimodal fusion enabled ensemble approach. A combination of methods including variable-sized fuzzy windows, fusing data from all three types of devices, weighted ensemble of a group of SVM classifiers, were used in this study. Experiments demonstrated that the proposed approach has very good performance compared to other methods.
Methodology
This section describes the detailed procedures of our approach. The whole framework, as shown in Figure 1, is mainly composed of two basic modules, namely, the feature extraction and fusion module and the SVM-based ensemble classification module. Three different modal data were collected from a middleware platform, which was deployed for monitoring and collecting the information generated by three types of devices in the UJAmI Smart Lab. The original data description is detailed in [18]. In the first module, features are extracted and presented by the fuzzy logic-based methods and then fused together. In the second module, multiple SVM classifiers were built on the data output from the first module. Based on the geometric framework, optimal weights are calculated and applied for the ensemble. Framework of the proposed method for activity recognition.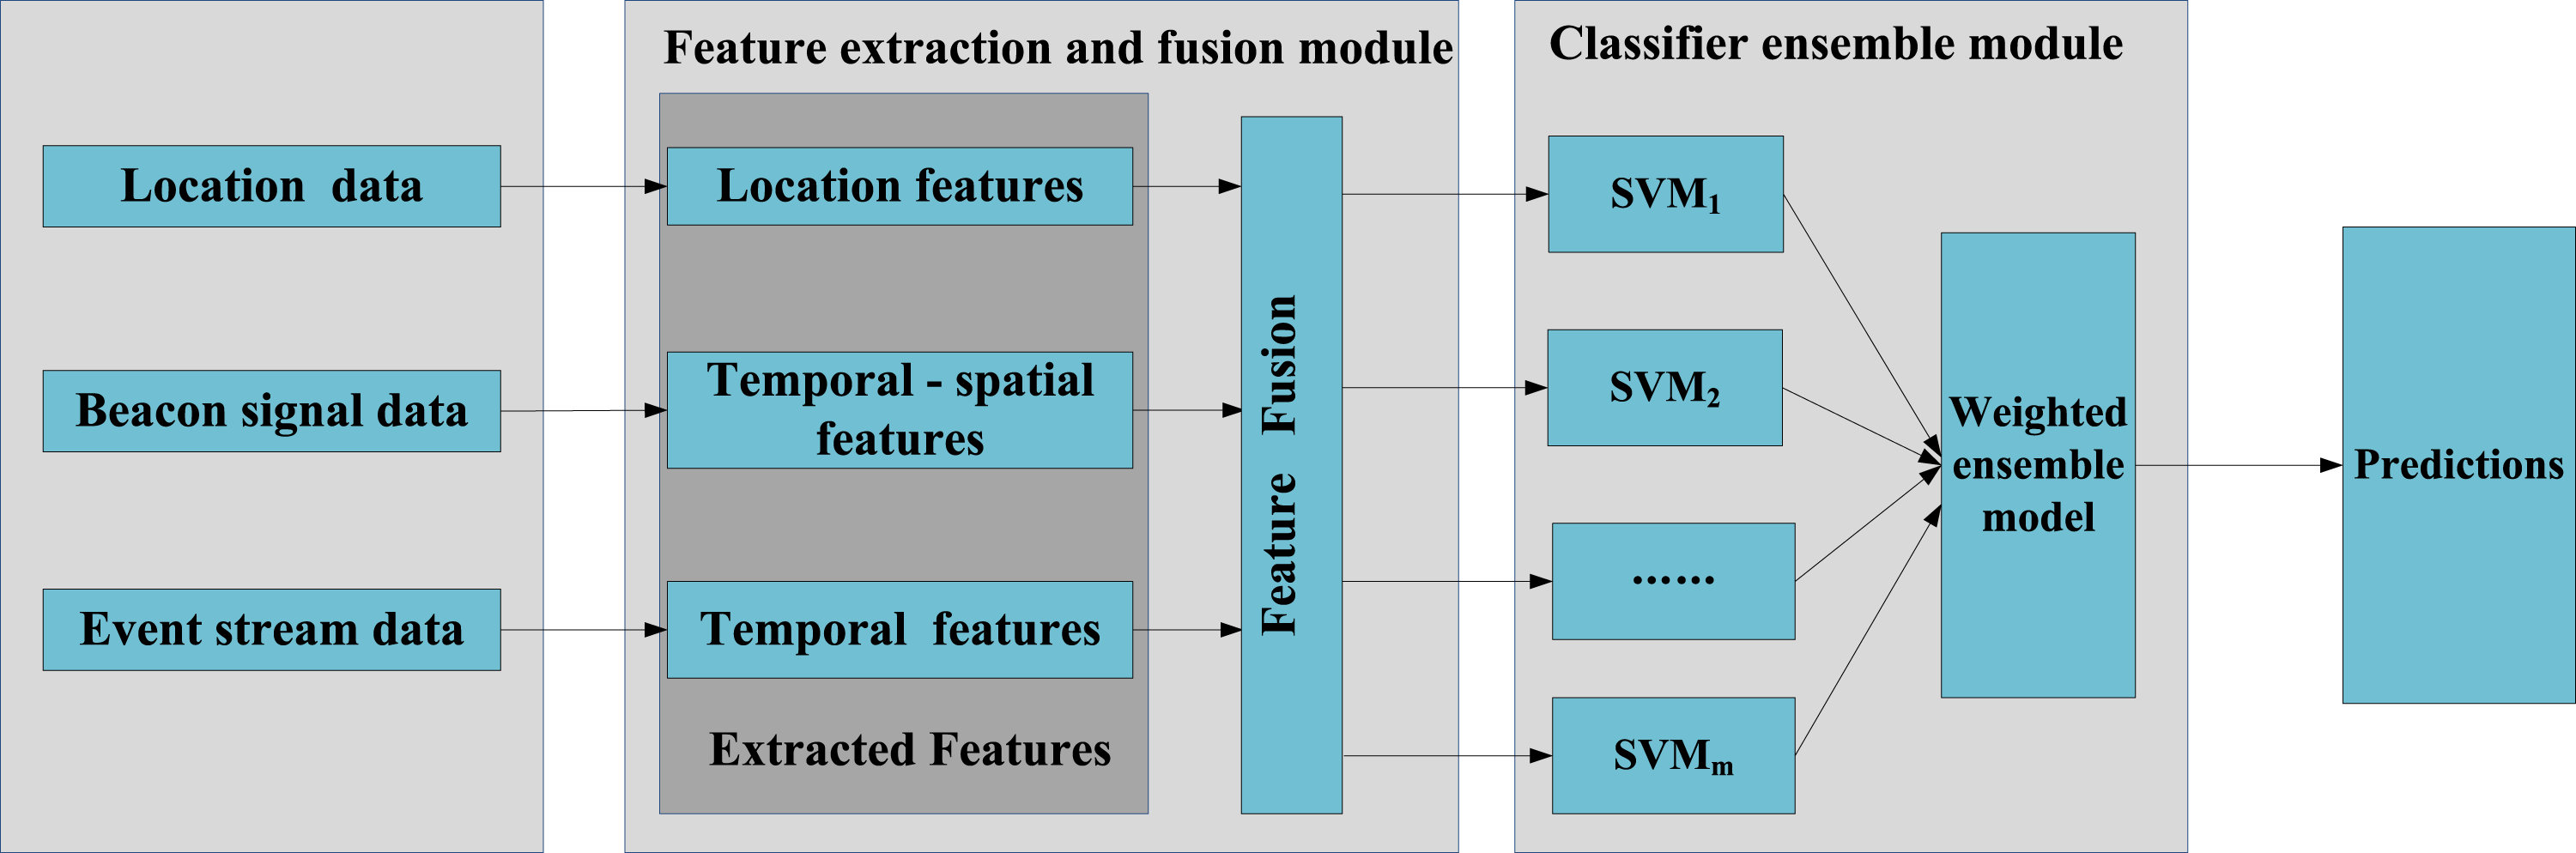
Feature representation
To provide proper feature representation, the timeline is segmented into equal intervals. Each instance 1. Feature representation for binary sensors
The set of binary sensors is represented by

To represent the activity performed in the interval
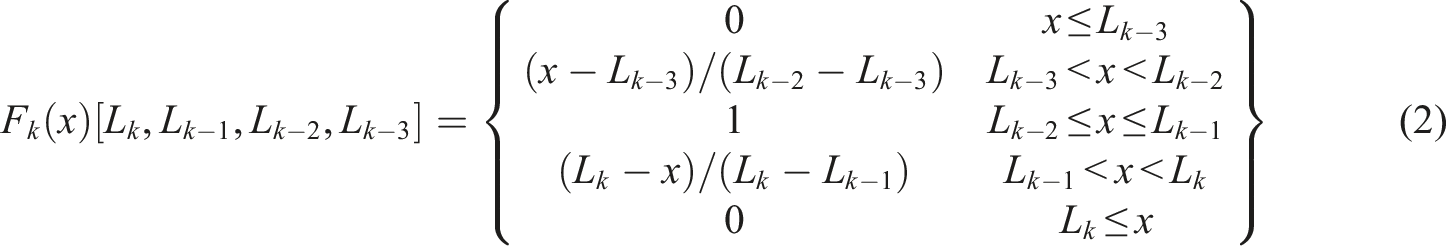
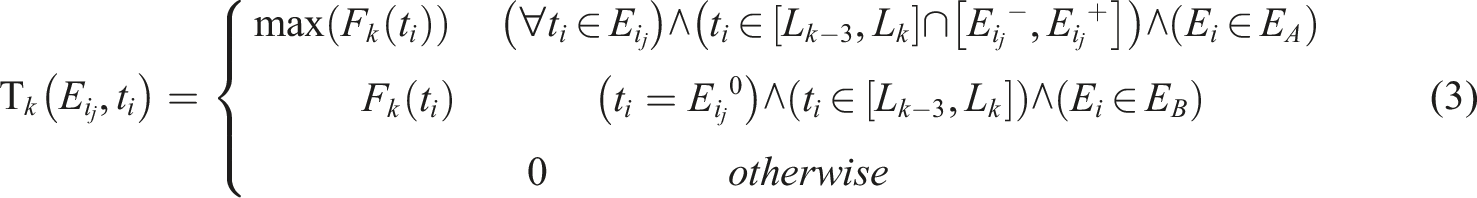
The final activation degree of a binary sensor E
i
in temporal window

Figure 2 shows an example of the calculation of the activation degree for binary sensor E
i
within the fuzzy temporal window T
k
. The top part of the figure shows that the activation degree is 0.7 for the binary activation Example of the calculation of the activation degree for binary sensor 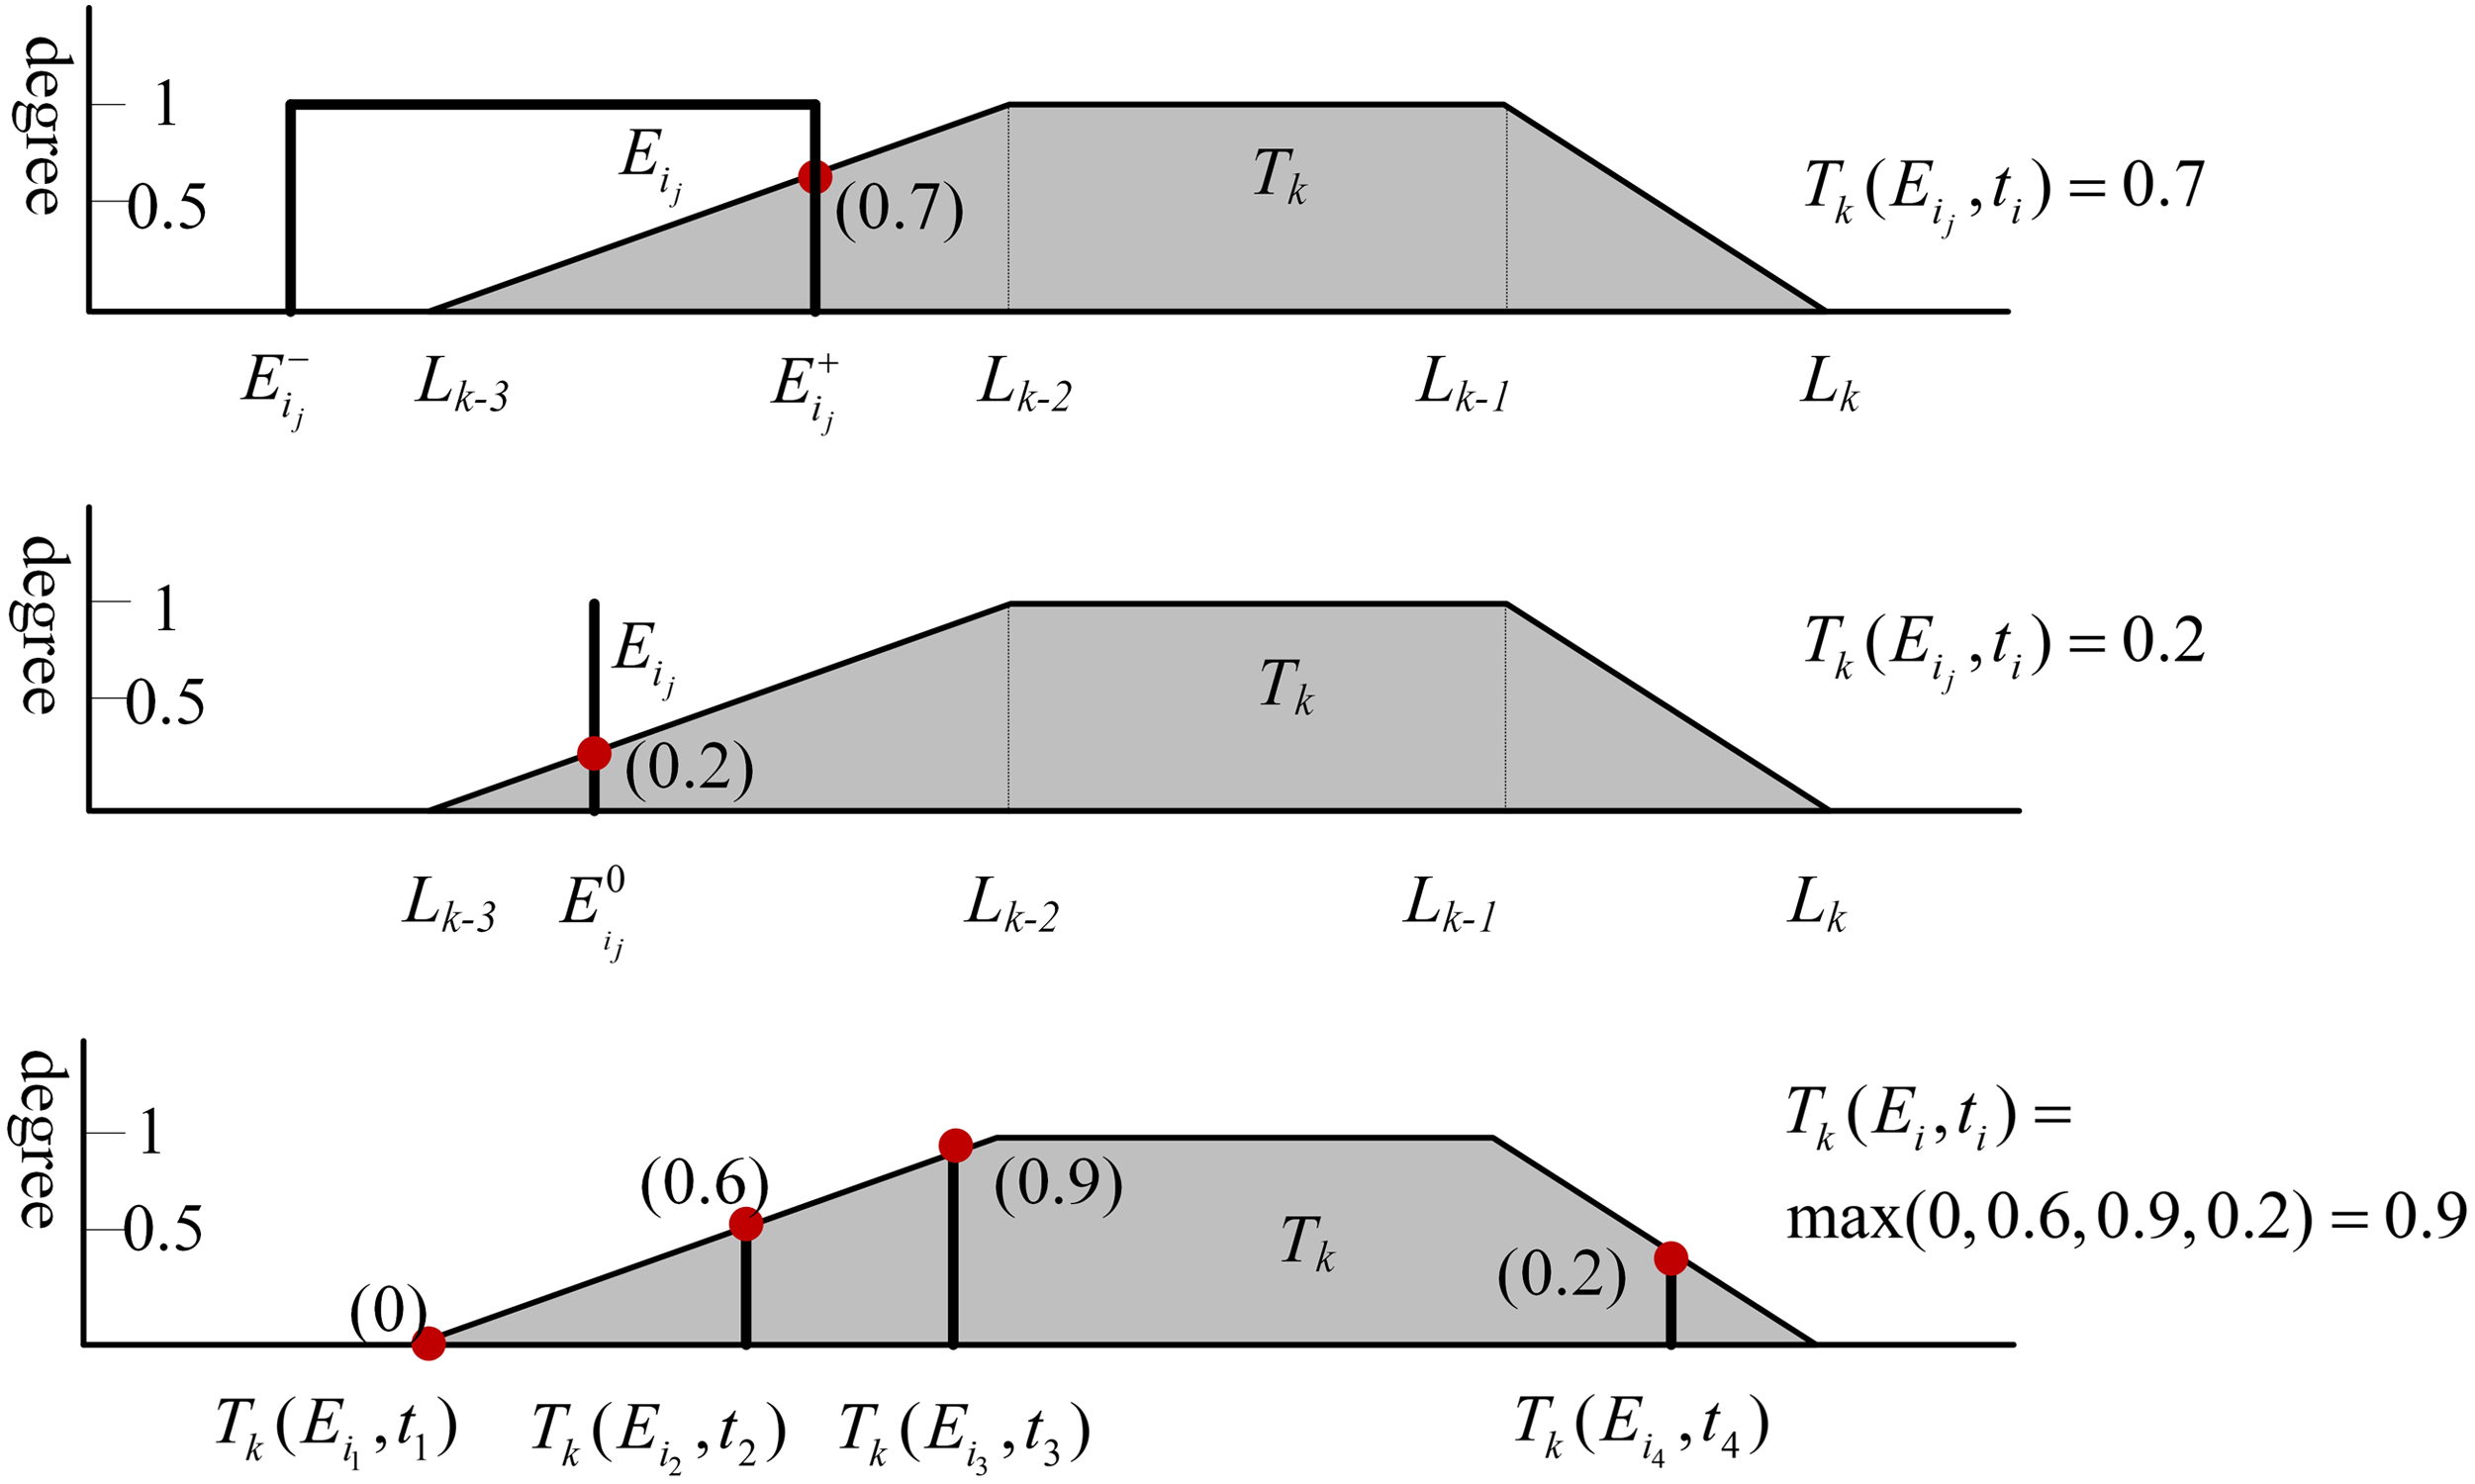
Within a given FTW 2. Feature representation for BLE beacons
The set of BLE beacons is represented by

In this work, we take the beacon signals as input to extract temporal and spatial features. On the one hand, the timestamp can be used to extract the relationship among activities with multi fuzzy temporal windows. On the other hand, considering the distance between wearable devices and beacons that determines the RSSI value, spatial features can be extracted with the RSSI values to represent the distance between inhabitant and beacons.
The temporal feature of the BLE beacons signals is also extracted by using fuzzy temporal windows. Within the given FTW

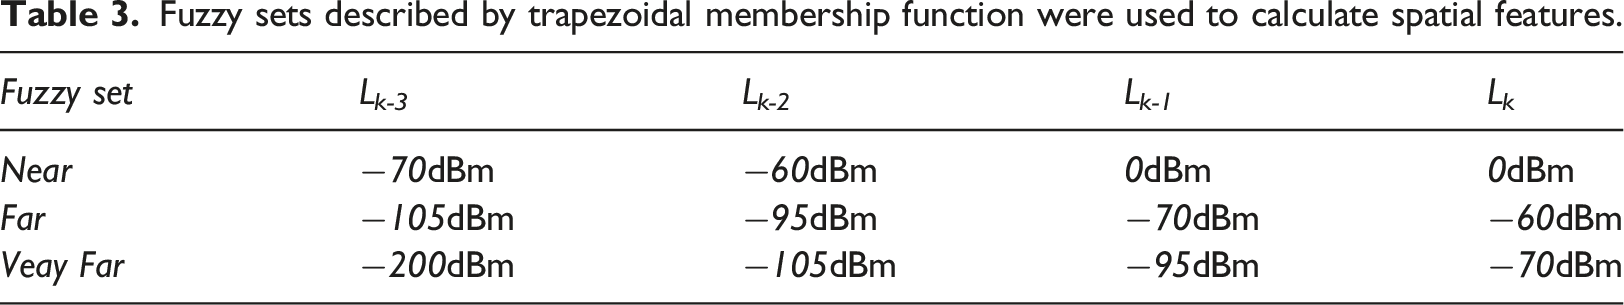
The spatial features describe the distance degree between the inhabitant and the BLE beacon. In our work, three fuzzy sets Example of spatial feature calculation process for beacon signal 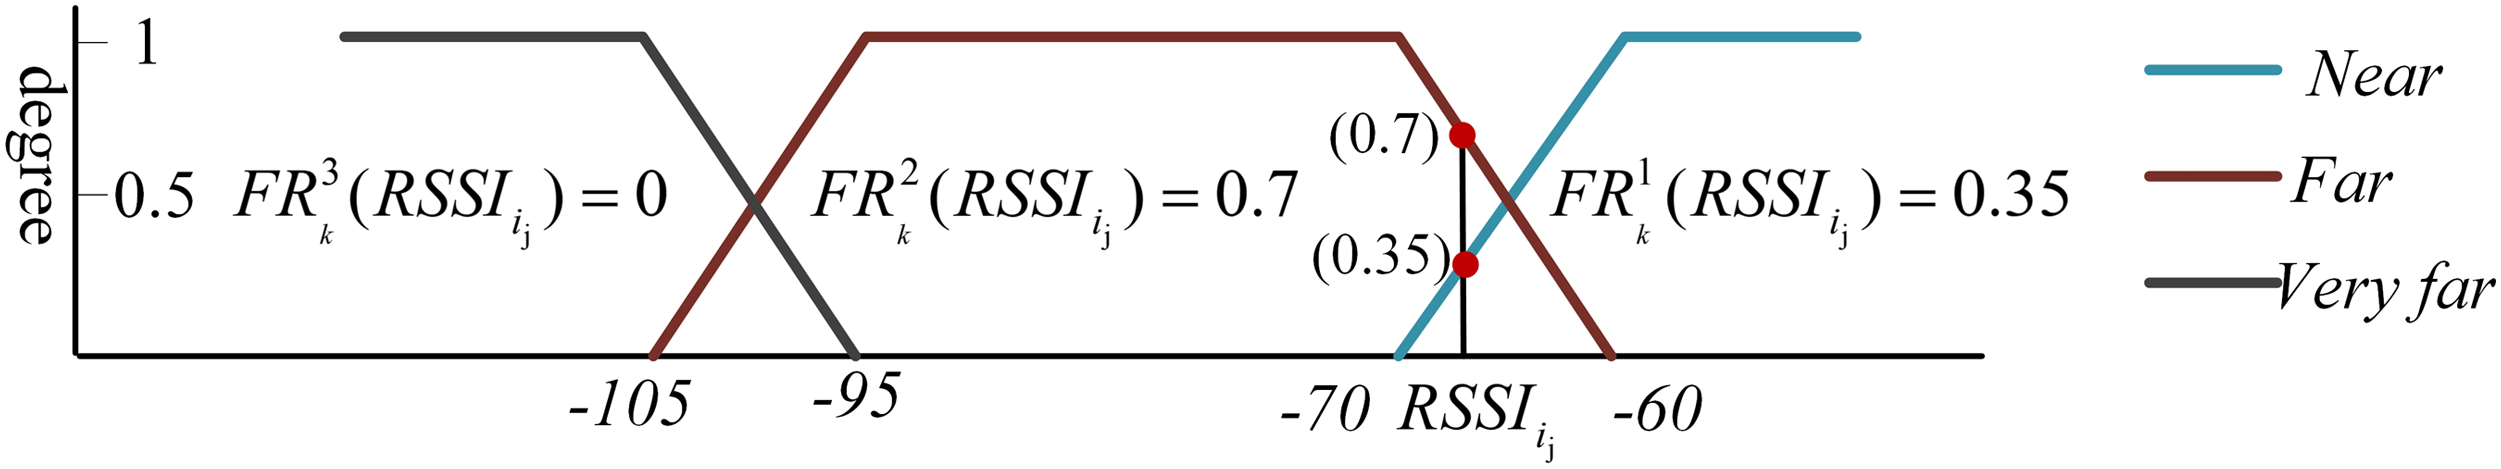
In Figure 3, the fuzzy set (“Near”) represents the measurements of Bluetooth signal power close to −60 dBm and is associated with distances close to 0 m away from the beacon. The fuzzy set (“Far”) represents the signals less powerful, until around −100 dBm and is associated with closer distances. The fuzzy set (“Very far”) represents the signal powerful less −100 dBm and is associated with long distances. Figure 3 describes the RSSI value of the beacon signal
With the spatial and temporal features, the aggregation degree of beacon

Figure 4 shows an example of the feature aggregation process with the “Far” membership function within the FTW Example of feature aggregation process with “Far” membership function in FTW 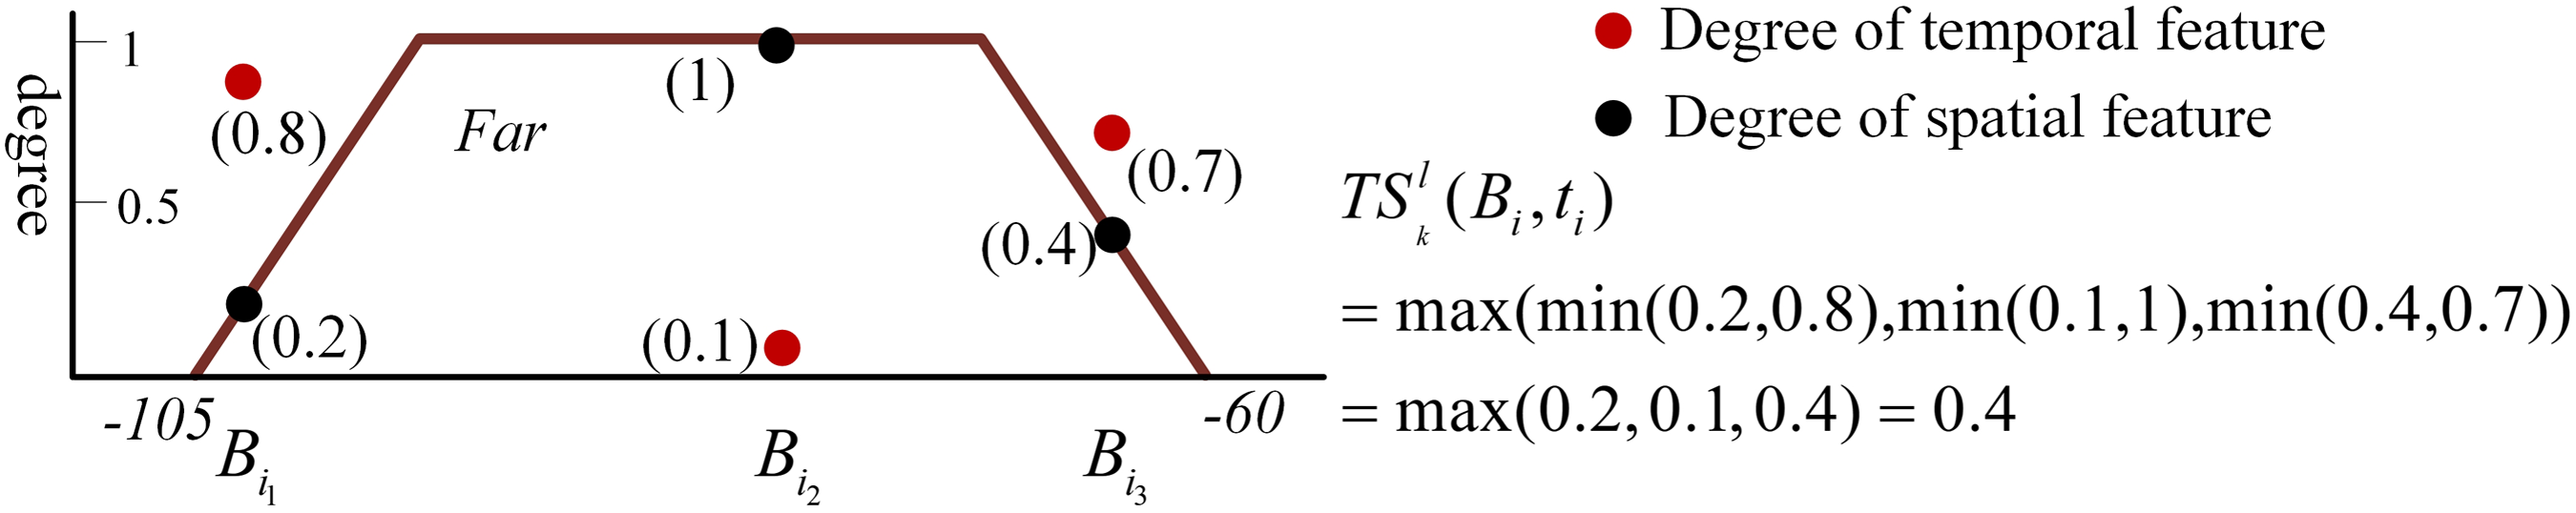
The spatial-temporal feature is formed by the sequence of aggregated degrees within the FTW T
k
for each BLE beacon. We also used multiple FTWs to collect the activity dependency information for each BLE beacon. The size of the spatial-temporal feature vector is 3×|T|×|S|, where |T| is the number of FTWs and |B| the number of beacons. 3. Feature representation for the floor sensor
Here, the inhabitant’s location information can be extracted from the smart floor data to represent the activity with the fixed-window method. The indoor location information is estimated by means of distance measured in a given temporal window
Within a given interval


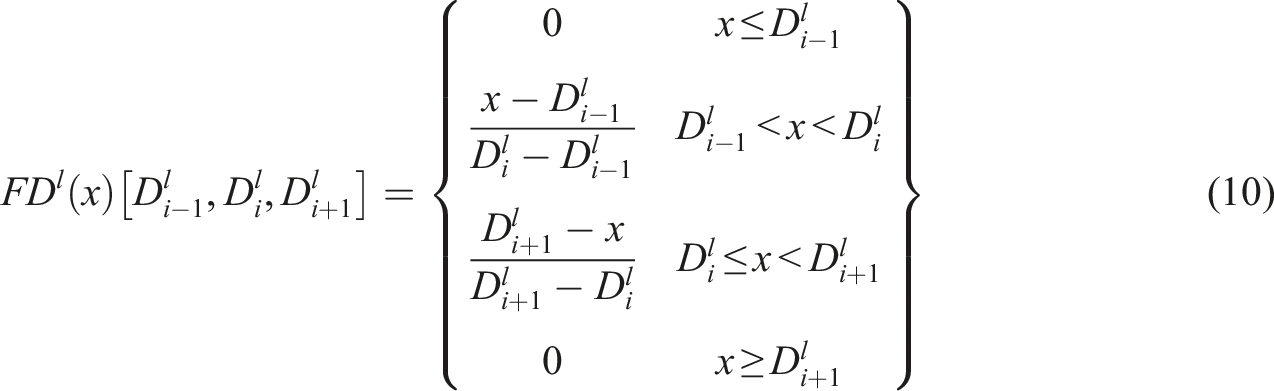
Figure 5 shows an example of the feature vector (0.4, 0.6, 0, 0, 0, 0) calculated to describe the distance between the inhabitant and the given BLE beacon or binary sensor within the interval Example of feature representation for location information. The distance between the inhabitant and the given BLE beacon or binary sensor within the interval 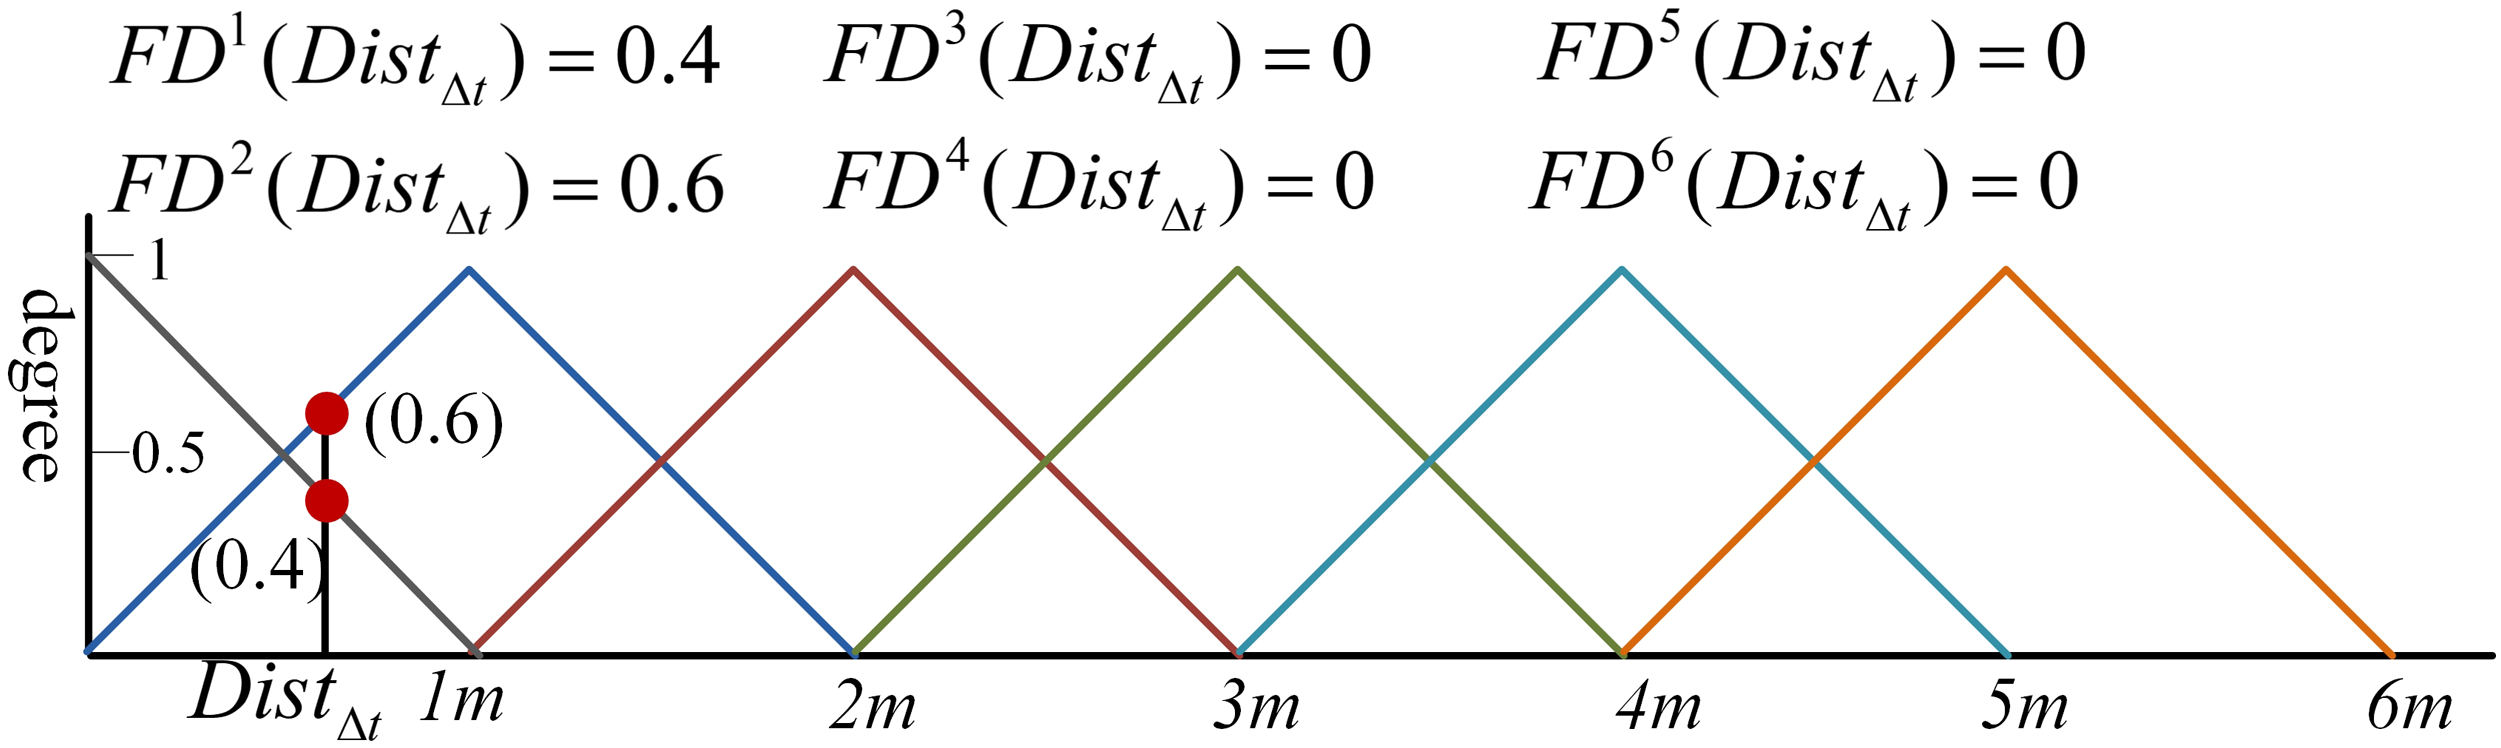
The size of the distance feature vector is 6 ×|S|, where |S| equals to the number of binary sensors and BLE beacons.
In our work, all three different types of features are combined at feature-level for classification. Then they are used by all base classifiers and the ensemble.
The geometric-framework-based ensemble
In this paper, a geometric framework describing the weighted ensemble approach is proposed to classify human activities in real time. Wu and Crestani 32 first proposed a geometric framework for data fusion in the context of information retrieval. Bonab and Can 33,34 extended this framework to online multi-label data stream classification tasks. They used a dynamic weighting ensemble approach to achieve the optimal weights for all base classifiers at the data chunk level or sliding window level. Wu and Ding extend the geometric-framework-based linear ensemble method to the dataset level. 35
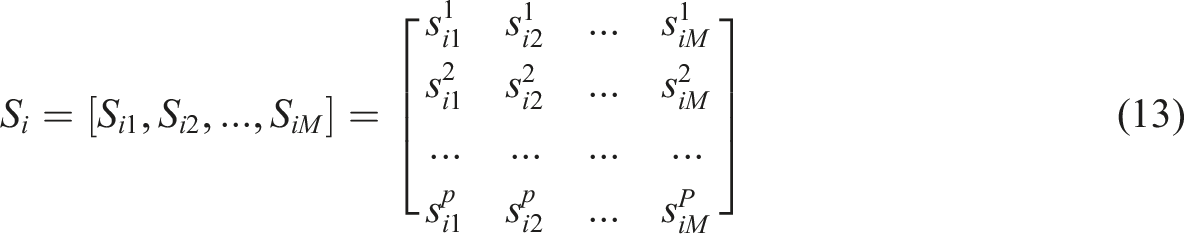
In this paper, we used a p-dimensional space to operate the optimal weighted ensemble method. For a given instance
For a given instance
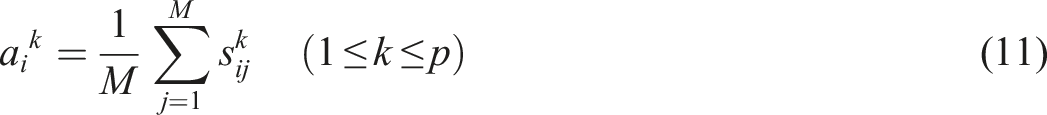
The optimal weighted ensemble (OWE) approach serves to reveal the optimum weights We define
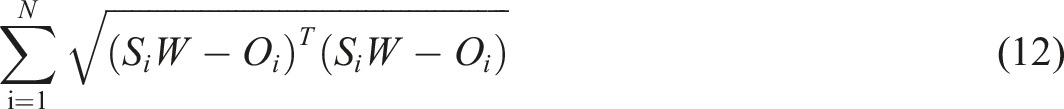
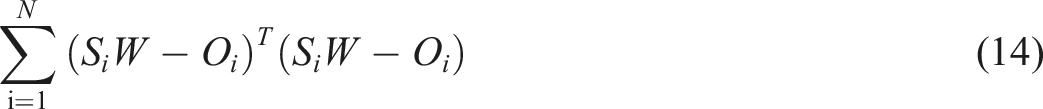
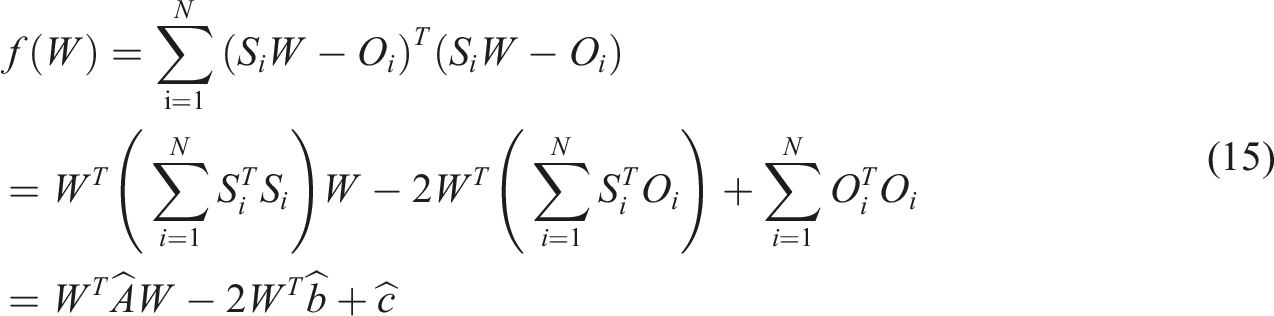

If Furthermore, to get nonnegative weights, we can use quadratic programming. In Theorem 1, If


Experimental setup
Detailed activity information of the UJAmI dataset.
Accuracy (Acc), Precision (P), Recall (R), and F (
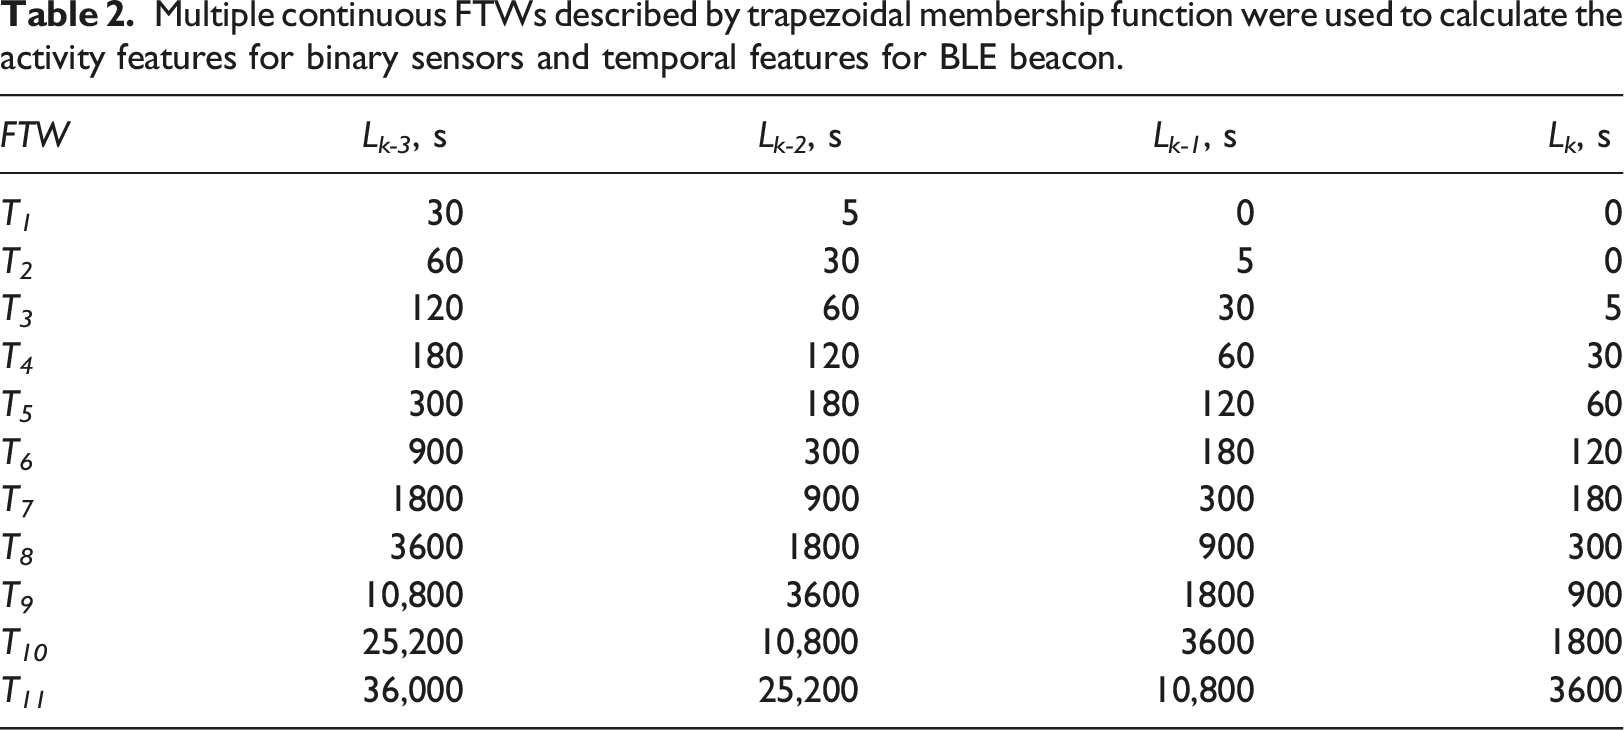
Multiple continuous FTWs described by trapezoidal membership function were used to calculate the activity features for binary sensors and temporal features for BLE beacon.
Fuzzy sets described by trapezoidal membership function were used to calculate spatial features.
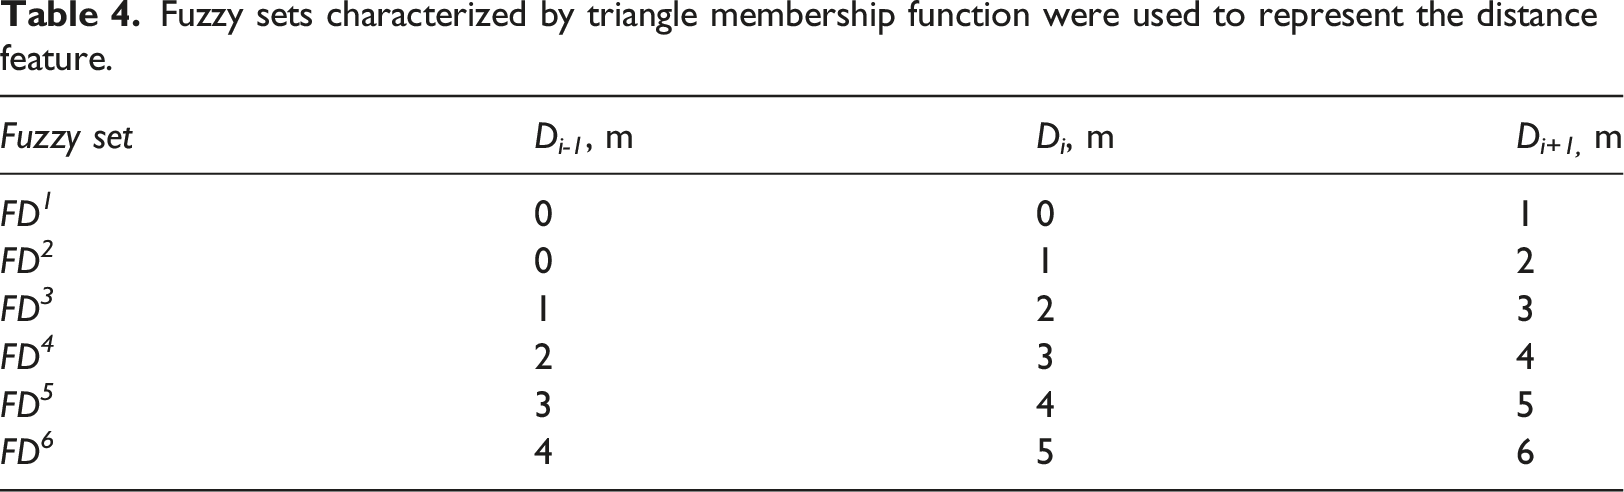
Fuzzy sets characterized by triangle membership function were used to represent the distance feature.
The feature vector obtained from the binary sensor data is 11×30, where 30 is the number of binary sensors and 11 the number of FTWs. The feature vector extracted from beacon signals is 15×11×3, where 15 is the number of BLE beacons, 11 the number of FTWs, and 3 the number of fuzzy sets. The feature vector extracted from the smart floor is 45×6 in size; there are 45 binary sensors and BLE beacons with six fuzzy sets. The feature sets obtained from different sensors are combined and the final feature vector has 1095 elements.
The models were validated by using a “leave 1 day out” approach, in which we retained one full day of information for testing and used the remaining as training data. The process was repeated for each day and the performance was averaged accordingly. We select the SVM model with a linear kernel to build base classifiers. On the one hand, SVM model is suitable for high-dimensional data to produce accurate classifiers. On the other hand, SVM model is sensitive to the training data and can be combined with sampling technology to produce a group of classifiers with healthy diversity. Previous theoretical and experimental studies have revealed that the performance of a classifier ensemble is determined by both accuracy and diversity among individual classifiers in the ensemble. SVM is a good option for this task. Also, some different types of kernels are available for SVM. Among them, SVM with a linear kernel is more efficient than the others. Therefore, we go with it. 30 base classifiers were generated. Rather than using the whole training data set, each of them took a certain percentage (60%) of the instances with replacement on the training data. By doing this, it enables us to obtain more diverse base classifiers. All the algorithms were implemented using the WEKA machine-learning suite.
The proposed method comprises two parts: support vector machines and weighted ensemble. Assume that l is the number of instances in the training process, D L the dimension of the input data, N S the number of support vectors, N M the number of support vector machines trained, N C the number of class labels. Then for the training, the upper bound of each support vector machine has the time complexity of O(N C D L l 2 ). 36 The time complexity of the weighted ensemble is O(lD L N M 2 + N M 3 ). 37 Therefore, the total time complexity is O(N M N C D L l 2 + lD L N M 2 + N M 3 ). For the testing of a support vector machine, its time complexity is O(N C D L N S ), and it is O(N C N M ) for linear combination. Therefore, the total testing complexity is O(N C D L N S + N C N M ).
Results and discussion
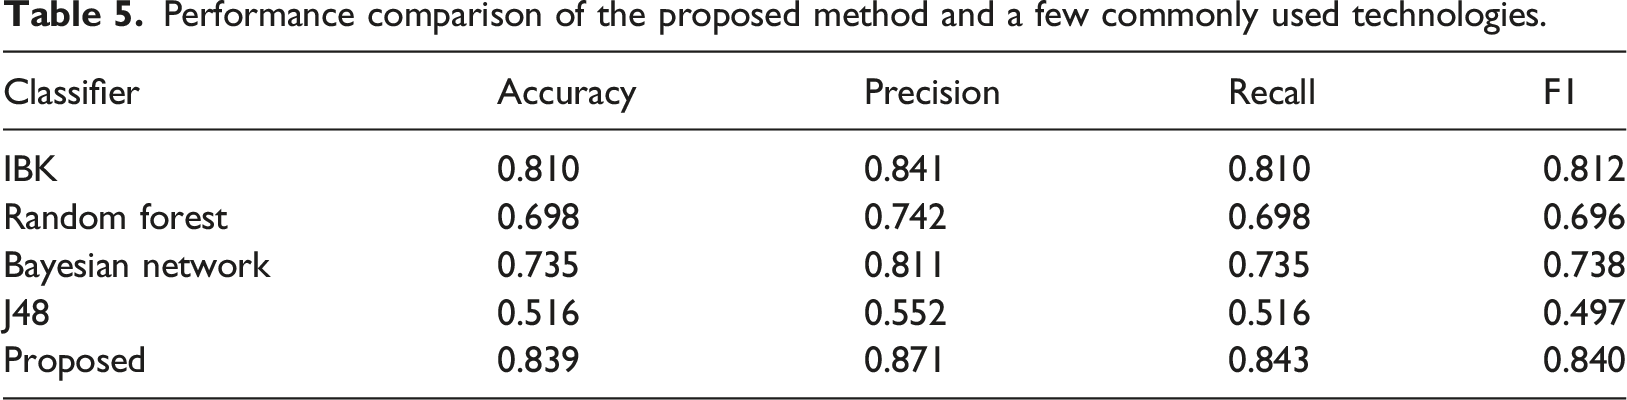
Performance comparison of the proposed method and a few commonly used technologies.
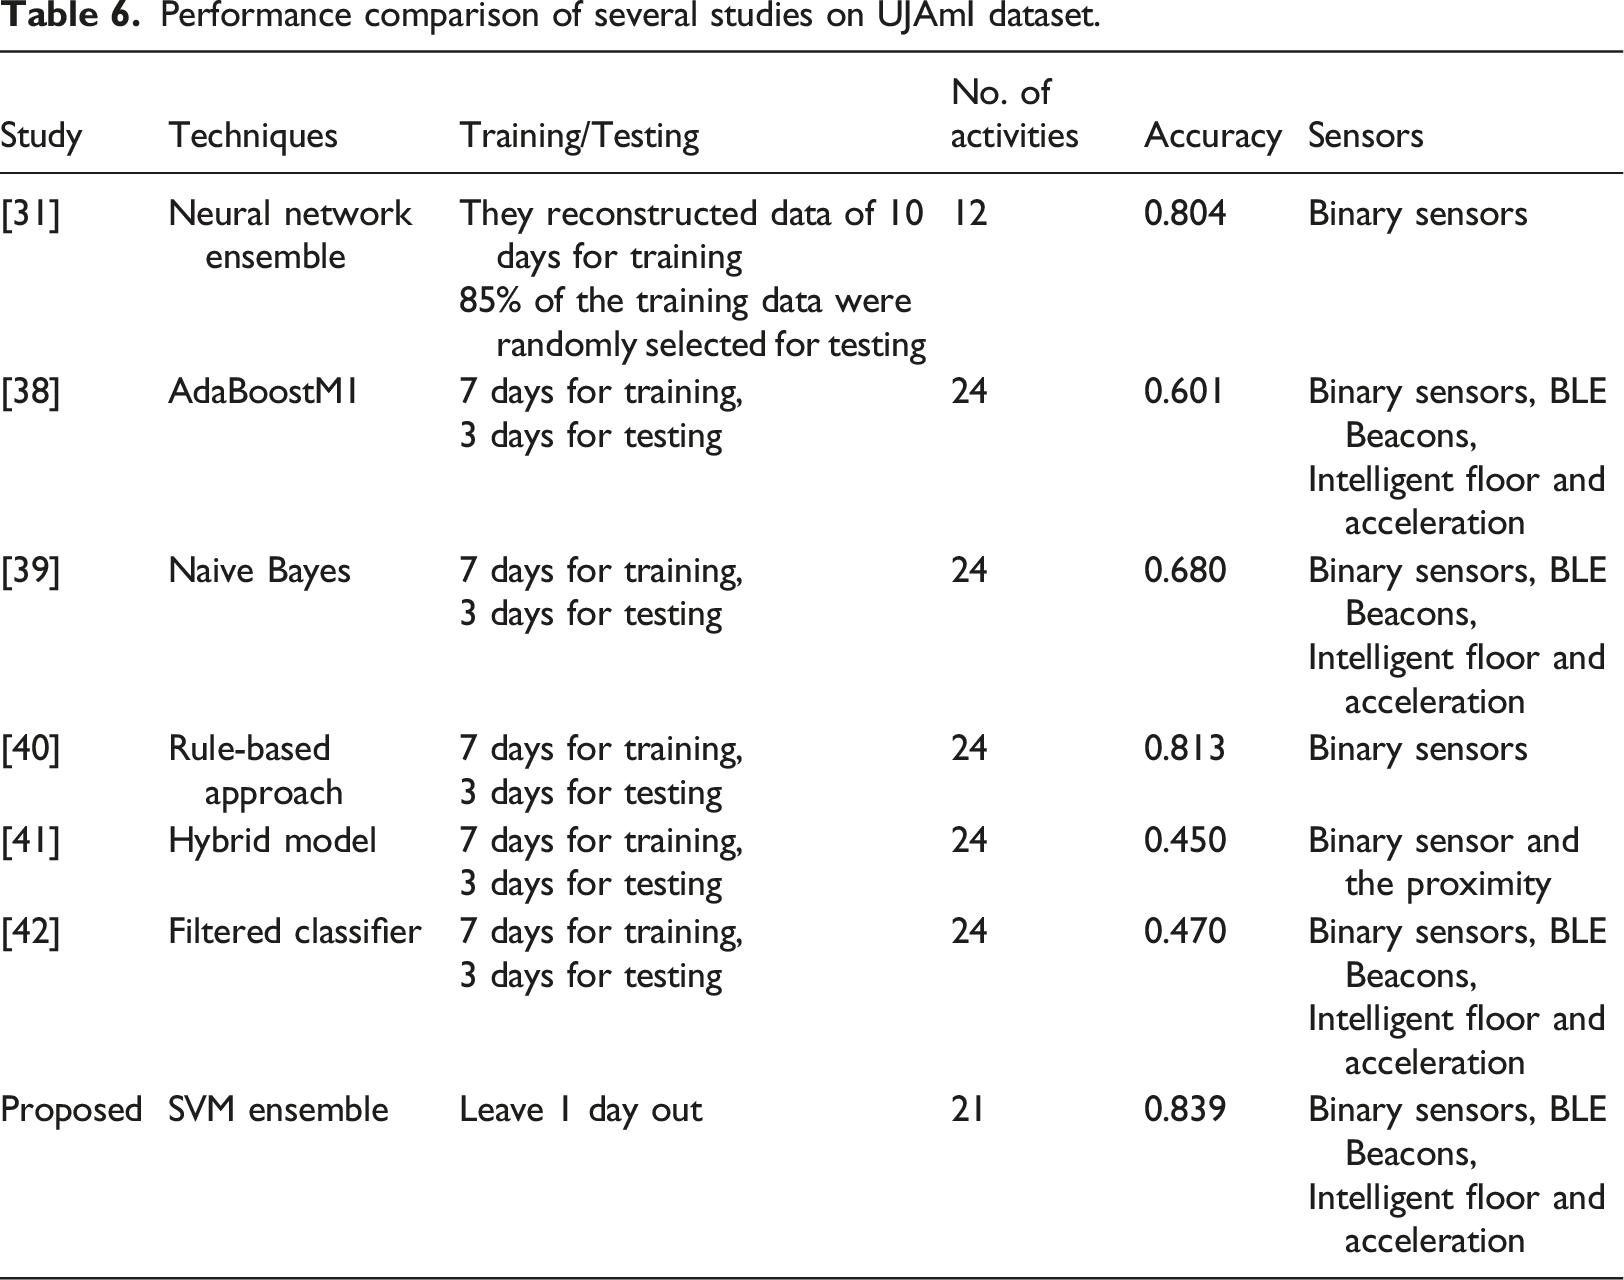
Performance comparison of several studies on UJAmI dataset.
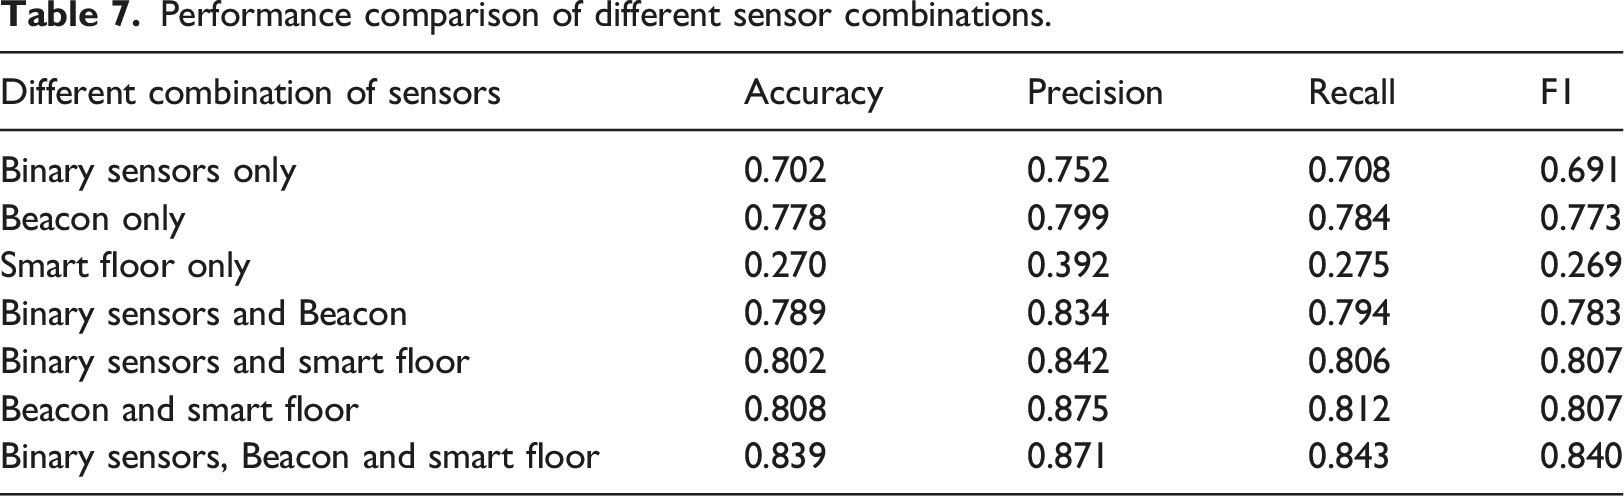
Performance comparison of different sensor combinations.
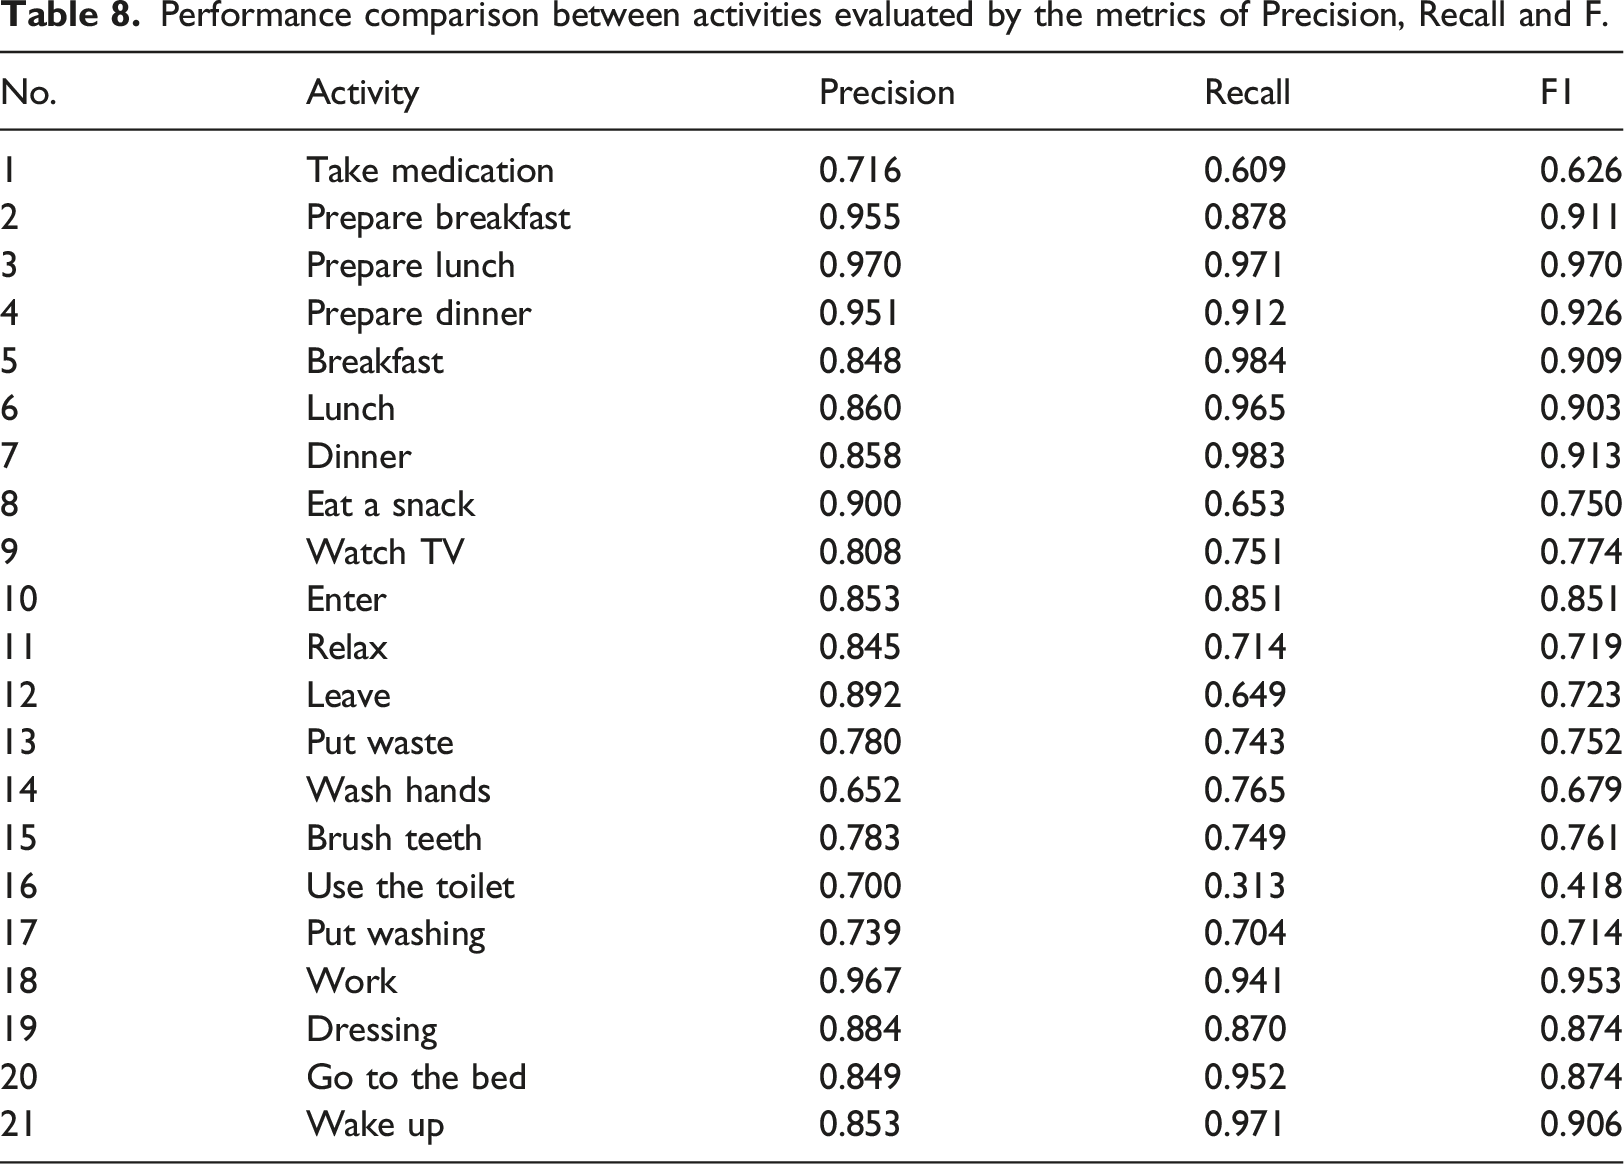
Performance comparison between activities evaluated by the metrics of Precision, Recall and F.
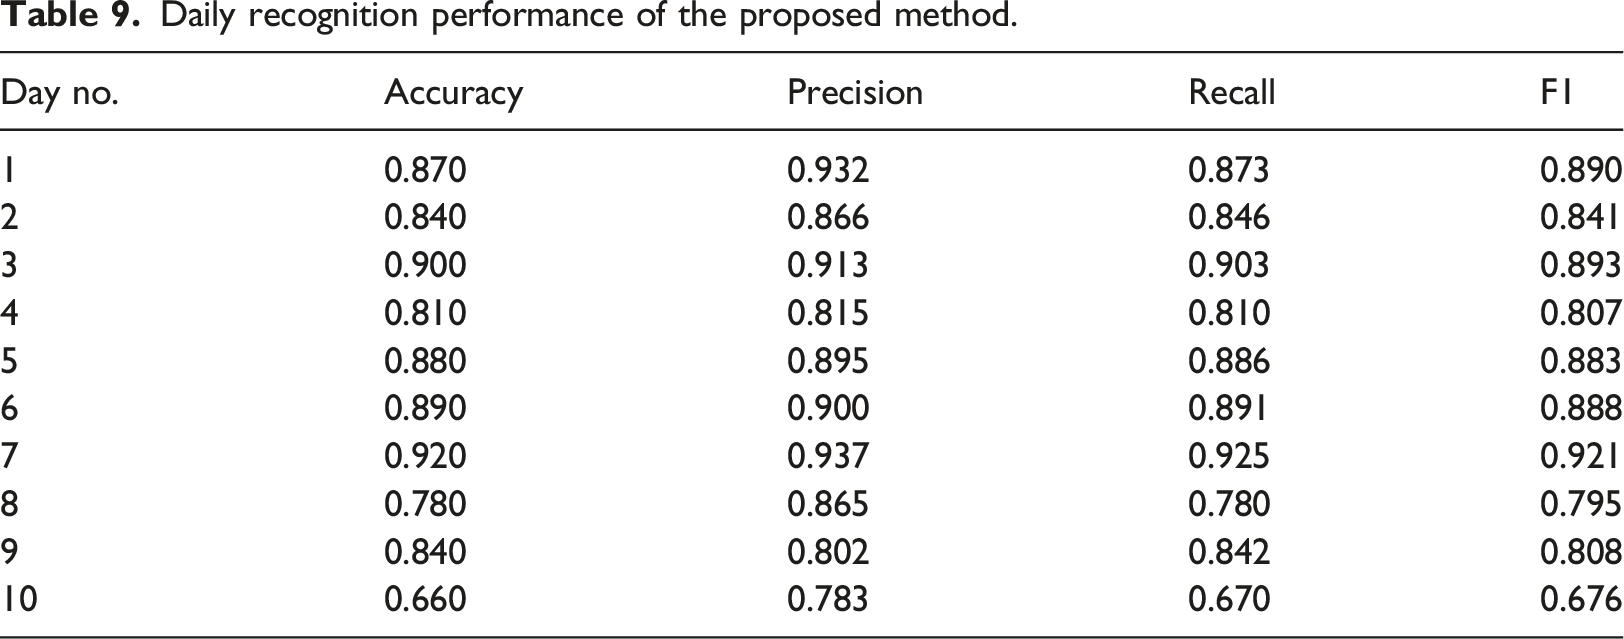
Daily recognition performance of the proposed method.
Conclusion
In this paper we have presented a method for fusing three types of sensor data for HAR in smart environments. Fuzzy logic-based methods were used to extract the features for those sensors involved. A geometric framework was used to describe ensemble learning and helped to calculate the optimal weights. Evaluated with the UJAmI data set, the results show that the proposed method is very competitive compared with other methods. We also found that combining multiple data sources enhanced classification performance compared to using only one or two sources of information.
There are problems which emerged during this work that have yet to be resolved. First, it is necessary to determine how to represent activities without fixed temporal dependency (e.g., using the toilet and putting out waste). If these activities can be well represented, the recognition performance of the proposed method would increase. It also may be possible to integrate other modal sensors with the proposed fusion method. Acceleration data was also collected in the UJAmI Smart Lab by the inhabitant’s Android smart watch. As our future work, we would investigate how to combine it with the three types of data used in this study to recognize human activities.
Footnotes
Declaration of conflicting interests
The author(s) declared no potential conflicts of interest with respect to the research, authorship, and/or publication of this article.
Funding
The author(s) disclosed receipt of the following financial support for the research, authorship, and/or publication of this article: The research received the support from the Science and Technology Development Project of Weifang City 2020, China, Grant No. 2020GX006
Informed consent
Consent for publication was obtained for this study from the participant.
Ethics statement
Ethics approval was obtained from the Institutional Research Ethics Board of Jiangsu University. We certify that the study was performed in accordance with the 1964 declaration of HELSINKI and later amendments.
Trial registration number/date
No clinical trials occurred during the research.