
Abstract
Existing predictive models of opioid use disorder (OUD) may change as the rate of opioid prescribing decreases. Using Veterans Administration’s EHR data, we developed machine-learning predictive models of new OUD diagnoses and ranked the importance of patient features based on their ability to predict a new OUD diagnosis in 2000–2012 and 2013–2021. Using patient characteristics, the three separate machine learning techniques were comparable in predicting OUD, achieving an accuracy of >80%. Using the random forest classifier, opioid prescription features such as early refills and length of prescription consistently ranked among the top five factors that predict new OUD. Younger age was positively associated with new OUD, and older age inversely associated with new OUD. Age stratification revealed prior substance abuse and alcohol dependency as more impactful in predicting OUD for younger patients. There was no significant difference in the set of factors associated with new OUD in 2000–2012 compared to 2013–2021. Characteristics of opioid prescriptions are the most impactful variables that predict new OUD both before and after the peak in opioid prescribing rates. Predictive models should be tailored to age groups. Further research is warranted to determine if machine learning models perform better when tailored to other patient subgroups.
Introduction
Opioid prescription rates and doses have declined since 2012.1,2 However, a large number of patients remain on long-term opioid therapy, which increases the risk for opioid use/dependence (OUD). One out of four patients receiving long-term opioid therapy in primary care have OUD, 3 and 4.7% of all pain patients prescribed an opioid will develop prescription OUD. 4 About 6 to seven million persons in the United States suffer from OUD, not limited to prescription opioids, 5 Among the commercially insured, the annual rate of OUD is approximately 0.4%. 6
Screening tools and urine drug screens (UDS) can be used to identify patients with OUD.7,8 However, these tools are not perfect and patients who are seeking opioids can provide inaccurate reports of their opioid use and UDS screens miss many positive cases when obtained without a visual witness. 9 Thus, the likelihood of a significant number of patients with undetected OUD is high. Left undetected and untreated, patients have an increased risk for opioid overdose and other adverse outcomes.
Machine learning using electronic health record (EHR) data has the potential to predict OUD and accurate models can be incorporated into the EHRs to aid OUD detection in the clinical setting. The models that have used machine learning have typically used either EHR data or data related to medical claims. A study by Che et al. 10 used a large sample of medical records and generated an AUC = 0.80 in a model predicting OUD. Medical claims data have a comparatively lesser level of individual patient detail but have been successfully used to develop machine learning models to predict opioid use disorder. Commercial medical claims data have been utilized to develop a machine learning algorithm to predict opioid use disorder, with a c-statistic of 0.96, 11 and major contributing factors included duration of opioid use, overlapping opioid prescriptions, benzodiazepine prescriptions, and specific pain conditions. A recent study utilized the Canadian administrative health records billing data to achieve a balanced accuracy score of 86%, and found opioid-related poisoning, sedative hypnotic-related disorders, and polysubstance-related disorders to be predictive of OUD. 12 Their billing data did not include prescription/refill variables. EHR data contains more patient level variables (e.g., pain scores, laboratory results), and may out-perform models developed using medical claims data.
We are aware of two existing studies using EHR data in a machine learning model of new OUD. The first used Veterans Health Affairs (VHA) data from 829,827 patients with encounters from 2006 to 2016. 13 Using 10,292 inpatient and 13,512 outpatient diagnoses as independent variables, this study developed a model that predicted cross-validated opioid use well for both inpatient (AUC = 0.822), and outpatient (AUC = 0.817) cases. 13 Similarly, EHR measures of laboratory values, pharmacy data and clinical characteristics from 716,533 patients were used to develop a machine learning classifier which produced an excellent predictive value for substance use disorder, not specific to OUD, with an AUC of 0.92. 13 Dong and colleagues, 14 used Cerner inpatient and outpatient EHR records between 2008 to 2017 in a deep-learning model that had excellent precision in predicting OUD (AUC = 0.937).
Because the literature is sparse and opioid prescribing has declined over the past decade, further research is needed to determine if the same set of factors predict OUD in the time period when opioid prescribing was increasing (2000–2012) compared to when it was decreasing (2013–2021). Because greater exposure to opioids should result in a higher rate of OUD, we expect a stronger association between prescription opioid characteristics and OUD from 2000–2012. In contrast, as access to opioids became more restricted, factors such as depression and past substance use disorder diagnosis which are associated with drug seeking and more severe and chronic pain, may be stronger predictors of OUD between 2013 and 2021. In addition, studies are needed that report on the predictive importance of individual variables. We used VHA EHR data to develop a predictive machine learning model of diagnosed OUD and determined if the set of important predictors of OUD differed between patients receiving opioids from 2000–2012 compared to those treated from 2013–2021. We used a pre-processing algorithm to re-structure the large datasets prior to developing the machine learning models. Second, we stratified analyses by three age groups. Third, we determined the relative importance of each predictor variable in predicting OUD.
Methods
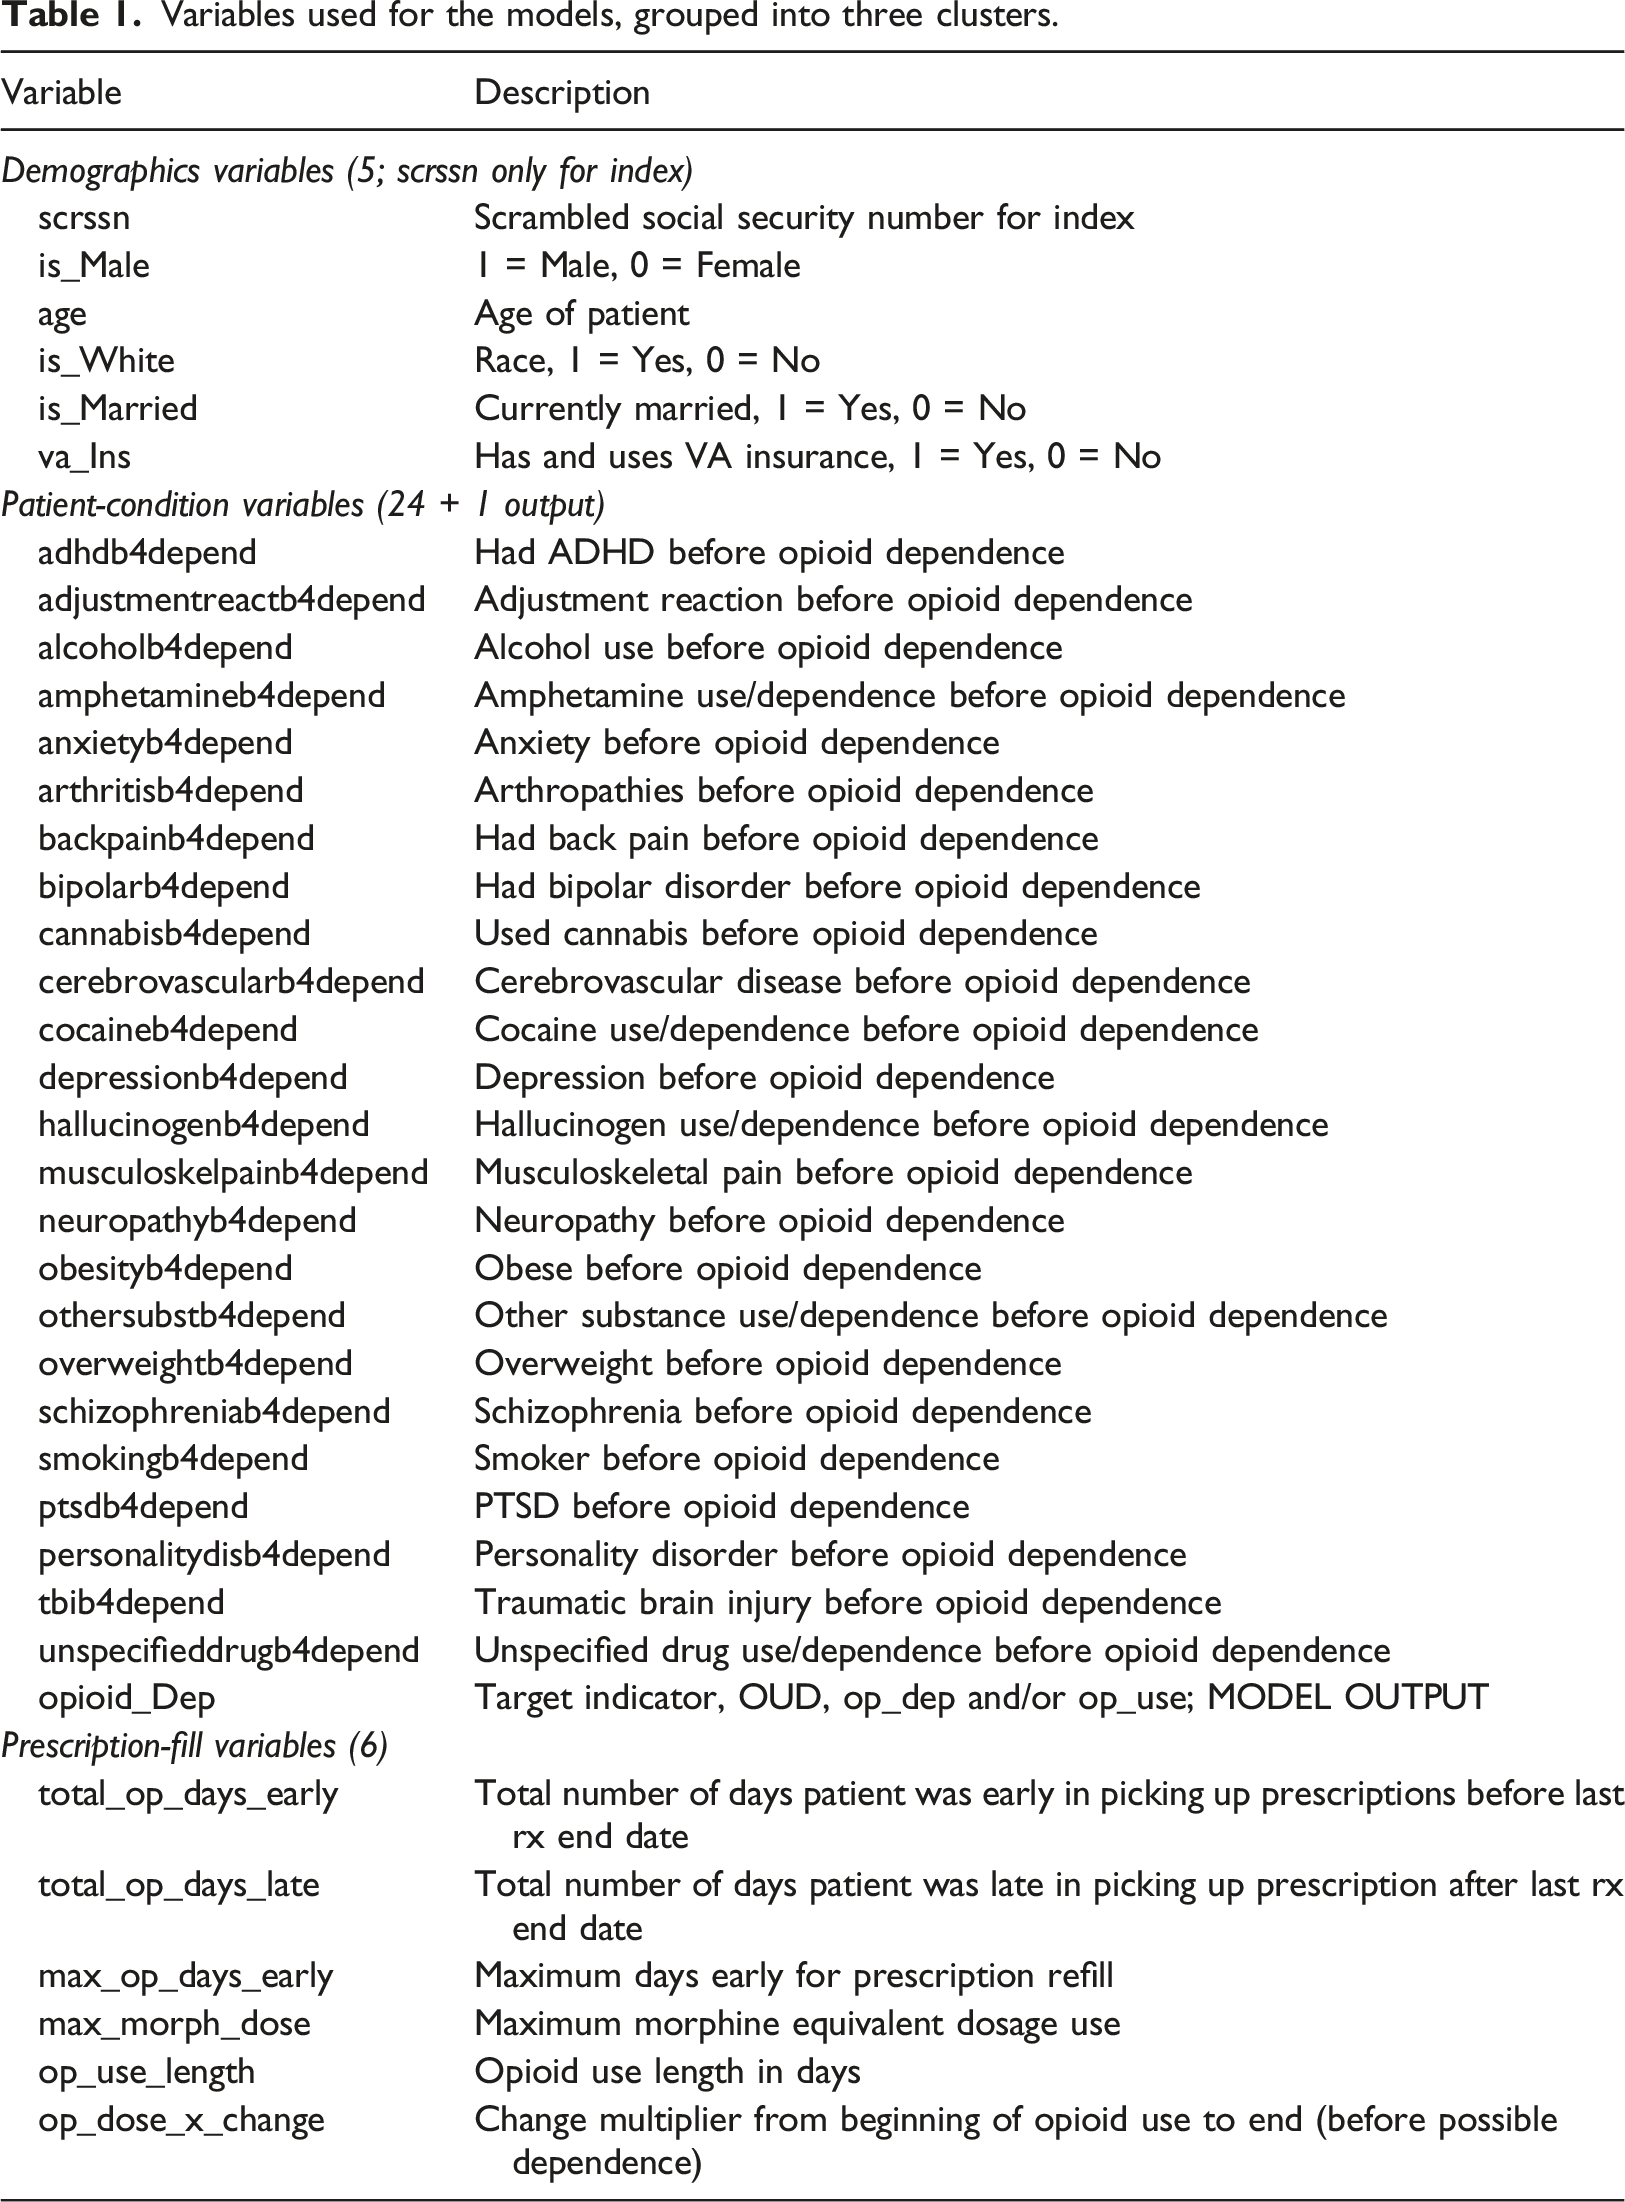
Variables used for the models, grouped into three clusters.
Eligible patients had to be free of HIV and cancer pain, be regular VHA users (defined as having at least two annual visits) and starting a new period of prescription opioid use. New opioid use was defined by excluding patients with opioid fills for 2 years prior to 1/1/2002. Patients must have been without diagnosed OUD prior to 1/1/2002 for the pre-2012 cohort and for 2 years prior to 1/1/2015 for the post-2012 cohort. This allowed us to model risk factors for new onset OUD following the start of a new period of prescription opioid use. The 2-years look-back period has been shown to improve classification of new medication users and reduce the number of ineligible subjects.
15
Patients with missing demographic data were excluded. In patients with OUD, an individual’s conditions that occurred after OUD diagnosis were censored. Figure 1 illustrates the sampling approach for the two time periods. Eligibility criteria for veterans hospital administration patient population. Each dataset was subject to the selection criteria outlined. For each dataset and at each stage, patients were removed, and the counts were noted.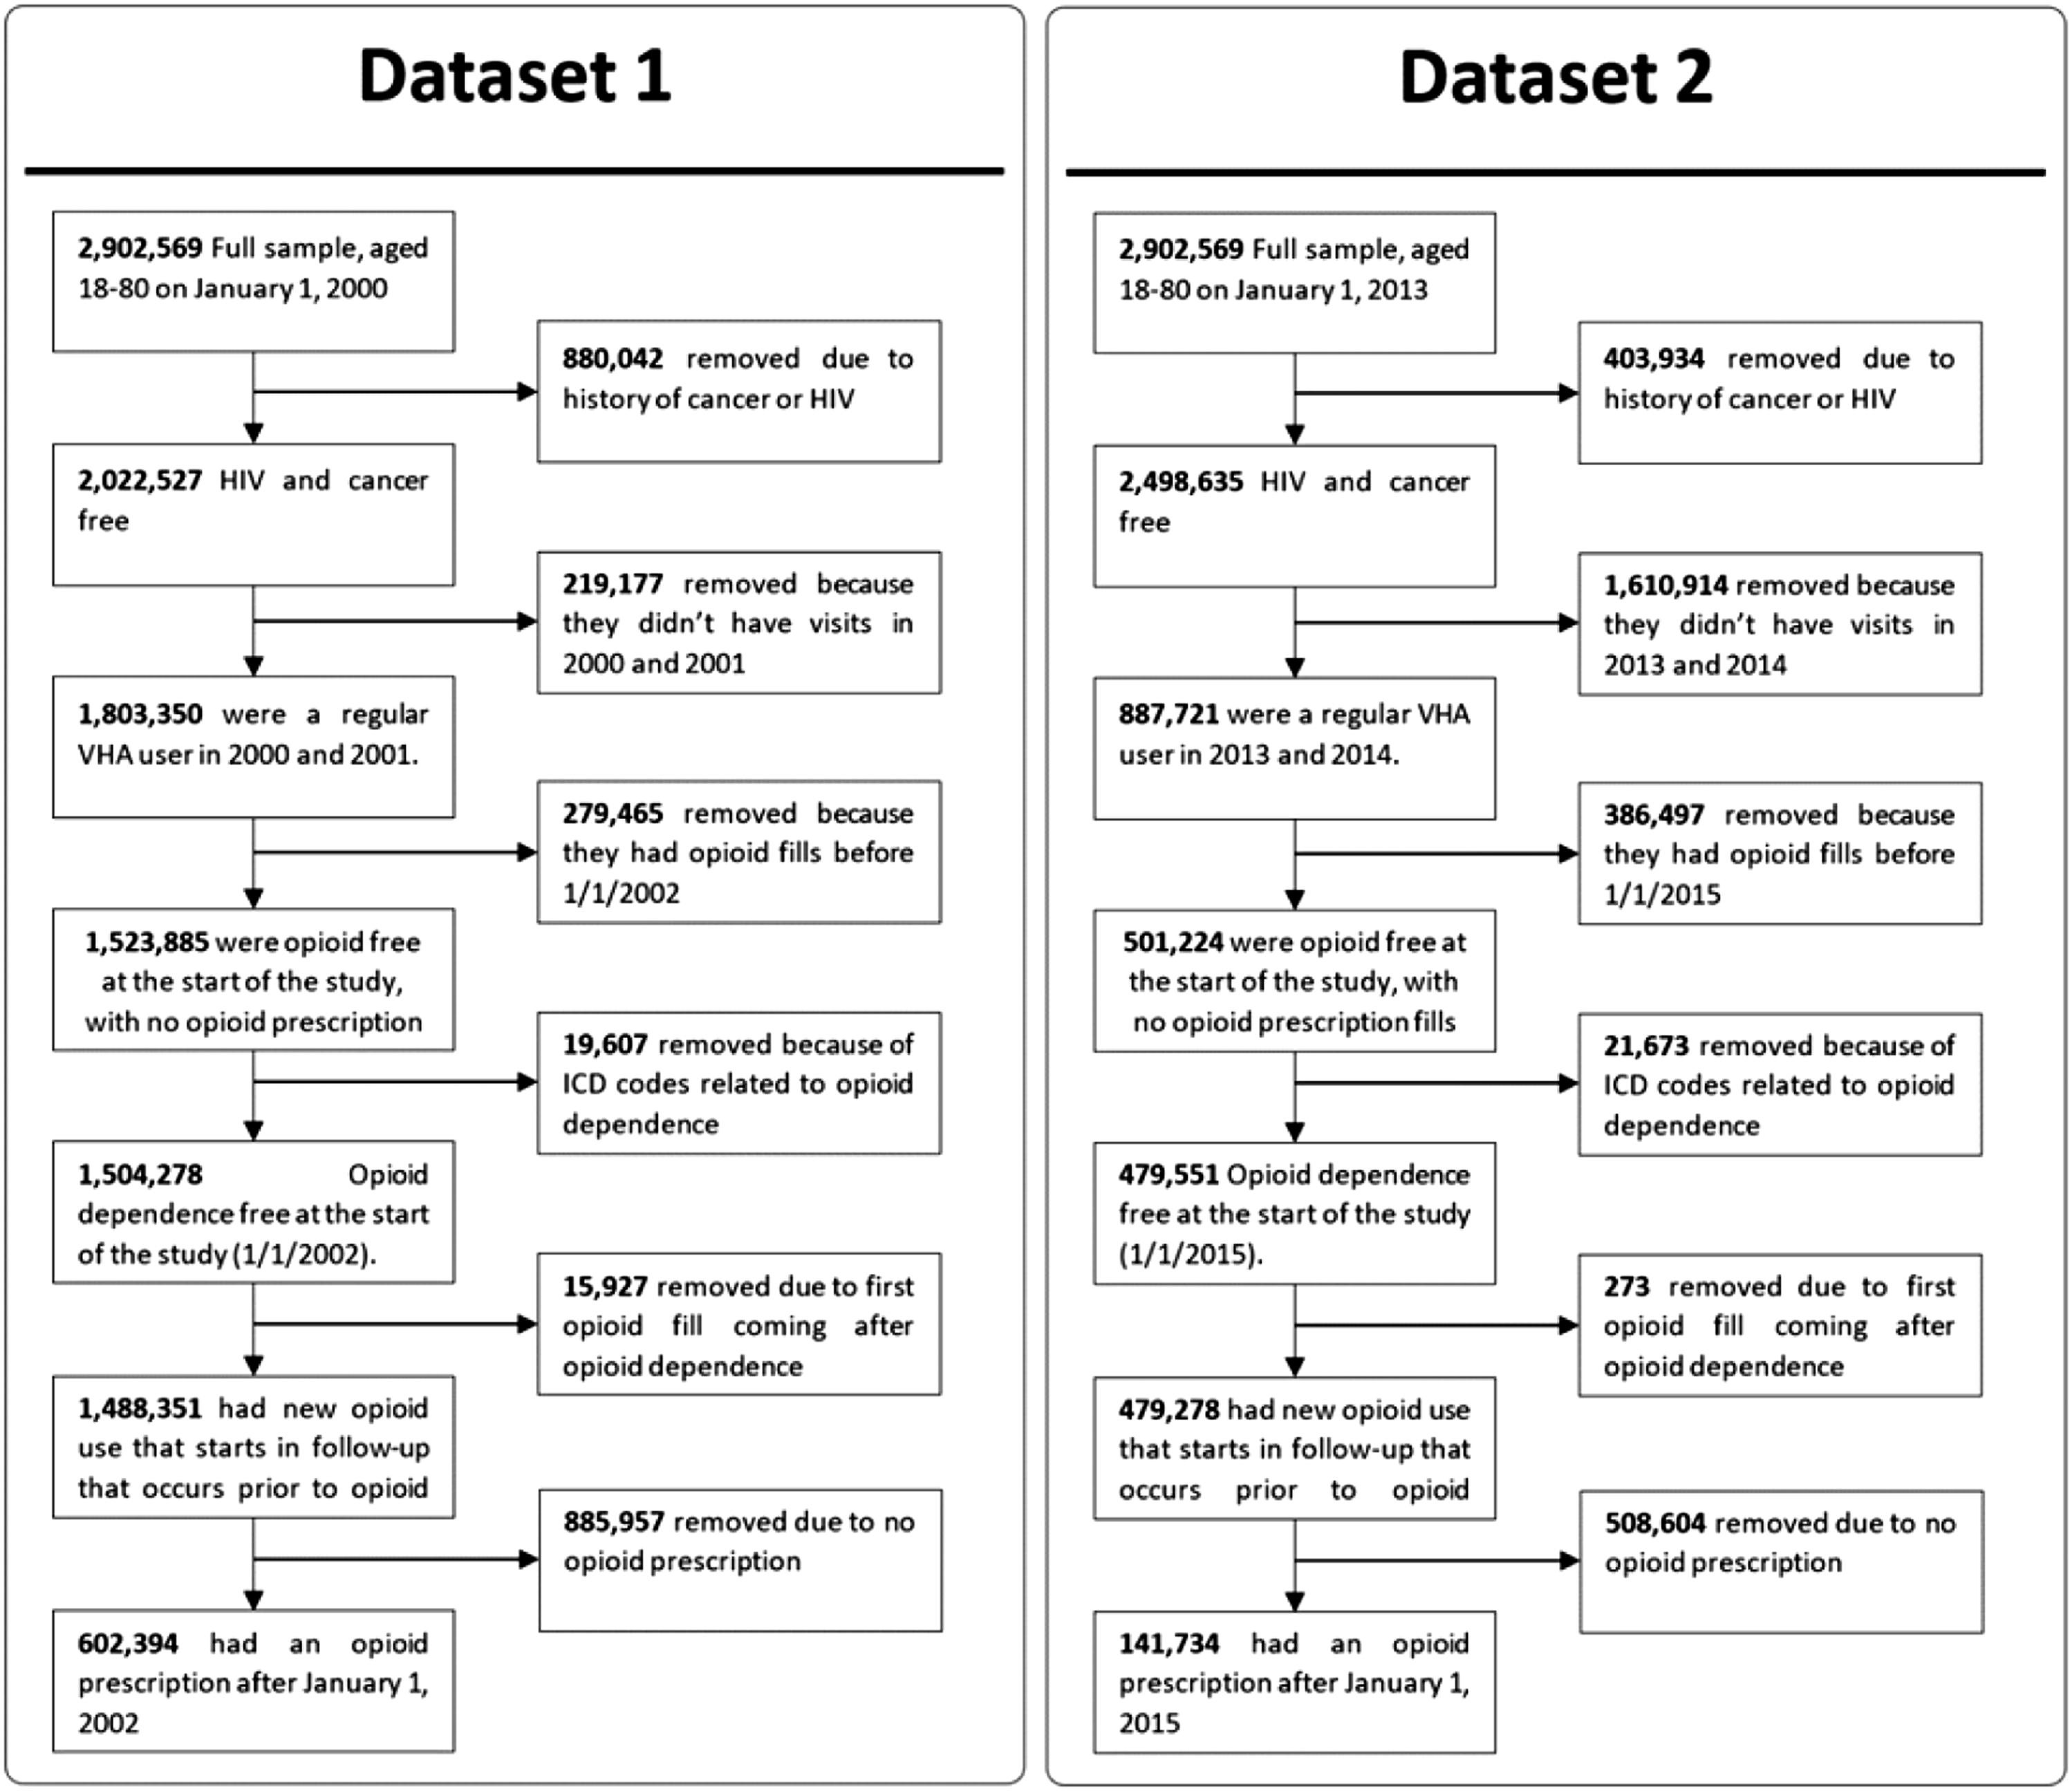
Cohort eligibility
Dataset-1 comprised of 602,394 patients from 2000–2012, with 24,117 patients diagnosed with OUD. Age groups in this cohort were 18–34 years (n = 40,480), 35–64 years (n = 408,871), and >64 years (n = 153,043).
Dataset-2 had 141,734 patients from 2013–2021, with 4,221 patients diagnosed with OUD. Also, the 2013-2021 dataset did not include new patients enrolled during 2013–2021. Based on the selection criteria (Figure 1), this dataset shared 84,603 patients from dataset-1 and 57,131 new patients from the entire dataset. For dataset 2, the sample size by age group was 18–34 years (n = 387), 35–64 years (n = 93,515), and >64 years (n = 47,835). These age groups were selected because risk for opioid use disorder decreases with age across similar age groups. 16
Variable definitions
Opioid use, dose, and dose change
New opioid prescriptions included the following opioids, in immediate and long-term release formulations at any dose and duration: codeine, fentanyl, hydrocodone, hydromorphone, levorphanol, meperidine, morphine, oxycodone, oxymorphone, and pentazocine. Morphine milligram equivalent (MME) dose was computed https://agencymeddirectors.wa.gov/mobile.html using standard online resources, e.g. https://www.mdcalc.com/calc/10170/morphine-milligram-equivalents-mme-calculator. We used the maximum MME received as a predictor variable. Continuous usage in days was defined as the use from the original opioid fill to the first occurrence of a gap in fills greater than 30 days or study end date. Dosage change is defined as the final opioid dosage divided by first opioid dosage. Methods to define dose and duration of prescription opioid use in this cohort have been reported previously. 17
Predictor variables
Predictor variable domains were selected because they have been associated with OUD,18,19 Demographics included sex, age (at the beginning of the study Jan 1, 2000, and Jan 1, 2013, respectively, for dataset-1 and dataset-2), race, marital status, and insurance. Insurance was defined as a binary variable (VHA vs. other types of health insurance). We used ICD-9-CM and ICD-10-CM codes to define psychiatric conditions which included: depression, attention deficit hyperactivity disorder (ADHD), posttraumatic stress disorder (PTSD), bipolar disorder, schizophrenia, personality disorder, adjustment reaction, and any anxiety disorder which was the presence of any of the following conditions: panic disorder, generalized anxiety disorder, social phobia, obsessive compulsive disorder or any other anxiety disorder not specified. We modeled alcohol use disorder, any non-opioid drug use disorder (including amphetamines, cannabis, hallucinogens, or unspecified), and nicotine dependence or a history of smoking. Physical comorbidities included overweight, and obesity defined by ICD-9-CM or ICD-10-CM code or body mass index. Painful conditions included arthritis, traumatic brain injury, neuropathy, musculoskeletal pain, and back pain. These conditions were created by combining groups of ICD-9-CM or ICD-10-CM codes from over 900 conditions for which an opioid may be prescribed.20,21
Prescription characteristics included the total number of days early a patient refilled their prescription, duration of opioid use in days, the maximum number of days a patient refilled early considering all refills, and the total number of days a prescription was refilled late. For a more consistent comparison of variables between decades, we scaled summed variables (such as the total number of days early an individual was to refill their opioid prescription) by the individual’s overall duration of opioid use.
All covariates had to occur prior to new OUD. In total, thirty-five possible predictor variables were selected. Table 1 lists the variables and their definitions.
Outcome variable
OUD diagnosis (defined by ICD-9 and ICD-10 codes) was defined by diagnoses for opioid abuse only (ICD-9305.5 and ICD-10 F11.10), or opioid dependence only (ICD-9304.0 or 304.7 and ICD-10 F11.20 or F19.20) or both.
Improved data pre-processing
In machine learning techniques that use large datasets, the issue of pre-processing data becomes significant. This is because databases typically have a very large number of dissimilar variables, including of multi-modal types as in patient health data. To address this pre-processing challenge, an algorithm was recently proposed to normalize the variables and was found to enhance performance compared to existing techniques such as Principal Components Analysis (PCA) and MinMax.22–24 This algorithm was used to normalize the variables for the datasets in this study prior to the development of the different machine learning models. Specifically, the algorithm uses a unit-consistent (UC) matrix completion (MC) approach to rigorously estimate unknown quantities based on the information available. The UC matrix completion approach presumes the existence of unknown units on relevant state variables and then estimates unknown values in a manner that preserves those units, i.e., changing of units will produce the same UC completion but in the new units.22–24 Briefly, from an original matrix A of patient data, the UC-transformed matrix TA = DAE, for positive diagonal matrices D and E, is uniquely determined with the product of known elements in each row or column equal to 1. The completed matrix, A’, is then obtained by filling the unknown entries of TA with 1, i.e., preserving the product of elements in each row and column, and transforming back by pre-multiplying by inverse (D) and post-multiplying by inverse (E). This is the matrix completion (MC) process.
For our application, UC presumes that information contained in patient evaluations is implicitly derived from a set of incommensurate variables defining the state of a system, i.e., the health state of each patient. The UC algorithm determines imputed values in a way that provably ensures that the new values are consistent with the unknown units. For example, if the measurement process were to scale some subset of the units by arbitrary values, the imputed values from the UC algorithm will be the same up to the scaled values. This natural constraint is not preserved by other methods, e.g., that minimize an arbitrary norm such as squared error. This UC guarantee ensures that prediction results are consistent and robust in the sense that they are not sensitive to arbitrary choices of units applied during acquisition of patient data.
Experiments were carried out to test the robustness of this approach by removing a random set of variables for each training run, and comparing results with those from MinMax, PCA and UC-MC techniques. Figure 2 shows how the method exhibits smoother results, which shows robust exploitation of information as it becomes available. More importantly, it plateaus at a level above that of PCA, which indicates that UC-MC can extract more of the available information. Furthermore, the relative score of UC-MC after removing one variable was consistently higher and displays how it maintains robust prediction compared to the other two methods. Testing for the significance of results given differing pre-processing methods, we found that the results with UC-MC were significantly better than those with PCA (p < .001). However, no significance was found for the UC-MC versus MinMax case (p∼.25) although the results remained consistently better (Figure 2). In summary, the UC-MC method was used consistently to pre-process the datasets including imputing values for three variables Relative AUC score using a subset of dataset-1 on the deep neural network classifier. Features were randomly removed sequentially from a subset of dataset-1 that consisted of 100,000 patients (remove 1 feature, remove 2 features, etc.— x-axis) and performance of three preprocessing methods were compared. The UC-MC approach showed consistently better performance compared to PCA and MinMax schemes (p < .001 and p∼.25 respectively).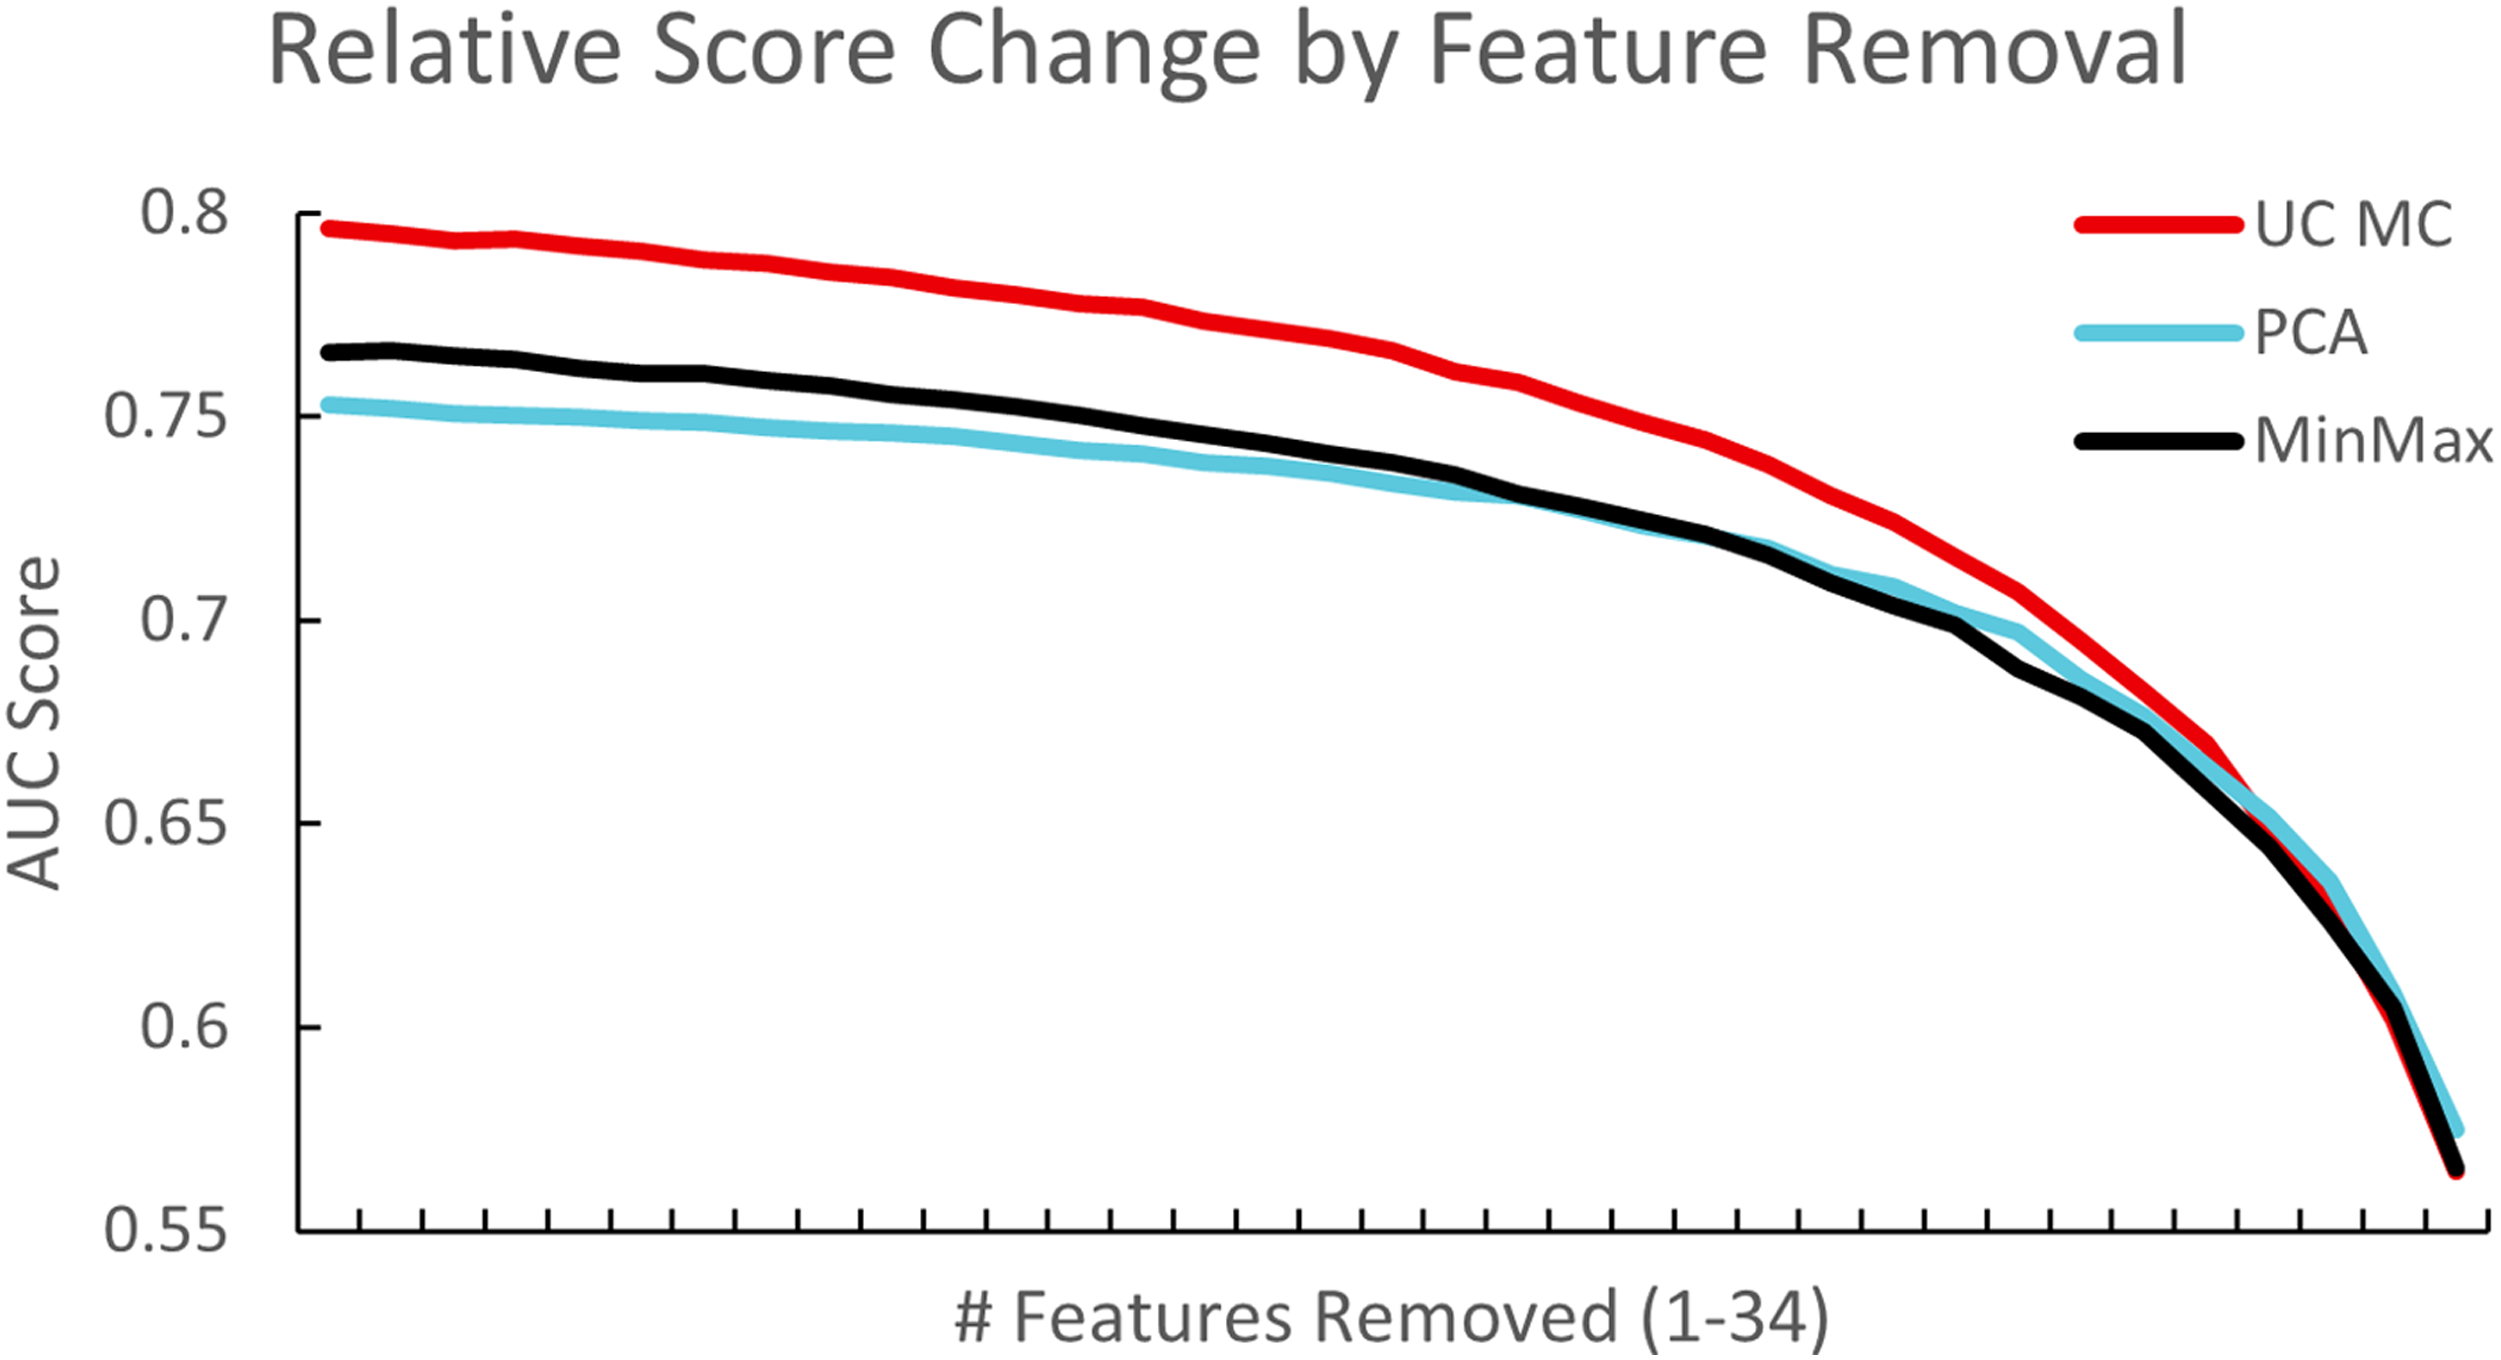
Machine learning techniques
Before training each model, variables were scaled between 0 and 1 using the UC-MC scaler. Datasets were first split (80:20; by patient) for training/validation and holdout. Of the training/validation data, K-fold cross validation of models (K = 5) was used to systematically repeat the train and validation split procedure (70:30; by patient) five times to obtain a more accurate representation of the model’s ability to learn the dataset. The holdout dataset, that the model had not seen, was then used to judge the performance of the trained network. Area Under the Curve (AUC) was the primary metric chosen for quantifying the accuracy of the models. Logistic regression provided a baseline score for comparison with the deep neural network and random forest classifiers which are popular models with deep neural networks typically providing higher accuracy. Of these, the random forest classifier has an inbuilt feature to perform sensitivity analysis while the others require user-developed code for sensitivity analyses. All OUD cases were used during this process and a randomly selected subset of non-OUD were used to keep classification classes balanced such that the number of dependent patients matched the number of non-dependent patients to not bias the algorithm in any direction. Similarly, classification weighting is a viable and available alternative to achieve similar results.
Cross-tabulation tables, mean and standard deviation for all covariates were calculated for correctly classified, false positive and false negative entries in the datasets. To improve model results, principal component analysis (PCA) was computed which revealed 31 out of 35 variables were necessary to explain 95% of the data. The use of PCA improved the deep neural network results above the MinMax scaler but UC-MC outperformed PCA, by an average of 0.025 AUC. We also explored the use of a convolutional input layer in the deep neural network model but found no difference.
Statistical tools
Statistical significance of variables across subgroups were determined using the StatsModels python package. Significance (p-value) was computed using a generalized linear model with a binomial distribution. 25 or t-test as appropriate (e.g., for the same patient in some tables) and is indicated with the specific test. The logistic regression model was implemented using ScikitLearn. The solver was lbfgs with a max iteration of 200 and a square error loss function. For our deep neural network model, a four-layer network (input, dense relu, dense relu, sigmoid output) was chosen. Optimal hyperparameter tuning was provided by ScikitLearn’s GridSearchCV. The random forest model utilized ScikitLearn and consisted of 100 estimators with a max depth of 40.
Software tools developed for data retrieval, processing, and analyses, are available upon request.
Results
The overall characteristics of datasets 1 and 2, including the patient variables were determined and are listed first, followed by results from the machine learning models.
Characteristics of patient data across two time periods 2002–2012 and 2013–2021
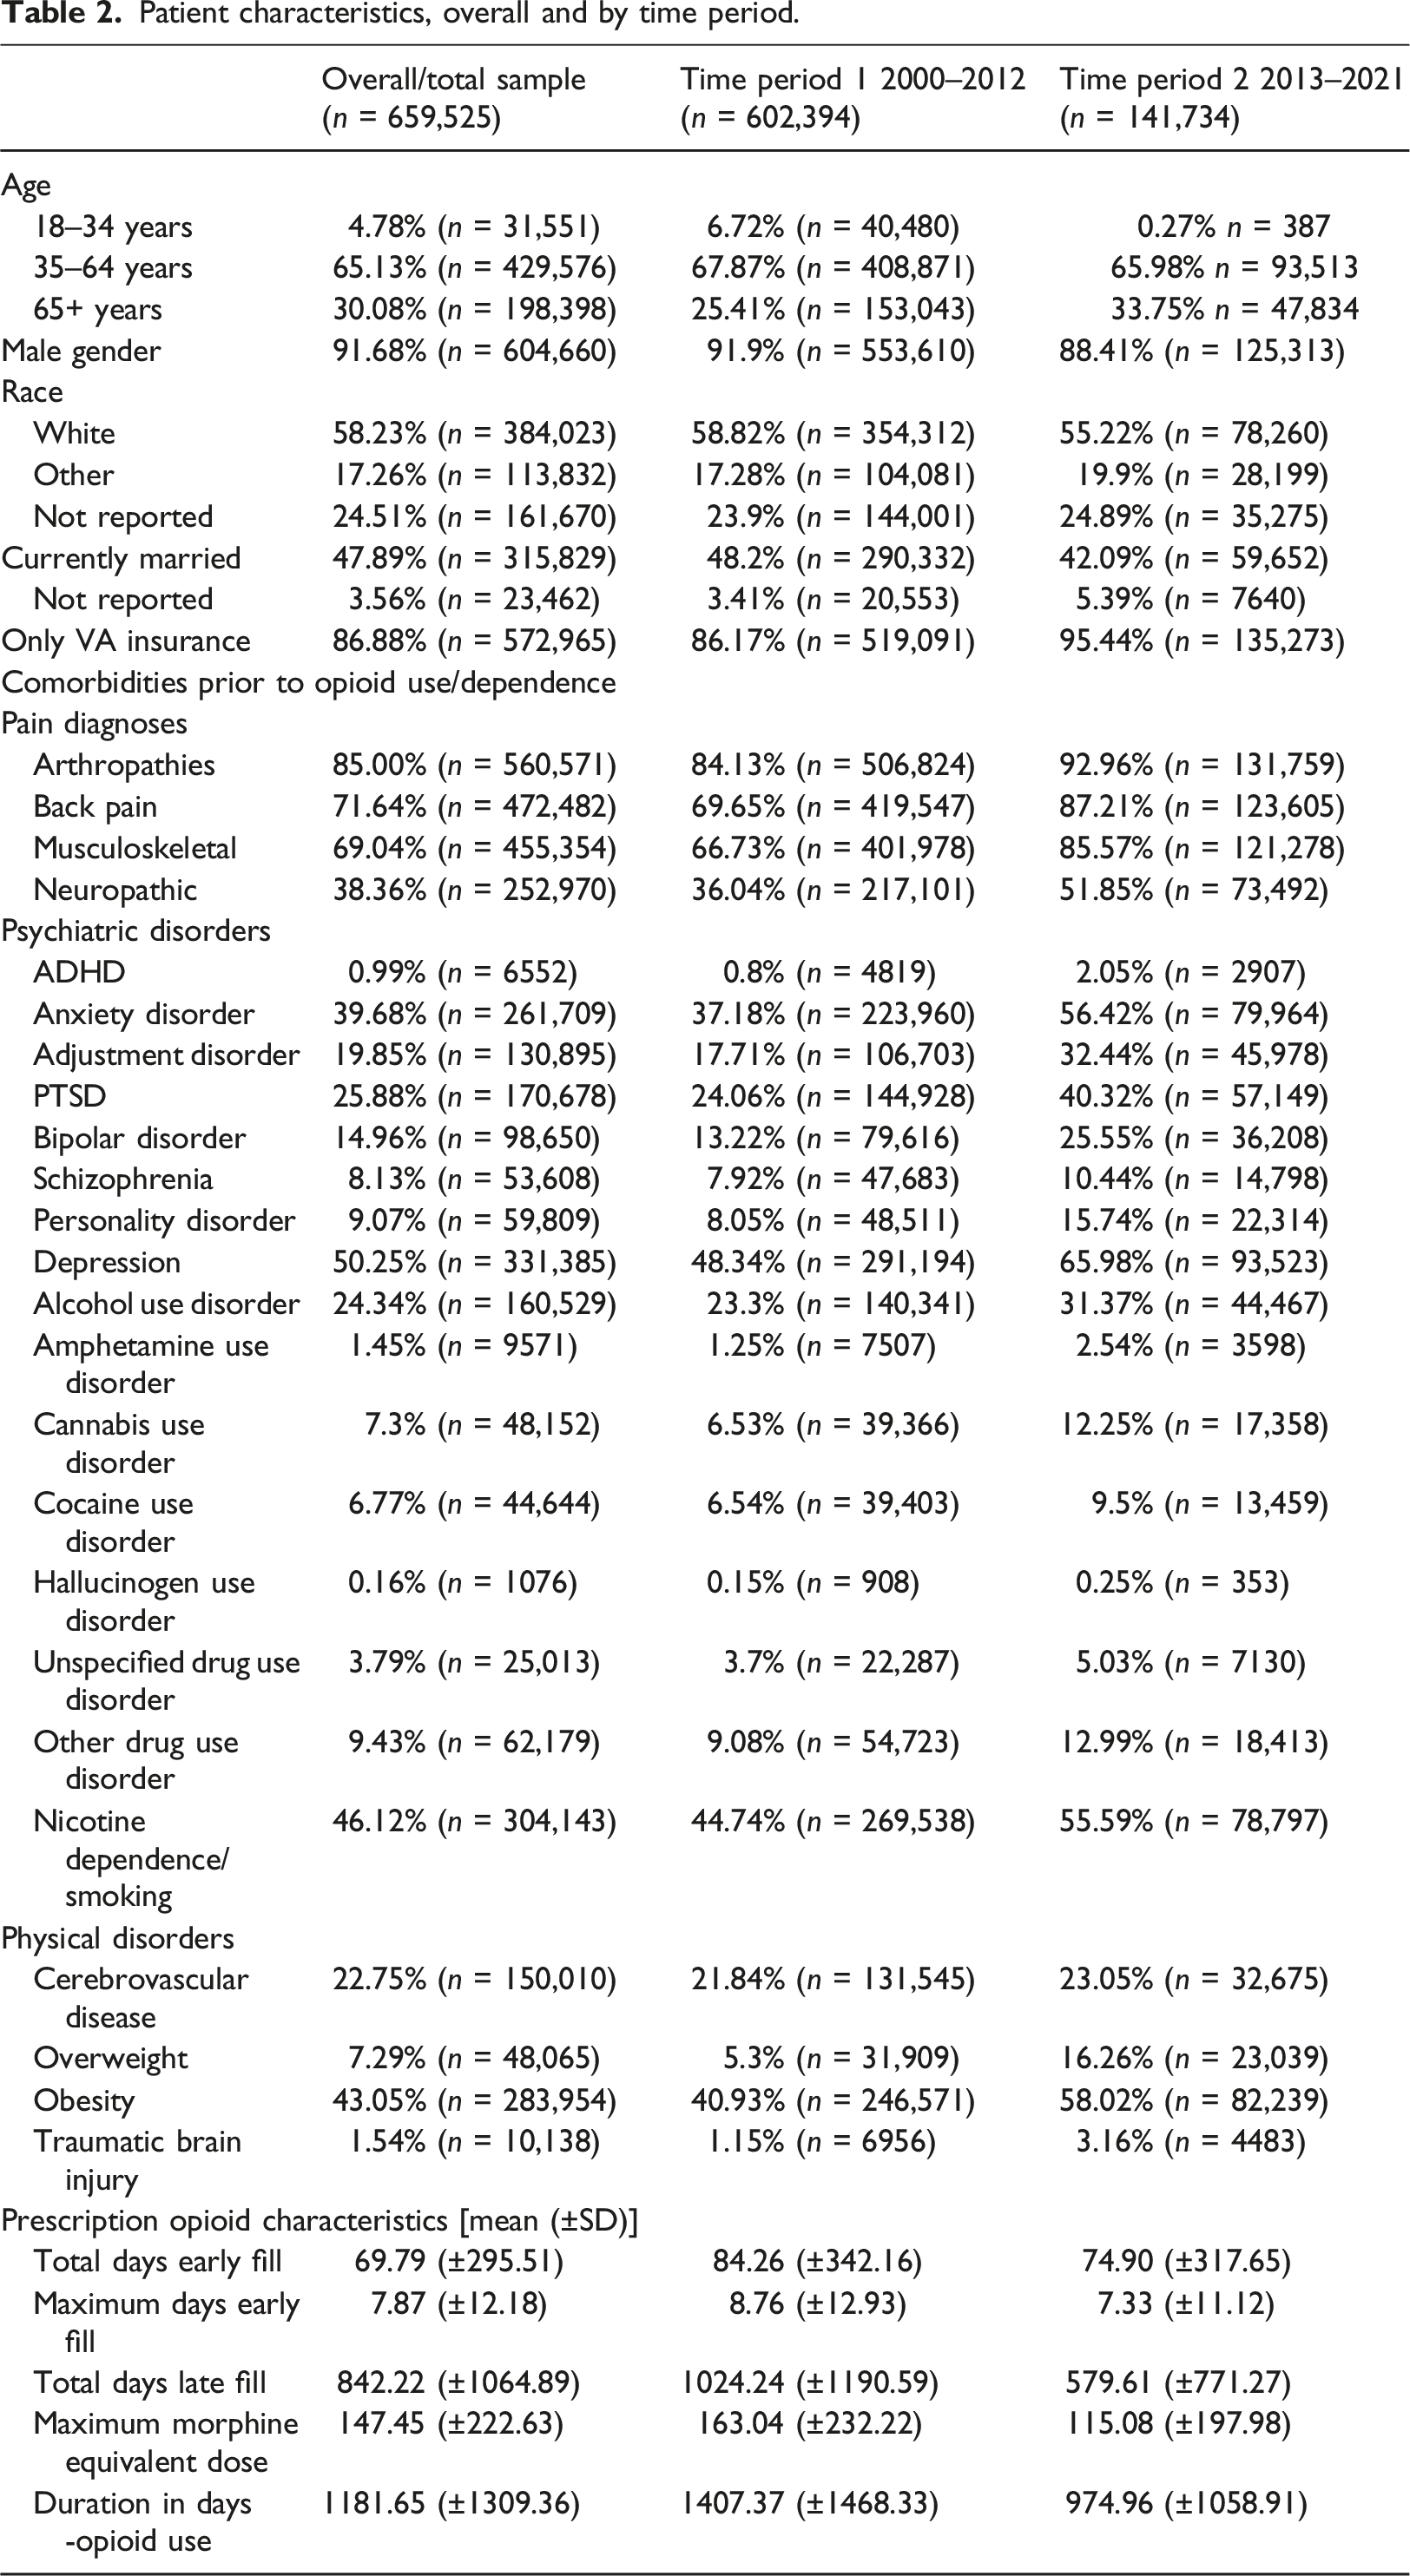
Patient characteristics, overall and by time period.
AUC, precision (P), recall (R), and F1 performance scores of trained machine learning algorithms for the two datasets. Holdout scores presented.
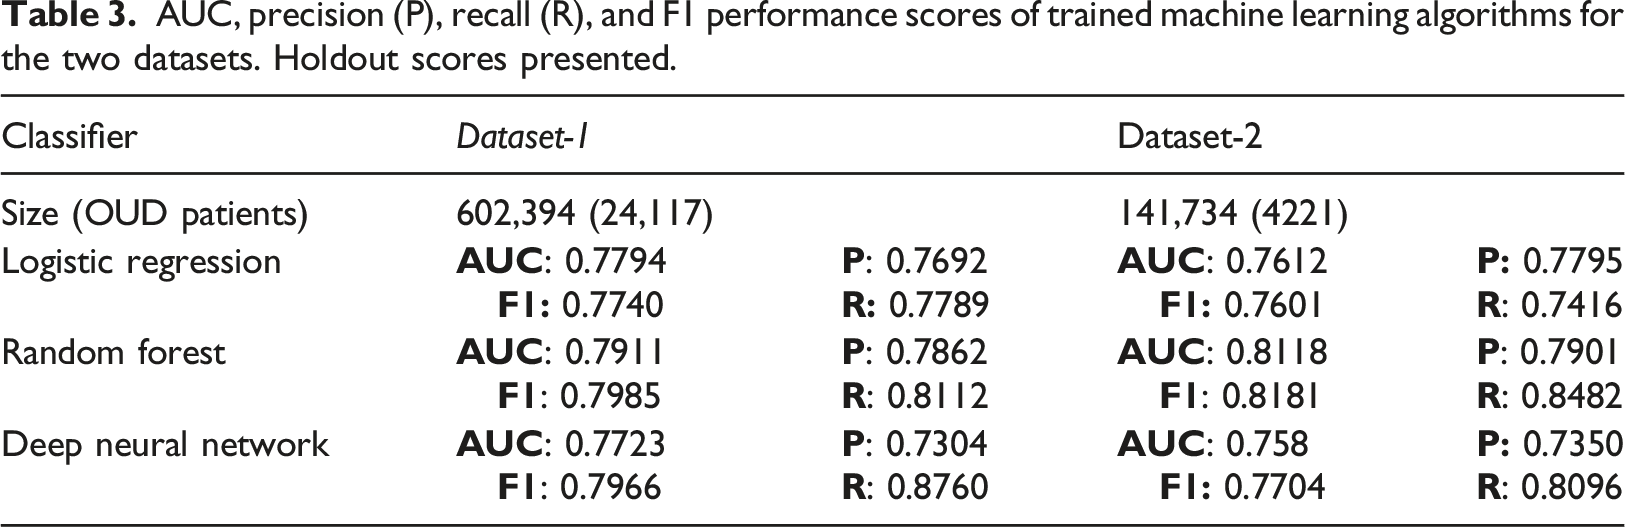
For each dataset the demographics and patient numbers with OUD diagnoses are listed. For example, column 2 (dataset-1) in Table 3 lists the total number of patients and the subset with OUD diagnoses, 602,394 and 24,117 respectively. Precision (P) measured how accurate the positive predictions were, i.e., what percentage of positive predictions were correct, while recall (R) measured how well the classifier found the actual positives, i.e., which percentage of actual positive samples were correctly classified. For all of our models, we balanced the dataset (see Methods). In general, our models had a higher recall, compared to precision. We tried to minimize the risk of not warning a patient who may be at risk by minimizing the Miss Rate/False Negative Rate FNR = FN/P = 1—Recall. F1 score is the harmonic mean of precision and recall, thus the F1 score shows the model’s balanced ability to both capture positive cases (recall) and be accurate with the cases it does capture (precision). In our case it’s just another validation, similar to AUC.
Stratification by age reveals differences in variable importance numbers
Because the random forest classifier provided the best performance, we used this scheme to develop individual models for each of the age stratified subgroups of dataset-1 and dataset-2.
The random forest classifier provides a utility to calculate Gini feature importance for each of the inputs by ranking its importance in predicting the output,26,27 similar to ranking schemes used previously.28–30 The relative importance of each variable is provided by its ranking which sum to 100 for all the variables. That is, all the relative importance numbers in the figure for the 35 variables in each of the three age categories add up individually to 100. For this reason, the higher the importance number of a variable, the more its relative importance in predicting the output. This was performed for both datasets 1 and 2, with results shown in Figures 2 and 3, respectively. Such an analysis provides important insights for the user and adds the attribute of ‘explainablity’ that is sought from machine learning models.
31
The relative importance of the various variables in predicting OUD was explored for each of the models developed when stratifying the datasets by age (Figures 2 and 3). Variable importance stratified by age, using random forest classifier. For dataset-1, we determined the feature importance for three distinct age groups: 18–34, 35–64, and >64 years (ordered by importance number for the 18–34 age group). The x axis is the relative feature importance determined by random forest while the y axis denotes each feature.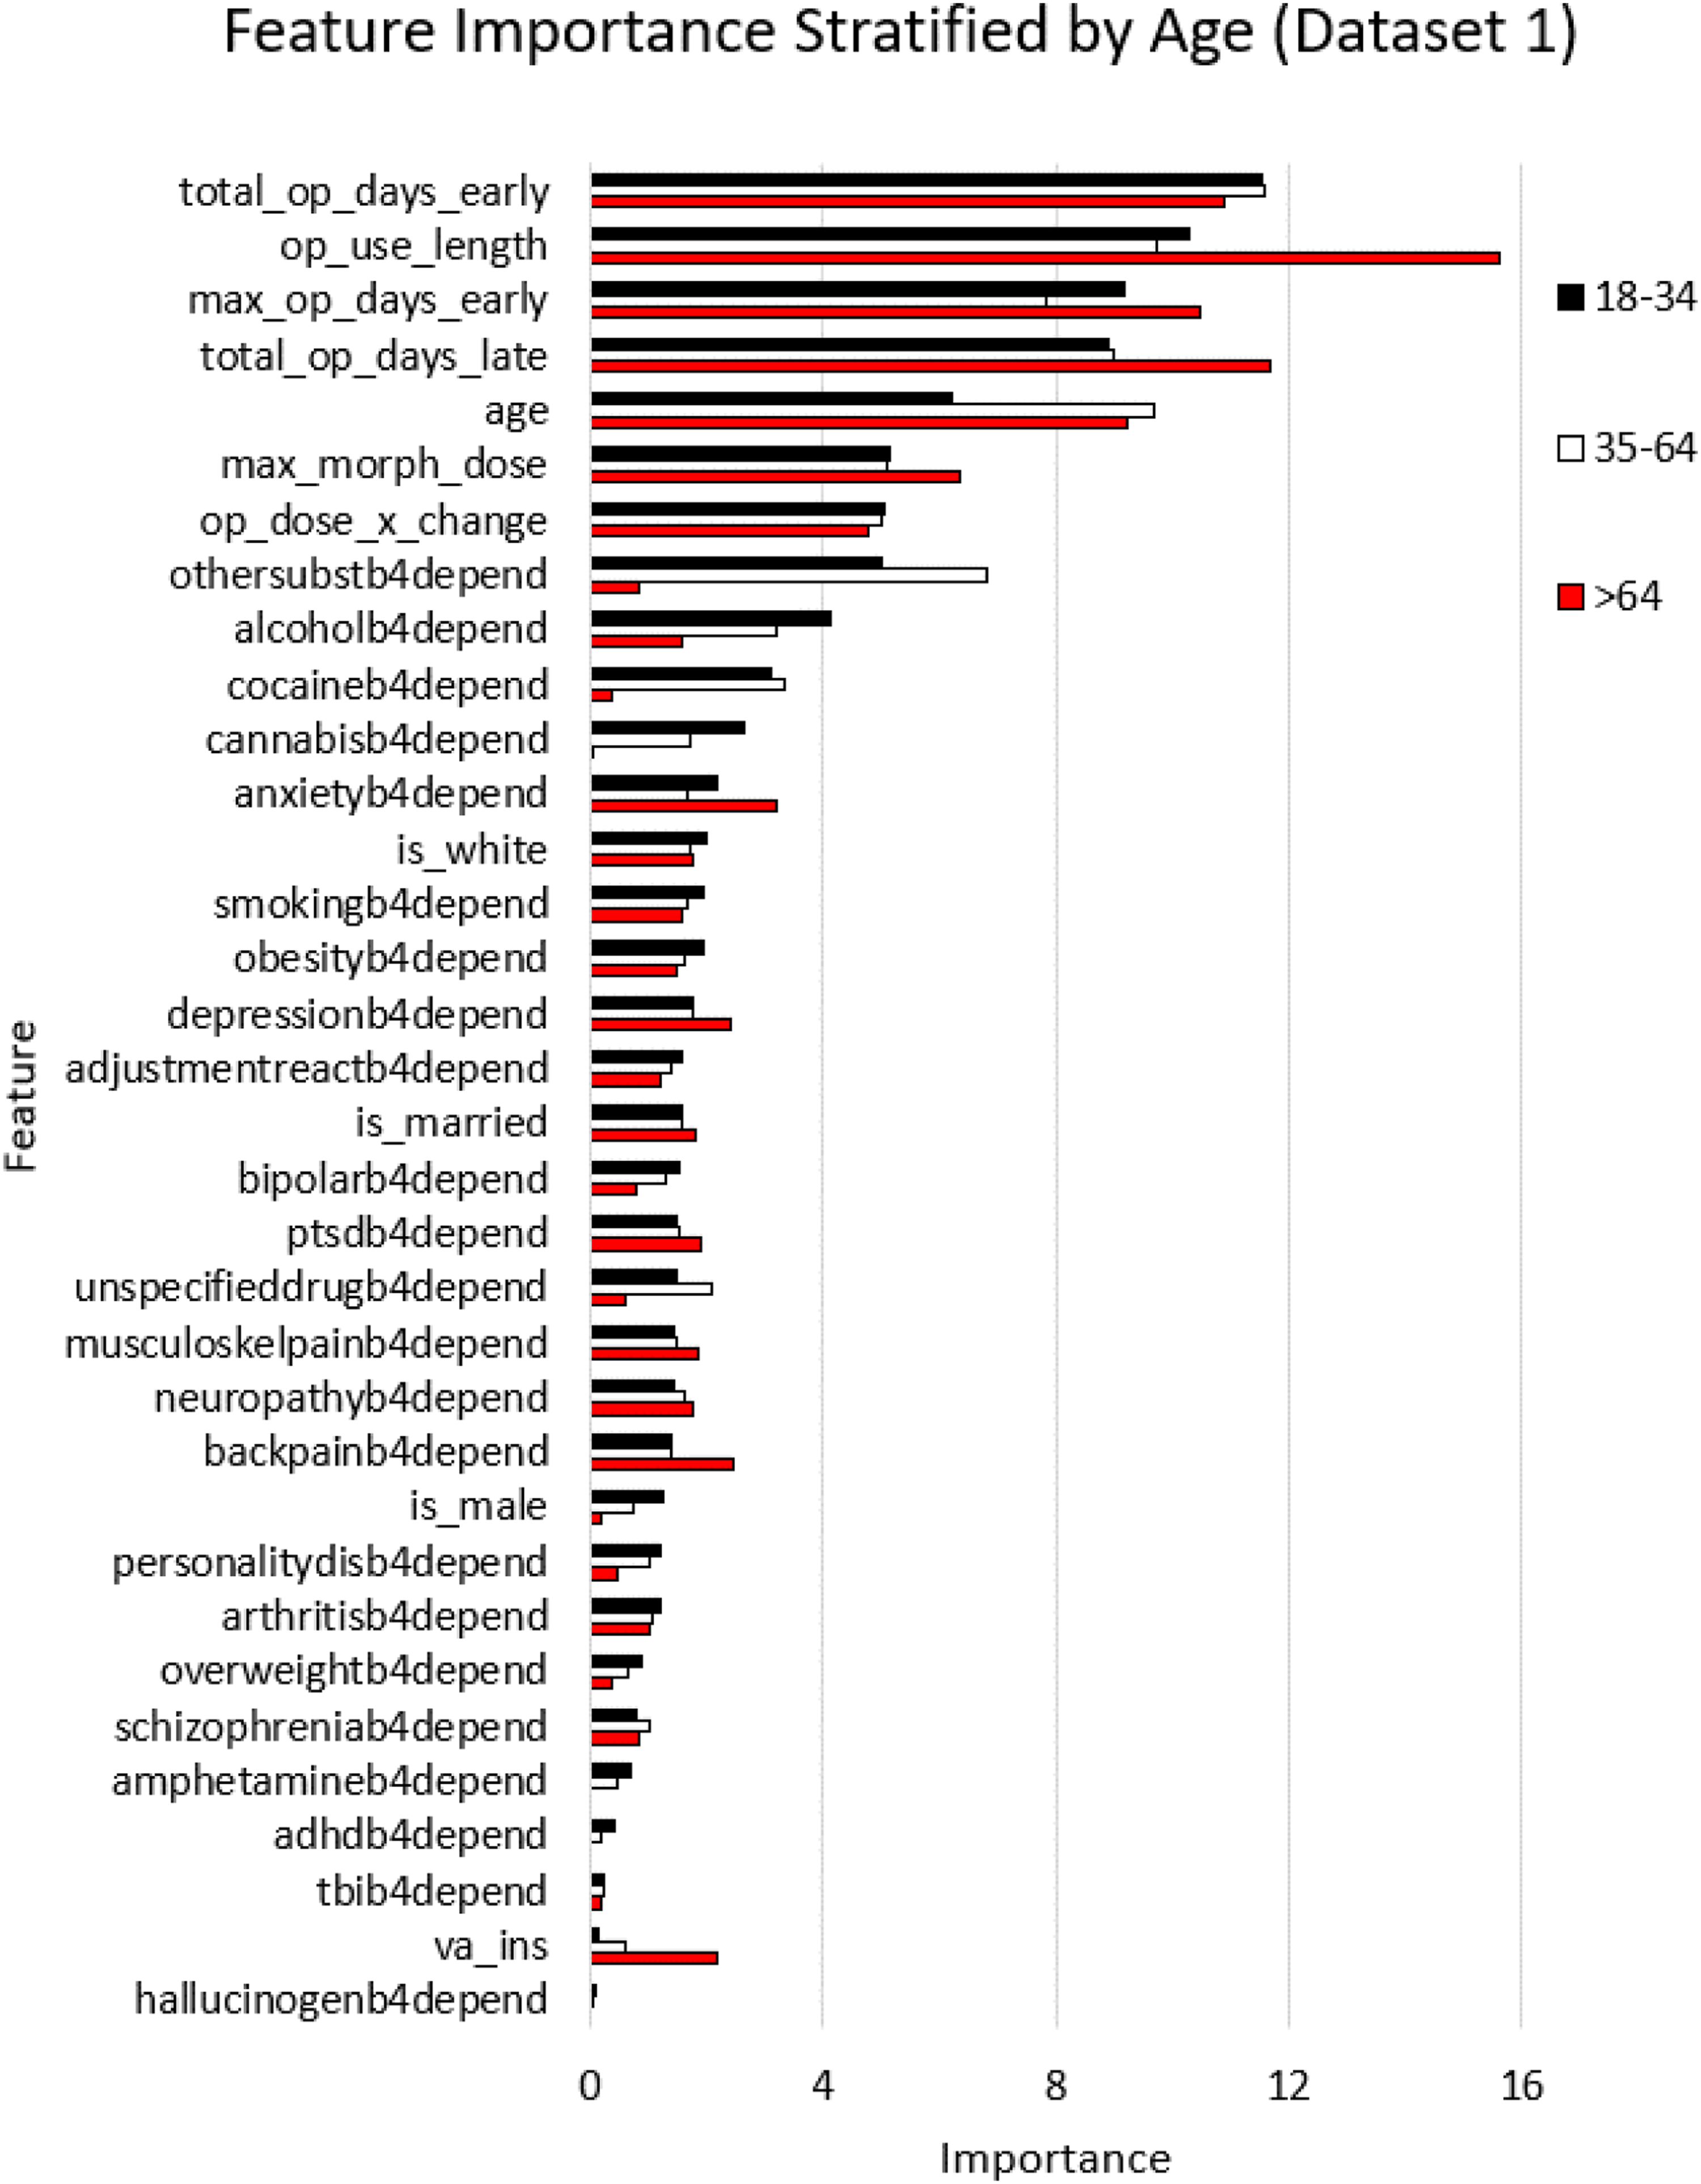
The results of random forest modeling to rank the importance of the variables in predicting OUD in dataset-1 are shown in Figure 3, for the three age categories 18–34, 35–64, and >64 years. Interestingly, four out of the top five features as far as importance were related to prescriptions, with the feature of age in the fifth place. The prescription features included the total number of days of early refills, duration of opioid use, the maximum duration of early refills, and the total duration of late refills. The order was largely the same in all three age groups. The predictive importance for these five variables were significantly higher compared to those of the next five in the group listed in Figure 3 (p < .001). Age within each stratified group, which was fifth in rankings, was itself an important predictor of OUD. This prediction with age had a positive correlation for patients 18–34 years and a positive correlation for those >64 years. Furthermore, we found that the prescription-fill features of opioid use length, total opioid days late, and maximum opioid days early were significantly more important for the >64 age group compared to younger groups (p < .001 and p < .001 respectively). While maximum morphine dose was not a top 5 predictor, it was significantly more important for patients >64 years and had a 1.23 times higher importance number, compared to those younger (p < .001). The model revealed that prior substance use disorder diagnoses (othersubstb4depend variable) was significantly more important in predicting opioid use disorder for younger (18–34) and mid-age (35–64) groups, compared to the older >64 years patient group (5.91x; p < .001 and 8.04x; p < .001, respectively). The same was true for cocaine use disorder as it was significantly more important in predicting OUD for younger (18–34) and mid-age (35–64) groups, compared to the older >64 years patient group (8.24x; p < .001 and 8.84x; p < .001, respectively). Another insight from the model was that alcohol use disorder was significantly more important for the younger age group compared to the older groups (18–34 vs 35–64: 2.59x, and 35–64 vs > 64: 2.01x; p-values of 0.001 and 0.001, respectively).
For dataset-2, we determined the feature importance for three distinct age groups: 18–34, 35–64, and >64 years (ordered by importance number for the 18–34 age group) in Figure 4. The x axis is the relative feature importance determined by random forest while the y axis denotes each feature. Feature importance stratified by age, using random forest classifier for dataset 2.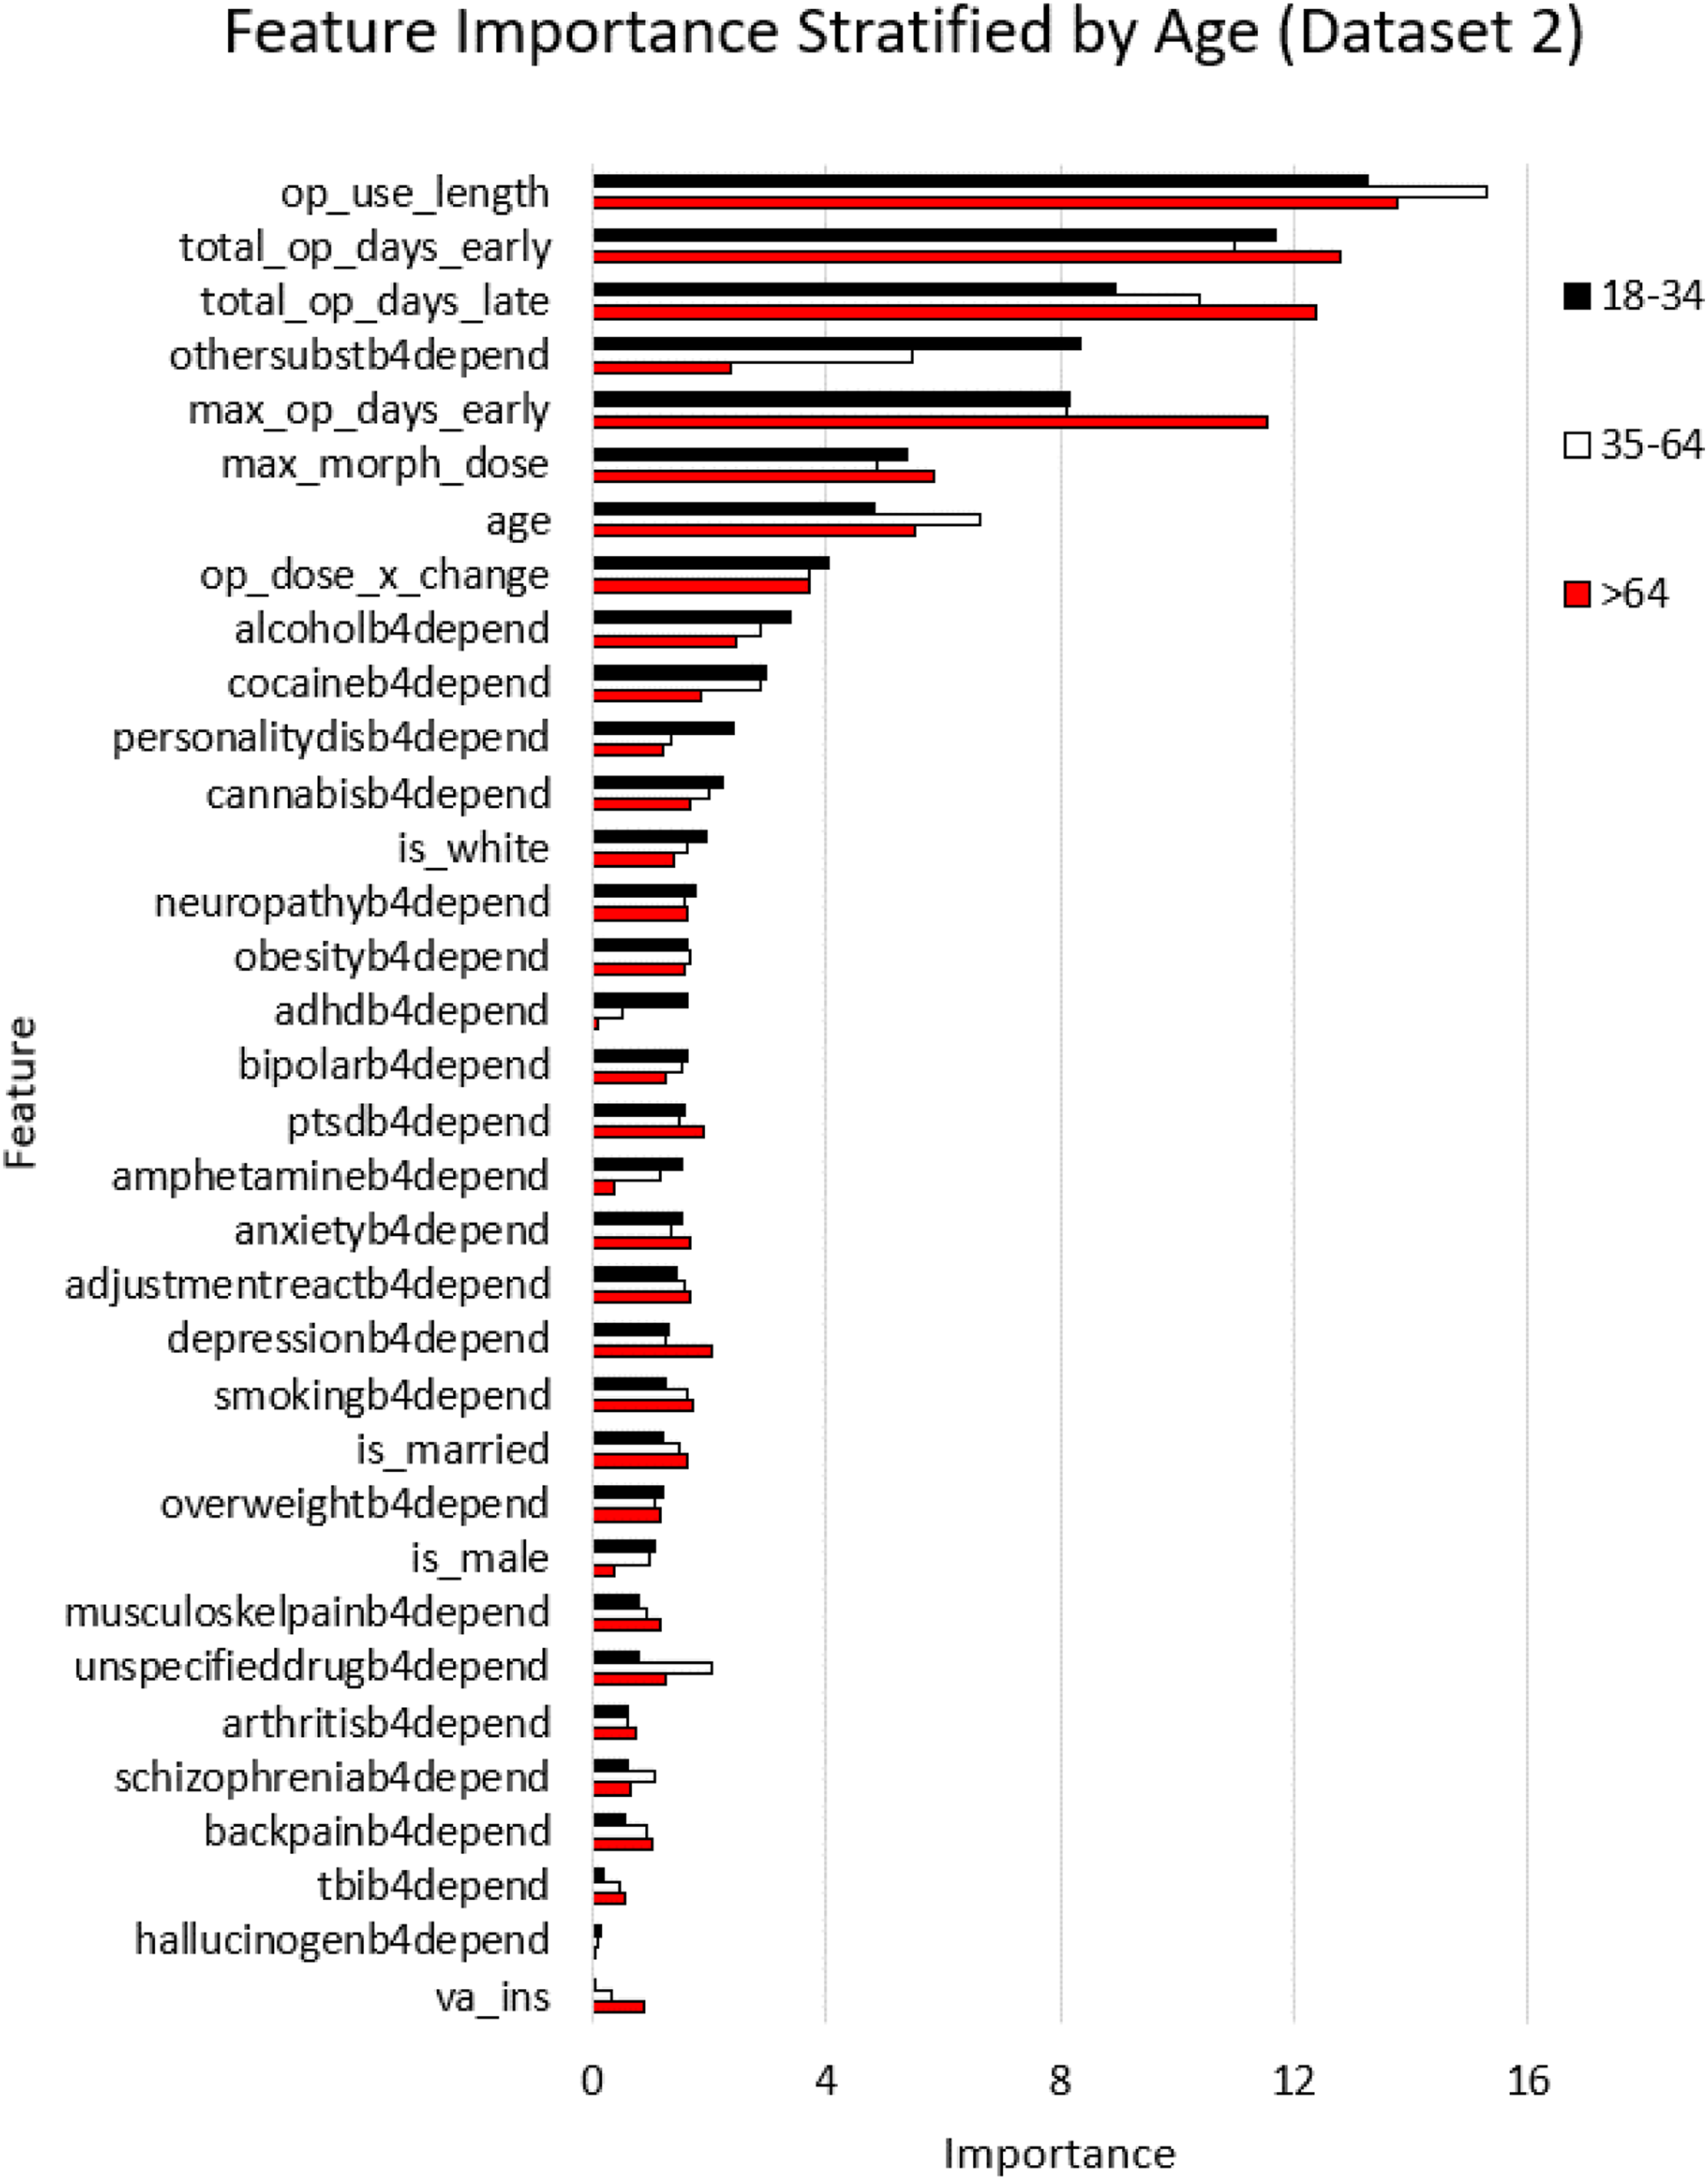
Predictor variable importance numbers were largely consistent across decades
Datasets-1 and 2 enabled comparisons of variables as they relate to OUD prediction performance to determine if indicators may have changed between 2001–2012 and 2013–2021. Dataset-2 had 84,603 patients that were shared with dataset-1, with 3,120 OUD cases. Note that OUD cases from 2000–2012 were excluded from dataset-2 (see Figure 1 and methods). Similar to the analysis in the previous dataset, we stratified dataset-2 by age, and trained the random forest classifier for each of the stratified datasets separately, and then generated variable importance numbers for the age stratified categories as shown in Figure 4. Prescription-fill variables were again the top variables in all stratified subsets of dataset-2. As noted earlier, dataset-2 shared 59% of the patients with dataset-1 which accounts for lower numbers of patients in the 18–34 category and the >64 category. Nevertheless, prescription-fill variables clearly dominated the importance number rankings in datasets 1 and 2, confirming their overall importance in predicting future OUD.
Raw prescription-related variables for each decade were extracted for OUD diagnosed patients, and non-OUD diagnosed patients. The values shown are changes in prescription variables across decades (datasets 1 and 2 for decades 1 and 2, respectively). Percent change was calculated for each group OUD and non-OUD for each case [(mean value in dataset 1—mean value in dataset 2)/(mean value in dataset 1)]. Paired sample t-test was used to assess changes in the same patient.
Change in prescription variables across decades.
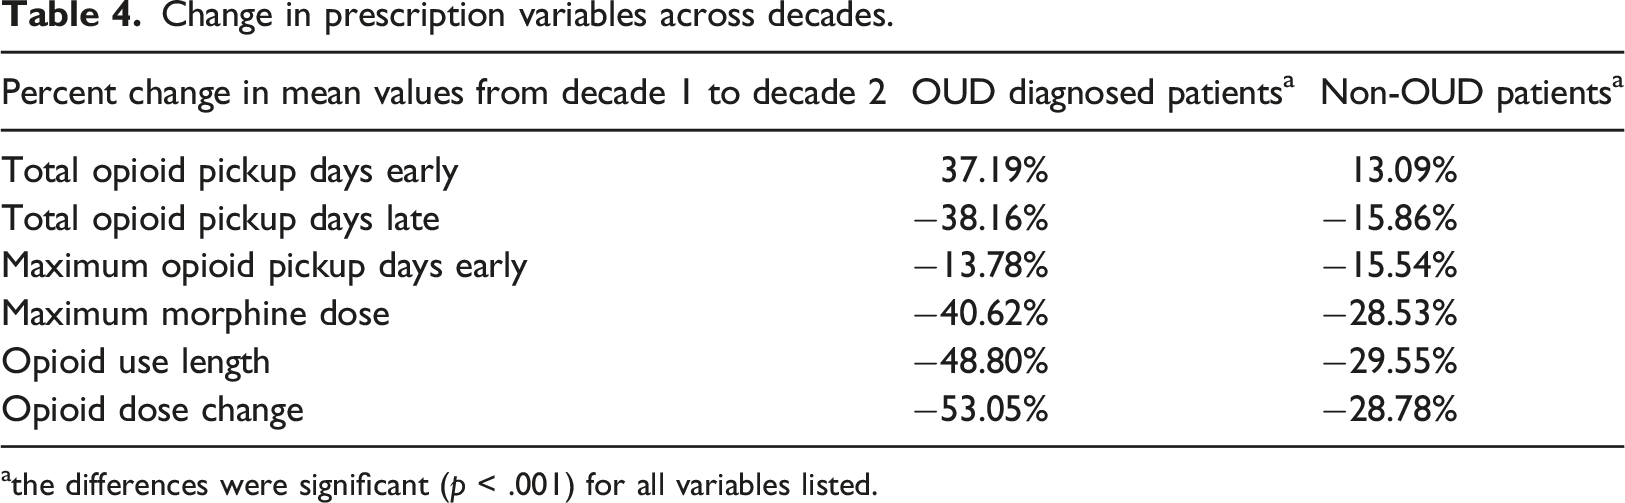
athe differences were significant (p < .001) for all variables listed.
An investigation of the changes in characteristics for the same patient between time periods when they did not have OUD (2000–2012; decade-1) vs when they did (2013–2021; decade-2) revealed that for the same patient, the means of the raw prescription-fill variable related to total opioid days late was significantly lower in decade-2 compared to decade-1 (0.3098 vs 0.5275, −41.3%, p < .0001; t-test). Similarly, the total number of early refills days was significantly higher in decade-2 compared to decade-1 (0.1982 vs 0.1472; +34%, p < .0001; t-test); (ii) the difference in means for depression was significantly higher in decade-2 compared to decade-1 (normalized means—1 = observed, 0 = not observed; 0.8455 vs 0.7862, +7.5%, p < .0001); (iii) Other substance use disorder was also higher in decade-2 compared to decade-1 (0.3897 vs 0.3356; +16.1%, p = .0001; t-test). In addition to yielding further insights, these longitudinal changes in the raw measures for four of the variables deemed important in predicting OUD (Figure 3), and similar findings in Table 4, provide validation for the ranking of predictor variables in their ability to forecast OUD (Figures 3 and 4).
Discussion
Machine learning models using EHR data were found to be viable in predicting OUD. Duration of opioid use, total days from early opioid fills, and total number of late opioid fill days were the most important predictors of OUD. These findings were consistent for both the period when the opioid epidemic was worsening (2000–2012) and during the period of declining opioid prescription rates and doses (2013–2021).
Unexpectedly, other forms of substance use disorders and common psychiatric disorders, e.g., depression, did not have the same magnitude of contribution to OUD as the prescription characteristics. However, the present findings are consistent with prior studies demonstrating that after the publication of the CDC guideline, more potent and high dose opioids continue to be prescribed to patients at greatest risk for OUD. 17 This indicates that modifiable factors, (e.g., duration of opioid prescriptions) are key contributors to OUD. Because early fills and long duration prescriptions continue to predict OUD following decreases in opioid prescribing1,2 and the release of the 2016 CDC’s opioid prescribing guideline 32 further interventions designed to reduce long duration opioid prescribing and early refills to patients at risk for adverse opioid outcomes is warranted. 33
Our results are consistent with a machine learning algorithm which identified that opioid use duration and overlapping opioid prescriptions distinguished OUD in a large cohort of medical claims data from 2006 to 2018. 11 Our findings are largely consistent with an analyses of private sector EHR data which observed opioid medications were the 4th most important measurement predicting OUD (Dong et al.). Direct comparisons between our findings and this prior study is limited because we modeled multiple opioid medication measures, including early refills while Dong and colleagues modeled any opioid prescription. In addition, VHA patients tend to stay within the VHA system as compared to private sector patients who are more likely to change providers as their source of health insurance varies over time. Using VHA data should reduce misclassification of outcome and predictor diagnoses relative to data from private sector health care systems where fragmented health care could generate more missed diagnoses when patients move from one healthcare system to another. Including the duration of an opioid prescription and early refills in our predictive model better captures risk factors for OUD, specifically long-term opioid use and using more than prescribed leading to early fills are indicators of the development of problem opioid use. These are stronger predictors of OUD as compared to exposure to any opioid medication.
Our findings differ from a predictive model using commercial EHR data, which observed mood disorder to be the most important predictor of diagnosed substance use disorder, not specific to OUD. 13 This suggests machine learning algorithms should be tailored to the type of substance use disorder (SUD), and factors contributing to OUD may not be the same as those which predict other types of substance use disorder.
Additional research is needed to establish the accuracy of predicting OUD in different patient populations. Predictive models should be validated by determining how well the model predicts undiagnosed OUD. By administering diagnostic interviews to patients with and without a medical record diagnosis for OUD a true gold standard can be obtained. The model should be re-calibrated after predicting OUD cases confirmed by diagnostic interview.
Because the strongest predictors of OUD are characteristics of the opioid prescription, the clinical utility could be very high. EHR best practice alerts could caution prescribers when the combination of opioid dose, duration and other factors found to predict OUD indicate high risk.
Limitations
It was not determined if the opioids were taken as prescribed, taken with other prescriptions obtained outside the VA or supplemented with illicit opioids. Retrospective medical record data is vulnerable to misclassification and the contribution of some diagnoses may be decreased to the degree that patients with a condition (e.g., depression) are misclassified as unaffected. The VHA patient population is predominately male and has a high rate of comorbidity, therefore results may not generalize to non-VHA patients. It is possible that the results from Veterans Health Administration data may not generalize to private sector health care systems. However, numerous studies using VHA data on topics ranging from the association between long-term opioid use and new onset depression, 17 to the link between metformin and dementia, 34 and vaccinations and dementia35–37 have been replicated in private sector medical record and medical claims data.
Compared to manual chart abstraction, the validity of OUD diagnoses in the medical record ranges from fair to good38–41 and depending on which elements of the medical chart are used to count toward an OUD diagnosis, the agreement between medical record and diagnoses is 80% or better. However, this does not distinguish between primary prescription OUD versus other OUD types such as heroin use disorder.
Our study did not use a pure data mining approach. We selected potential predictors of OUD based on theory or previous literature. Further research is needed to compare the utility of predictive algorithms that are completely data driven and those that are developed with user input.
Conclusions
Our results point to modifiable prescribing behavior as the key contributor to OUD. Replication in other healthcare systems is needed and comparisons to data driven models warranted. Overall, results hold promise that machine learning models can reasonably predict OUD and could be incorporated in the electronic health record as a clinical decision aid.
Supplemental Material
Supplemental Material - Predicting opioid use disorder before and after the opioid prescribing peak in the United States: A machine learning tool using electronic healthcare records
Supplemental Material for Predicting Opioid Use Disorder before and after the Opioid Prescribing Peak in the United States: A Machine Learning Tool using Electronic Healthcare Records by Tyler J. Banks, Jeffrey F. Scherrer, Tung D. Nguyen, Jeffery K. Uhlmann, and Satish S. Nair in Health Informatics Journal
Footnotes
Acknowledgements
We thank Joanne Salas for her help with navigating the VA data extraction process and the personnel at Harry S. Truman Memorial Veterans’ Hospital.
Declaration of conflicting interests
The author(s) declared no potential conflicts of interest with respect to the research, authorship, and/or publication of this article.
Funding
The author(s) received no financial support for the research, authorship, and/or publication of this article. The views expressed in this report do not necessarily reflect those of the Veterans Administration. This work was supported in part by NIMH grant MH122023 to SSN. This material is the result of work supported with resources and the use of facilities at the Harry S. Truman Memorial Veterans’ Hospital. Because data was de-identified, this work was reviewed and approved by the VA and academic affiliates IRBs as expedited (Veteran’s Administration and University of Missouri # 1212854; St Louis University # 24,172)
Data availability sharing statement
This data is available upon request for 36 months after publication provided the requester has been IRB approved. Interested persons may obtain data following appropriate VA IRB and data access request approvals. The authors may not share data without VA approval.
Supplemental Material
Supplemental material for this article is available online.
References
Supplementary Material
Please find the following supplemental material available below.
For Open Access articles published under a Creative Commons License, all supplemental material carries the same license as the article it is associated with.
For non-Open Access articles published, all supplemental material carries a non-exclusive license, and permission requests for re-use of supplemental material or any part of supplemental material shall be sent directly to the copyright owner as specified in the copyright notice associated with the article.