
Abstract
The study and early detection of breast cancer are key for its treatment. We carry out an exhaustive analysis of the most used database for mastology research with infrared images, analyzing the anomalies according to five quality dimensions: completeness, correctness, concordance, plausibility, and currency. We established control queries that looked for these anomalies and that can be used to ensure the quality of the database. Finally, we briefly review the more than 40 papers that use this database and that do not mention any of these anomalies. When analyzing the database, we found 365 anomalies related to personal and clinical data, and thermal images. The errors found in our research may lead to a modification of the results and conclusions made in the articles found in the literature, serve as a basis for improvements in the quality of the database, and help future researchers to work with it.
Introduction
According to the World Health Organization (WHO), breast cancer is the most common cancer in women a and the second most common cancer in the world. b
In some countries screening programs have been set up to detect it, most of which involved periodic mammograms for women after a certain age. 1 However, other countries do not have the economic and technical resources to do this type of monitoring. This fact, together with the disadvantages of mammography (such as radiation exposure), explains the increasing interest in alternative methods for breast cancer early detection.
One of the methods that has gained most popularity is based on the use of breast thermography as a first test. This is because thermography is both, less invasive and cheaper than mammography, and requires less expert knowledge. Advances in modern infrared technology and machine learning capabilities lead to studies that seem to show that thermography can be a medical imaging-based technique for the screening of breast cancer, or at least serve as a complementary test in a more complex screening policy.2–5
Therefore, in recent years many studies have examined whether thermal images can detect breast cancer; see, for instance, 6 and references therein.
Several breast thermogram databases have been created. However, currently we only know two public projects developing breast thermogram databases, the Proeng project c and the Department of Biotechnology-Tripura University-Jadavpur University (DBT-TU-JU) breast thermogram database. 7 Although, as far as we know, the DBT-TU-JU database is not publicly available yet, as it is stated in the webpage of the project. d
The Database for Mastology Research with Infrared Image (DMR-IR), developed by the Proeng project, was the first breast thermogram database created for classification tasks, and is the most used to date,8,9 as it is the only breast thermogram database publicly available. The main purpose of this database is to store and manage mastologic images, as well as medical records of patients, for the early detection of breast cancer. For that, all patients are classified as healthy or sick.
Interested researchers and health personnel can easily and freely access this database, and use the information available to perform their studies and test their hypothesis. So, nowadays this database is the only source of data to study this topic for many researchers. This is proved by the big number of studies that used it, as we will see in Section Review of studies that used the DMR-IR.
In the case of such an important and delicate issue as cancer, the studies carried out must be rigorous and reliable. Conclusions made from these studies could lead to changes in public policies. Given the high impact of these decisions it is really important to ensure the quality of the database.
To extract useful information, data must be accurate, reliable, and relevant. 10 These desirable features can be expanded into five dimensions that all databases must guarantee: completeness, correctness, concordance, plausibility, and currency. 11 Compliance with each of these dimensions must be measured according to the specific goal for which data was collected. 10 It is usually necessary to implement several data validation procedures to detect and correct errors. 12
In this work, we analyze the quality of the DMR-IR created by the Proeng project according to the five dimensions previously mentioned. We found several anomalies or inconsistencies. We analyzed their possible causes, which, in some cases, allows us to propose possible solutions. This will facilitate the data cleansing process for future researchers. We also review the articles that use this database, mentioning the errors that may affect them.
The structure of the article is as follows. Section Methods and materials introduces the database, explaining its structure and characteristics. Section Analysis of the database exposes all the anomalies found. Next, Section Discussion describes those anomalies, discusses their possible causes and consequences, and proposes possible forms to correct some of them. Finally, Section Conclusions provides the final conclusions of the work.
Methods and materials
DMR-IR 13 is framed within the Proeng project. This project aims to help in the early diagnosis by medical imaging and classification of breast diseases, ranging from the acquisition of images to the application of machine learning techniques. It is a joint project of the Federal Fluminense University (UFF) and the Federal University of Pernambuco (UFPE) of Brazil.
The DMR-IR database is an online database with mastologic images for early detection of breast cancer. It is available, upon registration, in the following link http://visual.ic.uff.br/dmi/. This database consists of a list of patients of the Hospital Universitário Antônio Pedro (HUAP) of the UFF.
The database is anonimized, identifying each patient with a number from 0001 to 0287. The diagnoses are made by mammography or biopsy, classifying the patients as Healthy or Sick.
Each patient is associated to a file which contains personal and clinical data, a set of thermal images together with their thermal matrices (representing the temperature in each pixel), mammographic reports, and biopsies. Neither mammograpphic reports nor biopsies have been performed in most patients, however this is not a problem as the patients are labelled (as sick or healthy), so, this fact does not hinder the analysis of the database.
The thermal images, of size 640 × 480, were collected using a FLIR SC620 thermal camera according to well established static and dynamic protocols. e In the static protocol, five images are obtained: front, right lateral 45°, left lateral 45°, right lateral 90° and left lateral 90°. The dynamic protocol produces 20 frontal sequential images and two lateral images, one right lateral 90° and one left lateral 90°. To obtain this sequence of 20 images, a thermography of the patient is captured every 15 s for 5 min.
As stated in, 13 the acquisition and use of this database has been approved by the Ethical Committee of the HUAP and registered at the Brazilian Ministry of Health under number CAAE: 01,042,812.0.0000.5243.
We analyzed the database according to five quality dimensions proposed by Weiskopf and Weng: 11
In addition, we will consider homogeneity as a transversal quality component of these dimensions to identify coding problems. 14
In 2017 Weiskopf and Weng togheter with Bakken and Hripesak developed a quality assessment guidelines for electronic health record data reuse. 15 In this work they extended the framework they proposed in 2013 11 (with slight modifications) and evaluated it through a set of interviews with clinical researchers. However, they concluded that “the guideline appears to be a promising start, though it requires continual development”. Hence, as the proposed quality constructs (or dimensions) allude to the same concepts in both studies we prefer to use the ones proposed in 2013. 11
Once the quality components were defined, we downloaded all the data from the database, available to download from the PROENG project page.
We had to store a local backup of all the webpages. We used a spreadsheet to store the personal and clinical data, and the same folder structure as the webpage to store the thermal images. We inserted new columns in the spreadsheet to serve as control queries to detect anomalies. Using as basis the quality assessment methods proposed in,
11
we established control queries to check: • • • • •
As there are no other data sources (neither a public dataset dealing with the same problem nor another dataset involving the same patients from this dataset) it was impossible to apply the other two quality assessment methods proposed by 11 (“Gold standard” and “Data source agreement”)
When an anomaly was found, we double-checked it manually with the source of our data, the webpage of the DMR-IR database.
To compare the thermal images, we programmed a Python script to analyze all the files following two-to-two byte level comparisons. We double-checked the findings of our script using Kdiff3 software. f
Analysis of the database
When studying the database, we came up with some anomalies or inconsistencies. The first thing we can see when accessing the DMR-IR database is the patients list. We found four patients (those with identifiers 0001, 0063, 0138, and 0198) which have two entries in this list. Analyzing those patients, we observed that they are the only ones for whom two visits have been registered in the database. Each of the visits resulted in a diagnosis, which allows us to have both diagnoses in the list view. However, we observed an inconsistency in patient 0001 because in her file she was diagnosed as healthy in both visits, while in the list view the diagnosis of her first visit appears as “unknown” (Figure 1). Inconsistency on patient 0001 in the list view of the DMR-IR database.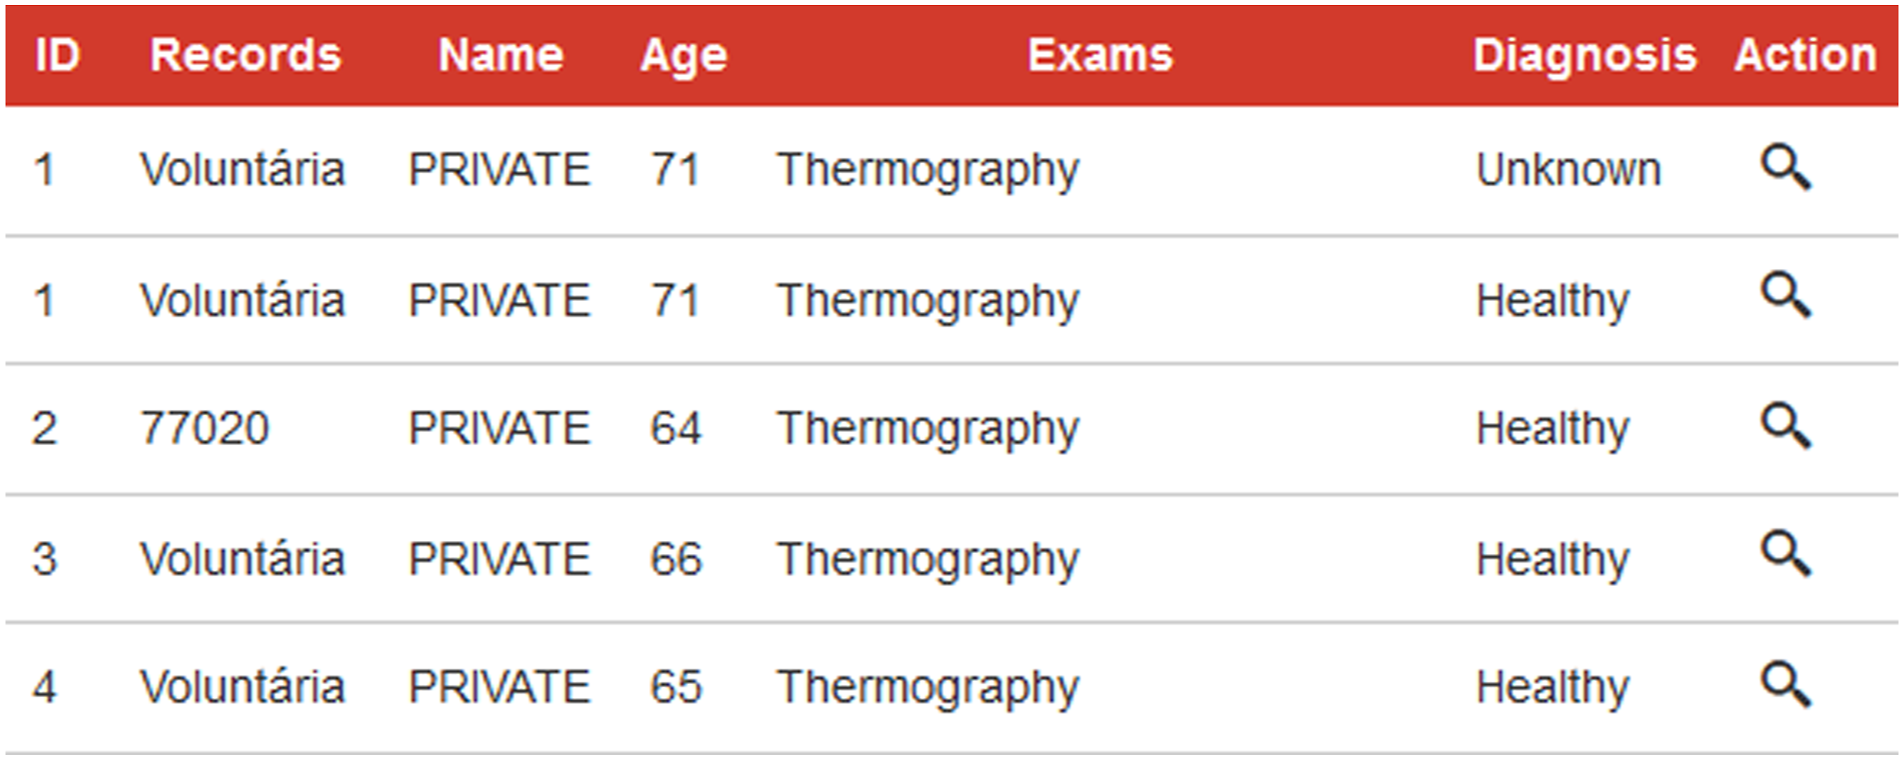
Having analyzed the list view of the DMR-IR database, we focused on patients’ files. We observed a lack of homogeneity and completeness in the personal and clinical data. The main homogeneity problem is that depending on the patient and field, the language in which the information was introduced could vary between English and Portuguese; e.g., marital status was defined by four states: “single” or “solteira”, “married” or “casada”, “divorced” or “divorciada”, and “widow” or “viuvo”.
Another homogeneity problem is related to temporal milestones (such as the field “Last menstrual period”). We can find the information encoded as the age of the patient when achieving that state (or even an approximation), the number of years since this state was achieved, the cause of achieving that state (for example, “did hysterectomy”) or the date of the milestone. We also observe at least six different ways of codifying dates (without taking into consideration the language in which the month was written), yyyy, dd/mm/yyyy, mmmm of yyyy, dd/mm, mm/yyyy, and mmmm/yyyy following Excel’s encoding format. g
We found that the age of the patients is updated each year (see Figure 2). So, the age on the patient’s file is the woman’s current age (if still alive). In order to homogenize some temporal milestones, we had to compute the age of each patient at the time of her visit. Hereinafter, when we talk about the age of patients, we will refer to their age at the time of the visit. File of patient 0147, whose age was 119 years old in December 2019 (1) and 120 years old in February 2020 (2).
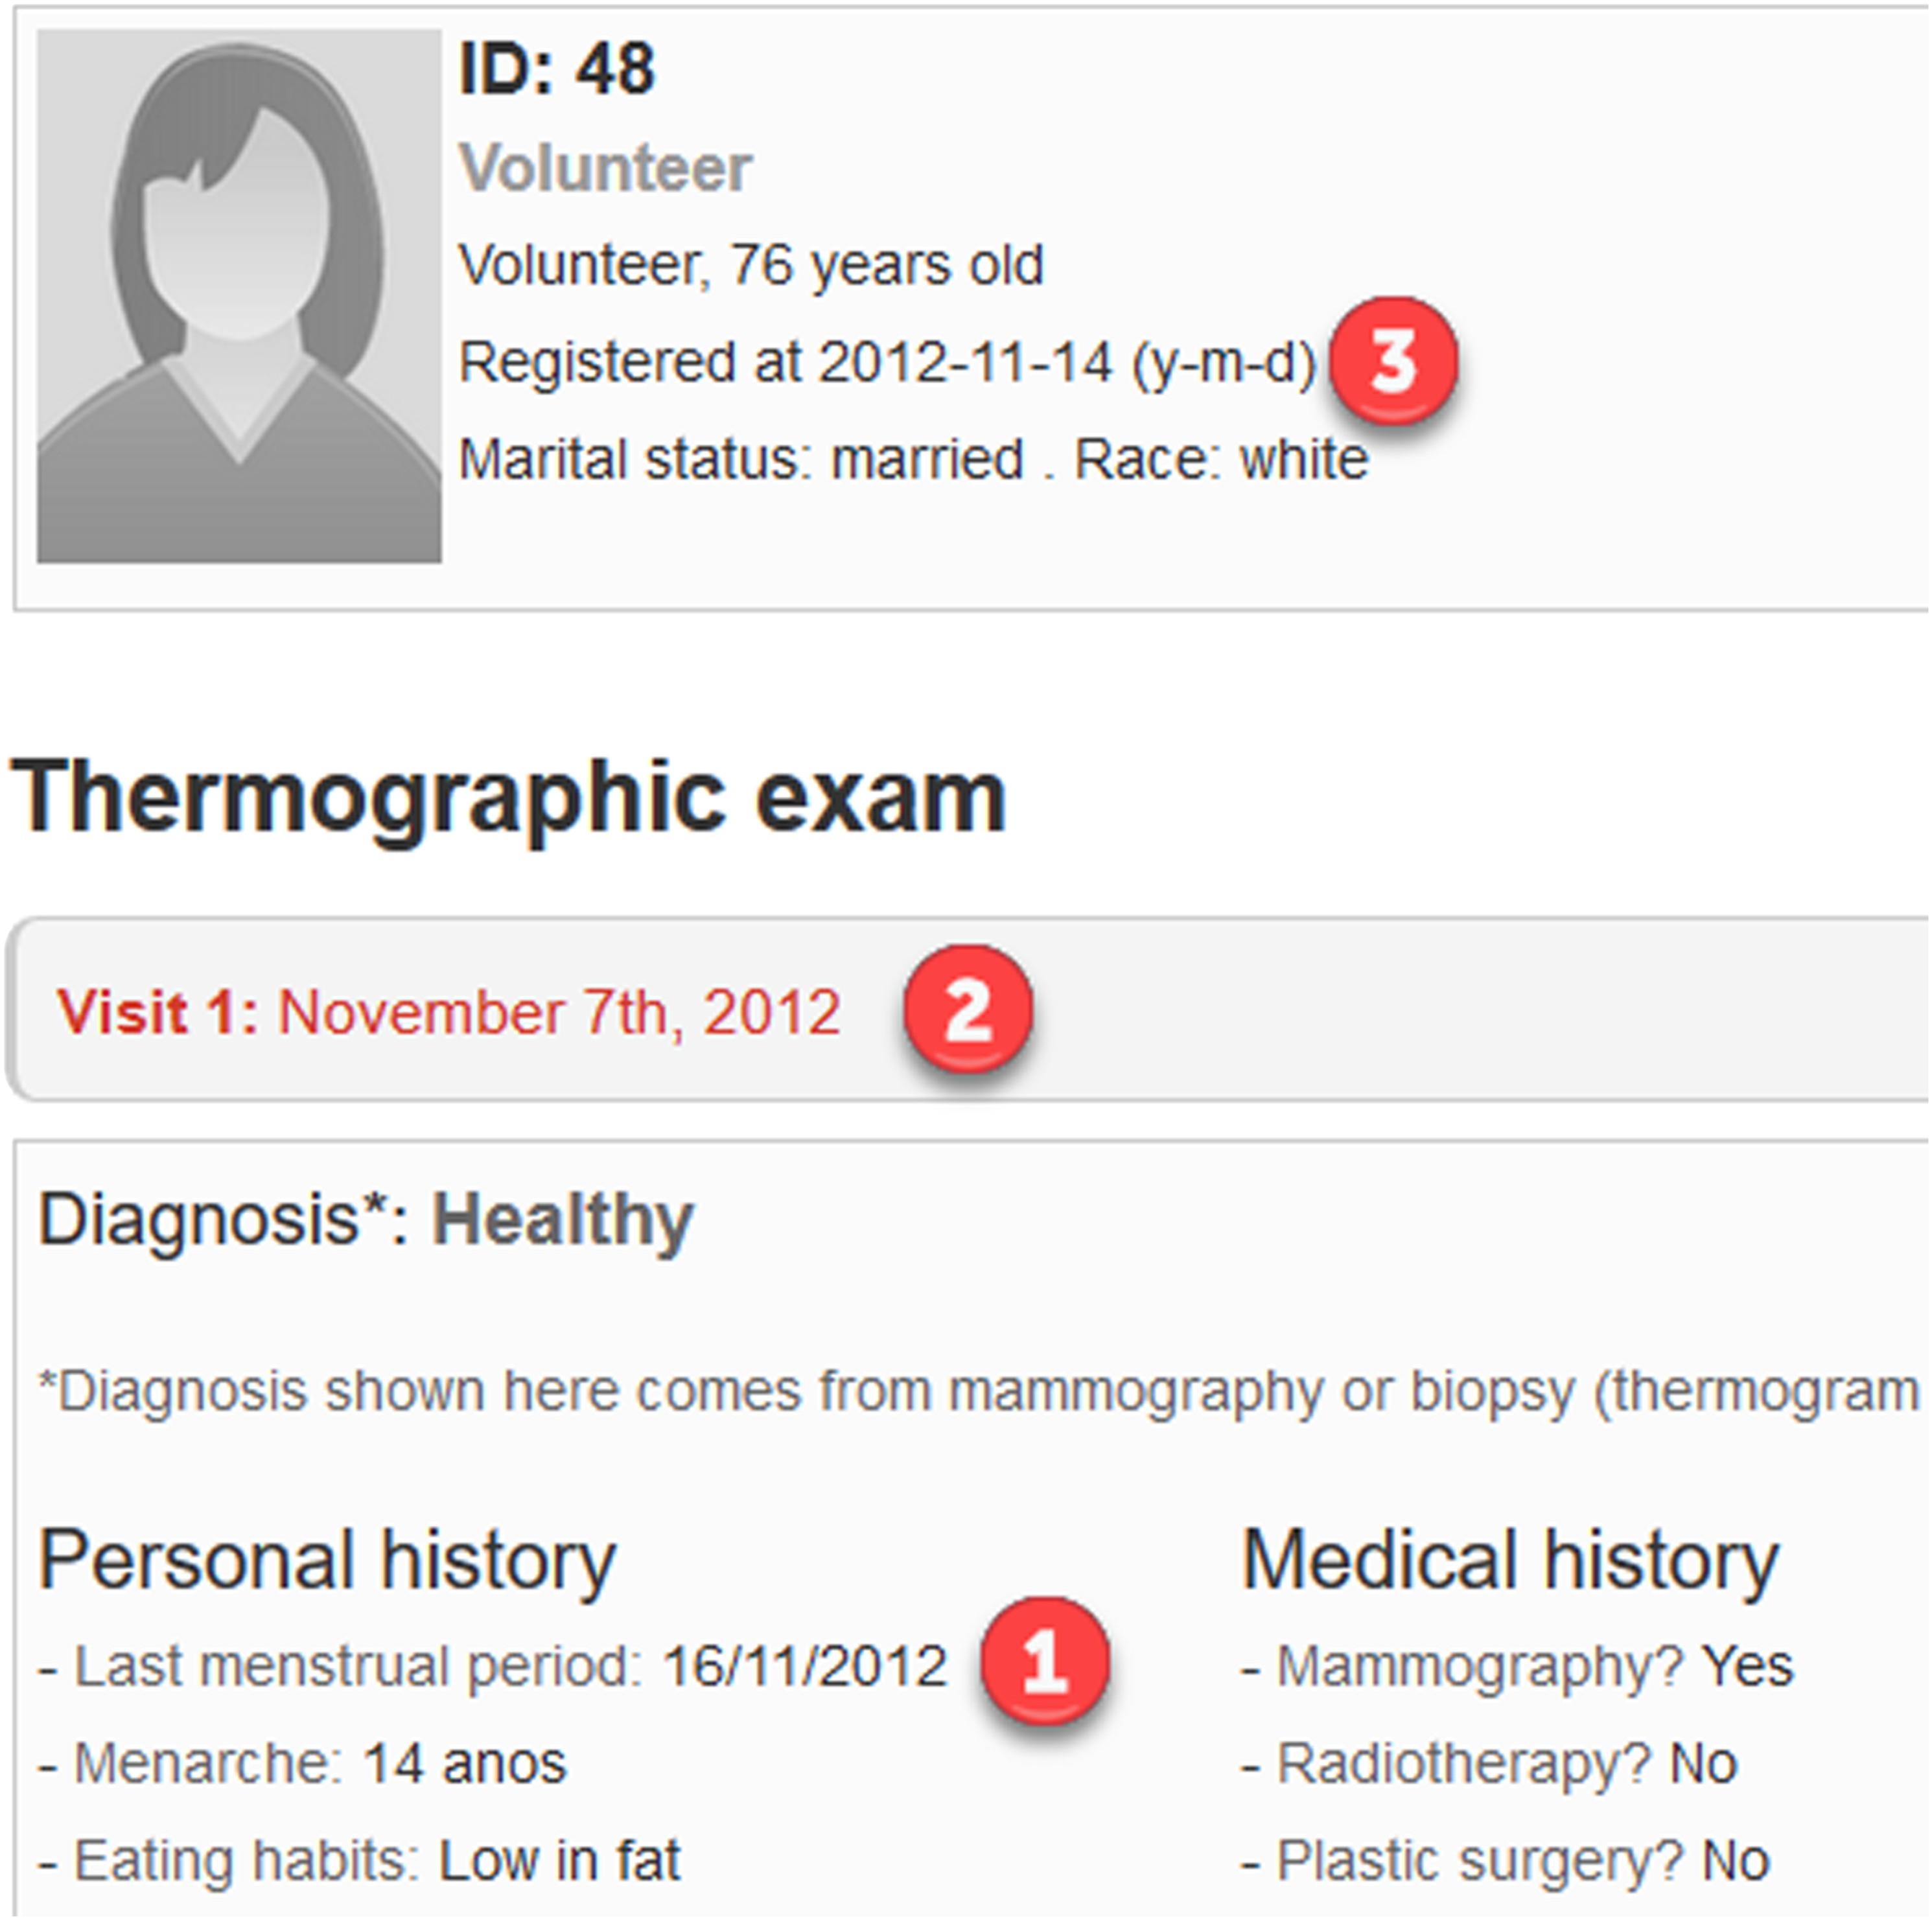
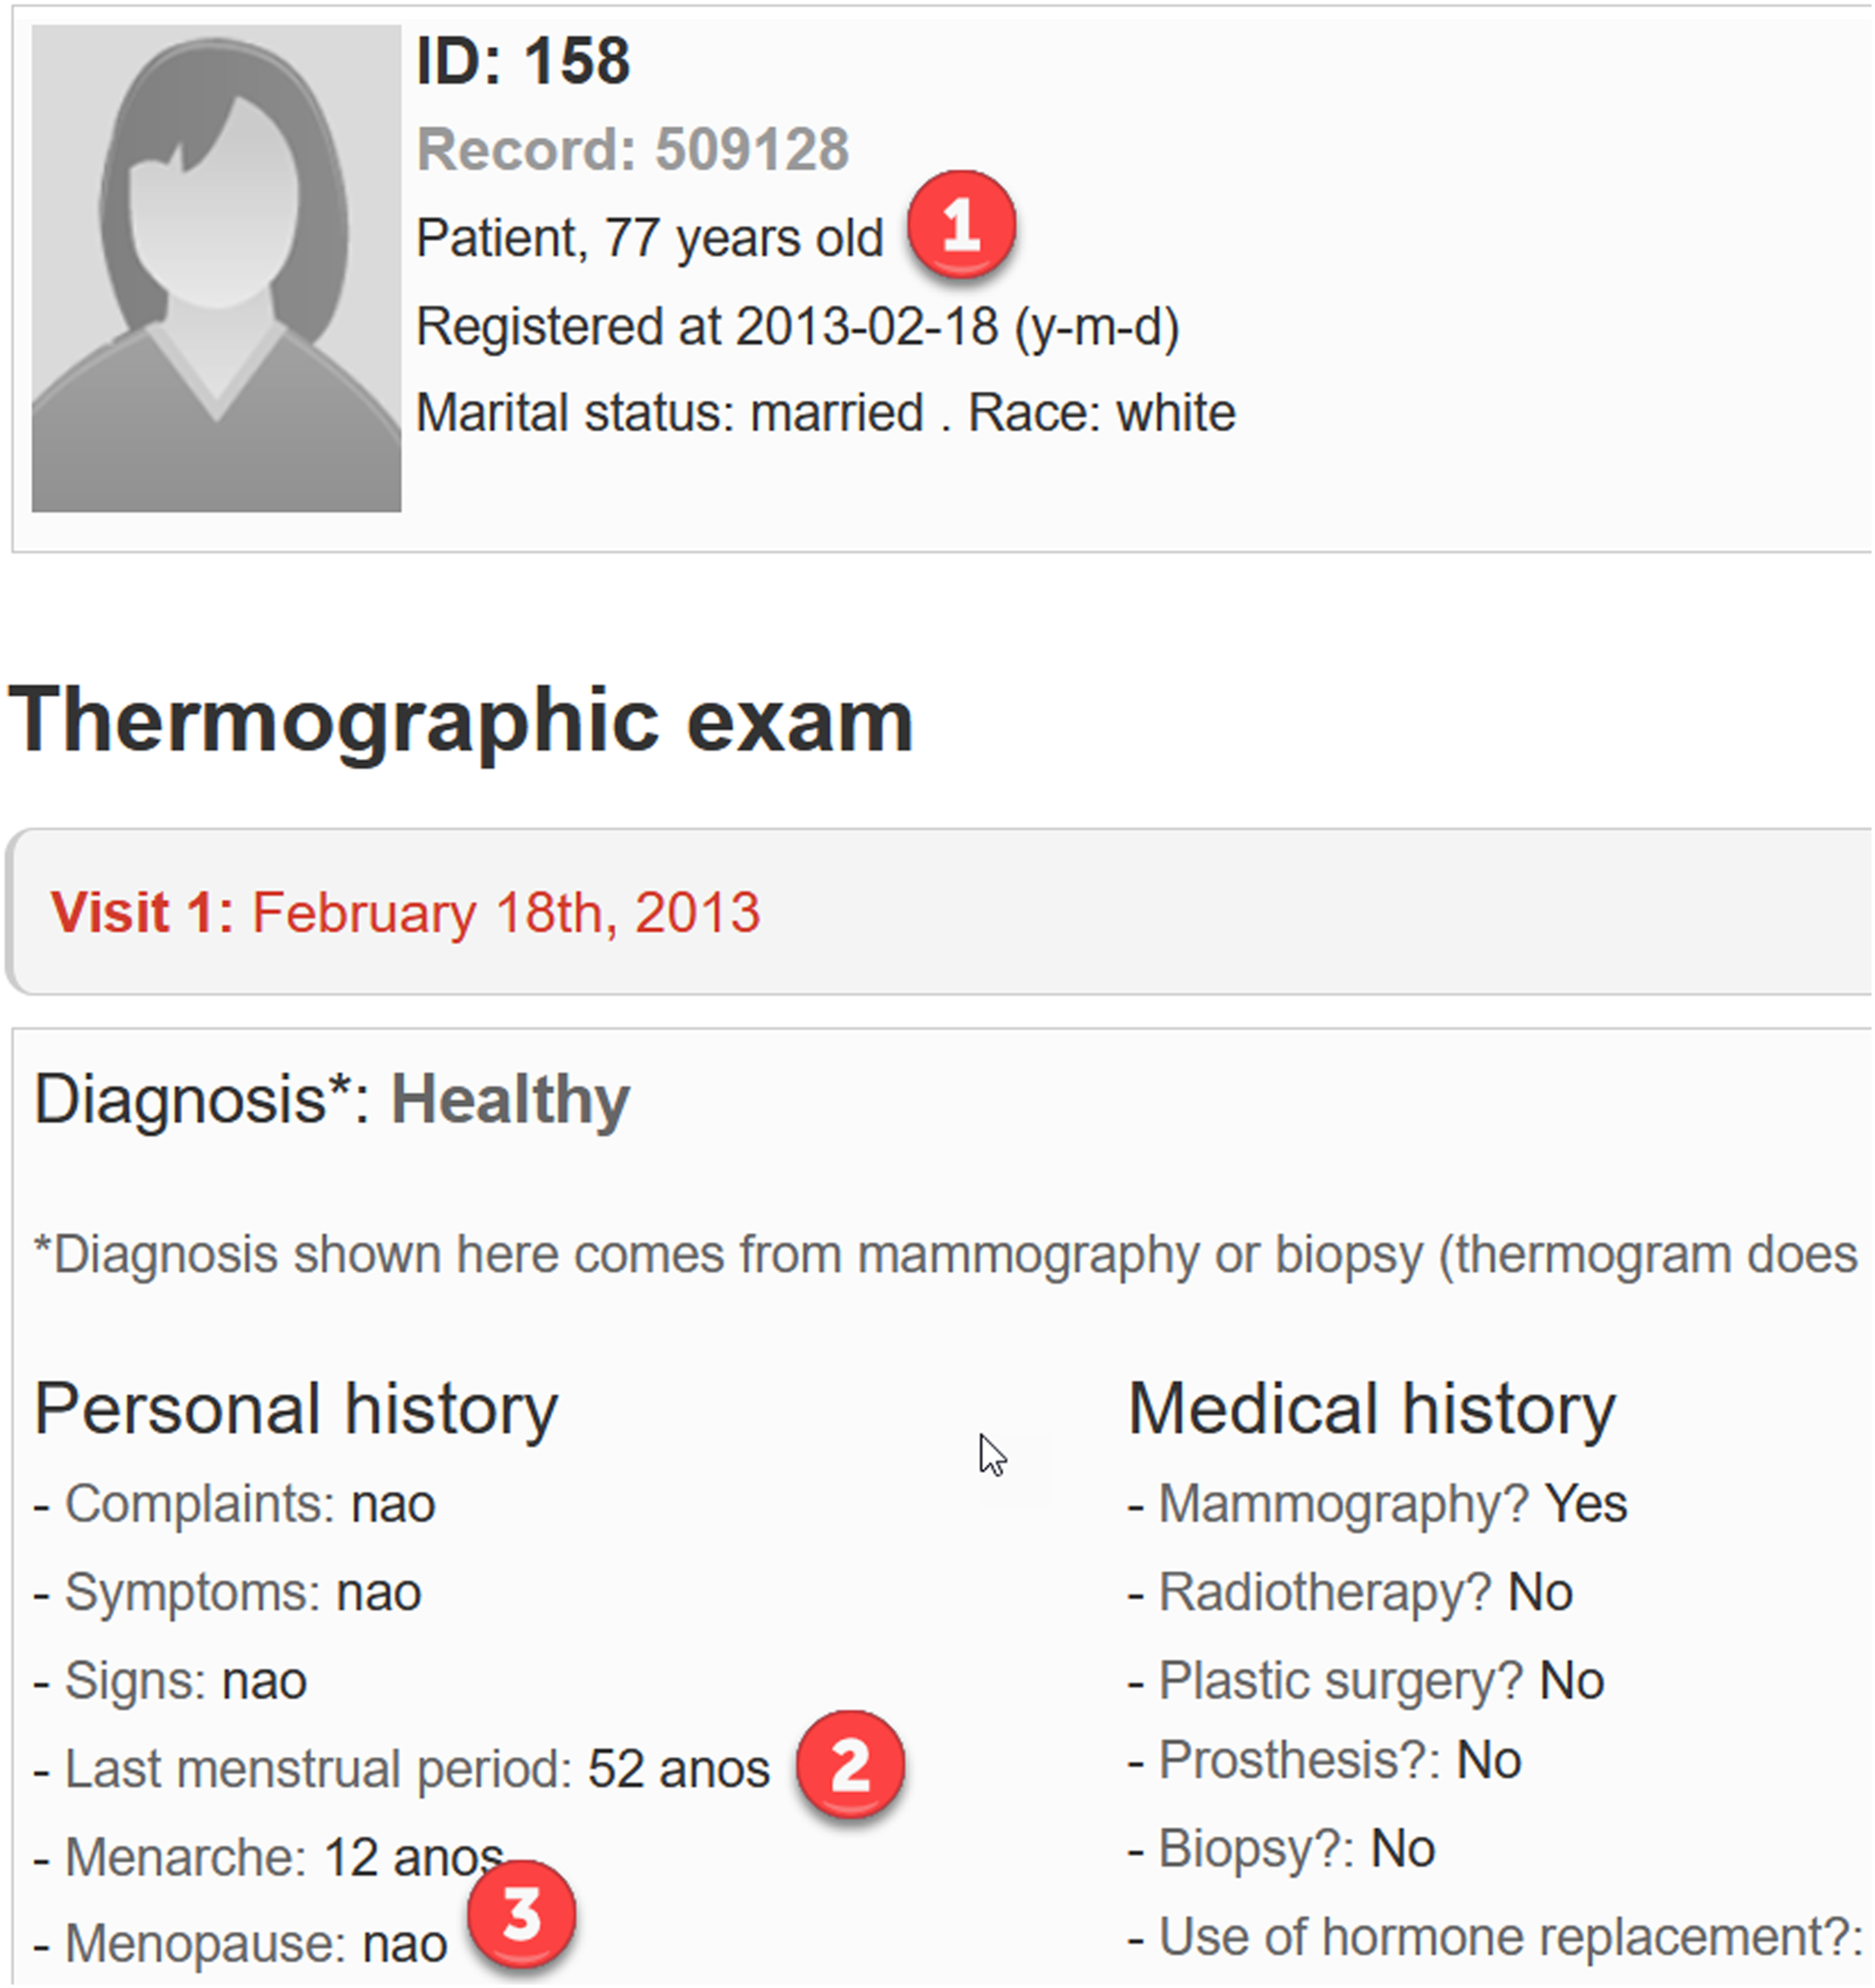
Regarding the plausibility of the patient files we found 18 anomalies: • In her first visit, the menarche of patient 0063 is registered at the age of 45, while in the second visit it was at the age of 15. • The menarche of patient 0216 is registered at the age of 27, however, the age of menarche ranges from 9 to 18 years approximately. • The menarche of patient 0267 is registered at the age of 42 while her menopause is registered at the age of 12. • The date of the last menstrual period of patient 0261 is more recent than the date of her menopause. • There are two patients older than 60 years old that still had registered menstrual periods. Patient 0048 had her last menstrual period at 68 and patient 0211 at the age of 113. • There are two patients with discrepancies between the dates of registration, visit, and last menstrual period. Normally the date of registration should be posterior to the date of the visit, which in turn should be posterior to the date of the last menstrual period of the patient. In spite of that, the visit of patient 0036 was registered in September 2012, while her last menstrual period was in October 2012. The date of the visit of patient 0099 was registered on 9 November 2012 while her last menstrual period was registered on 12 November 2012 (3 days later). Moreover, the last menstrual period of patient 0048 was registered on 16 November 2012, 9 days after her visit and 2 days after her registration date in the database (see Figure 3). • Patients 0147 and 0211 were 113 years old in 2013. • There are seven patients who, despite having a negative diagnosis of menopause (their respective fields were filled in as “nao”), should have menopause because, at the time of their visits, the time since their last menstrual periods was considerably longer than 1 year (with values from 4 to 36 years). For example, Figure 4 shows an anomaly in the diagnosis of menopause of patient 0158, who should have been 71 at the time of her visit (77 in 2019) and had her last menstrual period at 52. File of patient 0048, whose last menstrual period was registered on 16 November 2012 (1), 9 days after her visit (2) and 2 days after her registration date (3). File of patient 0158, who was 70 years old in 2013 (77 years old in 2020) (1), had her last menstrual period at 52 years (2), and was diagnosed as non-menopausal (3).
As mentioned before, we performed a byte level comparison of all the images, analyzing mammograms and thermograms separately. We found the following issues with mammograms, resulting in two anomalies: • The mammography of the left breast of patients 0045 (M0045.LEFT_CC.2010-08-05.00.jpg) and 0130 (M0130.LEFT_CC.2013-10-17.00.jpg) are exactly the same image. • Patient 0279 has exactly the same mammography in two different exams for different breasts; i.e., the mammography of her left breast taken for the exam performed on 4 May 2017 (M0279.LEFT_MLO.2017-05-04.00.jpg) is exactly the same image as the mammography of her right breast taken for the exam performed on 30 July 2015 (M0279.RIGHT_CC.2015-07-30.00.jpg).
From the comparison of the thermal images we obtained the following results, yielding 345 anomalies: • Despite having different medical records, patients 0090 and 0091 have the same thermal images; i.e., all the thermal images are exactly the same pictures for both patients. The same happens with patients 0153 and 0154. • Patients 0104 and 0105 have the same thermal images except for their frontal static ones. • Patients 0189 and 0193 have the same thermal images except for their left lateral 90° static ones. • Patients 0162 and 0163 have the same thermal image for their right lateral 45° static ones. • The frontal static thermal image of 111 patients matches with their first frontal dynamic thermal image. Moreover, 110 of these 111 patients have the same images for their right and left lateral 90° images, in both the static and dynamic representations. • Some patients have two consecutive dynamic thermal images that are exactly identical. The first and second frontal dynamic thermal images of patient 0246 are exactly the same. This is also true for her third and fourth, and her fifth and sixth thermal images. With patient 0030, the 15th and 16th thermal images are identical.
Having detected this errors we performed a second analysis, flipping all the images horizontally and comparing all those images with the original ones. This analysis did not result in new inconsistencies and only detected the ones already detected in the first analysis.
Discussion
As we mentioned before, when creating a database it is important to follow quality standards that guarantee the consistency and reliability of the information contained. Our analysis detected several anomalies in the DMR-IR database focusing on the five dimensions proposed by: 11 completeness, correctness, concordance, plausibility, and currency.
Ensuring the quality of data is a critical step in all analysis to avoid “garbage-in-garbage-out” problems. When a system is fed with untrusted or not plausible data, results are not going to be plausible either. Also, some machine learning techniques, such as CNNs, are not able to work with missing values (derived from a lack of completeness) and it is necessary to apply imputation techniques which introduce more uncertainty into the system.
When using a database to conduct an investigation, the first step is always to cleanse it. However, in most cases, this is not an easy task and in order to detect errors, anomalies or inconsistencies, it is necessary to carry out a very exhaustive and systematic analysis of the data. It is not enough to only examine the information that is of interest for the study, since a major anomaly in other piece of data can lead to the elimination of the complete element (for example, the 113-year-old patients).
The analysis and cleansing of this database has been quite complicated due to the wide range of anomalies found, which has forced us to analyze minutely all the data types contained within it. This idea is reinforced by the fact that none of them are mentioned in the articles that use this database. Therefore, it is reasonable to assume that they have not been found previously.
Not all the anomalies we detected are necessarily errors; for example, the lack of homogeneity and completeness makes the queries and data analysis more difficult. The encoding of results, if possible choosing the right data collection method, can help us to analyze the data and perform some automatic checks to ensure the quality of the database.
Within anomalies that are clearly errors, we can distinguish between those which are solvable and those which are unsolvable, at least for researchers that did not form part of the original team. For example, if we determine that there was a mistake introducing the age of the menarche in the first visit of patient 0063 (45 years), we can fix it using the information given in the second visit (15 years). Other errors cannot be fixed by people other than the original team who created the database or who introduced the data. It could be possible to fix some of those problems using the original records collected from the visits of the patients. As the registration of the data was made in most cases days after the visit of the patient, we can assume that the interviewers collected the information of the patients in another way, before introducing those data in the database.
As we said in Section Introduction, the quality of data must be measured according to the specific goal for which those data was collected. 10 For this reason, each of the studies which use this database should be considered separately in order to understand which anomalies and inconsistencies may affect their results.
However, replicating the experiments would require having all the models and procedures used by the different research groups. For example, for those articles that applied neural networks we would need the exact list of patients included in the different sets: training, test and validation. As that was not feasible, we are going to interpret the results obtained from a global point of view, and then we will mention the possible effects of those errors.
Interpretation of the results
We found some concordance errors in the database that seem to be mistakes when entering the data into the system; for example, the inconsistency in the age of menarche of patients 0063 and 0267. As we will see in section A proposal to fix some anomalies in patient files in the DMR-IR database, these errors can be easily fixed.
Other concordance errors are impossible to fix without more information; for example, patients with discrepancies between the dates of registration, visit, and last menstrual period. Different fields that offer the same information can be used for validation purposes, implementing tests that guarantee the quality of the database.
As said before, when the purpose of the database is to conduct a study it is necessary to lock the database. 12 We considered the update of the ages a currency error because it could lead to a misinterpretation of the information.
We found some plausibility issues that may or not result from correctness errors. Some of the anomalies we found could be possible but we believe they must be explained; for example, late menarche and late menopause can be explained by specifying a pathological disease. With the data provided we cannot know if the data are correct or if an error occurred when entering the data; for example, suppose that there was a typo introducing the age of patient with late menarche (at age 27) and it was really at age 17.
Other anomalies are impossible by definition and can be classified as correctness errors; for example, patients that still had menstrual periods after their menopause. Once menopause is diagnosed, any vaginal bleeding is cataloged as postmenopausal metrorrhagia (not as a menstrual period), and should be analyzed carefully. If the team use this field with this purpose, it must be explicitly defined to avoid mistakes.
According to the Gerontology Research Group, h there were only 11 women aged 113 in 2013, and none of them was Brazilian. It is unlikely that any of those women participate in this study, so there might be an error when introducing the age of these patients.
When analyzing thermal images and mammograms we found several errors. All the coincidences between different patients, different visits, and/or different breasts were classified as correctness errors.
The coincidences between static thermal images and dynamic thermal images are not necessarily errors. However, static and dynamic protocols were defined in 13 as two different procedures, without specifying the possibility of overlapping in any document. In addition, this overlap occurs only in a subset of the patients, so it is important to define when it is possible to merge the protocols to standardize the procedures in different patients.
However, the coincidence between two consecutive dynamic thermal images are necessarily errors. The dynamic protocol specifies that there was an interval of 15 s between dynamic thermal images, 13 so this coincidence may not be possible.
A proposal to fix some anomalies in patient files in the DMR-IR database
Although most of the anomalies detected in patient files are hard or impossible to fix (as discussed in Section Interpretation of the results), there are some steps we can follow to improve the quality of the data: • Translate all the fields which are in multiple languages to English. • Convert all the dates to the same time format to be able to perform comparisons between them. • Calculate the ages of the patient: at her visit, at her last menstrual period, at her menarche, and her menopause. Those ages can be used to build quality checks in our data. • Swap the ages at menopause and last menstrual period of patient 0261, and the ages at menopause and menarche of patient 0267. • Fix the age at menarche of patient 0063 with the one registered in her second visit. • Remove those patients with severe inconsistencies, such as patients that were 113 years old in 2013 (patients 0147 and 0211). • Remove those patients with duplicated thermal images, such as patients 0104 and 0105. • Remove the duplicated dynamic thermal images of the same patient.
Finally, patients which are uninformative for a specific research question can be removed. For example, if the purpose of a study is to analyze the impact of one specific feature of the clinical data in the temperature of the thermal images, those patients without thermal images or that specific clinical piece of data could be removed from the study.
Review of studies that used the DMR-IR
In this part of the paper we briefly review the studies that use the DMR-IR database and may be affected by the anomalies or errors presented in Section Analysis of the database. Although it is not possible to quantify the impact of the anomalies in the studies found, mainly because we do not know which patients have been used, it is reasonable to assume that, if they have not been detected, they may affect the accuracy or reliability of the results of those articles that used these databases, and consequently the conclusions reached. Finding these anomalies and solving them, for example, eliminating patients with repeated images, can lead to more reliable and robust results and conclusions, which allow researchers to generalize the methods or models proposed for new data.
As far as we know, none of the articles analyzed mention these anomalies at any time, except 16 which applies the fixes proposed in the previous section, removing all the anomalies detected in the DMR-IR database. As we are not able to know whether the database has changed, they may or not affect the results achieved in those articles.
The main problem derived from this database is the presence of duplicated thermal images, since it could affect almost all the articles found. This may lead to a lack of correspondence between the effectiveness of the designed method and the conclusions emerging from the studies. In articles that use deep learning techniques, repeated patients combined with the small size of the database may make it difficult for the model to generalize beyond the database itself, for which, however, good results can be achieved.
Almost all of the articles analyzed17–48 used frontal static thermal images for their experiments, so they may suffer from duplicated images. In addition, articles38,39 also used some of the lateral static ones, which may increase the number of duplicated images.
Some studies40–42,47,48 used both frontal static and dynamic thermal images. In addition, to the duplicity of static images previously discussed we must consider the duplicity of the first frontal dynamic thermal image with the static one and the duplicity of two consecutive dynamic thermal images. This is a large number of repeated images that, if not taken into account, can seriously alter the results obtained.
There are studies,49–57 that use the frontal thermal images without specifying if they are the static or the dynamic ones (or both). In these cases, the duplicity of two consecutive dynamic images, or between a static and a dynamic image, may affect the results.
Other articles58,59 restrict their study to the dynamic sequences. In these cases, apart from the duplicated patients, the experiments would be affected by the duplicity of two consecutive dynamic thermal images. These studies used temporal series or thermal signals to study the sequences and take a considerably large number of patients for the experiments. Given the low number of patients affected by this anomaly (only two), we estimate that it will not greatly affect the results achieved.
Finally, as the articles43,44 do not specify how they use the database, we cannot determine whether the anomalies detected affect them or not.
Regarding the other problems exposed, we have found no articles that use either the mammographies or the clinical and personal data, apart from the age of the patients to select an age range to work with (and none of them take the 113-year-old patients). Hence, the possible problems derived from these anomalies may not affect the results of the research.
Summary of possible anomalies or errors that may affect the aim of the articles found.
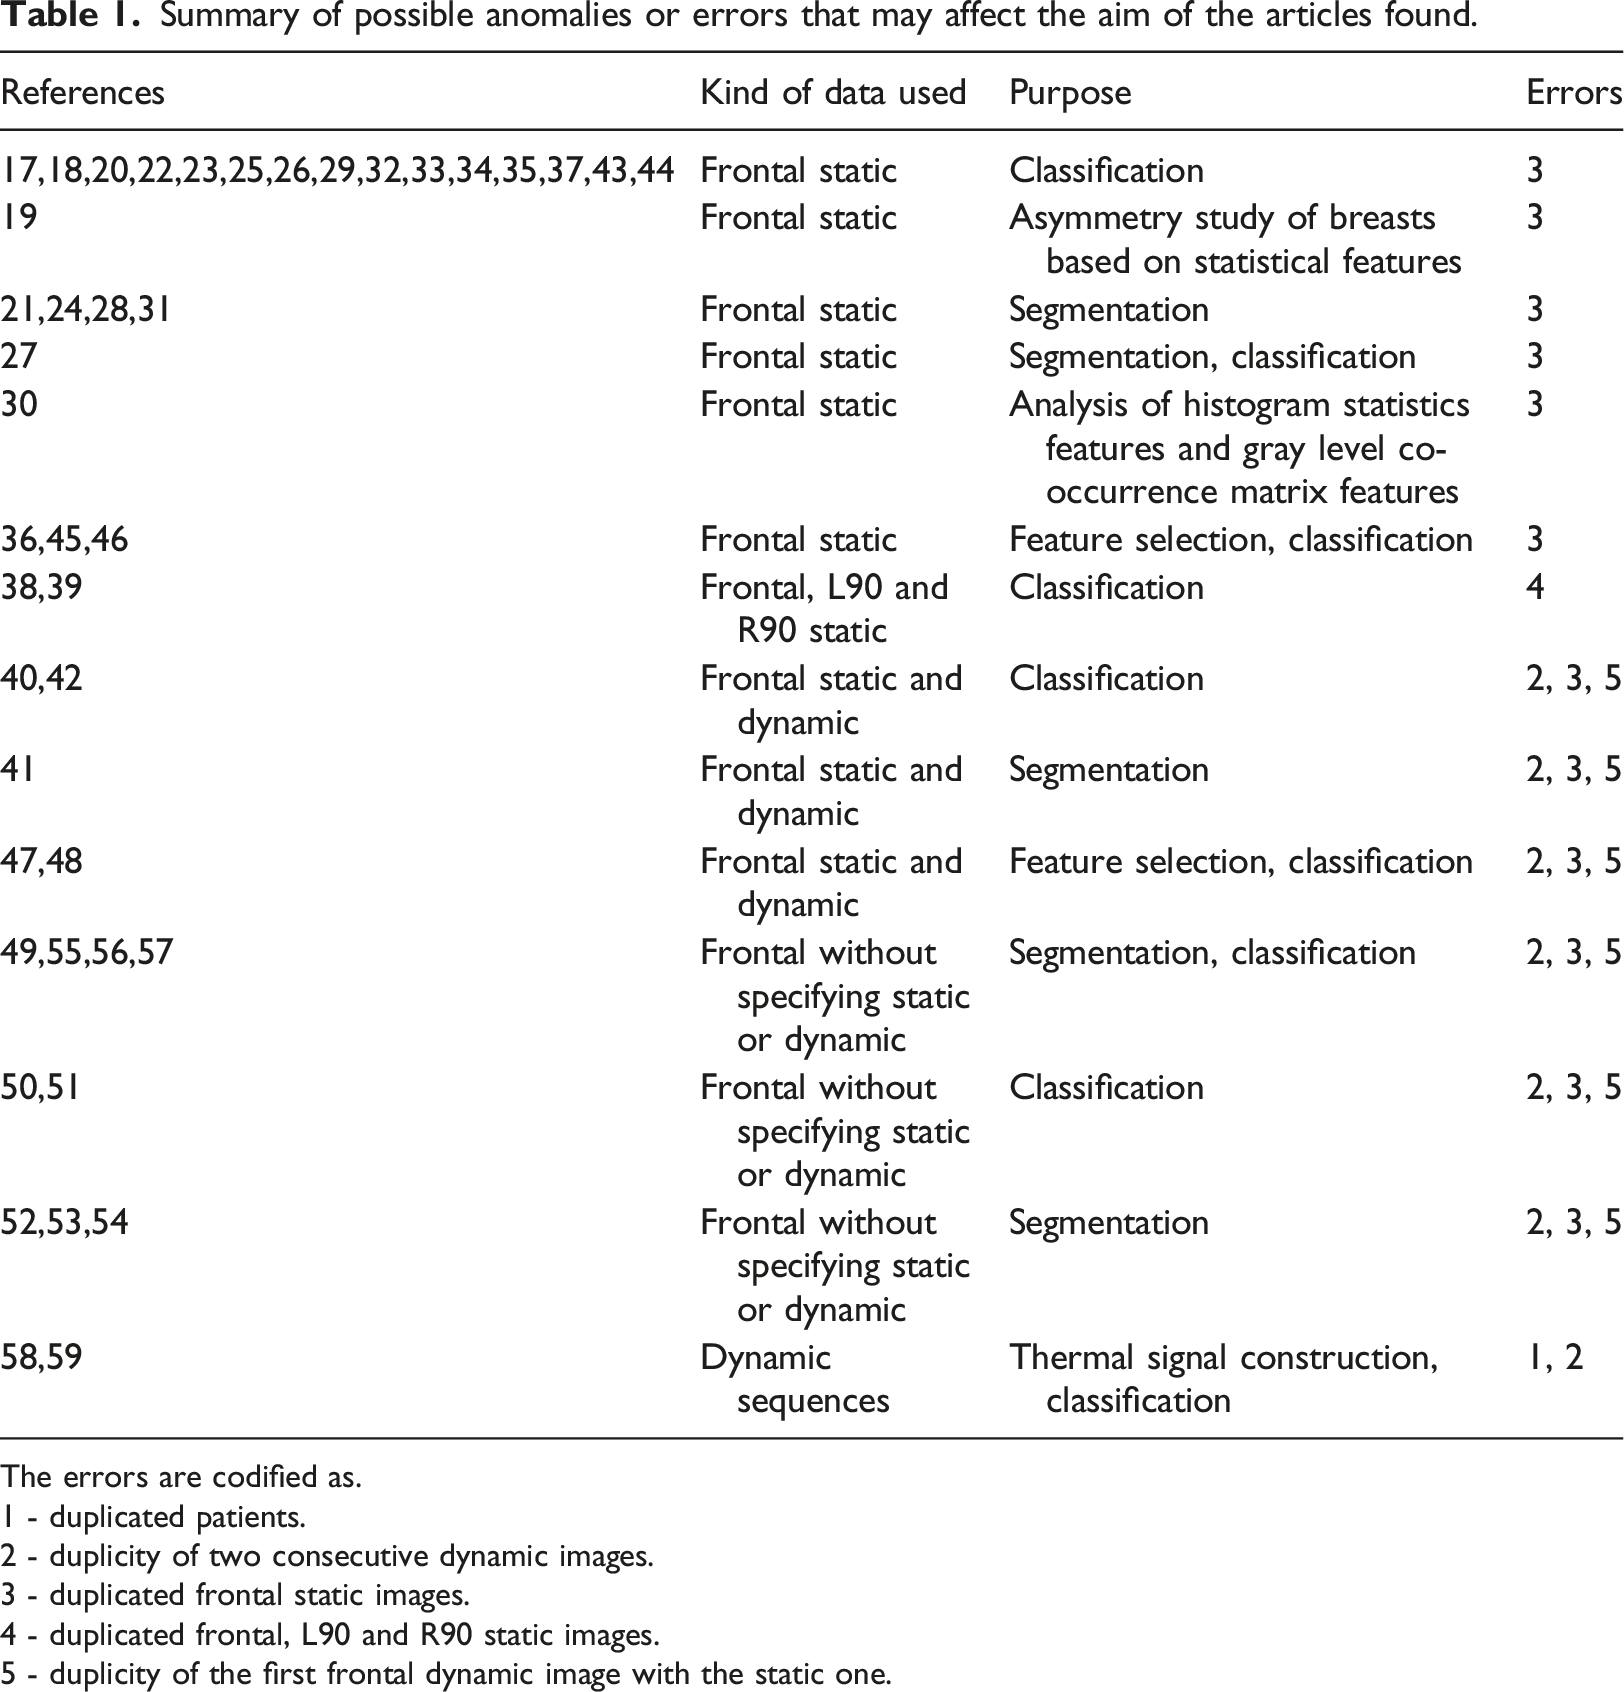
The errors are codified as.
1 - duplicated patients.
2 - duplicity of two consecutive dynamic images.
3 - duplicated frontal static images.
4 - duplicated frontal, L90 and R90 static images.
5 - duplicity of the first frontal dynamic image with the static one.
Conclusions
When making a decision it is important to evaluate the uncertainty and consequences of each alternative. Misleading information, extracted from poor quality data, could lead to structural changes with important consequences. When the impact of the analysis is high as in breast cancer detection, it is important to reduce the uncertainty, for example by ensuring the quality of data and the methods used to extract the useful information given to the decision maker.
For this reason, we strongly encourage authors of databases, specifically to the authors of the DMR-IR database, to include control queries, as the ones proposed in Section Methods and materials, to ensure the quality of the database. These control queries, based on the quality assessment methods proposed by Weiskopf and Weng, also allow checking the quality of the new information entered in the database. Control queries should be implemented at all the stages of the information collection and storage process and not only at the database; for example, they can also be implemented in the forms where the information is entered for the first time, using available tools to restrict and homogenize the input data according to the expected information in the database. Ensuring data quality is synonymous with ensuring better and more reliable research.
The DMR-IR database is the only open breast thermogram database created for classification tasks, and the most widely used. The anomalies detected in that database (mainly the duplicated thermal images) may lead to results that do not reflect reality. In other words, the designed models overfit the database, obtaining better or worse results on it, but they may not be generalizable to other settings.
Although this database includes personal and clinical data, we found no studies which use it to improve their classification models, maybe due to the hard work required in the data cleansing. Some of these data are risk factors that increase the probability of suffering from breast cancer and are related to 20% of diagnosed cases. 60 Including this information could enhance the performance of the classification models.
All anomalies that we found during our study are still valid in January 2021 and may affect more that 40 articles. As we said in Section Discussion, we cannot know what changes the database has undergone since its inception, so it is impossible to determine with certainty how our results affect the studies that used this database.
Finding and solving (as far as possible) the anomalies found in this work is a critical step and we hope that this study will help future researchers to work with this database.
Lastly, we want to thank Proeng project for their effort in building and maintaining an open database for research purposes. Transparency of databases has several advantages for scientific progress, making it possible to replicate results, to collaborate in the improvement of techniques and methods, and to detect and correct possible errors. Although the reproducibility is one of the basic tenets of the scientific method, clinical databases are almost never publicly available.
Concerning future improvements of the database, further information regarding, for instance, the location and size of tumor in the breast could be added to the database. This would allow the development of more precise tumor detection algorithms.
Finally, regarding future work, once the database is cleansed new studies should be conducted in order to analyze the diagnostic capability of thermography. Given that the DMR-IR database includes different views of each patient, together with their personal and clinical data, it will be also interesting to analyze the predictive capability of machine learning models using different kind of data.
Footnotes
Acknowledgements
The authors would like to thank I. P. for his helpful comments which resulted in an improvement of the preliminary manuscript. They also gratefully acknowledge all the experts that helped to improve the quality of this work.
Declaration of conflicting interests
The author(s) declared no potential conflicts of interest with respect to the research, authorship, and/or publication of this article.
Funding
The author(s) disclosed receipt of the following financial support for the research, authorship, and/or publication of this article: This work was partially supported by the grant TIN2016-77206-R and PID2019-110686RB-I00 of the Spanish Government. Also, the second author received a postdoctoral grant (PEJD-2018-POST/TIC-9490) from the Comunidad de Madrid (Spain), co-financed by the Youth Employment Initiative of the European Social Fund.