
Abstract
Gliomas are the most common central nervous system tumors exhibiting poor clinical outcomes. The ability to estimate prognosis is crucial for both patients and providers in order to select the most appropriate treatment. Machine learning (ML) allows for sophisticated approaches to survival prediction using real world clinical parameters needed to achieve superior predictive accuracy. We employed Cox Proportional hazards (CPH) model, Support Vector Machine (SVM) model, Random Forest (RF) model in a large glioma dataset (3462 patients, diagnosed 2000–2018) to explore the most optimal approach to survival prediction. Features employed were age, sex, surgical resection status, tumor histology and tumor site, administration of radiation therapy (RT) and chemotherapy status. Concordance index (c-index) was employed to assess the accuracy of survival time prediction. All three models performed well with prediction accuracy (CI 0.767, 0.771, 0.57 for CPH, SVM, RF models respectively) with the best performance achieved when incorporating RT and chemotherapy administration status which emerged as key predictive features. Within the subset of glioblastoma patients, similar prediction accuracy was achieved. These findings should prompt stricter clinician oversight over registry data accuracy through quality assurance as we move towards meaningful predictive ability using ML approaches in glioma.
Introduction and background
Survival prediction in Glioma – a clinical necessity
Gliomas are the most common central nervous system tumors. Gliomas are typically managed by maximal safe resection followed by radiation therapy, chemotherapy or in rare cases observation depending on the histology and clinical context.1–3 The survival of glioma remains overall extremely poor with a 5-years overall survival less than 35%. 4 The ability to estimate prognosis is crucial for both patients and providers in order to select the most appropriate treatment that is sufficiently aggressive to allow for tumor control while minimizing adverse long-term effects on normal tissue. Clinicians also consider prognosis in order to appropriately de-escalate treatment. When prognosis is poor, emphasis should be placed on patients’ quality of life and best supportive care. Multiple attempts have been made to design robust scoring systems predictive of outcome for both low 5 and high-grade glioma.3,6 Survival prediction have mostly relied on clinical parameters (age, Karnofsky Performace Status (KPS), gender) and resection or methylation status as well as statistical models to create prognostic groups.7–9 These survival predictions can lack generalisability secondary to: (1) small cohorts of patients, (2) the inclusion of primarily clinical trial patients and (3) management of patients at tertiary academic centers with extensive expertise versus available options in the real-world. The current approaches present limitations as in the real-world: (1) most glioma patients are treated off study; (2) outside of centers of excellence; (3) do not necessarily benefit from expert pathology review or molecular analysis; (4) significant tumor heterogeneity, health disparities and geographical constraints further undermine the ability to predict survival across settings. Existing evidence already suggests that patients falling outside of these settings may have poorer outcomes10–12 and therefore existing scoring systems may not necessarily reflect their prognosis.
Machine learning for survival prediction in large-scale data sets
Machine learning (ML) can allow for more sophisticated approaches to clinical, molecular and imaging data to predict risk and survival.13–20 Given the rapid growth of large-scale data in this space and acknowledging the unavoidable limitations in data collection, curation and as a result analysis, we aimed to explore the effectiveness of both ML and statistical approaches to predict survival in glioma patients using a set of commonly available clinical features in a real-world evidence cohort. This cohort represents one such glioma dataset representative of a high volume publicly funded system – the BC Cancer registry, including patients of all glioma histological subtypes treated largely off trial over the course of nearly 20 years in the province of British Columbia, Canada. As neuro-oncology increasingly moves to harness such data sets to identify clinically meaningful biomarkers, we anticipate significant growth in the use of ML approaches to data sets of this nature given the potential limitations of the most frequently used approach Cox Proportional hazards (CPH) model when modelling complex interactions as encountered in large-scale oncology data. 21 Considering the distinct pathological and prognostic features of glioblastoma, specific subset analysis was additionally carried out also aimed at patients with a specific histological diagnosis of glioblastoma.
Material and methods
Clinical need for survival prediction
In clinical practice we noted that survival discussion and inquiry into potential survival time by patients and family represented a corner stone of the joint decision-making process between, patient, family and oncologist towards optimal management given a range of options with varying length of treatment, aggressiveness of management and toxicity profile.
Study cohort selection
Based on the clinical need for real-world survival prediction, we intended to cover a wide time period to reflect the data heterogeneity in this patient population and variability over time. As a result, following research ethics board approval, we selected patients with a histologic diagnosis of glioma captured in the BC Cancer Registry who presented to a cancer center in British Columbia between 2000 and 2018, resulting in data from 3907 patients. Patients who received treatment out of province (14) or for whom any of the features necessary for the analysis were not captured (317), were excluded. Only patients with a pathological diagnosis of glioma were included and uncommon glioma histologies with less than 0.5% recorded cases in the dataset were excluded. Overall, 3462 patients were included in the analysis. In keeping with recognised distinctive pathological and prognostic features patients with a specific histological diagnosis of glioblastoma were also analysed a separate subset.
Techniques employed in the analysis
Cox Proportional hazards model
The CPH model is the linear regression model most widely used21,22 in survival studies to predict the risk of an outcome based on multiple variables. 23 We built a CPH model using clinical features in the training data as covariates to allow for comparison of performance accuracy between the most commonly used model and other increasingly employed models.14,21,24–27
Support vector machine (SVM) model
Support vector machine is an increasingly utilised ML algorithm that functions by separating observations into classes26,28 and its use has been described in the context of glioma survival. 29 We optimized a linear SVM classifier through a hyperparameter search to find the best regularization hyperparameter which was used to train the classifier using the entire training set.
Random forest (RF) model
Like SVM, RF is also increasingly utilised for survival prediction.26,30,31 The random forest consists of 1000 decision trees trained using the training dataset. Risk score prediction was the average across all trees in the forest. 25 The importance score of each feature was calculated by the decrease in concordance index if said feature was made unavailable by assigning random value to it for all patients. 32
Training and testing datasets
We split the entire dataset into a training and a testing dataset in a 7:3 ratio by random sampling. Each dataset contained the following features: age, sex, administration of chemotherapy status, surgical resection status, radiation therapy status, tumor histology and tumor site. Baseline characteristics differences between the training and testing datasets were assessed using Chi-square test, p < 0.05 was considered significant.
Modeling and prediction
Three modeling methods were implemented using open source python libraries, scikit-survival by Pölsterl et al.33–35 Each model was trained using the training set and then was applied to predict a risk score and survival function for each patient in the testing set. Predicted median survival time was determined as the survival time at 0.5 survival probability derived from the survival function. The accuracy of the survival predictions were evaluated by Concordance Index (c-index), calculated using the python package Lifelines (https://doi.org/10.5281/zenodo.1252342).
Kaplan Meier (KM) survival curves
Kaplan Meier survival curves were plotted to compare the survival time distribution of training and testing datasets. A Log-rank test22,36 was used to determine if there is a significant difference between the survival distributions of the training and testing dataset, using the Python package Lifelines (https://doi.org/10.5281/zenodo.1252342). As described by Chen et al., 36 the concordance index was employed to compare predicted risk score and observed survival time.
While there is currently no established consensus on how to approach representation of this type of predictive survival analysis in figures, KM survival curves were plotted to compare the median survival time predicted by the models and the clinically recorded survival time of patients in the testing dataset as other authors have employed similar approaches.28,37,38 Patients who were still alive at the time of the analysis were removed for plotting these two KM curves since model predictions would not include censoring status at the end of the study and a KM curve of predicted median survival for those patients whose censoring status is unknown would not be appropriate. In order to show potential clinical application, we used both c-index, which is widely used to evaluate the performance of survival predictions generated using both censored and uncensored patients, and log-rank test where we compare the KM curves between recorded and predicted survival time distributions in only uncensored patients.
Receiver operating characteristic (ROC) curves
We plotted ROC curves showing the specificity and sensitivity of 1-year survival status predictions of patients in the testing dataset, generated using the CPH, SVM and RF models. Area under the curve (AUC) for each ROC curve was calculated to evaluate the performance of 1-year survival prediction of each model.
Availability of data and material
The datasets supporting the conclusions of this article were obtained from the BC Cancer Registry following approved BC Cancer Research Ethics Board Review. Given the large data set (3907 patients) spanning a large time period (2000–2018) with a significant proportion of the patients deceased and anonymization of the patients in the study, per BC Cancer Research Ethics Board Review, patient consent was not required.
Results
Clinical characteristics
Characteristics of training and testing sets.
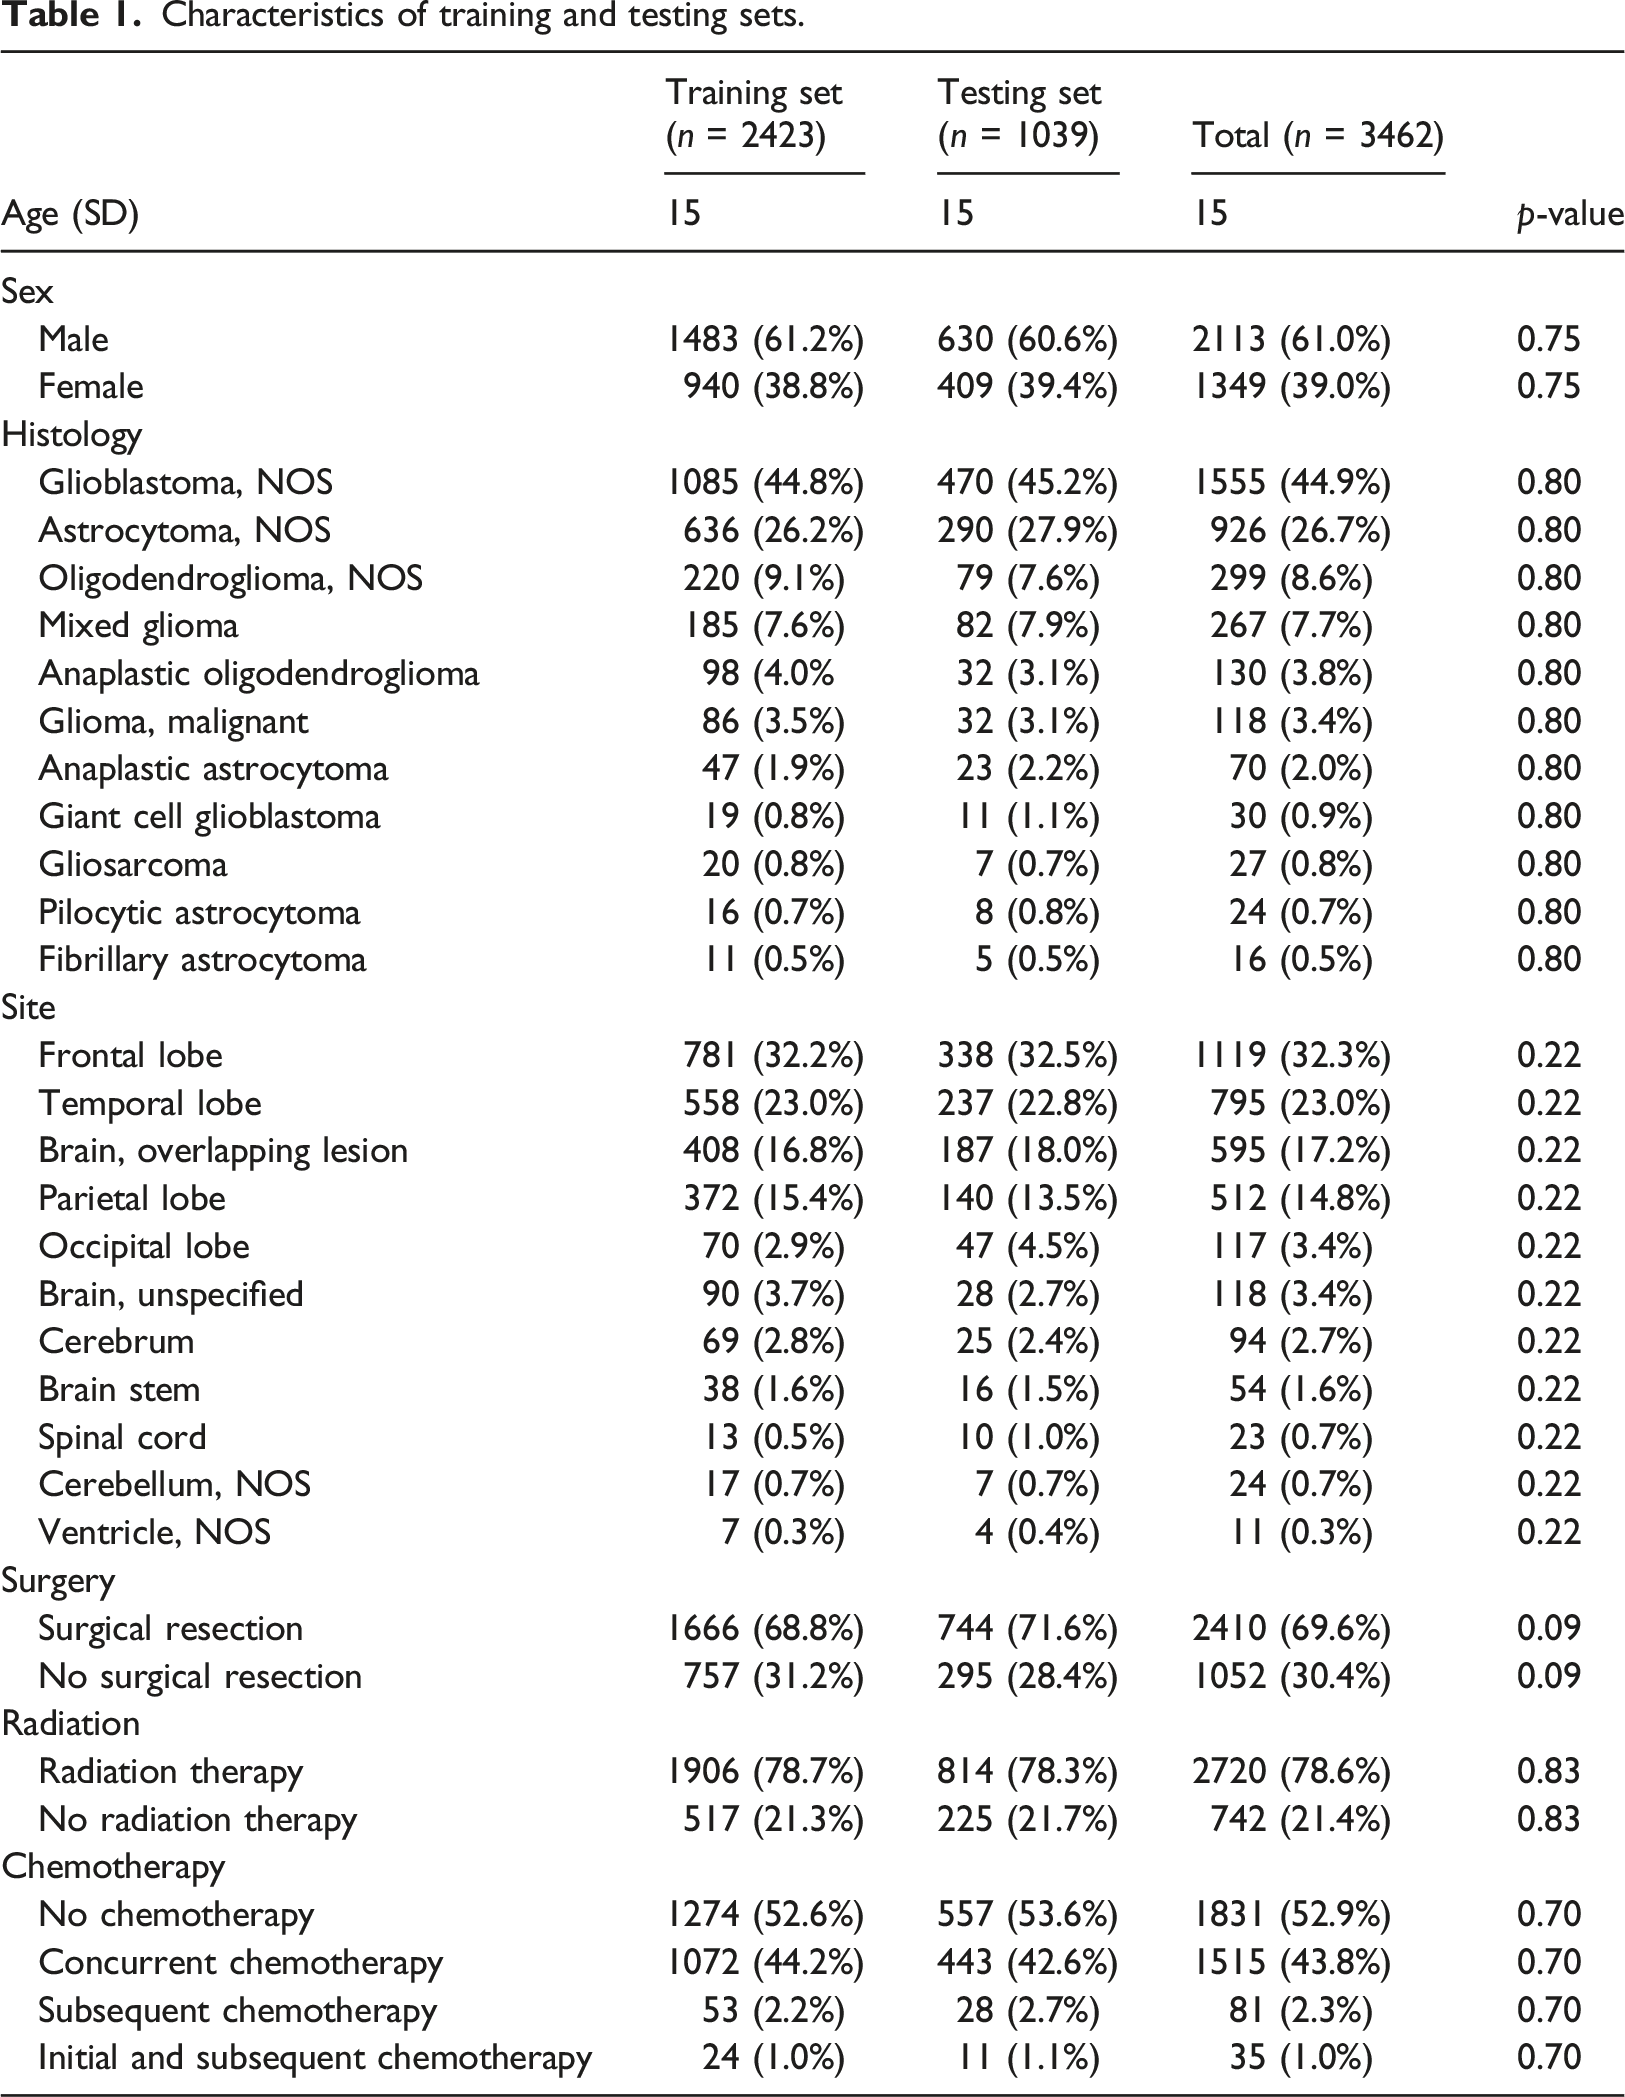
Training and testing datasets
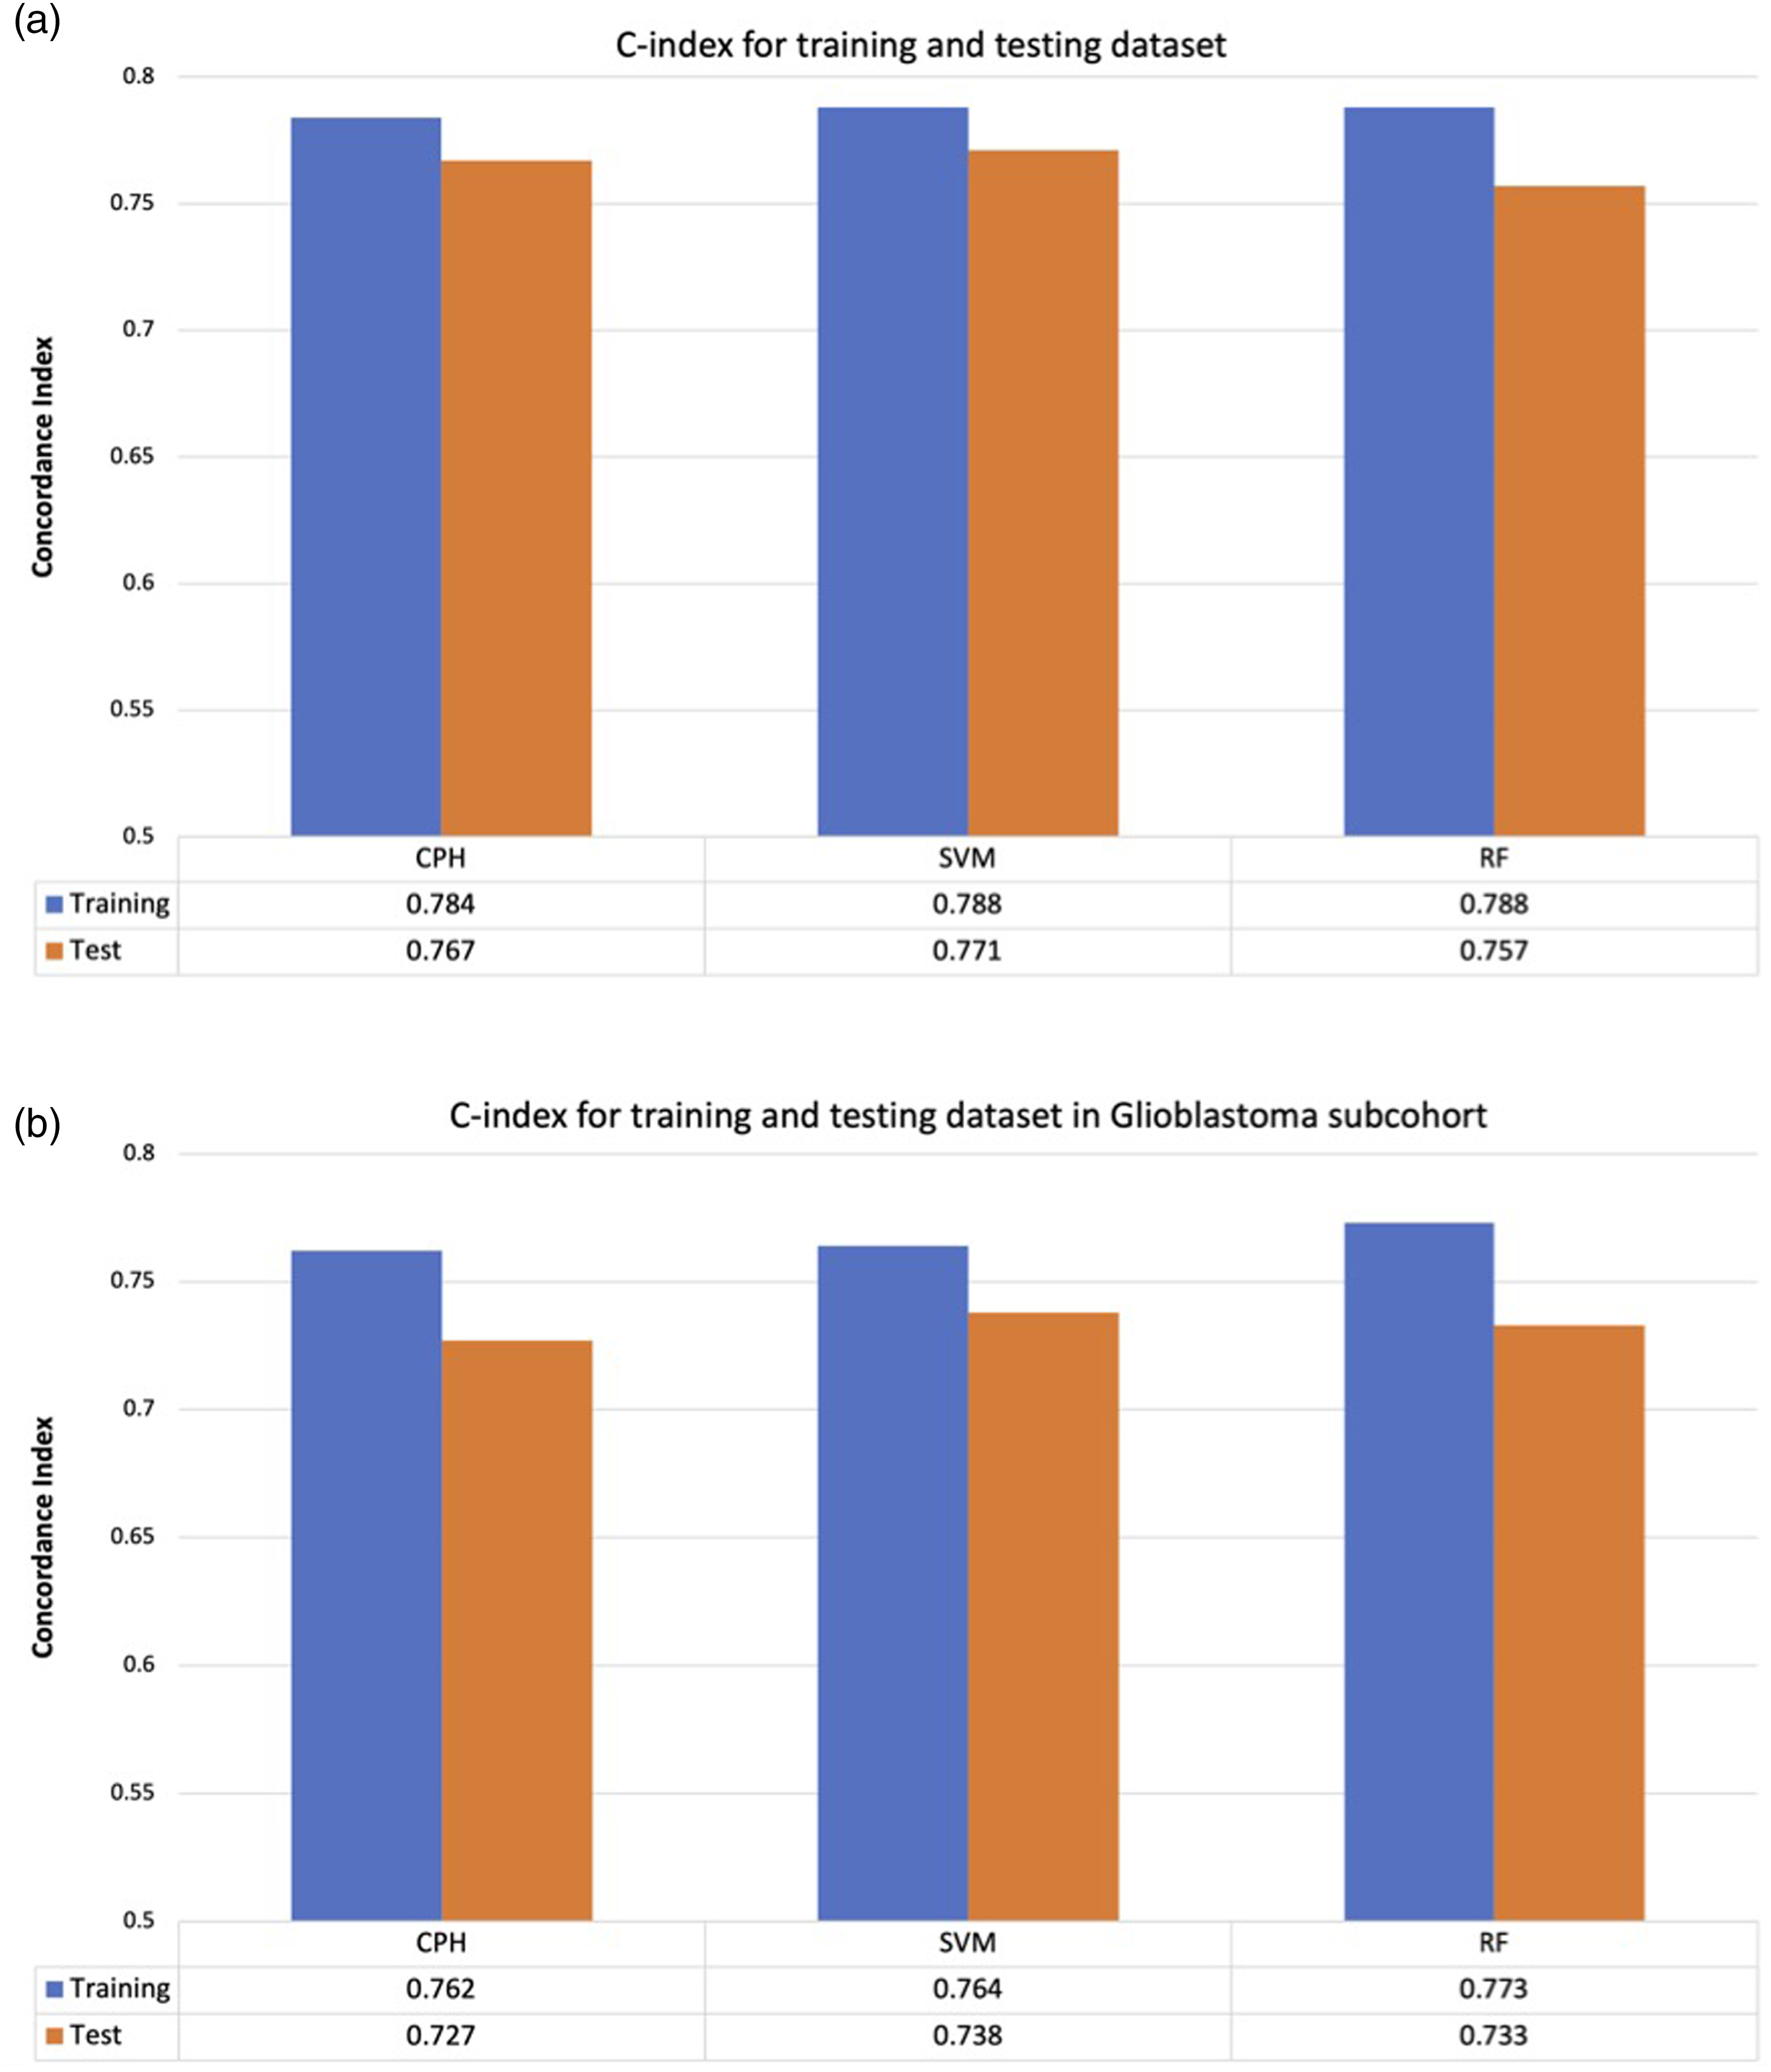
There was no statistically significant difference in baseline characteristics (Table 1) and for the glioblastoma subset (Supplemental Table 1) or survival distributions between the training and testing datasets (log rank test p = 0.99) (Figure 1). There was minimal difference in c-index between survival predictions made using the training and testing datasets across all models independent of all glioma patients (Figure 2(a)) or subset analysis of the glioblastoma cohort (Figure 2(b)). Kaplan Meier overall survival for the training and testing datasets for the entire dataset. Survival prediction accuracy of each model for training and testing dataset. The difference in c-index between training and testing dataset is minimal across all models, suggesting that no overfitting of the training data. (a) All comers. (b) Glioblastoma histology. The model predictions were generalizable to the unused testing data. Cox = Cox Proportional hazards (CPH) model. SVM = Support Vector Machine (SVM) model, RF = Random Forest (RF) model.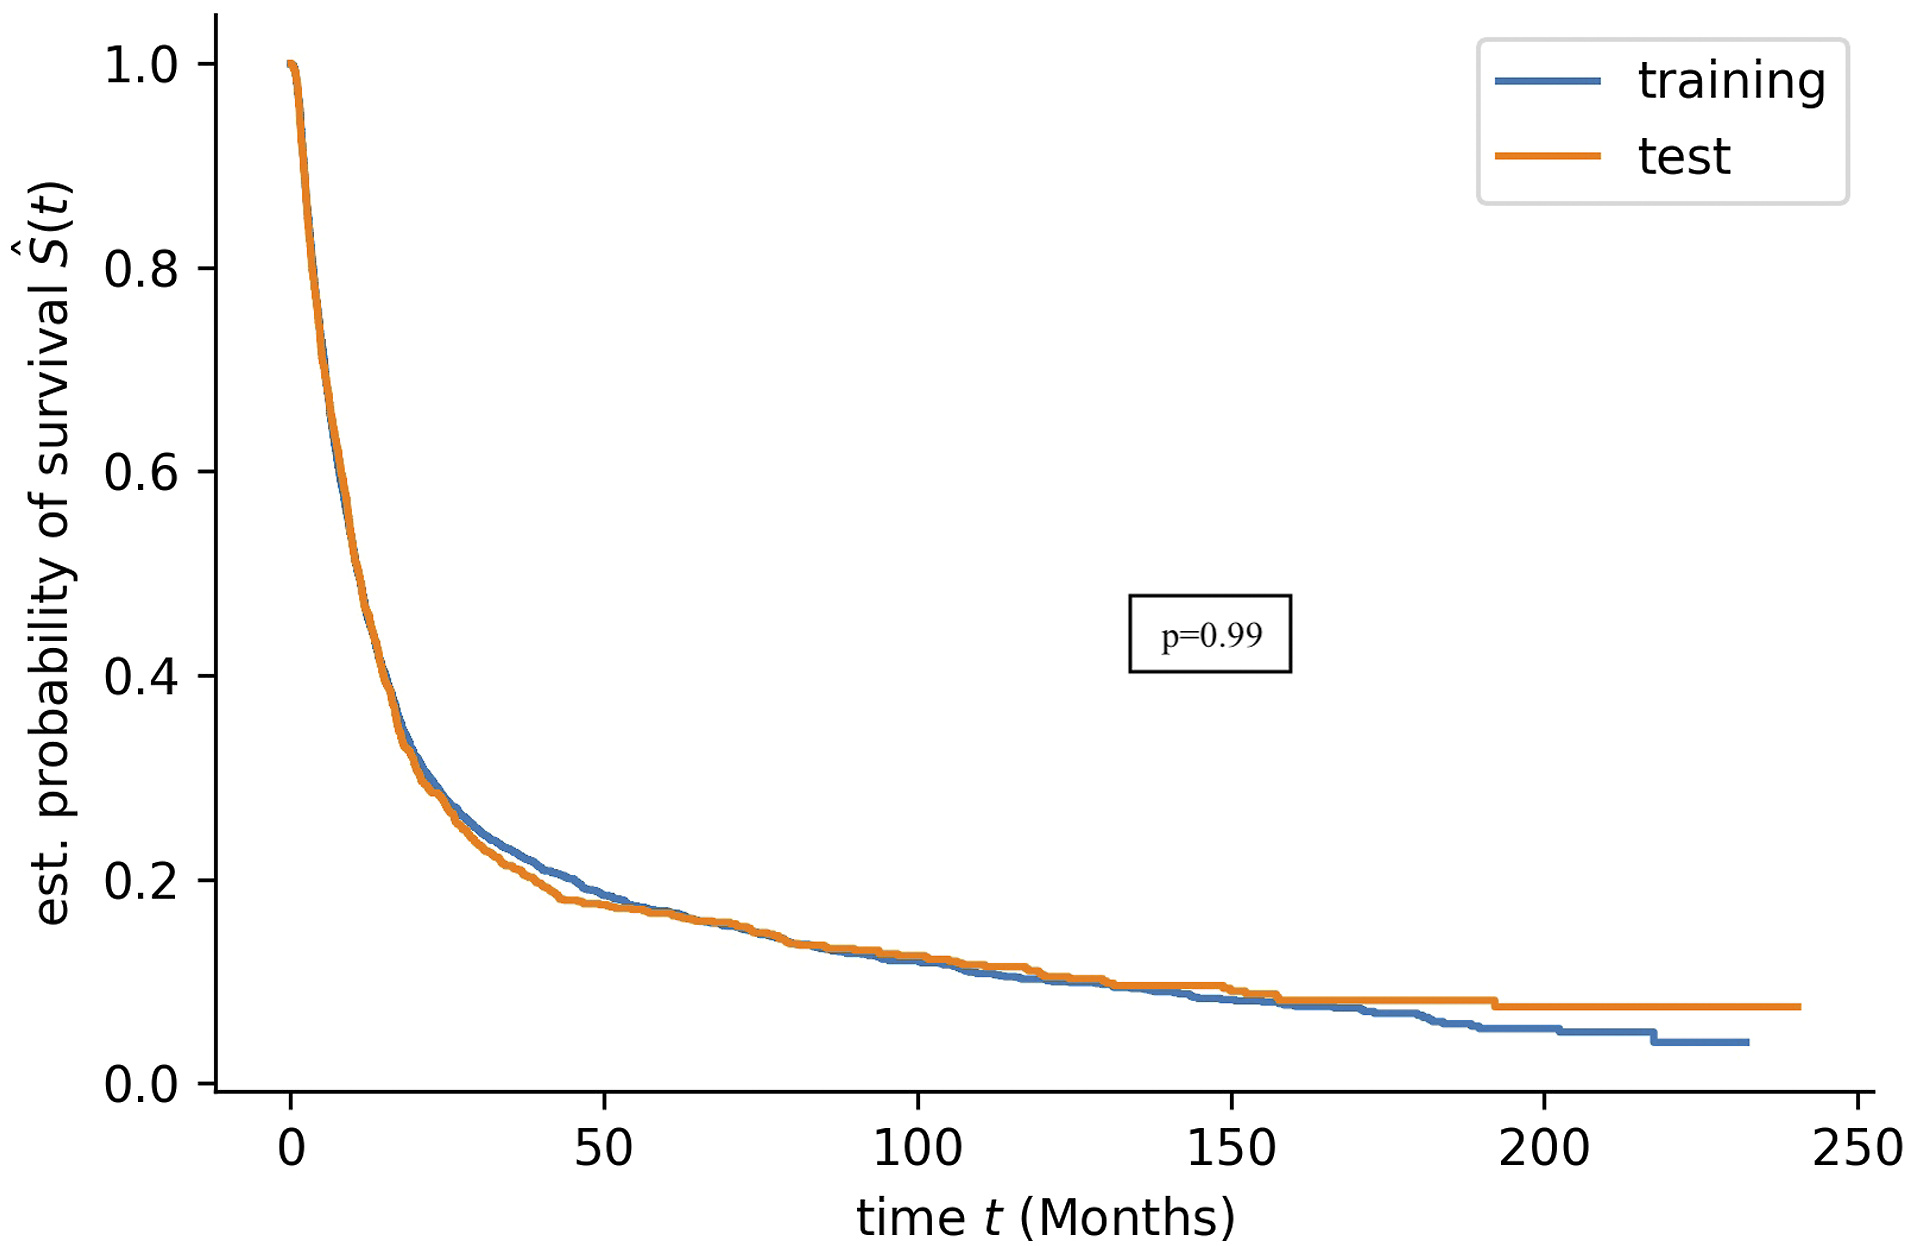
ML models for survival prediction
Concordance index (c-index) is a commonly used method comparing the ranking of recorded survival with the ranking of predicted risk score. A c-index of 0.5 is expected from random prediction and 1.0 is expected if two rankings are in perfect concordance.
22
The c-index adjusted for right censoring was calculated for patients in the testing dataset predicted by each model trained using different combinations of features numbered as (1) Age, (2) Sex, (3) Tumor Histology, (4) Tumor site, (5) Tumor resection, (6) Radiation therapy (RT), (7) Chemotherapy. Prediction accuracy was the lowest when models did not take into account information on management (Figure 3). The highest survival prediction accuracy was obtained using models that take into account information on patient characteristics, tumor characteristics and cancer management with CI of 0.767, 0.771 and 0.757 for CPH, SVM and RF models respectively (Figure 3). Separate subset analysis of the patients with a glioblastoma histology (n = 1555 vs n = 3262 for all comers) was carried out revealing slightly lower prediction accuracy with CI of 0.727, 0.738, 0.733 for CPH, SVM, RF models respectively (Supplemental Figure 1). Survival prediction accuracy of each model using different combinations of features where: (1) Age, (2) Sex, (3) Tumor Histology, (4) Tumor site, (5) Tumor resection, (6) Radiation therapy (RT), (7) Chemotherapy. CPH = Cox Proportional hazards model. SVM = Support Vector Machine (SVM) model, RF = Random Forest (RF) model.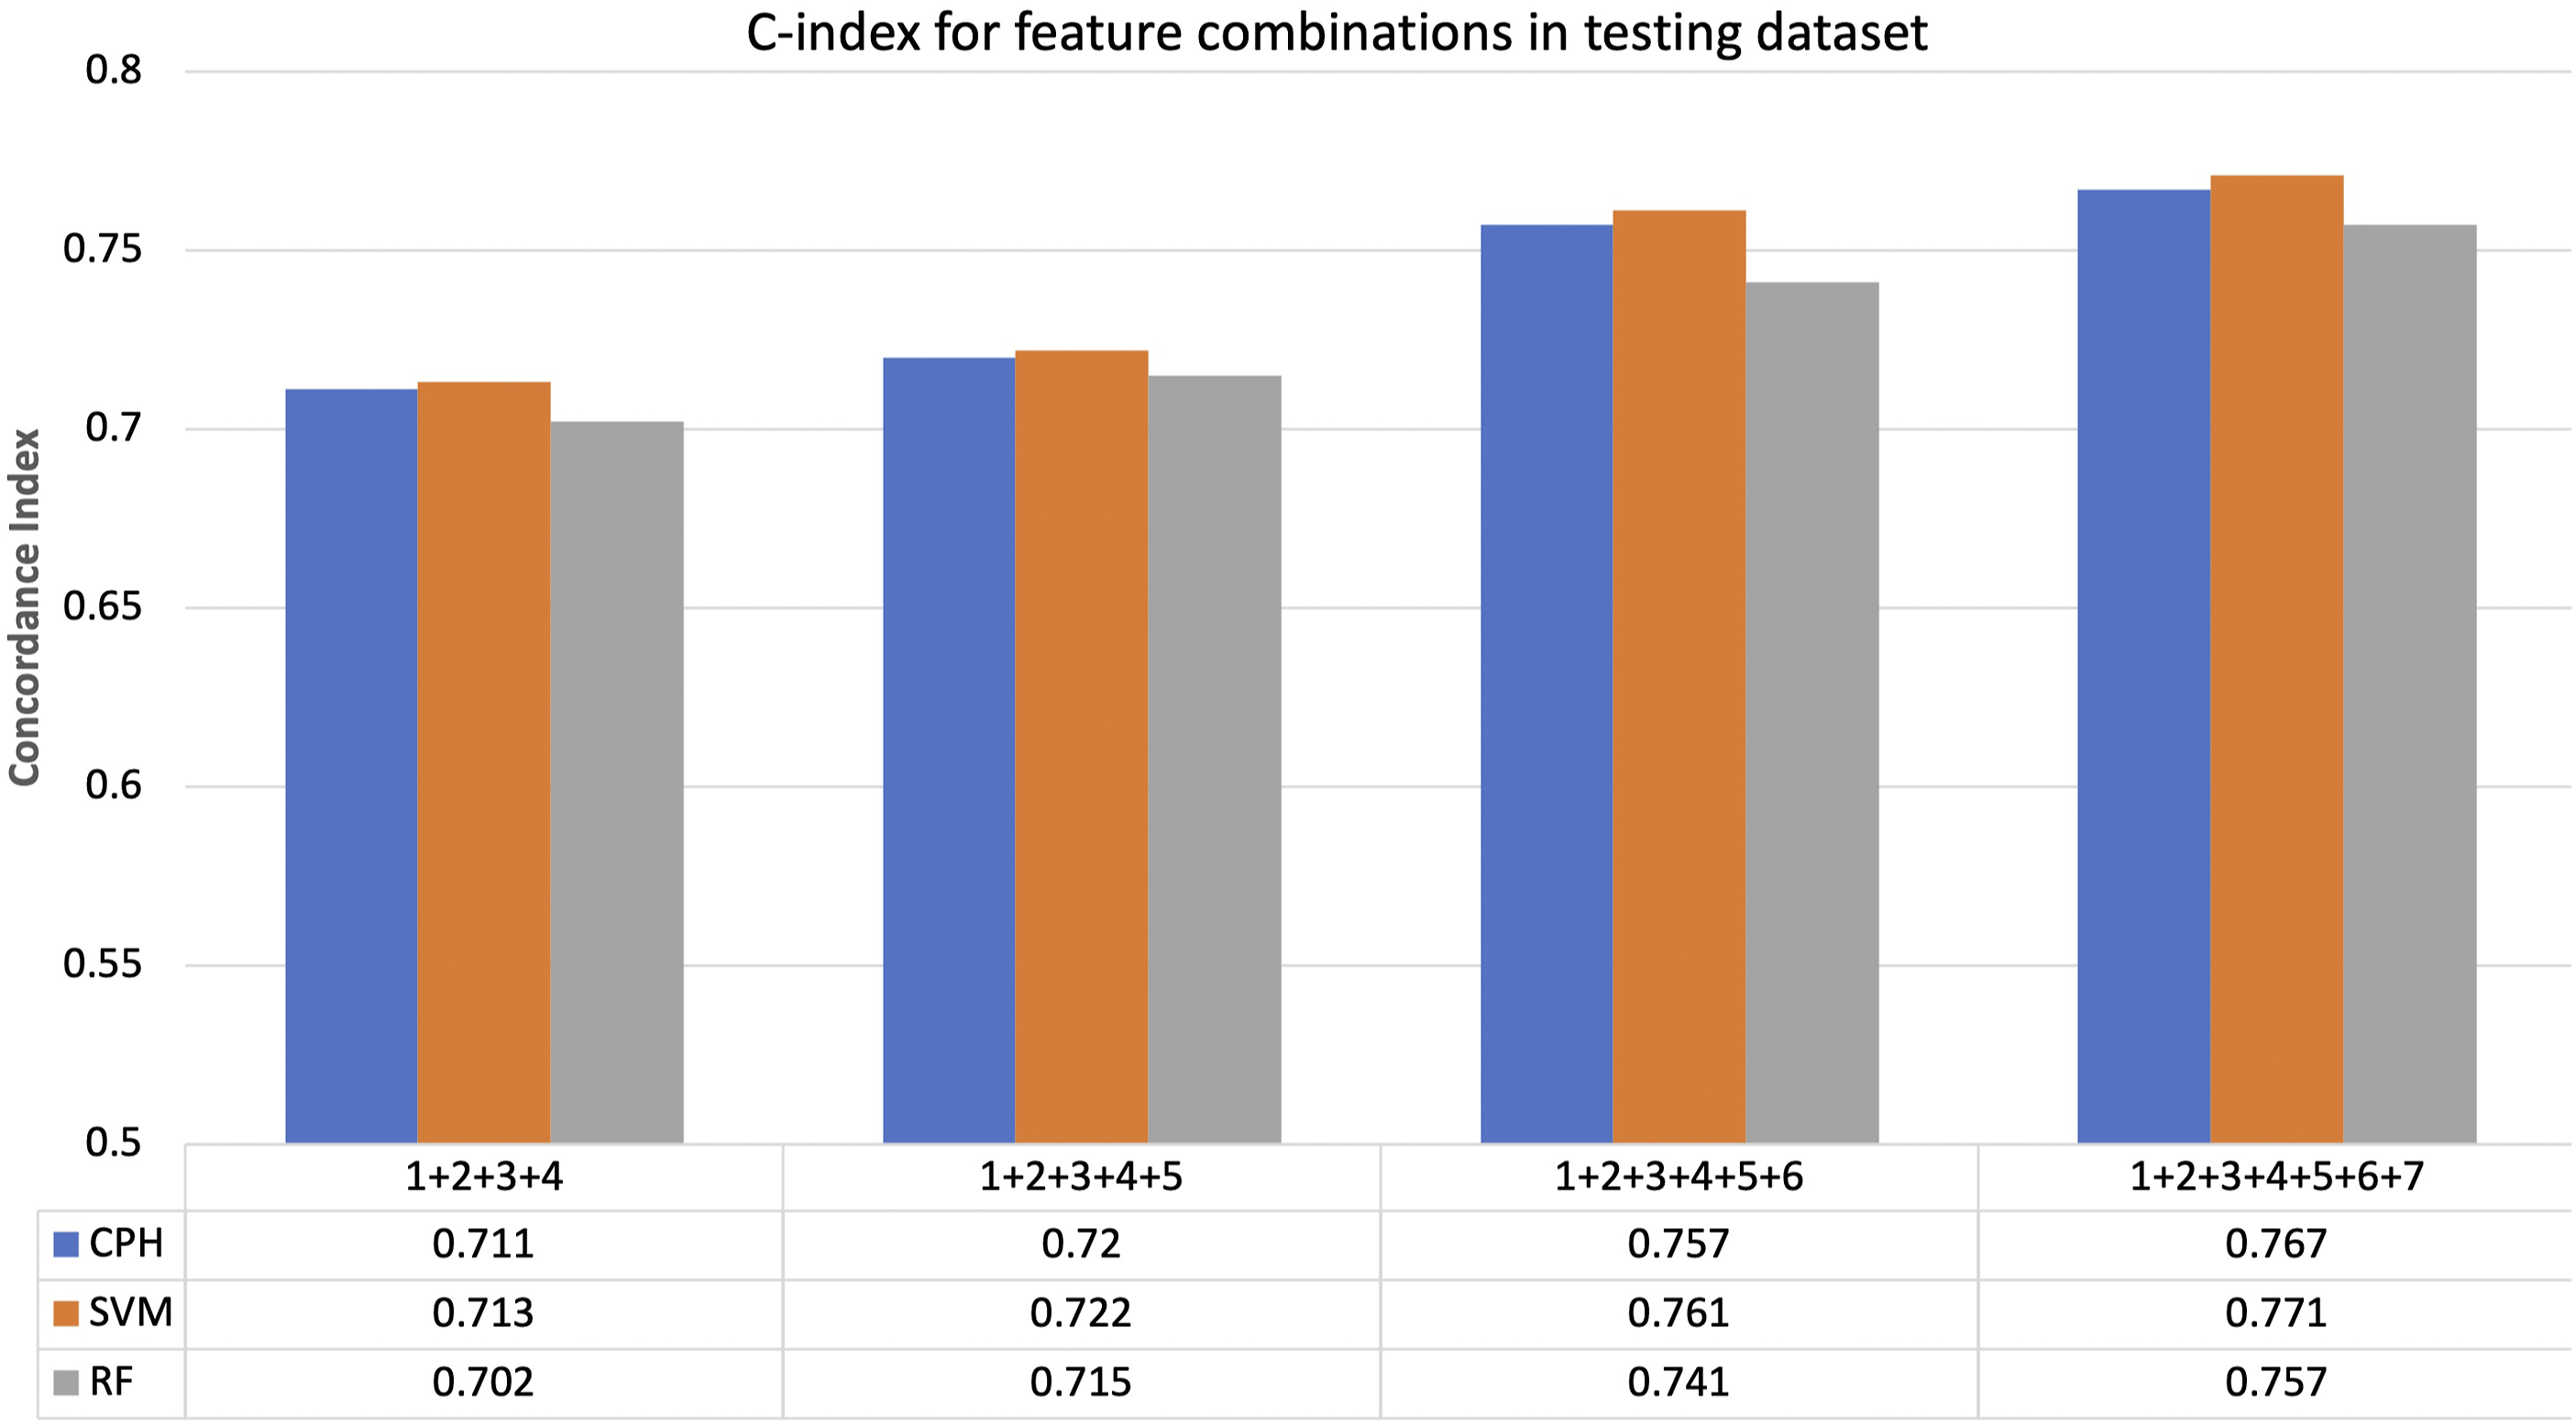
Clinical features predictive importance
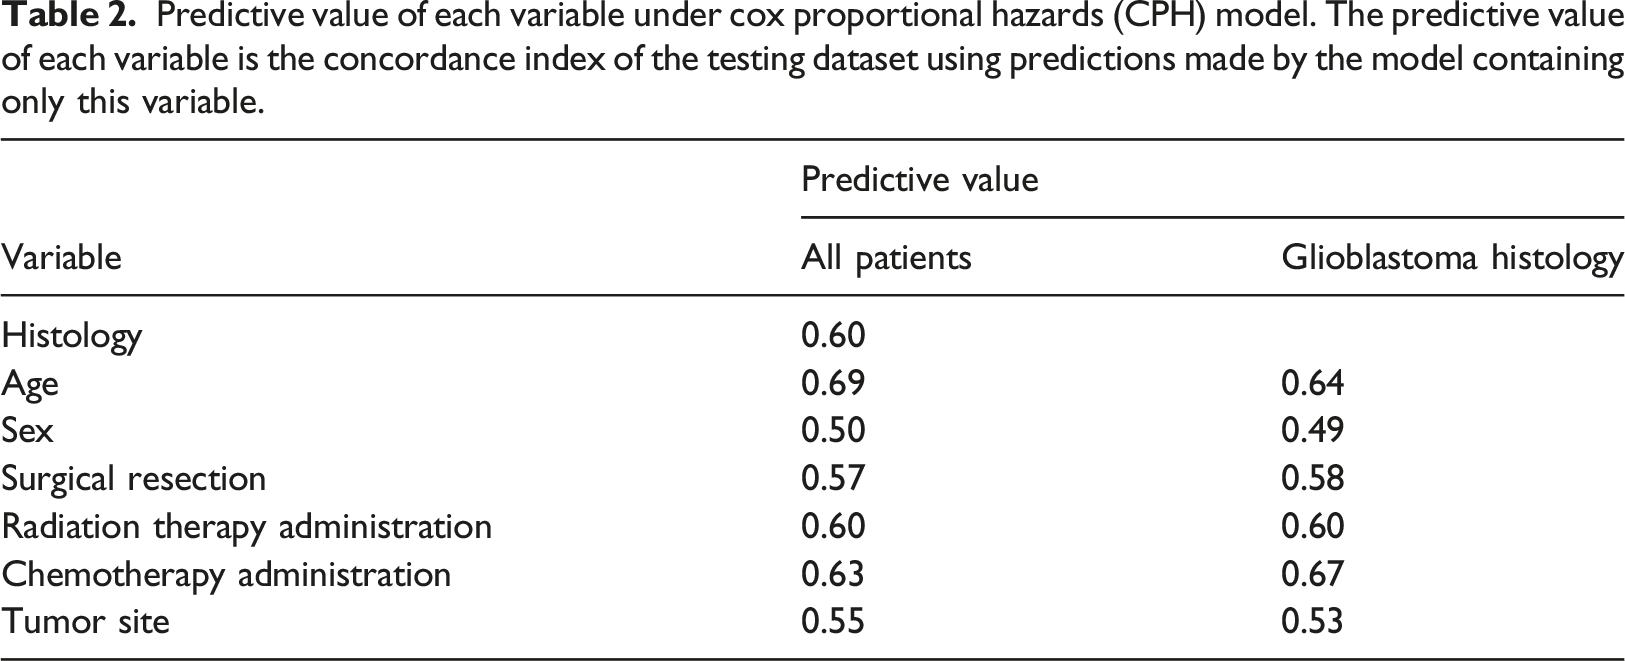
Predictive value of each variable under cox proportional hazards (CPH) model. The predictive value of each variable is the concordance index of the testing dataset using predictions made by the model containing only this variable.
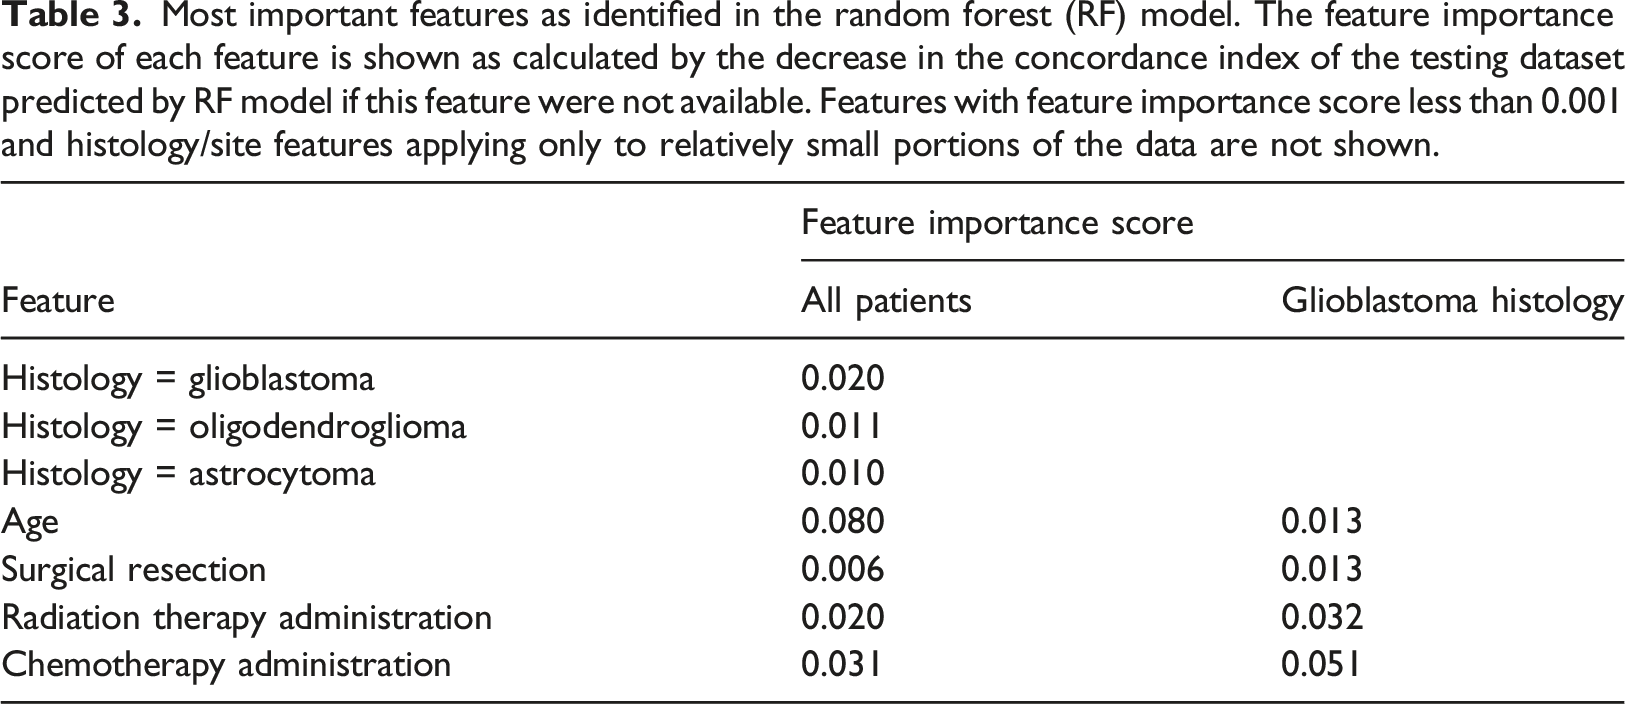
Most important features as identified in the random forest (RF) model. The feature importance score of each feature is shown as calculated by the decrease in the concordance index of the testing dataset predicted by RF model if this feature were not available. Features with feature importance score less than 0.001 and histology/site features applying only to relatively small portions of the data are not shown.
Survival models
All three models CPH, SVM and RF performed reasonably well (Figure 4(a)–(c)) as seen in the predicted survival probability for three sample patients (figure simplified to include only three sample patients for ease of interpretation). The clinical information for each patient is as follows: Patient 1: 67-year-old male diagnosed with oligodendroglioma NOS in overlapping areas of the brain who received chemotherapy and no surgical resection or radiation. Patient 2: 83-year-old female diagnosed with glioblastoma located in the cerebrum treated with surgical resection only (no chemotherapy or radiation). Patient three was a 69-year-old male diagnosed with anaplastic oligodendroglioma located in the front lobe who passed away 7 days after diagnosis not having received any therapy. Only uncensored patients were used for generation the KM survival curve as the model predictions do not include censoring status. There was no statistically significant difference between the recorded survival time distribution and the predicted median survival time distribution using the CPH and RF models for the testing dataset, p = 0.07 and p = 0.61 respectively (Figure 4(d) and (f)). The difference between SVM predicted median survival distribution was statically significant from the recorded survival time, p < 0.005 (Figure 4(e)). Predicted survival curves for three patients in the testing dataset using (a) CPH model. (b) SVM model. (c) RF model respectively. Corresponding KM survival curves for recorded survival times in testing dataset and KM survival curve for predicted median survival times using (d) CPH model. (e) SVM model. (f) RF model. CPH = Cox Proportional hazards model. SVM = Support Vector Machine (SVM) model, RF = Random Forest (RF) model.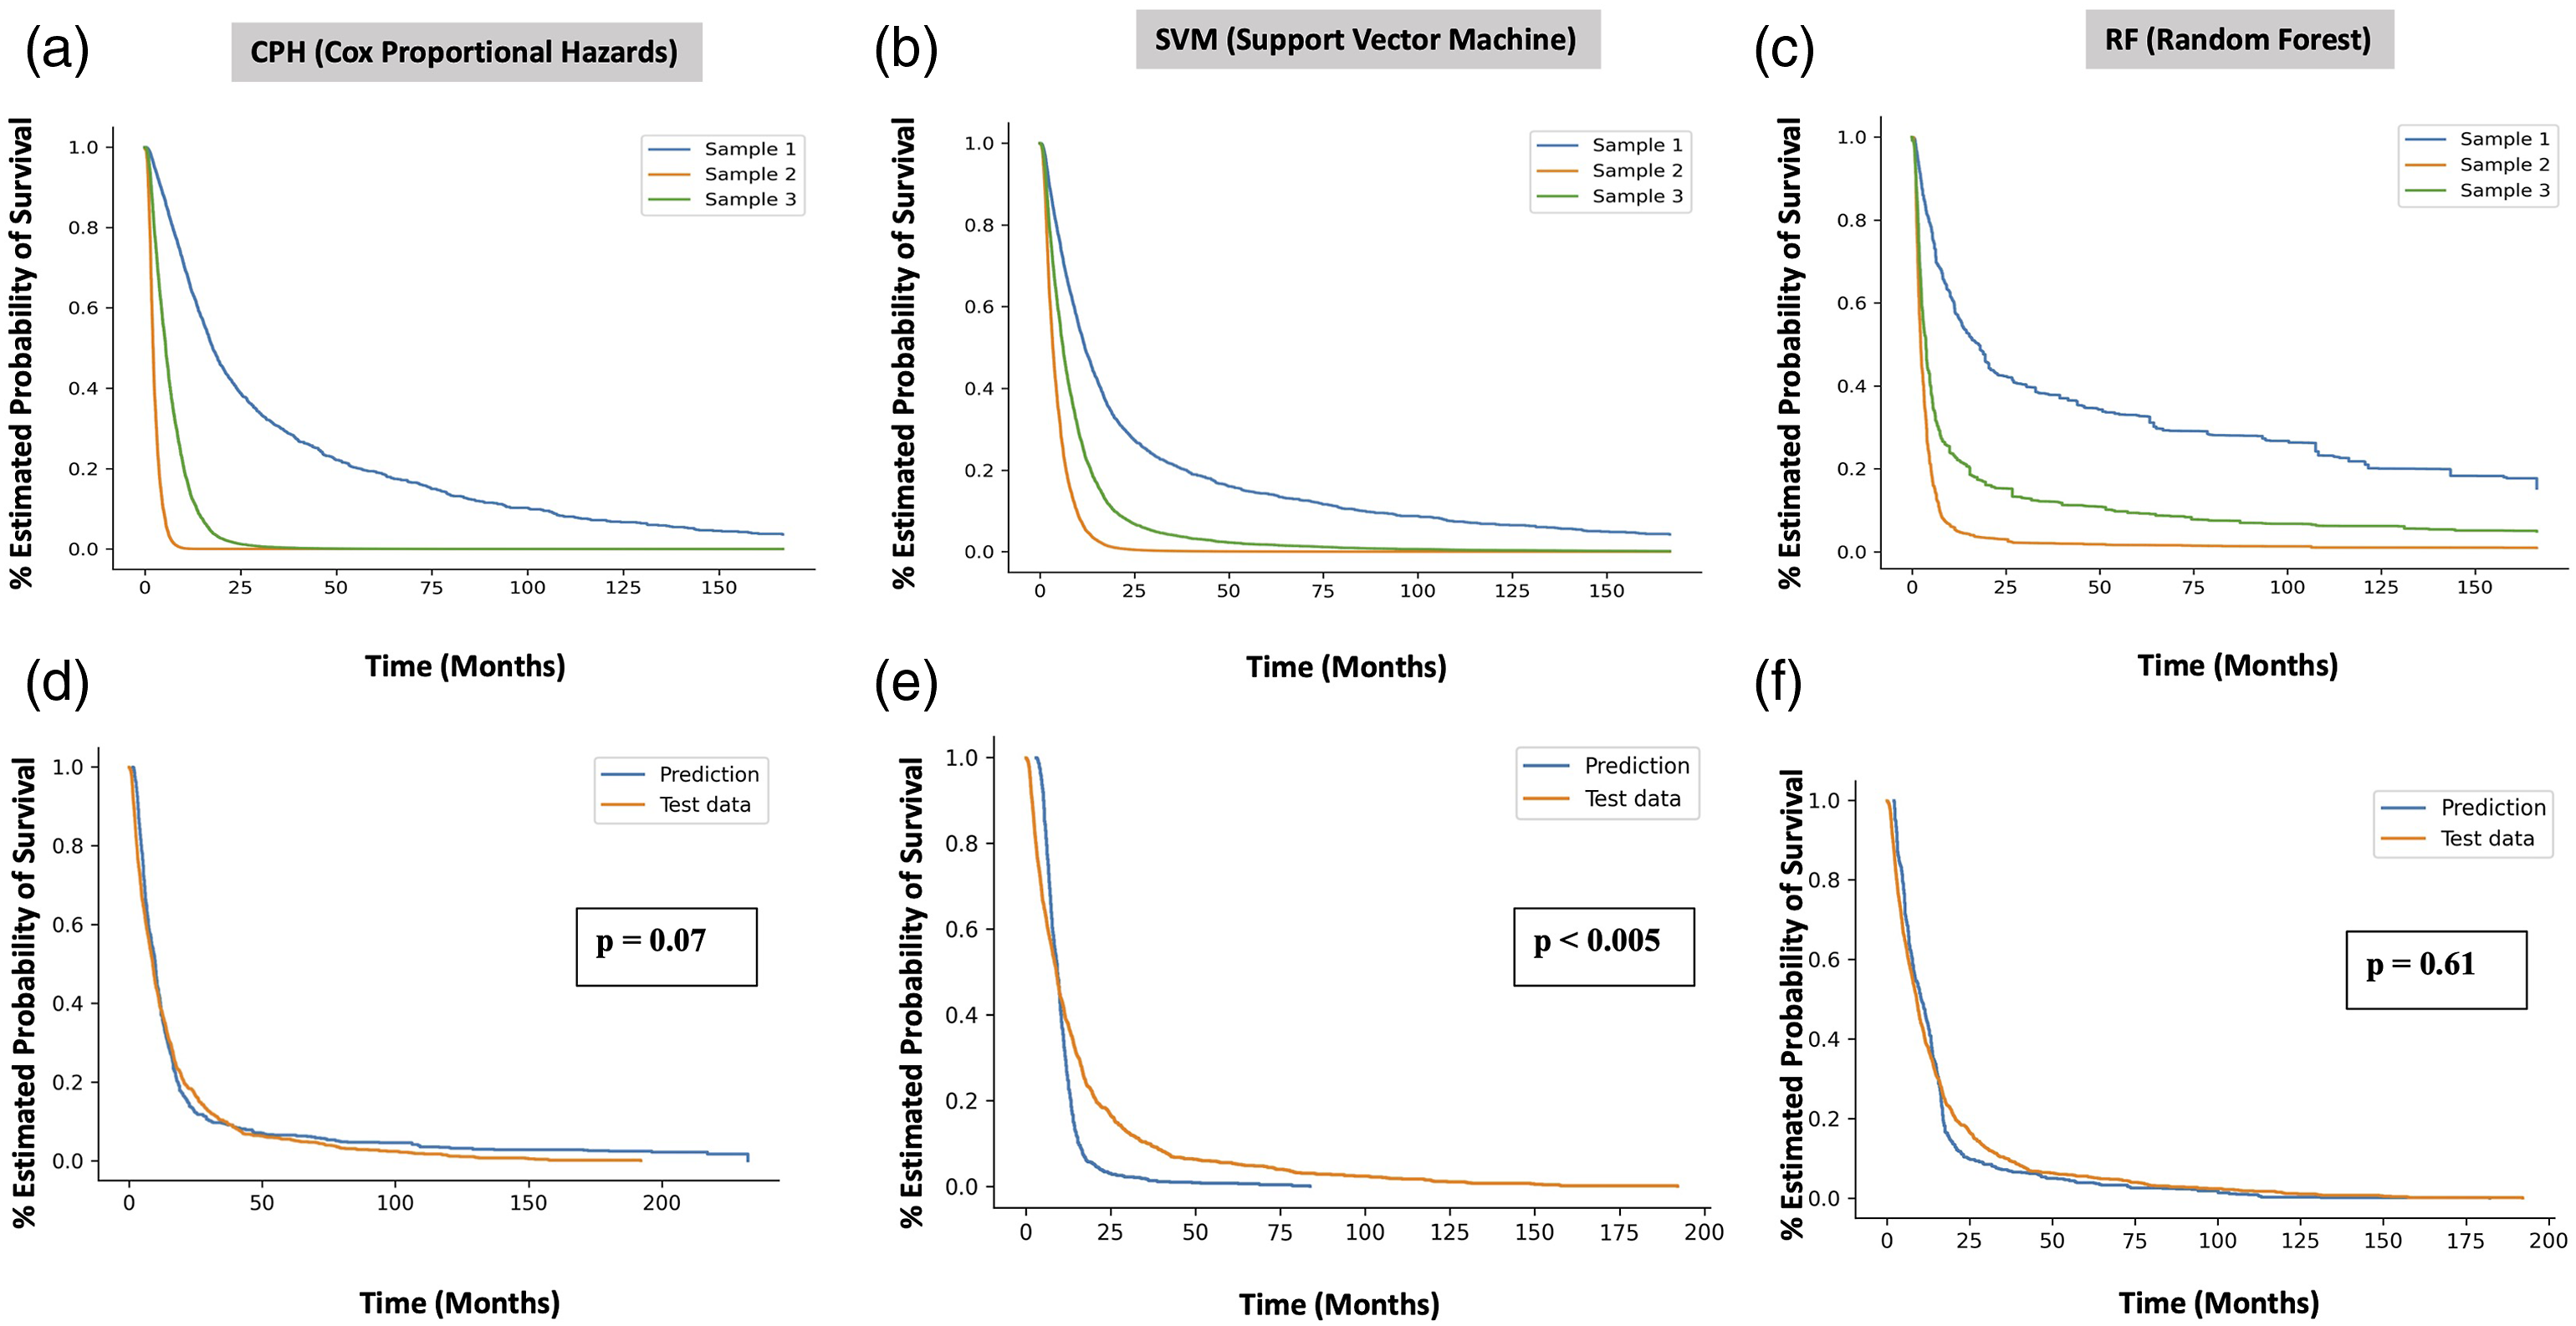
All three models have similar sensitivity and specificity for predicting 1-year survival outcomes (Figure 5) evident in their similar ROC curves and minimal differences in AUC values: 0.854, 0.849, and 0.844 for CPH, SVM, and RF respectively for the entire patient cohort and 0.823, 0.821, and 0.825 for CPH, SVM, and RF respectively for the glioblastoma subset. Receiver operating characteristic (ROC) curves for 1-year survival prediction for (a) all glioma patients. The area under the curve (AUC) values of the ROC curves were 0.854, 0.849, and 0.844 for CPH, SVM, and RF respectively. (b) Glioblastoma histology. The area under the curve (AUC) values of the ROC curves were 0.823, 0.821, and 0.825 for CPH, SVM, and RF respectively. ROC curves show the sensitivity and the specificity of predicted 1-year survival outcomes generated using CPH, SVM and RF models.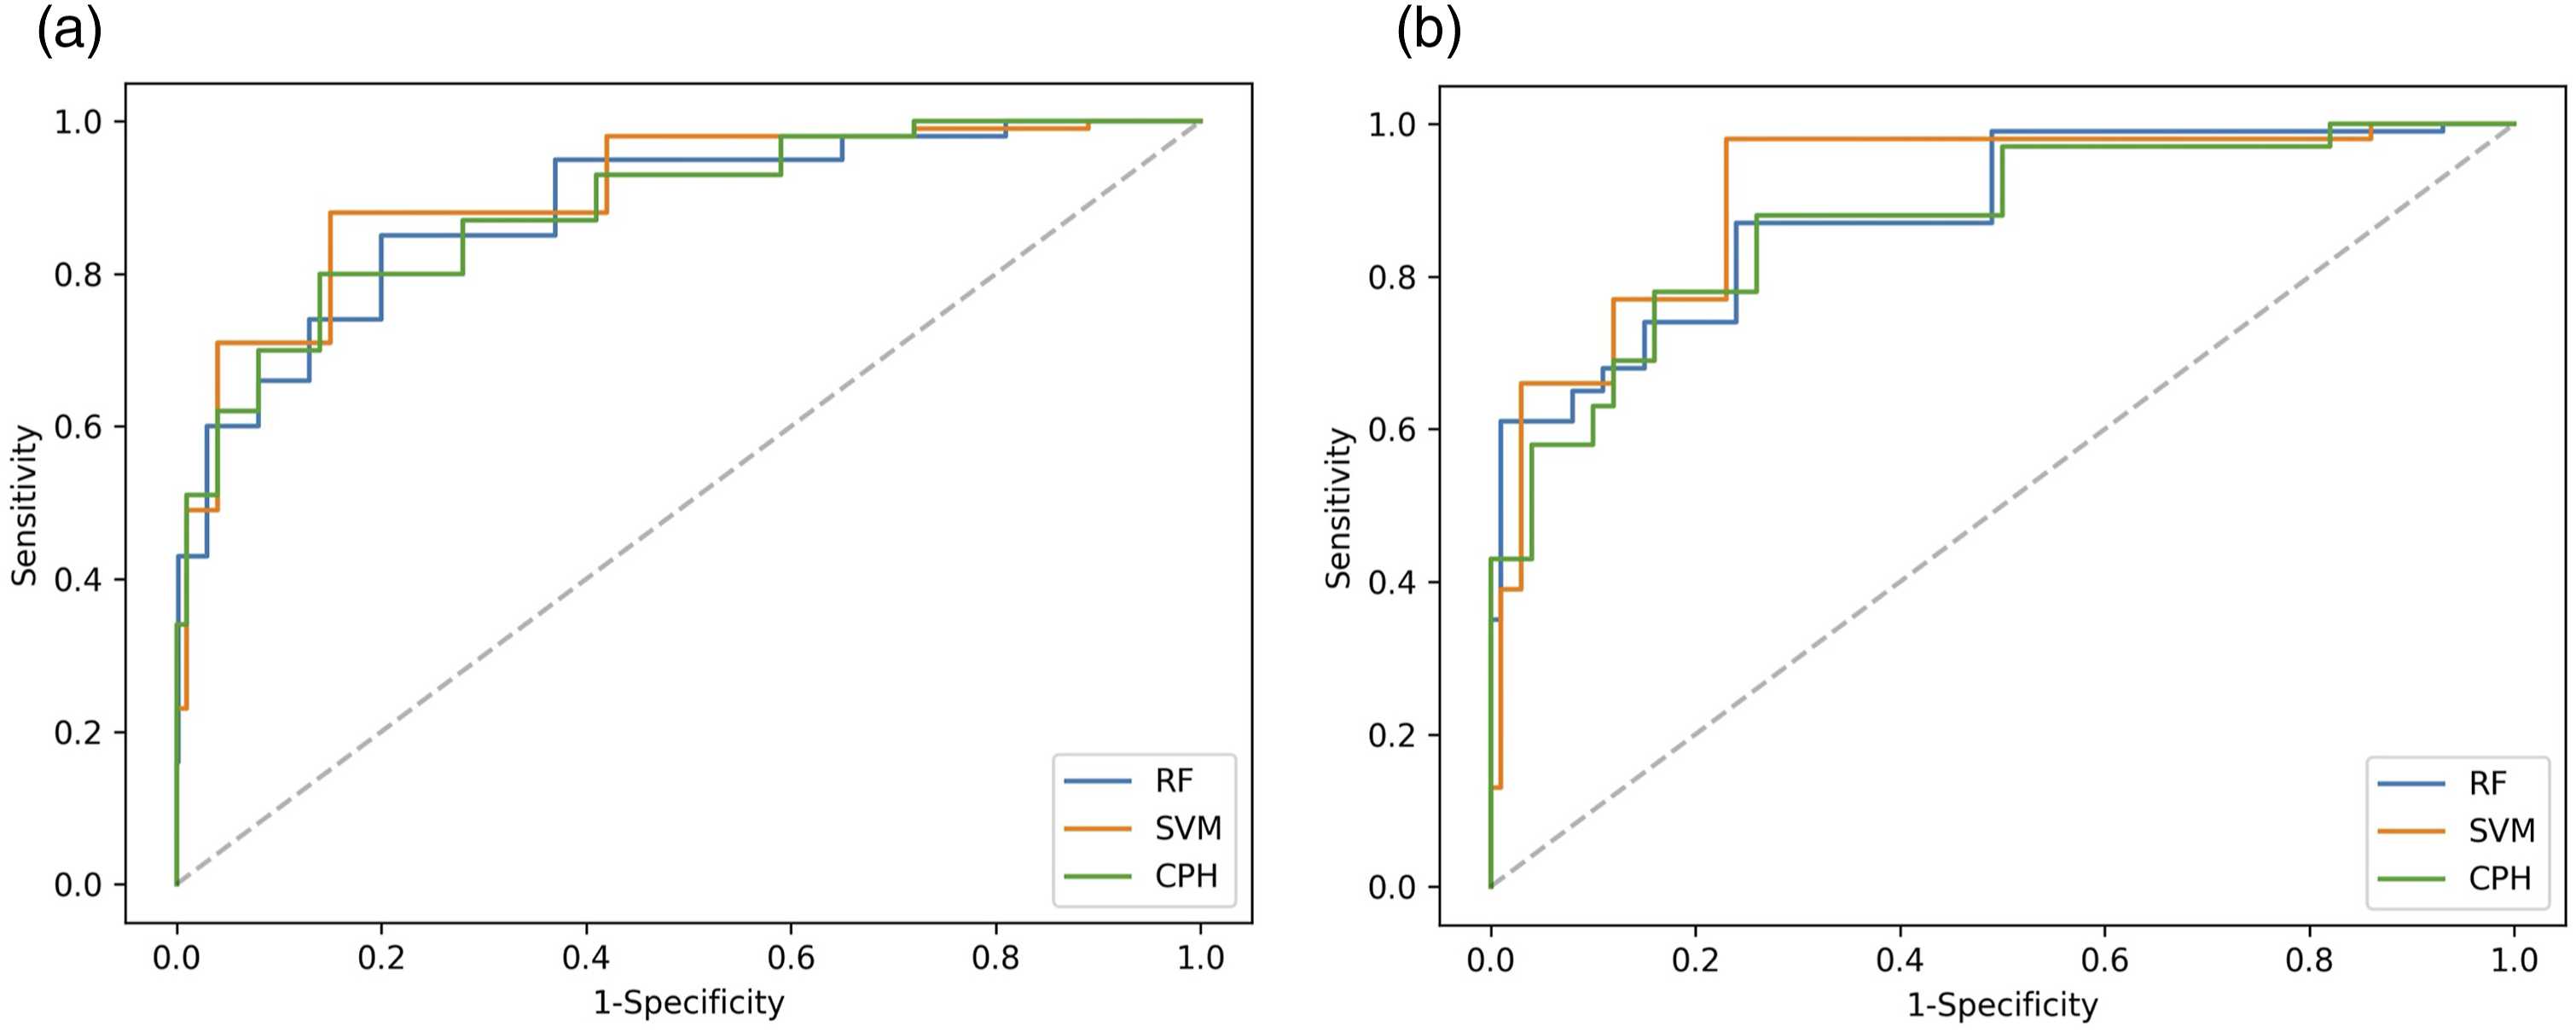
Discussion
Machine learning as a tool towards superior prediction of clinical outcomes has increased in popularity in all domains of medicine including oncology,17,19,20,29,39–41 driven by the need to rapidly harness clinically relevant results when prospective data is unavailable and impossible to obtain such as in the context of the COVID-19 pandemic.
Our study is novel in two significant ways: (1) it employs an extremely large glioma patient population (3462 patients) representative of a high volume publicly funded system originating in the BC Cancer registry in British Columbia, Canada, which is extremely rare in this space for neuro-oncology survival prediction 42 outside of public data bases 17 which suffer from their own limitations and biases and (2) we deliberately explored the ability to predict survival while employing exclusively non radiomic, non-molecular data features generally available in most high volume cancer centers treating gliomas to generate comparative performance parameters grounded in an inclusive, realistic and as a result transferrable data set 25 We achieved excellent survival prediction accuracy with c-index ranging from 0.757 (RF model) to 0.771 (SVM model) while including the lowest common denominators embedded in most large brain tumor registries including age, sex, administration of chemotherapy status, surgical resection status, radiation therapy status, tumor histology and tumor site. Slightly lower c-index values were identified in the analysis of the subset of patients diagnosed with glioblastoma (0.727, 0.738, 0.733 for CPH, SVM, RF) likely reflecting a lower n (1555 vs 3462) but also reinforcing that the models are equally robust in this specific histological scenario associated with both less controversy in terms of establishing consistent pathological diagnosis as well as a far poorer prognosis.3,4,6,8,9 We also note that surgical resection status again recently reported on as a significant feature defining glioma outcomes 43 did not rank as highly as we may have expected. We suspect that this is secondary to inconsistent coding distinguishing the extent of resection in the registry which may reflect variable capture as to what is considered gross total or subtotal resection or even biopsy in operative reports which are used as source documentation for this feature in the registry. 44
Most ML survival prediction studies aimed at patients with glioma center around MRI radiomics or histological features as a result involving smaller patient populations as proof of concept: Tan et al. 2019 (MRI radiomics, n = 147), Papp et al. 40 (PET, n = 70), Mobadersany et al. 41 (histology and genomics n = 769), Mizutani et al. 29 (radiation dosimetry, n = 35).29,39–41 Our patient characteristics and tumor management features are more similar to large retrospective registry studies such as the SEER database which using traditional statistical analysis that has been employed to develop nomograms in the context of low-grade glioma with 3732 patients, 45 oligodendroglioma with 2689 patients, 46 high-grade glioma (6395 patients). 47
The CPH model has been the gold standard for survival analysis. It uses a semi-parametric statistical modeling approach where the survival outcome is a linear combination of predictive variables. A disadvantage of the CPH model is that it operates on the underlying assumption that predictive variables are independent and do not interact, and their impact on survival do not change over time. We hypothesized that these assumptions are unlikely to hold true when considering: (1) the large number of predictive features potentially available in cancer patients and (2) these features are likely to interact with each other in an unforeseen manner. 17 Therefore, we selected two widely used ML methods, Support Vector Machine (SVM) and Random Forest (RF), that allow the use of predictive features that have potential interactions.17,19 The SVM approach assigns weight to each predictive feature to produce a score that maximizes concordance between predicted risk ranking and recorded survival time ranking. 28 By contrast the RF approach takes the average of a collection of decision trees where the branches are split based on values of the predictive features. 38 All three approaches ultimately produced equal or superior c-index in comparison with the literature.17,29,39–41,45–47
We achieved a higher c-index using the ranking based SVM model in comparison with the other two models. However, our SVM model exhibited a difference between SVM predicted median survival time distribution and the recorded survival time. This was likely secondary to our selection of a rank based SVM approach which optimizes risk ranking. A regression based SVM model can be explored in further analysis for potential better survival time prediction 37 as well as survival tree analysis 48 in comparison to RF. 49 We found some parallels with Nemati et al. 19 who employed real world data to predict hospital discharge for COVID-19 patients and Senders et al. 17 who employed 20,821 glioblastoma patients originating in SEER database to predict survival at 1 year following diagnosis. Both employed c-index as a performance metric and focused on risk factor analysis and 1 year survival classification respectively but stopped short of comparing predicted and recorded discharge or survival time as c-index is solely based on ranking of times of events in all possible pairs.17,19 To enhance clinical applicability, it was important to us to compare the predicted survival time to actual survival time and we employed log rank test to accomplish this using uncensored data. Further analysis alternatives could include using alternate weighting methods to include censored data and comparison with accelerated failure time (AFT) algorithms.17,35,50
Cross-validation and its inclusion is subject to future directions in our work including to compare its impact on performance in large-scale data sets in glioma given that both cross-validation and sample splitting ultimately reflect internal validation and neither may completely mitigate overfitting although this is subject of ongoing studies and validation with other sources of data is the ultimate goal. 51
Similar to other studies employing large scale retrospective data, the current study is limited by lack of information with respect to patient performance status, molecular features and the detailed timing of chemotherapy administration in relationship to diagnosis and RT administration, all currently not being collected as part of the BC Cancer registry. The management of glioma, particularly in the wake of the revisions made as a result of the 2016 WHO Classification, has evolved to transition from morphologic based “grading” to incorporate molecular features that define biological aggressiveness and tumor behavior. Although tumor sequencing and molecular classification is increasingly being incorporated in management, as of yet most datasets do not possess sufficient molecular information to incorporate into a formal analysis. As a result, it was crucial for us to include all tumors pathologically confirmed as gliomas in the analysis in a deliberate effort to circumvent the bias due to older tumor grading paradigm and in the absence of molecular characterization.1–5 In the context of glioblastoma (WHO grade IV) however, pathological diagnosis is more consistently defined due to the identification of distinctive pathognomonic features, in particular the presence of necrosis and is employed to guide optimal management, albeit growing importance of molecular features.6,9 A separate analysis was therefore carried out in the subset of patients with a specific diagnosis of glioblastoma to determine the applicability of the survival prediction models and to explore feature importance scores. This analysis identified a more robust feature importance of both RT and chemotherapy administration (0.032 and 0.051 respectively) versus (0.020 and 0.031 respectively) in the cohort overall with chemotherapy administration in particular, exceeding those same featured identified in the analysis of the entire cohort and overtaking age as the most important feature. From a clinical perspective this is perhaps not surprising considering the aggressive nature of the glioblastoma and the recognised importance of both management options as predictive of survival in the literature.6,8,9,12,52
Limitations of this study are posed by the lack of vital status information for some patients and the possibility that abrupt events not directly related to patient characteristics, histology or management that may have affected outcome. Whilst we do have information on the intention of RT and chemotherapy administration, the current analysis does not take into account whether the treatment was in fact ultimately administered or completed as intended.
Ultimately both ML methods achieved good predictive ability on par with the gold standard (CPH) in a large dataset but similarly to other studies,17,19 they did not outperform the CPH statistical model acknowledging that in the context of additional highly complex interacting features (radiomic, RT dosimetry, detailed genomic and pharmaceutical data), machine and deep learning models are likely to perform better.13,14,16 The robust capture and inclusion of the above features comprise future directions in the field of oncology.
The patient characteristics and outcomes of our study cohort are similar to other large series17,29,39–41 and we determined that management as a feature was crucial in achieving superior predictive capability for all models but especially so in glioblastoma. Our study is a first step towards future investigations into the potential of involving ML models in personalized treatment planning where model predicted survival times for different treatment options can be take into consideration when determining the optimal management plan for each patient. This is especially important in glioma management, where the intricacies of administration of chemotherapy can be a source of clinical debate (concurrent versus sequential, number of cycles and patient selection). The fact that these aspects of management are often incompletely captured and hence often used as a dichotomy RT (yes/no) and chemotherapy (yes/no) should be remedied. The fact that our models identified chemotherapy and RT administration as the most important features both in the context of a more general glioma diagnosis as well as in the specific context of a specific histologic diagnosis of glioblastoma, reinforces the importance of consistent and detailed capture of patient management in order to advance ML approaches to large scale data. Future studies are required to address the issue of how ML encapsulates the a priori complexity of clinical decision making and the implications for patient outcomes juxtaposed with the ability to create clinically meaningful ML models that appropriately disentangle the multiple factors involved.
Our efforts in this study highlight both the need to create reliable clinician/ML connections and the need for increasingly robust datasets that capture the intricacies of patient management in large scale registries. This means more clinical oversight of data coding in registries as well as quality assurance of patient management as is now increasingly performed via peer review in tertiary care institutions. The ability to work from a platform of consensus will allow for meaningful conclusions based on ML eventually on par with those currently obtained from prospective trials. Ongoing efforts and future directions involve in depth survival modeling aimed specifically at the management and outcomes of elderly patients with a glioma diagnosis as well as that of patients with lower grade gliomas and incorporation of large-scale systemic management data into existing models.
Conclusions
We achieved superior survival prediction performance with the aforementioned ML studies as compared to other ML and non-ML approaches in the literature while employing exclusively widely available clinical sets of features. The administration of chemotherapy and RT emerged as key features in both general glioma histology and in glioblastoma specifically raising questions about the potential for superior results that may be achieved through further optimisation and clinical oversight of large-scale real-world datasets particularly with respect to how the intricacies of patient management are captured to allow for clinically relevant results to be generated by ML approaches.
Supplemental Material
Supplemental Material - Machine learning based survival prediction in Glioma using large-scale registry data
Supplemental Material for Machine learning based survival prediction in Glioma using large-scale registry data by Rachel Zhao, Ying Zhuge, Kevin Camphausen and Andra Krauze in Health Informatics Journal
Footnotes
Acknowledgements
We acknowledge the contribution of Dr N. Coleman who kindly reviewed the manuscript and provided suggestions for its relevance to the field. We also acknowledge the contributions of Ryan Proulx and the staff at Safe Software and Dr Iulian Badragan, medical physicist at BC Cancer Surrey for their assistance with some of the data related technical aspects involved in this analysis.
Author contributions
R.Z. conceived the study, organised patient registry data, created and optimized non-machine and machine learning models and co-drafted the manuscript.
Y.Z. reviewed the manuscript and conceived the original joint study of machine learning based glioma patient outcomes analysis employing large scale data.
K.C. reviewed the manuscript and conceived the original joint study of machine learning based glioma patient outcomes analysis employing large scale data.
A.K. conceived the study, participated in its design and coordination, collected patient data and co-drafted the manuscript.
Declaration of conflicting interests
The author(s) declared no potential conflicts of interest with respect to the research, authorship, and/or publication of this article.
Funding
The author(s) disclosed receipt of the following financial support for the research, authorship, and/or publication of this article: This work was supported by the Porte-Hungerford Neuro-Oncology Grant held by Dr A. Krauze and the BC Cancer Summer Studentship Program and NCI NIH intramural program (ZID BC 010990).
Availability of data and material
The datasets supporting the conclusions of this article were obtained from the BC Cancer Registry following approved BC Cancer Research Ethics Board Review. Given the large data set (3907 patients) spanning a large time period (2000–2018) with a significant proportion of the patients deceased and anonymization of the patients in the study, per BC Cancer Research Ethics Board Review, patient consent was not required.
Supplemental Material
Supplemental material for this article is available online.
Appendix 1
References
Supplementary Material
Please find the following supplemental material available below.
For Open Access articles published under a Creative Commons License, all supplemental material carries the same license as the article it is associated with.
For non-Open Access articles published, all supplemental material carries a non-exclusive license, and permission requests for re-use of supplemental material or any part of supplemental material shall be sent directly to the copyright owner as specified in the copyright notice associated with the article.