
Abstract
Objective
We evaluated the ability of a coupled pattern-mining and clustering method to identify homogeneous groups of subjects in terms of healthcare resource use, prognosis and treatment sequences, in renal cancer patients beginning oral anticancer treatment.
Methods
Data were retrieved from the permanent sample of the French medico-administrative database. We applied the CP-SPAM algorithm for pattern mining to healthcare use sequences, followed by hierarchical clustering on principal components (HCPC).
Results and conclusion
We identified 127 individuals with renal cancer with a first reimbursement of an oral anticancer drug between 2010 and 2017. Clustering identified three groups of subjects, and discrimination between these groups was good. These clusters differed significantly in terms of mortality at six and 12 months, and medical follow-up profile (predominantly outpatient or inpatient care, biological monitoring, reimbursement of supportive care drugs). This case study highlights the potential utility of applying sequence-mining algorithms to a large range of healthcare reimbursement data, to identify groups of subjects homogeneous in terms of their care pathways and medical behaviors.
Keywords
Introduction
Since the approval of sorafenib by the FDA in 2005, oral multikinase inhibitors have become the cornerstone treatment for metastatic renal cell carcinoma (mRCC). The 2021 Updated European Association of Urology Guidelines on Renal Cell Carcinoma recommend combinations of immune checkpoint inhibitors plus oral tyrosine kinase inhibitors (TKI) for the first-line treatment of mRCC. This approach has yielded substantial gains in terms of progression-free and overall survival (OS), relative to oral TKIs alone. Oral TKI monotherapy is still considered for patients unable to take or to tolerate checkpoint inhibitors, and for those displaying no response to immunotherapy. 1 Oral TKI treatment sequences in mRCC patients have been little studied 2 and may constitute prognostic hallmarks of disease progression.3,4
The frequency and severity of adverse effects associated with TKI treatment remain high in comparison with intravenous chemotherapies, creating a major challenge in the ambulatory management of mRCC patients, whose healthcare pathways involve both hospital and community healthcare professionals.5,6 Oral TKI have been associated with multiple degradations or failures in care pathways, particularly at the drug dispensing and administration stages. 5
In France, patients’ healthcare pathways is coordinated by general practitioners, but a recent report revealed that patients are generally dissatisfied with their care pathways. 7 In this context, the 2014-2019 Cancer Plan supported the development of organizational initiatives to ensure good management of patients on oral chemotherapy, by improving the prevention and early management of TKI toxicities through a better cooperation between community and hospital healthcare professionals. 6 An understanding of healthcare trajectories is essential for healthcare planning and optimal allocation of resources, but few data are available concerning healthcare resource use by mRCC patients on TKI, making the assessment of the quality of clinical management difficult.
This study aimed to determine whether a combination of pattern identification in care trajectory sequences and sequence clustering methods could be applied to data from healthcare reimbursement databases to identify mRCC patients with homogeneous care trajectories, particularly in terms of oral TKI treatment sequences and prognosis.
Methods
The results of the study are reported according to the STROBE guidelines. 8
Design
We performed a retrospective descriptive cohort study on healthcare use during the year following the initiation of oral TKI treatment, in patients with mRCC.
Data source
Ambulatory healthcare data were retrieved from a representative French healthcare database (EGB: Échantillon Généraliste des Bénéficiaires) covering 1/97th of the nationwide healthcare insurance database (SNIIRAM: Système National d'Information Inter-Régime de l’Assurance Maladies, collecting data from 66 million people, i.e. more than 97% of the French population). The EGB database is representative of the French population (random selection of beneficiaries) regarding age (five-year increments), sex and healthcare expenditures per beneficiary . 9 Each patient is identified with a unique anonymous number in the database. Ambulatory data from the EGB are merged with hospital diagnosis through the Programme de Médicalisation des Systèmes d’Information (PMSI).
Identification of renal cancer patients
All renal cancer patients were identified in the EGB database between 1 January 2010 and 31 December 2017 with a major long-term illness (Affection Longue Durée, ALD) associated with an ICD-10 code for renal cancer (C64, C65, C66, C88 or D091), with a starting date in the same year or the preceding year (year n or n-1), and/or patients with a hospital discharge diagnosis of renal cancer during year n or n-1 (ICD-10 codes same ICD-10 codes as a major or related diagnosis).10,11 Comorbidity was assessed with the Charlson comorbidity index, based on hospital discharge diagnoses before the index date for TKI initiation. 12
Extraction of healthcare use data
We identified reimbursements for oral anticancer drug approved for the treatment of mRCC (i.e. sunitinib, axitinib, cabozantinib, everolimus, or pazopanib) based on Code Identifiant la Présentation 13 (CIP-13) codes. The one-year follow-up period began on the data of the first reimbursement for an oral TKI. For healthcare service use, we extracted, for each subject, the number of outpatient visits to a general practitioner and specialists, the number of visits to hospital physicians and the number of admissions to the day hospital and emergency department. We calculated the Bice-Boxerman Continuity of Care Index (COCI) to assess the level of dispersion of appointments between different professionals (considering general practitioners, community specialists and hospital specialists). This index ranges from a minimum of 0 to a maximum of 1 (all appointments with the same professional during the follow-up) and is calculated as follows
13
:

We also extracted reimbursements of drugs prescribed for the treatment of adverse effects associated with TKI or associated with disease progression: antinausea (ATC class: A04), antidiarrhea (A07), antihypertensive (C02), and opiates (N02A). Reimbursement data for the biological monitoring of TKI therapy, as recommended in national guidelines, were also extracted based on NGAB codes, including renal (NGAB codes: 592, 2004) and hepatic (codes: 514, 516, 517, 519, 1601) function evaluation and total blood counts (TBC, codes: 1104). For each subject, we calculated the medication possession ratio (MPR), corresponding to the total number of days of TKI treatment collected at the community pharmacy, divided by the number of days of follow-up (number of days between TKI initiation and end of follow-up or death). 14
Pattern mining in care trajectories
Frequent care sequences were identified from each individual chronologically ordered care trajectory with a sequential pattern-mining algorithm. We considered visits to general practitioners and community specialists, and visits to hospital physicians, emergency department and admissions to day hospital in the construction of care trajectories. Sequential pattern mining considers the order of each element in the sequence. A frequent sequence is defined as a string of characters appearing recurrently in a dataset, at a frequency higher than a fixed minimum support threshold. We used the contextual sequential pattern mining (CM-SPAM) algorithm to identify frequent sequences. 15 This algorithm was executed with SPMF (v.2.42), with a support threshold of 30% and a maximum gap of 1, to study consecutive care events.
Clustering models
Clusters were identified by hierarchical principal component classification, on the basis of the frequent sequences identified by CM-SPAM. We used a mixed dataset composed of continuous and categorical (including all frequent sequences) variables, making utilization of factor analysis of mixed data (FAMD) approach appropriate. FAMD is a clustering method used to summarize a dataset through a main axis, corresponding to a linear combination of variables. 16 Vital status at 6 and 12 months was added as additional variables. The choice of the optimal number of dimensions explaining our dataset was based on the elbow rule: interpretable results with the maximum observed inertia and the minimum factor. We then performed hierarchical clustering on principal components (HCPC) based on the FAMD results. 17 For each subject, we calculated a score quantifying the similarity between the subject’s follow-up sequence and each of the frequent sequences identified. A score of 1 was attributed if the follow-up sequence was identical to the frequent sequence, and a score of 0 otherwise.
Sensitivity analysis
We first performed a cross-validation using 4 random subsamples equivalent to approximatively 75% of the complete database. We evaluated the variation in the number of sequences identified and the number of subjects in each cluster. Second, we modified the support from 30% (main analysis) to 70% to test the variation in the number of sequences identified and the proportion of subjects reclassified. Finally, we used K-means clustering algorithm with a prespecified number of 3 clusters as an alternative to HCPC method, to test the variation in the subject cluster assignment. Results of the sensitivity analysis are given in Supplemental material 1.
Statistical analysis
Qualitative variables are expressed as numbers and associated percentages, and quantitative variables are expressed as the mean ± SD or median and interquartile range. Groups were compared in parametric Student’s t test or non-parametric Mann-Whitney-Wilcoxon/Kruskal Wallis tests for quantitative variables, depending on variable distribution, and with Chi-squared tests/Fisher’s test for qualitative variables. A p < 0.05 were considered statistically significant. Statistical analysis was performed with R-Studio software (version 1.4.1106).
Ethics and data protection
Access to the database is legally authorized without the need for permission from the national data protection agency (CNIL).
Results
Characteristics of the population
We identified 1442 individuals with renal cancer in the EGB database from 2010 to 2018. At least one oral TKI reimbursement was recorded in the EGB database for 127 of these individuals (8.8%). A flowchart of the study is provided in Figure 1. Mean age was 65.2 ± 10.7 years (range: 32 to 86 years), and most subjects were men (70.1%), which corresponded to the epidemiology of renal cancer in France.
18
Flowchart of the study.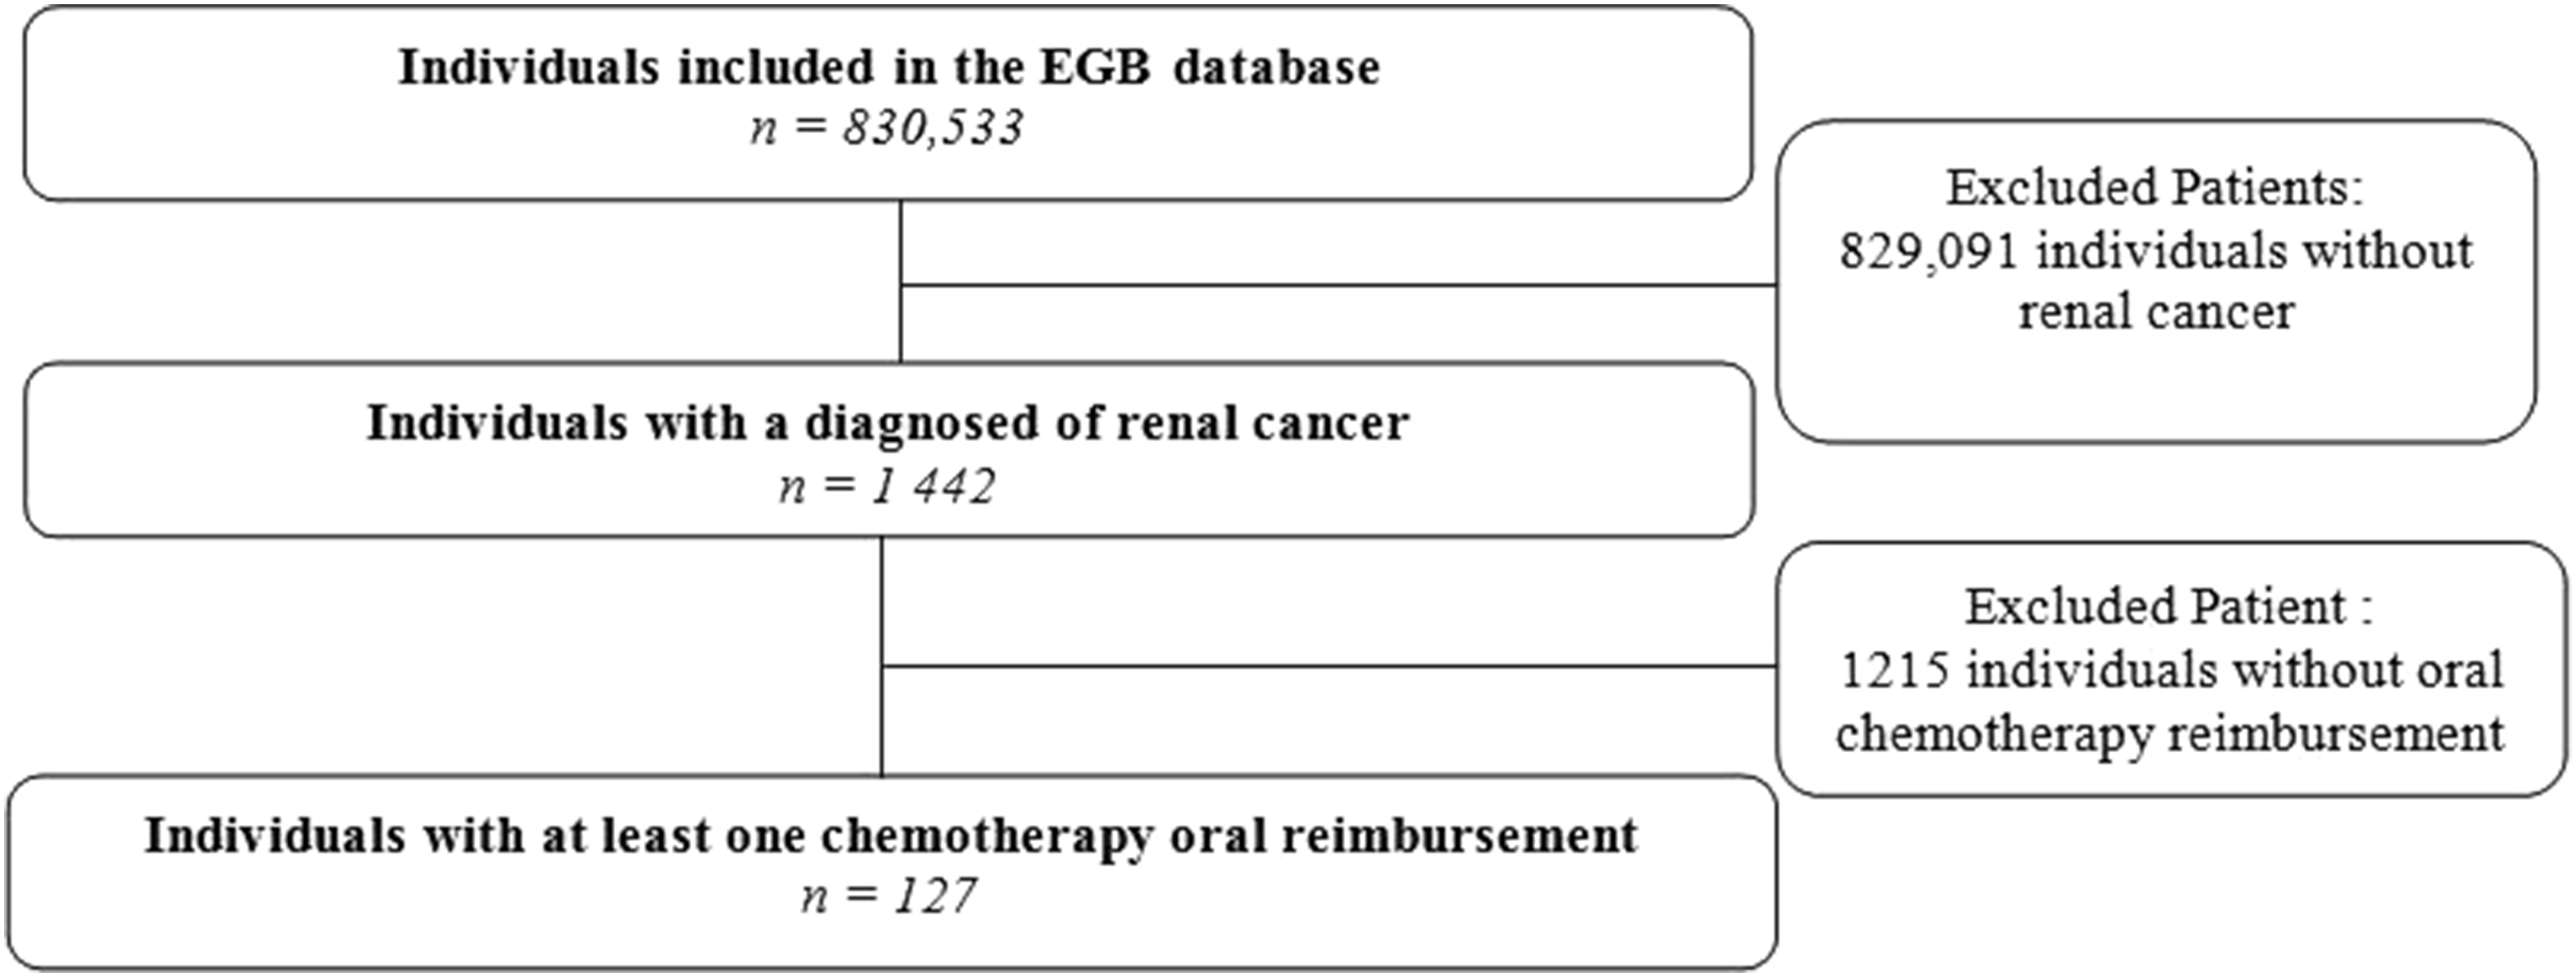
Mean follow-up duration was 299 ± 112.9 days during the first year after the oral TKI initiation. Twenty-five (19.7%) subjects died by six months, and 40 (31.5%) died by one year after treatment initiation. The mean number of long-term diseases per patient was 1.4 ± 0.8.
Pattern mining
We identified 120 frequent sequences using the CM-SPAM algorithm, with 30% support and a maximum gap of 1. The list of sequences and associated supports is provided in the Supplemental material 2.
Cluster identification
We identified homogeneous healthcare use groups with a clustering method based on the frequent sequences identified by the algorithm. The optimal number of dimensions explaining our data set well with interpretable results, maximum observed inertia and the minimum factor was 3 (Scree Plot is given in Figure 2.). The three axes obtained accounted for 42.9% of the variability observed in our dataset. Scree plot.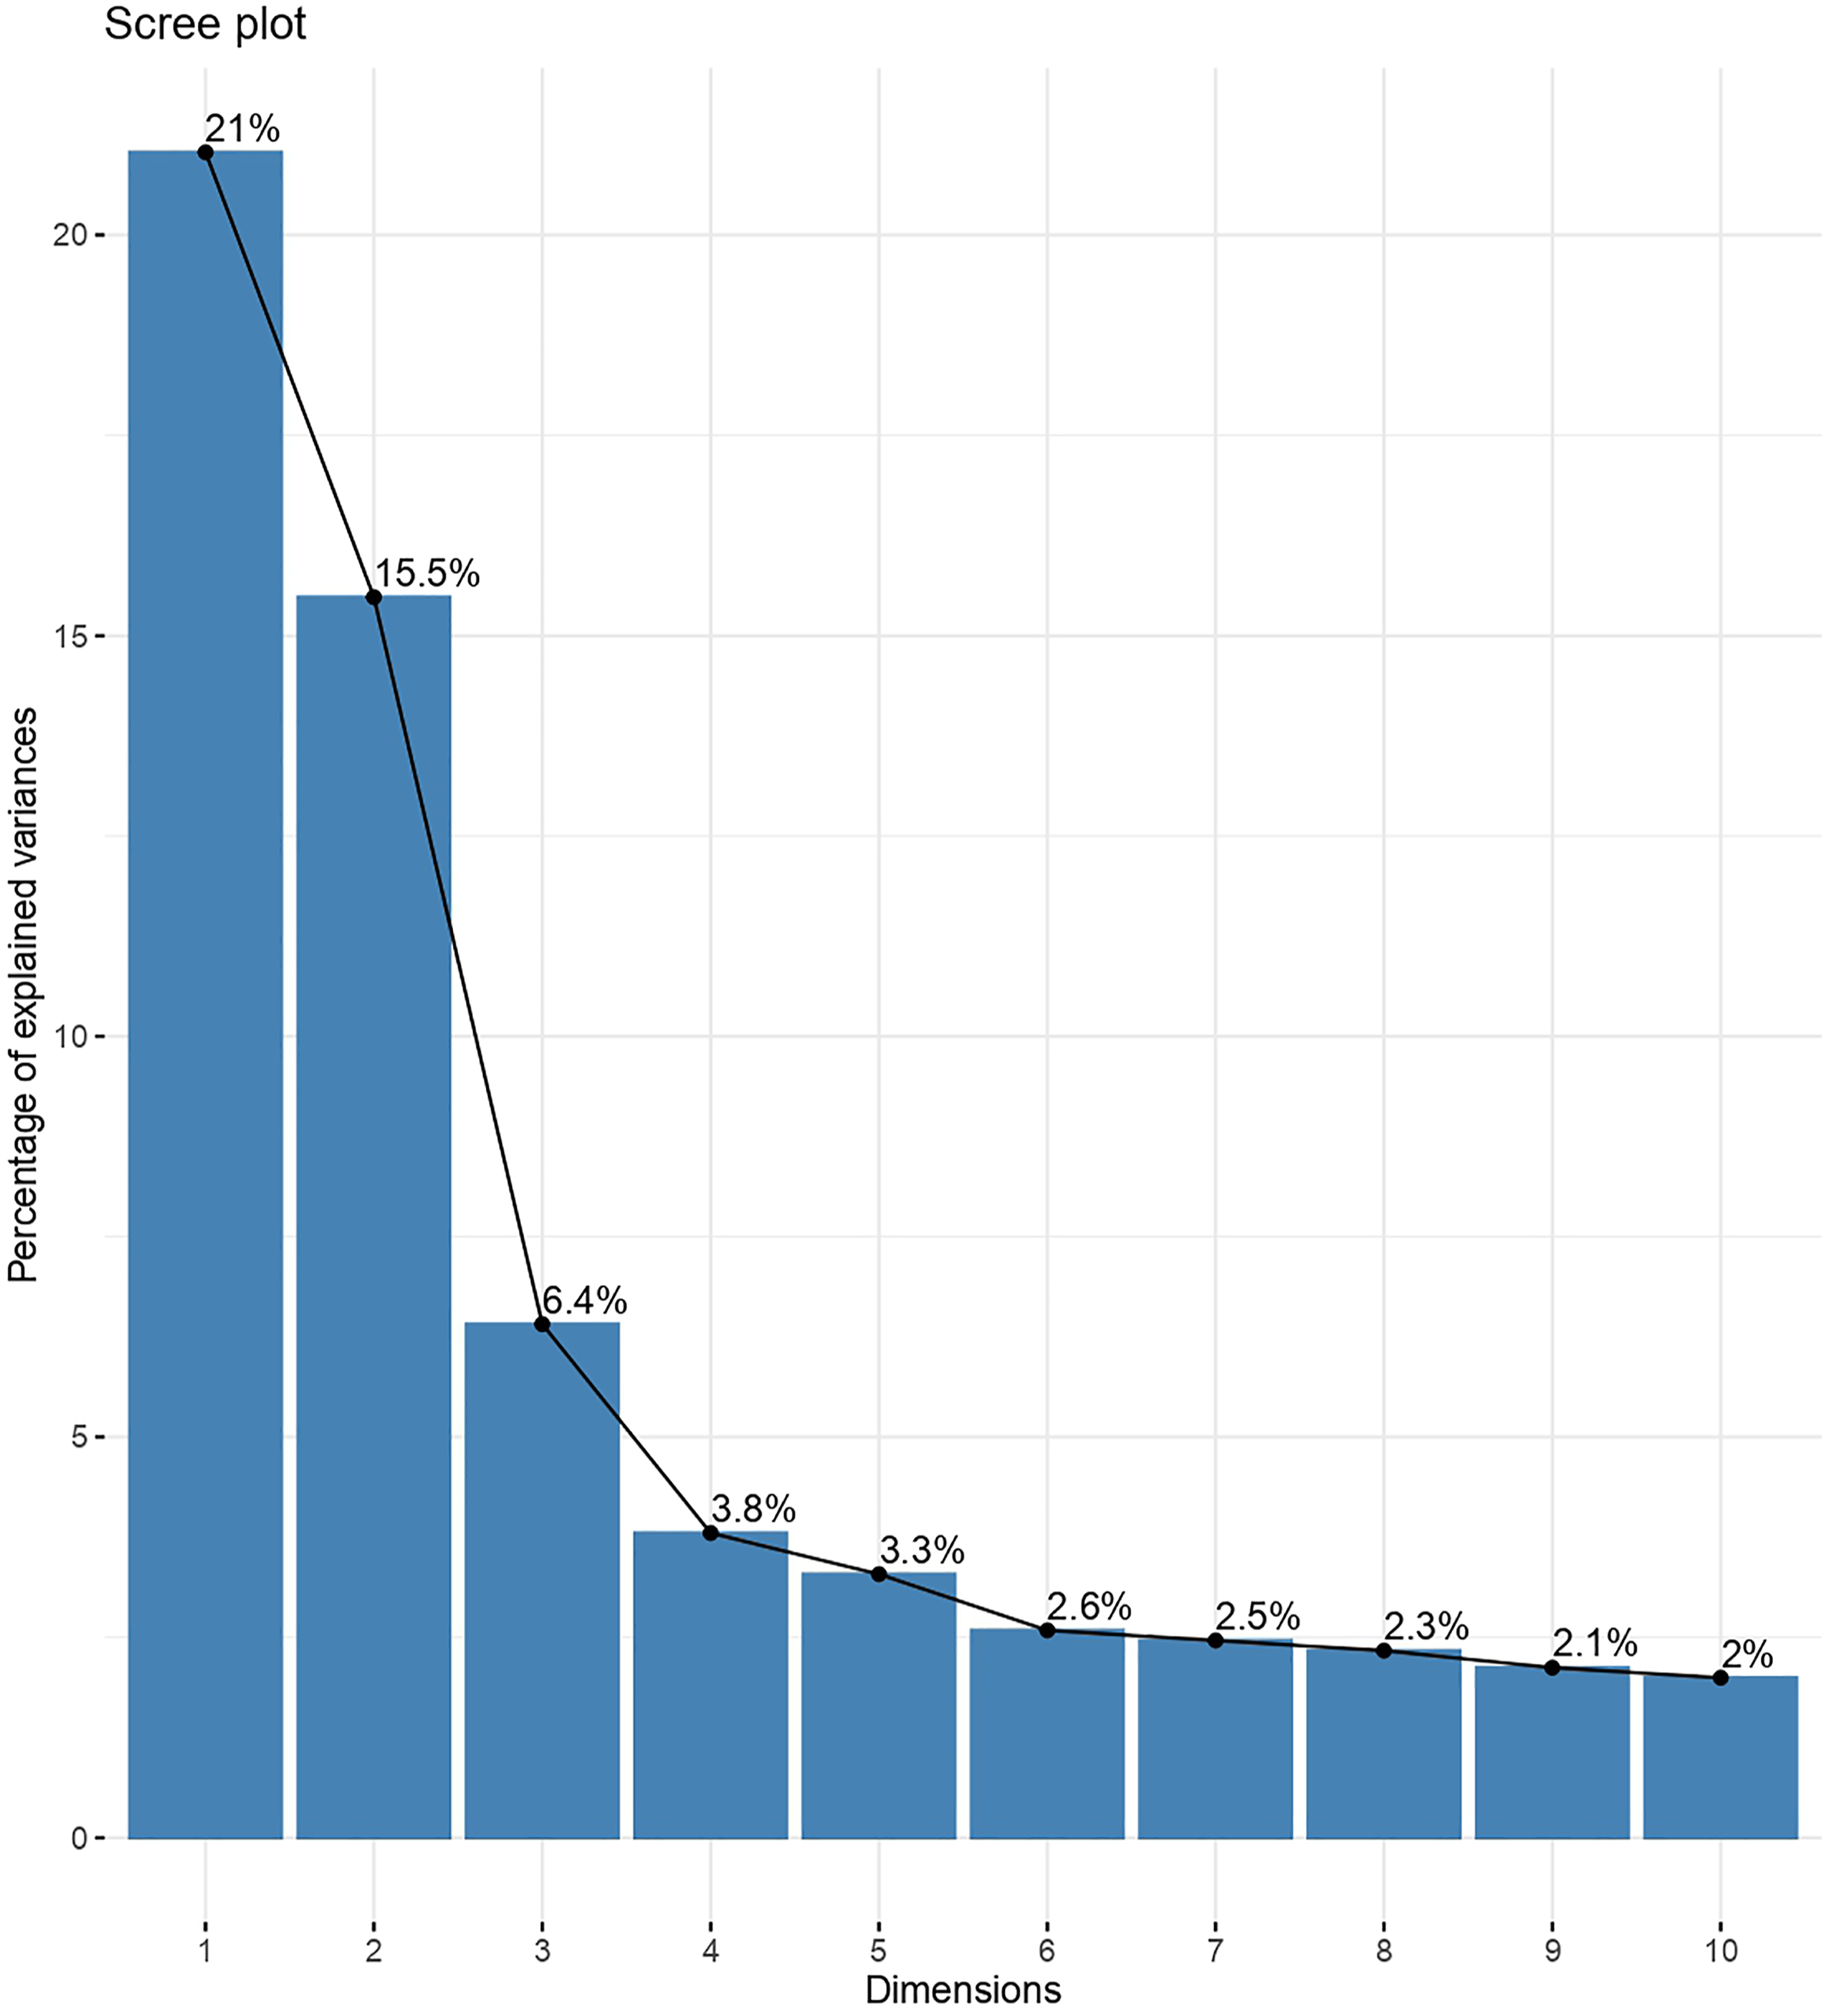
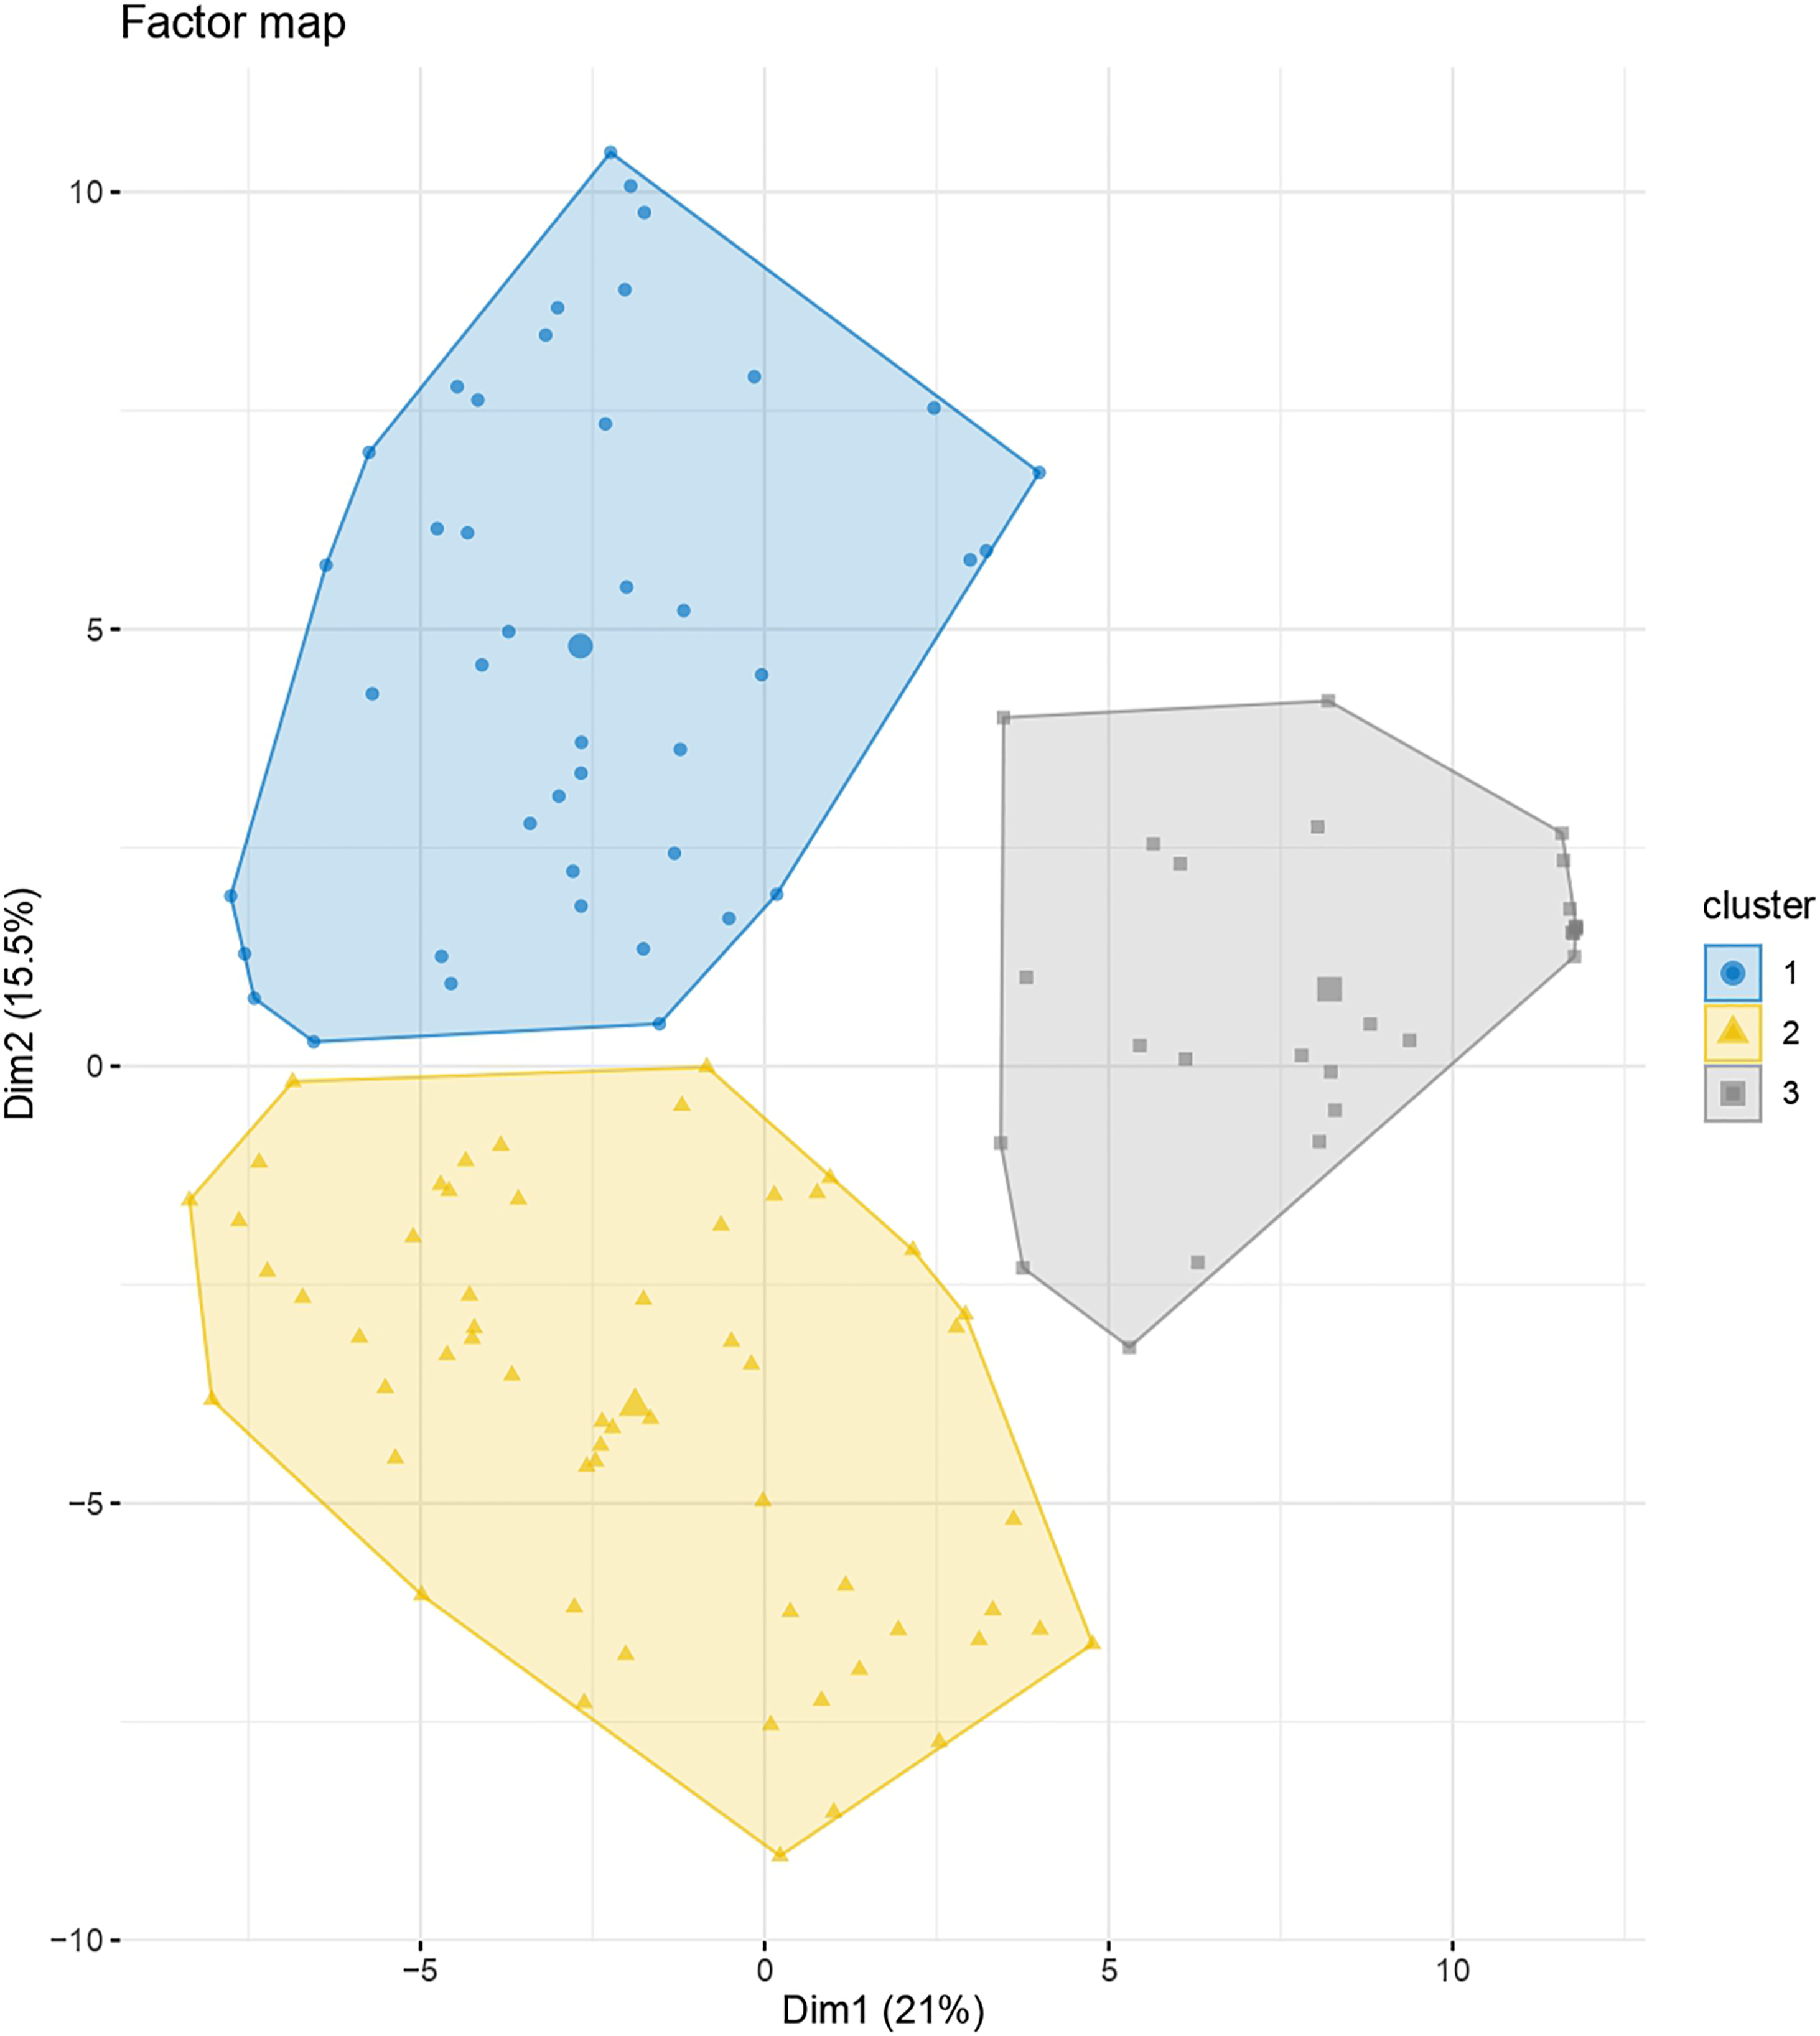
We then applied HCPC to the FAMD results. Axes 1 and 2 discriminated three homogeneous clusters of subjects well, as shown in Figure 3 and Figure 4 (distribution of the 120 frequent sequences is given in Supplemental material 3). Clusters were relatively balanced, with 42 subjects in cluster 1, 58 in cluster 2 and 27 in cluster 3. Cluster dendrogram showing three distinct homogeneous clusters of subjects. Factor map showing the distribution of the 127 subjects according to axes 1 and 2.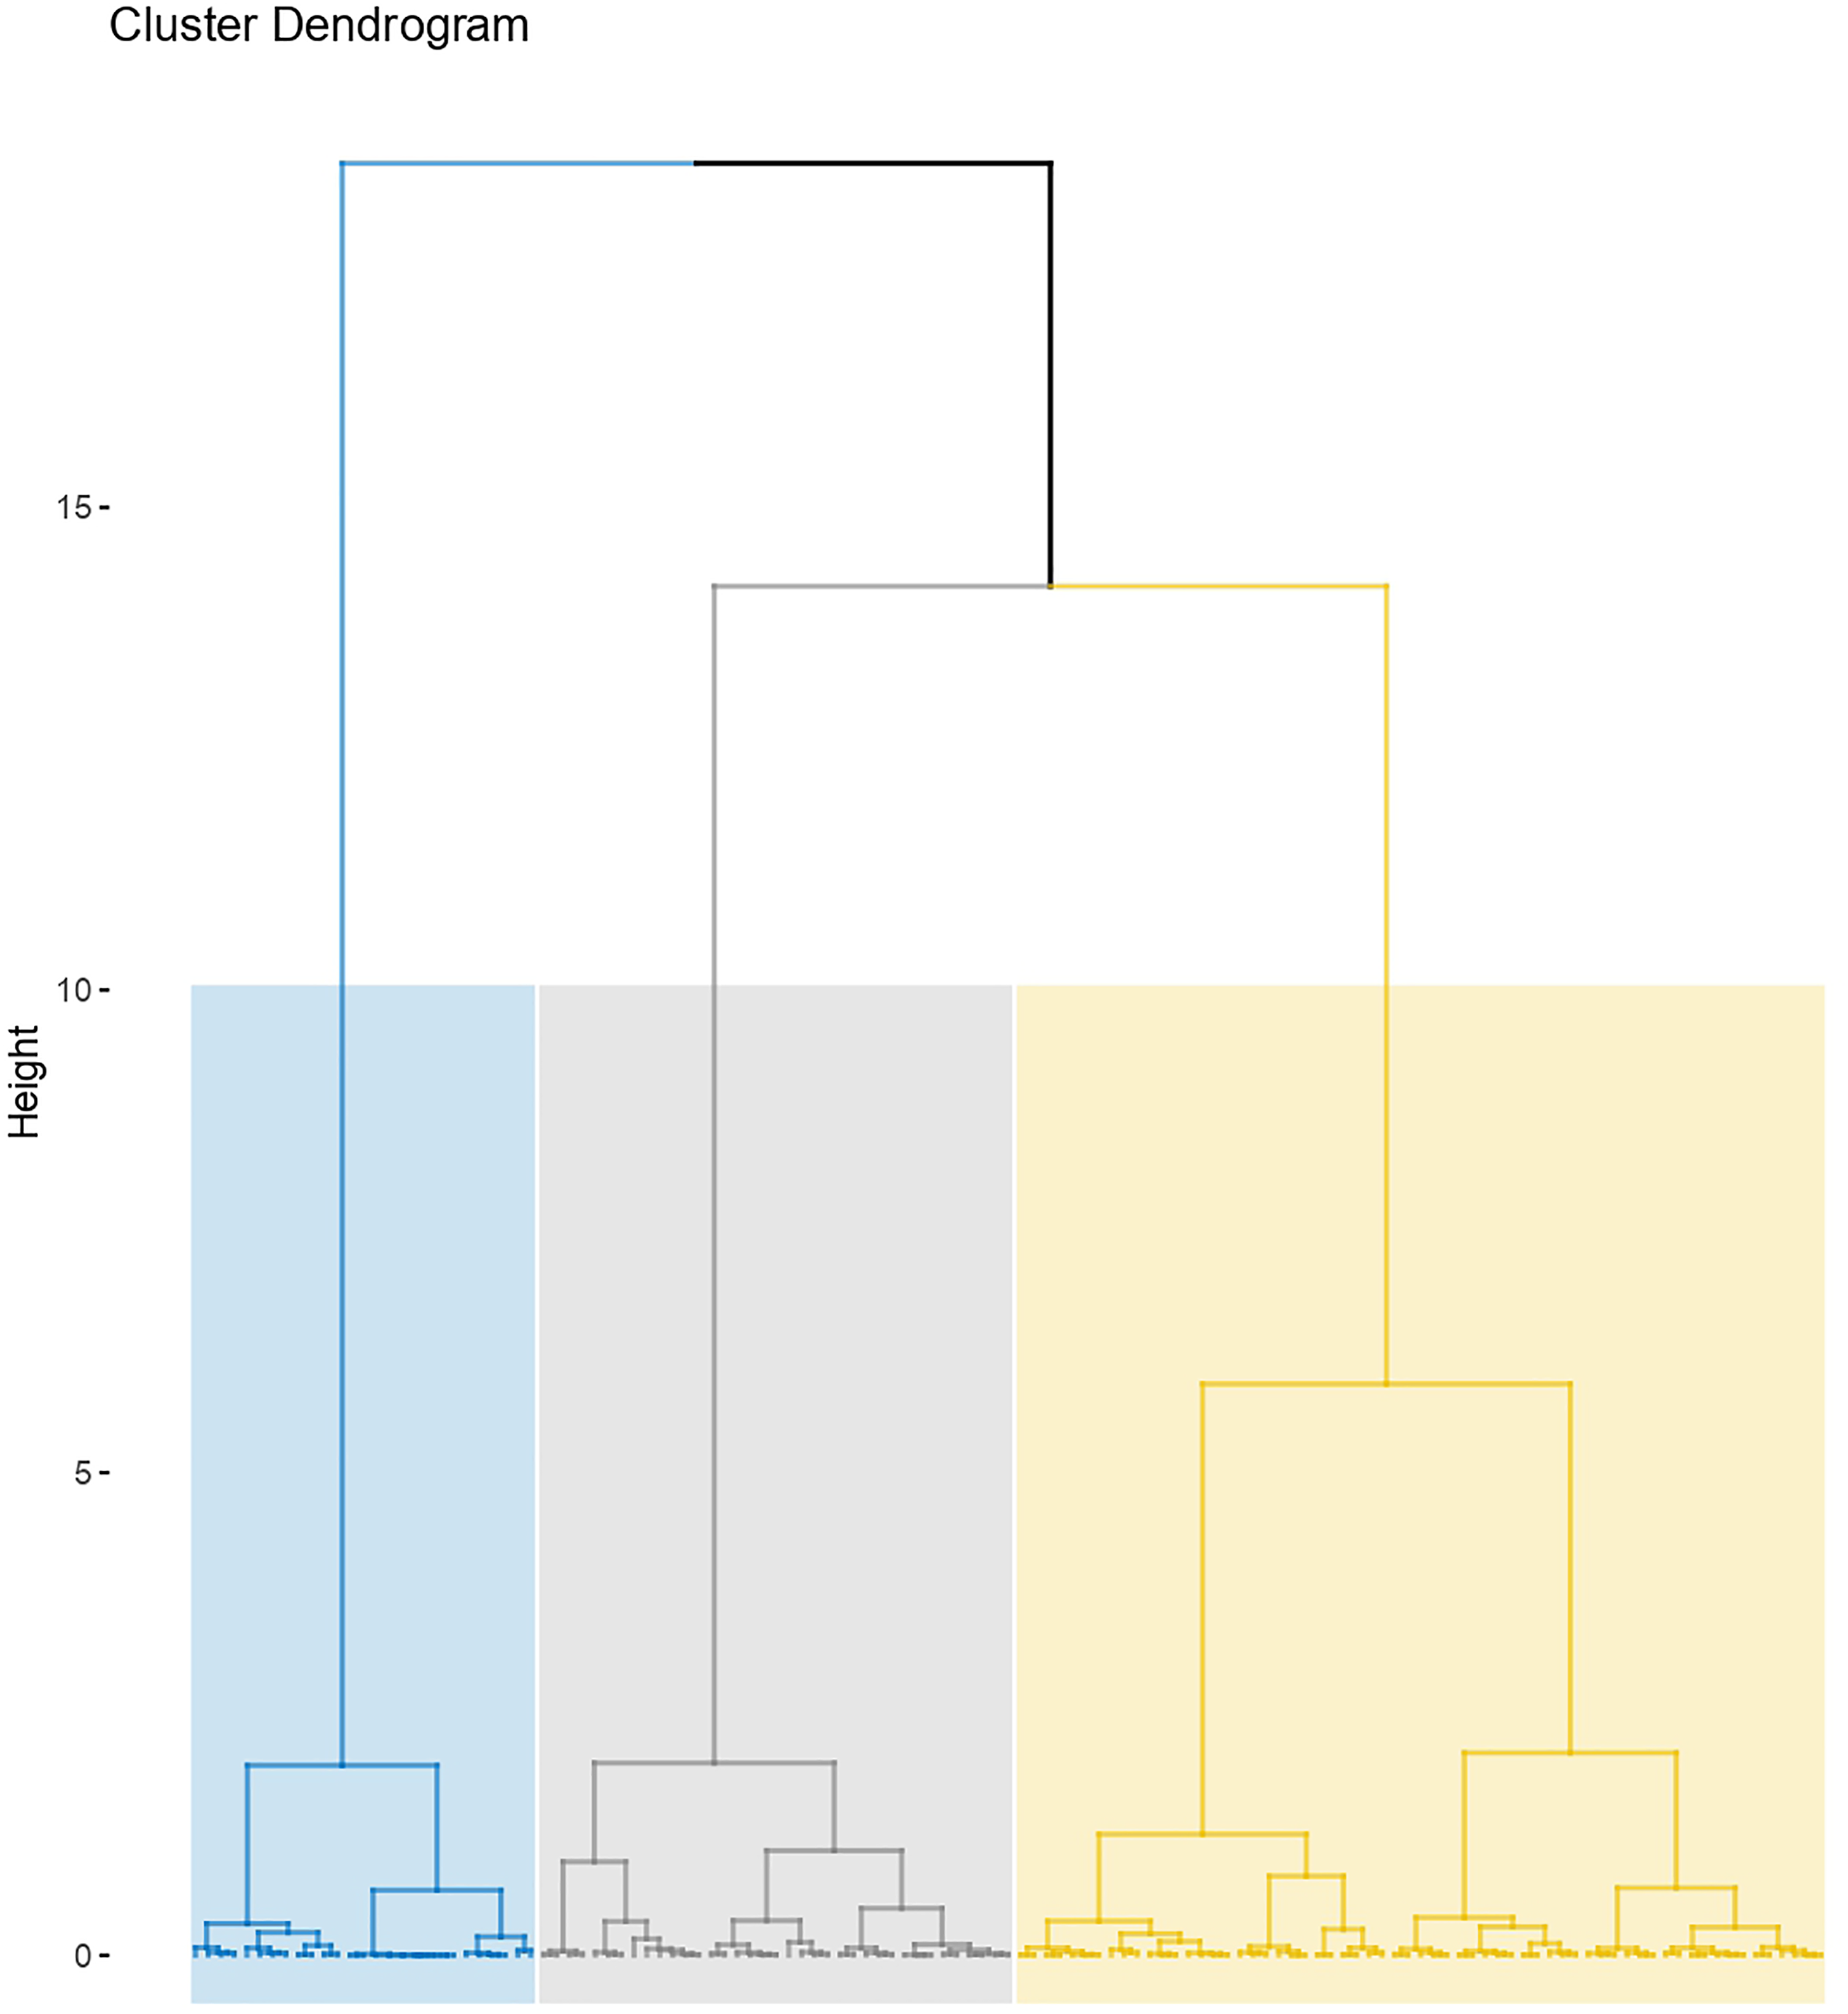
Patients and healthcare use profiles in each cluster
Healthcare use profiles in clusters 1, 2 and 3.
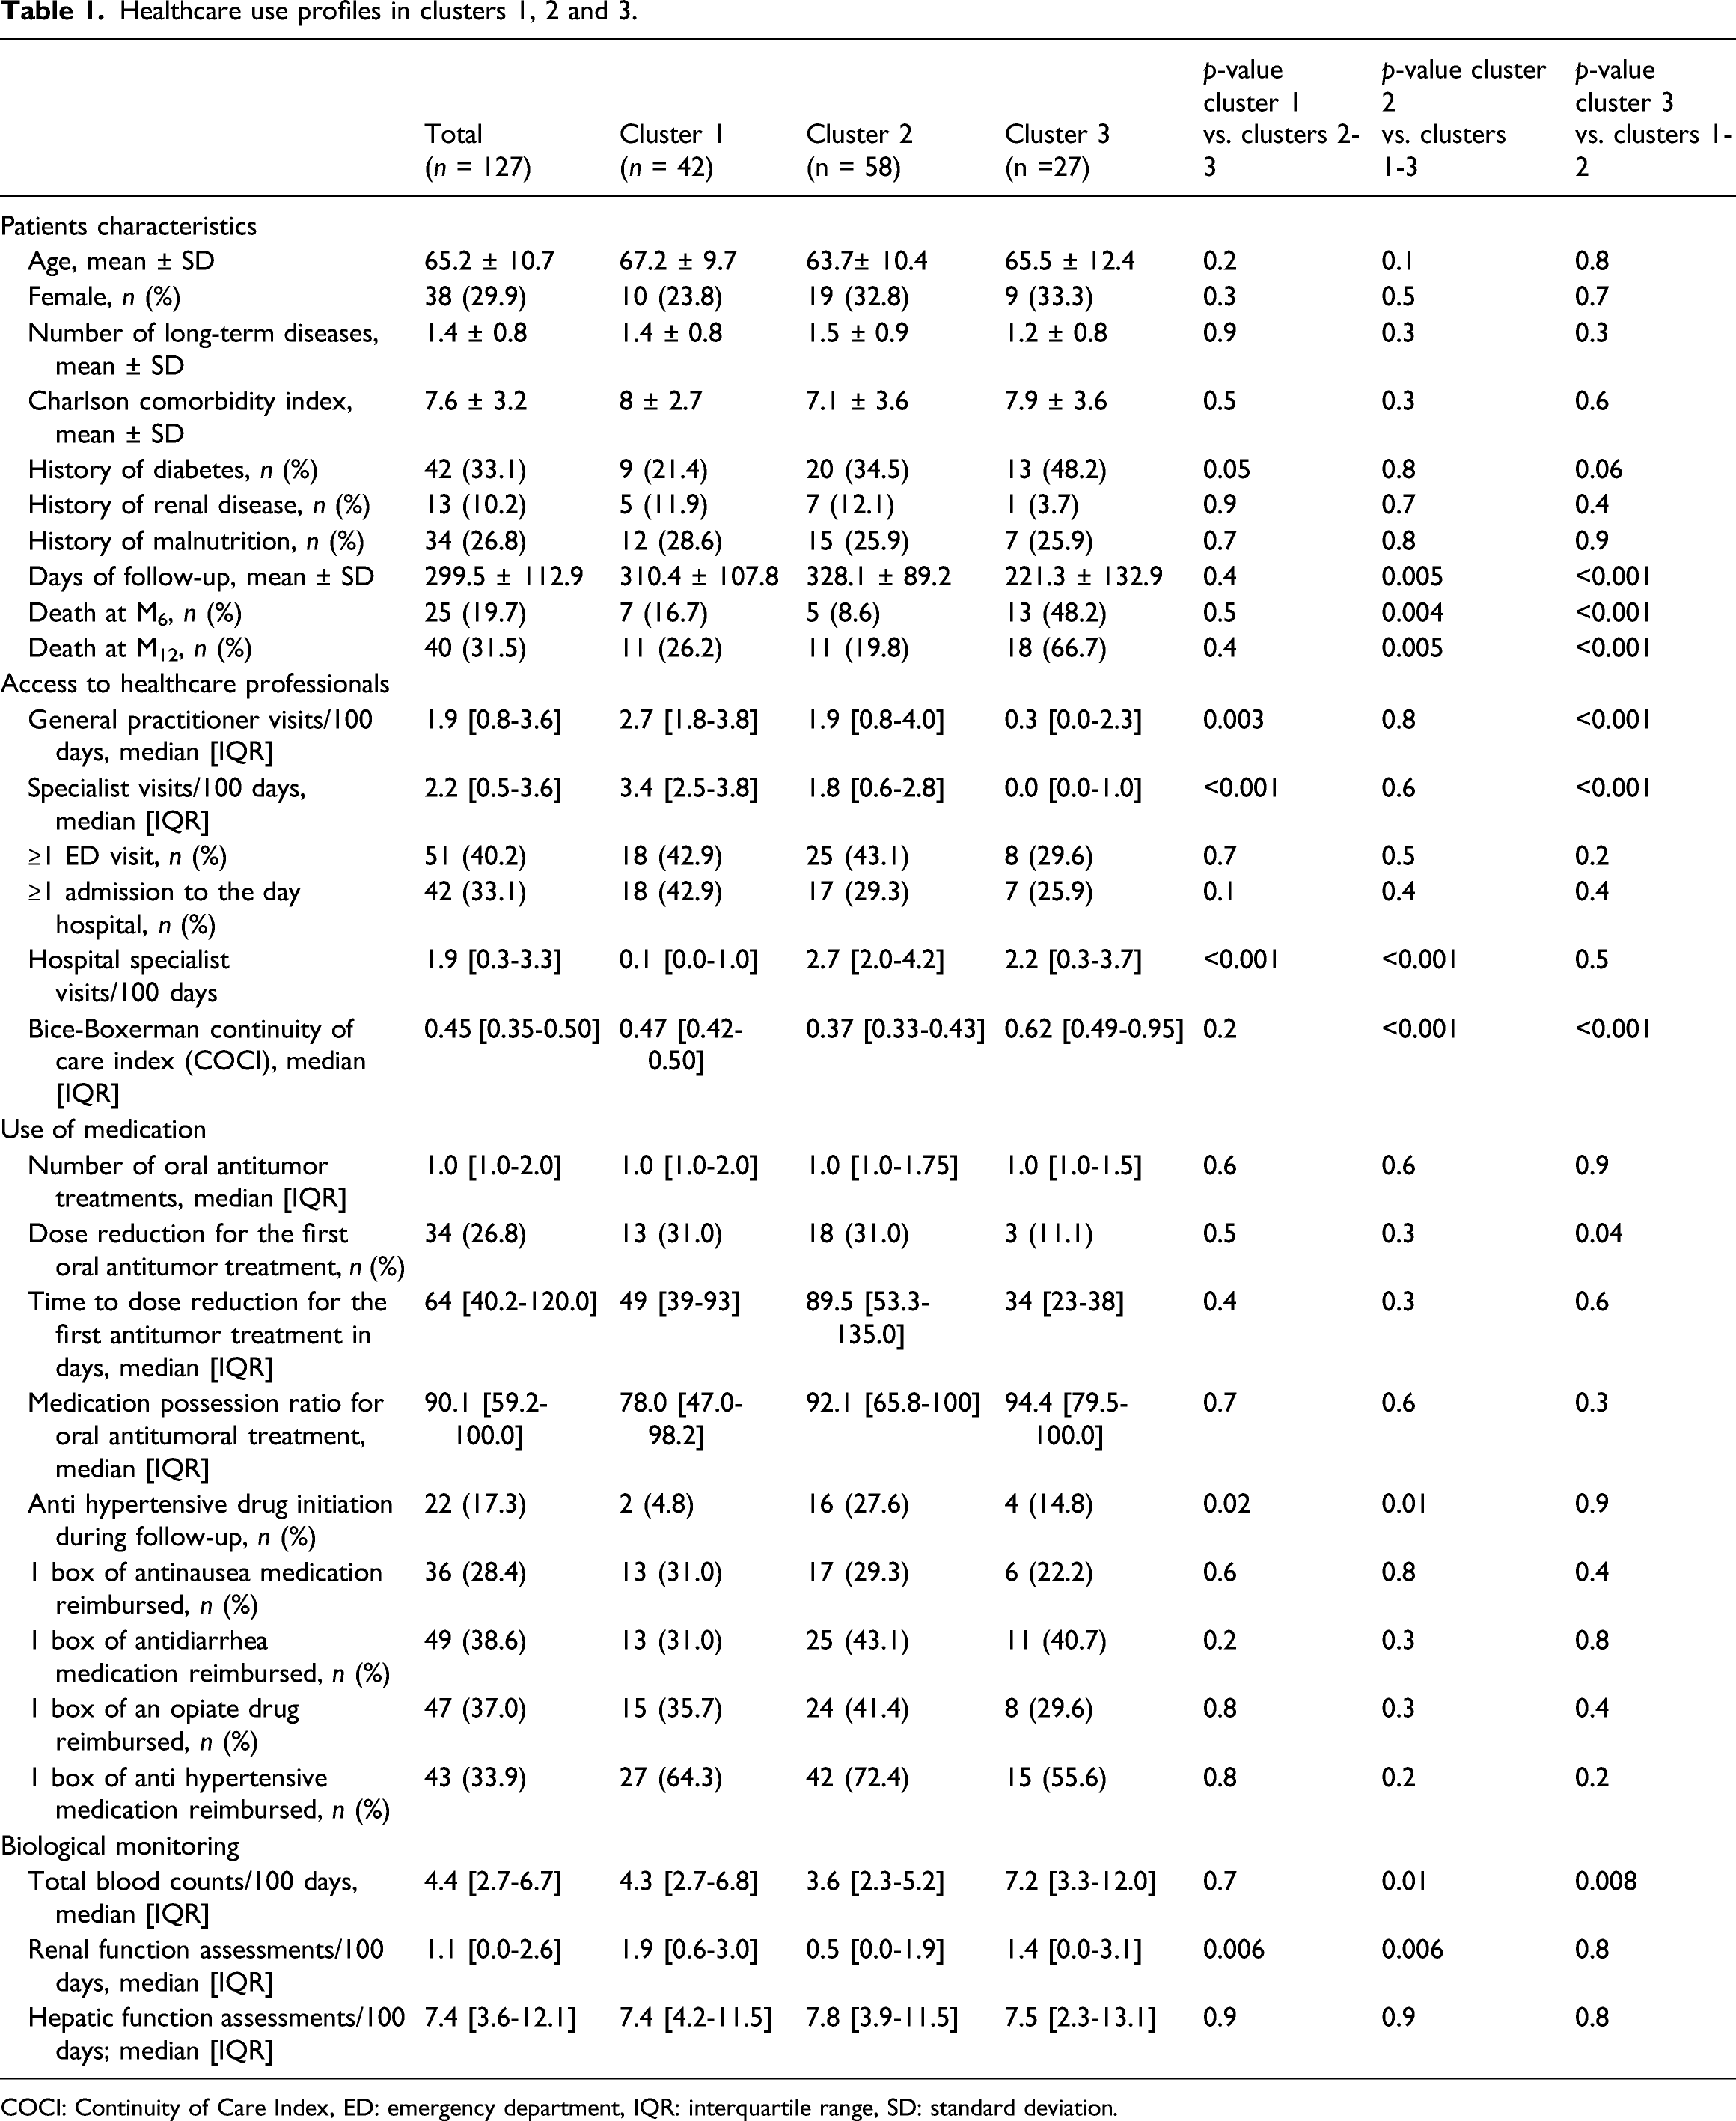
COCI: Continuity of Care Index, ED: emergency department, IQR: interquartile range, SD: standard deviation.
We found that cluster 1 (n = 42) was associated with a mean follow-up of 310.4 ± 107.8 days, a 6-`month mortality of 16.7% and a significantly higher rate of access to outpatient care during follow-up (median of 2.7 visits/100 days to a general practitioner, and 3.4 visits/100 days to a community specialist) than for clusters 2+3, and a lower rate of access to hospital practitioners than the total population. In cluster 1, 18 (42.9%) subjects visited the emergency department, and 18 subjects (42.9%) were admitted to the day hospital. The continuity of care index (COCI) was 0.47. The proportion of subjects initiating an antihypertensive treatment after TKI initiation was smaller for cluster 1 (4.8%) than for clusters 2+3. For the first TKI prescribed during the one-year follow-up period, 13 (31%) subjects experienced a dose reduction, after a median of 49 days [39-93 days]. The median MPR was 78% for the first year of TKI treatment. This value is lower than that for clusters 2+3, but not significantly so.
Subjects in cluster 2 tended to be younger (63.7 ± 10.4, p = 0.1 versus cluster 1+3), and comorbidity rate was lower in cluster 2 than in clusters 1+3 (Charlson index 7.1 ± 3.6). Follow-up was longer in cluster 2, with a mean value of 328.1 ± 89.2 days. Cluster 2 also had the lowest 6-month (8.6%) and 1-year (19.8%) mortality rates. We found that 43.1% of the subjects attended the emergency department at least once during the follow-up, and 29.3% was admitted to the day hospital. This cluster was associated with a higher rate of referral to hospital specialists and a lower rate of outpatient visits to community practitioners. The COCI was lower (0.37) than that of cluster 1+3, reflecting visits to a greater diversity of practitioners during follow-up. The frequency of dose reduction for the first TKI prescribed was similar to that for cluster 1, but the time to first dose reduction was longer (although not significantly so), at 89.5 days. In this cluster, the rate of ambulatory blood and renal surveillance was significantly lower than that in clusters 1+3.
Cluster 3 had the shortest follow-up, of 221.3 ± 132.9 days, and the highest 6-month and 1-year mortality rates (48.2% and 66.7%, respectively), with a low utilization of community practitioners and a higher rate of referral to hospital practitioners. The COCI index was significantly higher than that of clusters 1+2 (0.62), revealing visits to a limited diversity of physicians during the follow-up. Finally, this cluster was associated with a higher rate of ambulatory biological monitoring, which was significant for blood monitoring.
The proportion of subjects with reimbursements for supportive care treatments (i.e. anti-nausea, antidiarrhea and opiates) did not differ significantly between clusters and ranged from 28.4% to 38.6%.
TKI sequences
In all clusters, the main first-line therapy was sunitinib. The rate of maintenance of this therapy (without considering possible dose reductions) at six months and one year was high in cluster 2, intermediate in cluster 1, and low in cluster 3 (for the one-year maintenance rates—47.5%, 33.3% and 4.5% respectively—see Figure 5). Pazopanib was the second most frequent first-line treatment in clusters 1 and 2, with a 1-year maintenance rate of 57.1% and 61.5%, respectively; but this treatment was not found in cluster 3. Axitinib and sorafenib were also identified as minor first-line treatment choices, as was everolimus in clusters 1 and 3. At the end of follow-up, cabozantinib was also found (cluster 2). In cluster 3, only 11.1% of subjects were still receiving reimbursements for an oral anticancer drug, versus 50% of those in cluster 1, and 65.5% of those in cluster 2. At six months, the rate of continuation of the first treatment was 42.8% for cluster 1, 58.6% for cluster 2 and 11.1% for cluster 3. At one year, this rate was 33.3% for cluster 1, 41.4% for cluster 2 and 7.4% for cluster 3. Treatment sequences between T0 (initiation of the first oral anticancer drug), 6th month and 12th month, in the total sample (panel A), in cluster 1 (panel B), in cluster 2 (panel C) and in cluster 3 (panel D).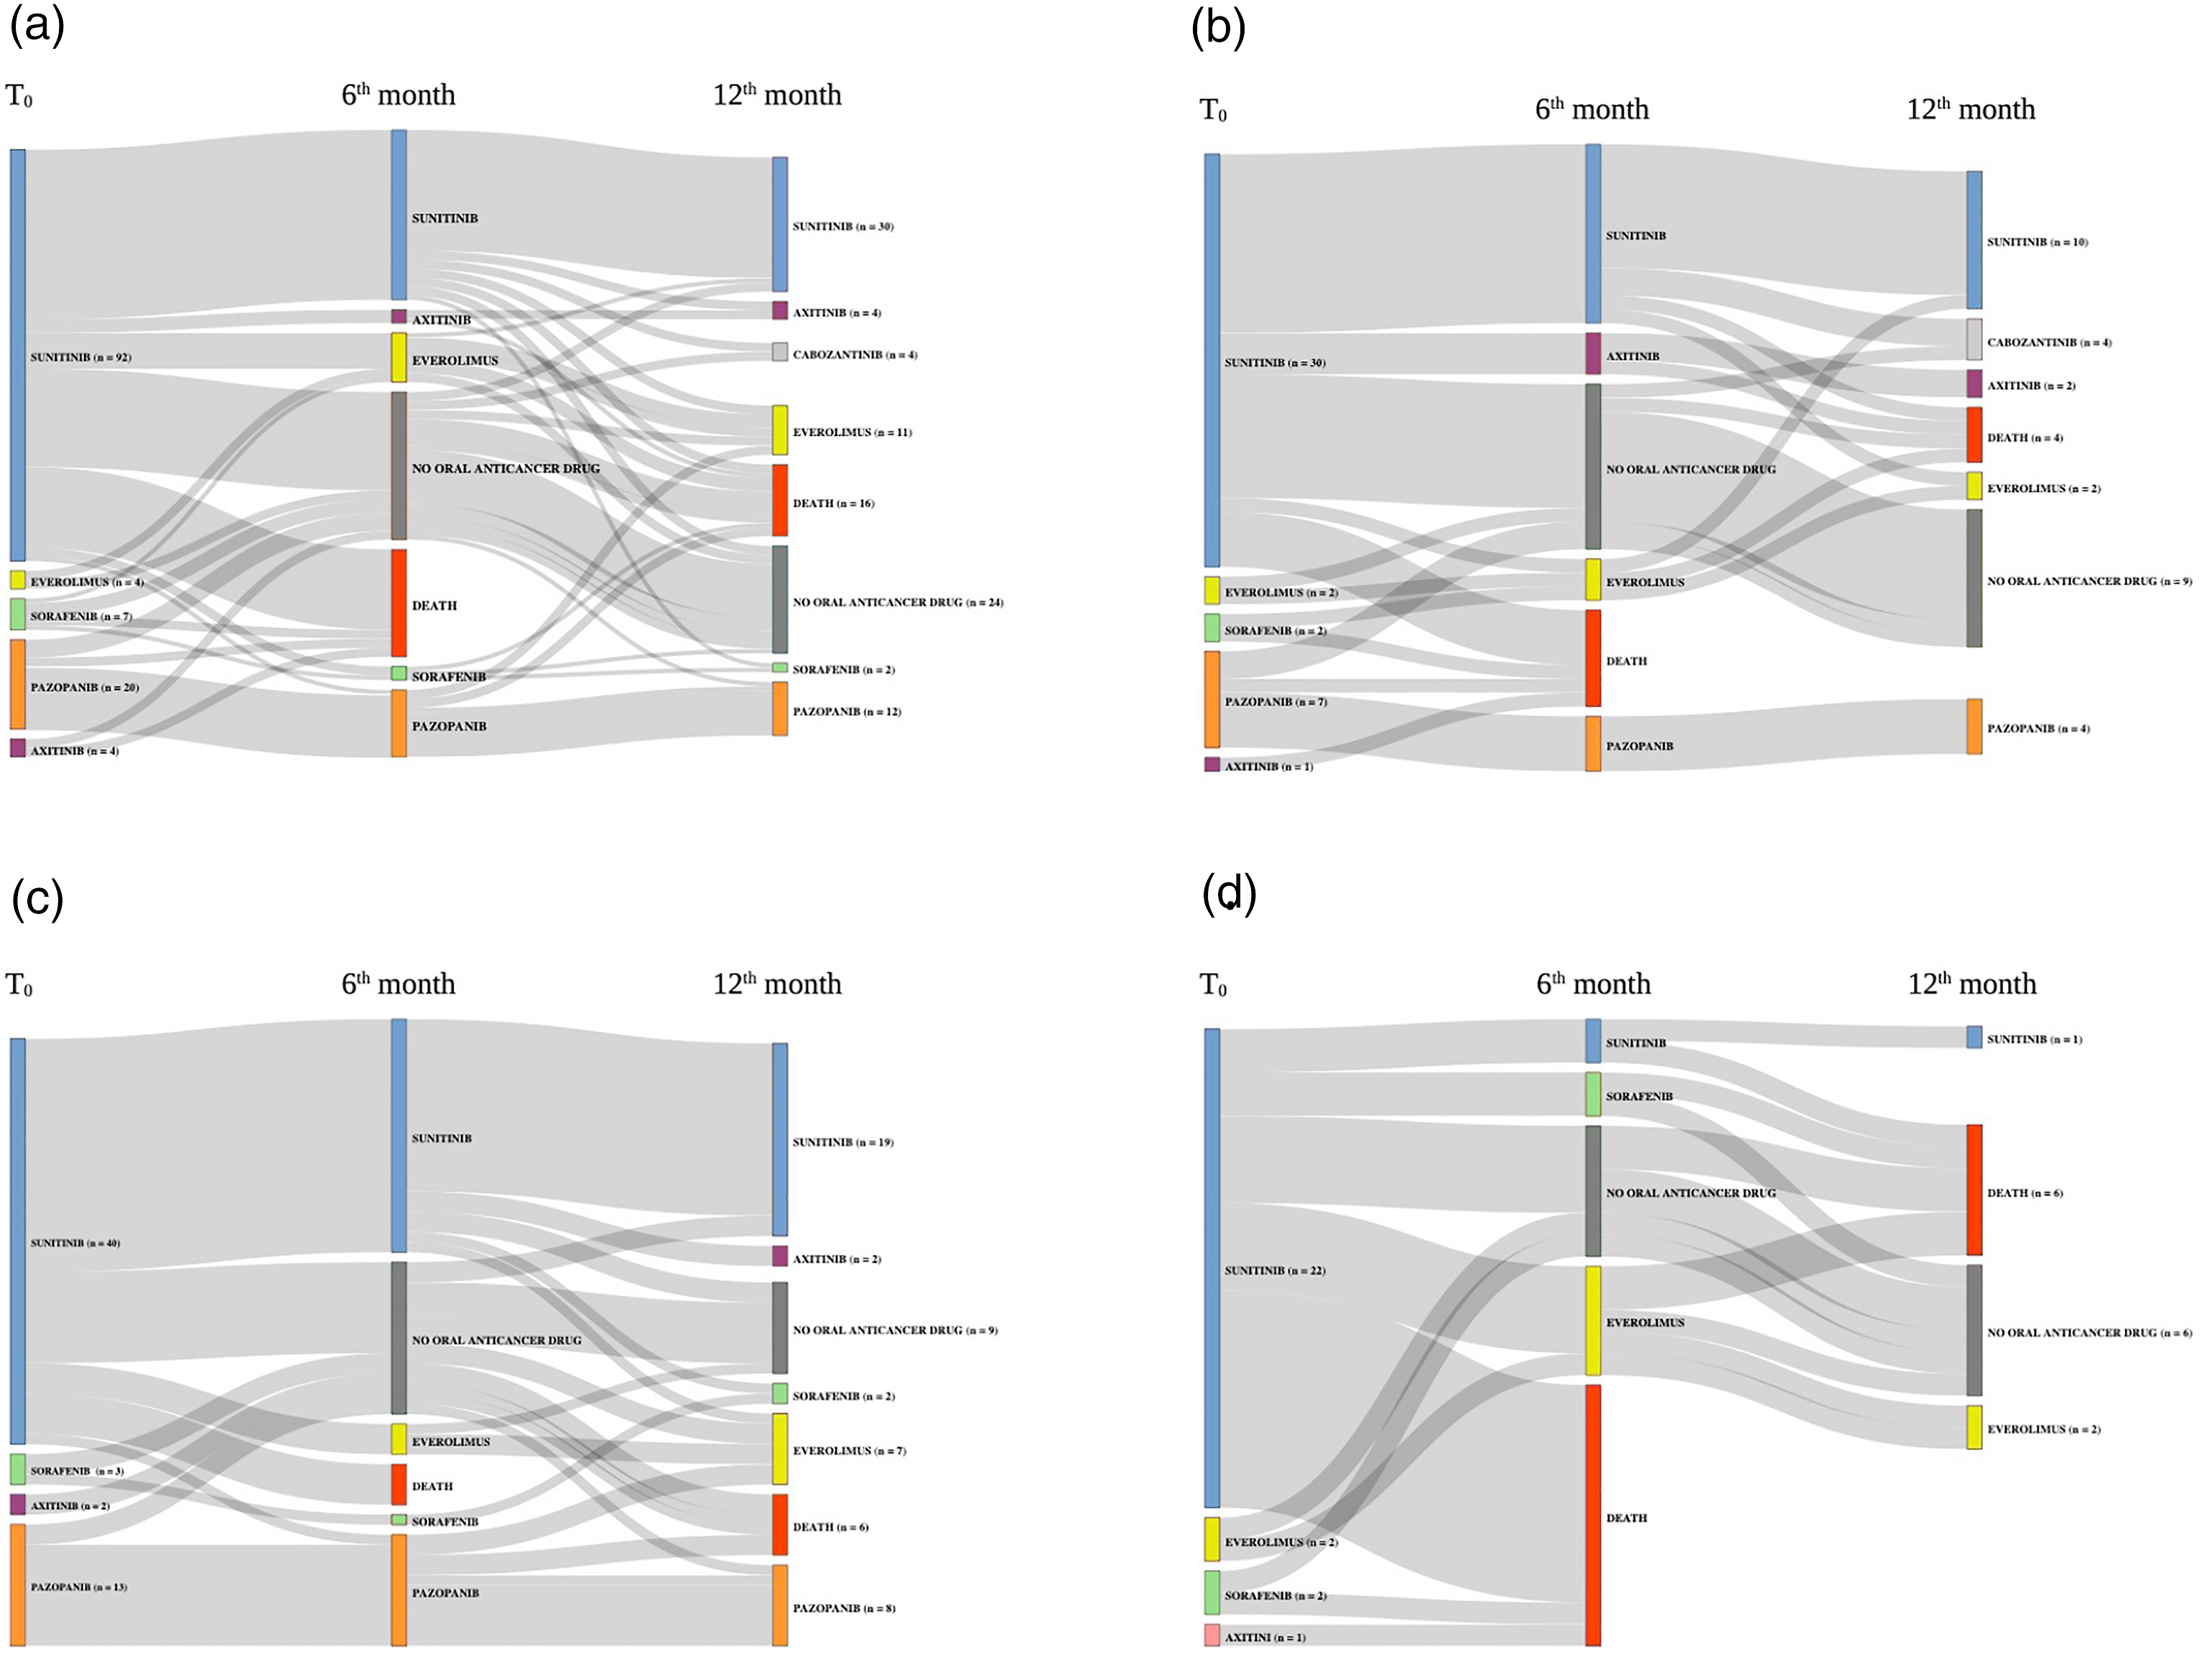
Sensitivity analysis
The cross-validation in 4 different random subsamples showed that the variation in number of frequent sequences identified between subsamples was low (i.e. ≤ 10%), and the proportion of subjects reclassified in another cluster was <3.5%.
When applying a K-means clustering algorithm with a predefined number of three clusters instead of HCPC, we found that all the regions maintained the same allocation of hierarchical clustering (see Supplemental material 1).
Discussion
This is, to our knowledge, the first study of the use of the CM-SPAM algorithm coupled with clustering methods to depict the care trajectories of cancer patients included in a healthcare reimbursement database. Data mining approaches have already been used in French healthcare databases, to study care trajectories in the context of breast cancer with a formal concept analysis, 19 prenatal care consumption with state sequence analysis 20 or acute coronary syndrome with contextual frequent pattern mining. 21 We hypothesized that the order of consecutive care in the patient sequence would be crucial for the identification of hallmarks of quality of care. We therefore used a sequential pattern mining method, with restrictive rules in terms of support (we selected sequences found at least in 30% of subjects) and gaps (we investigated only sequences of consecutive cares). We also created a matrix of similarity index, assigning a coefficient of 1 if a given sequence was found in a patient’s care trajectory, and 0 otherwise, to compare patients with frequent sequences with more weight given to individuals following strictly identical pathways in terms of frequent sequences. Since sequences were long and dense, we used the CM-SPAM algorithm to identify frequent sequences. This algorithm works by vertical extraction of sequential patterns, rendering it faster and less expensive than the SPAM method. 15
Discriminant characteristics between cluster 1, 2 and 3.
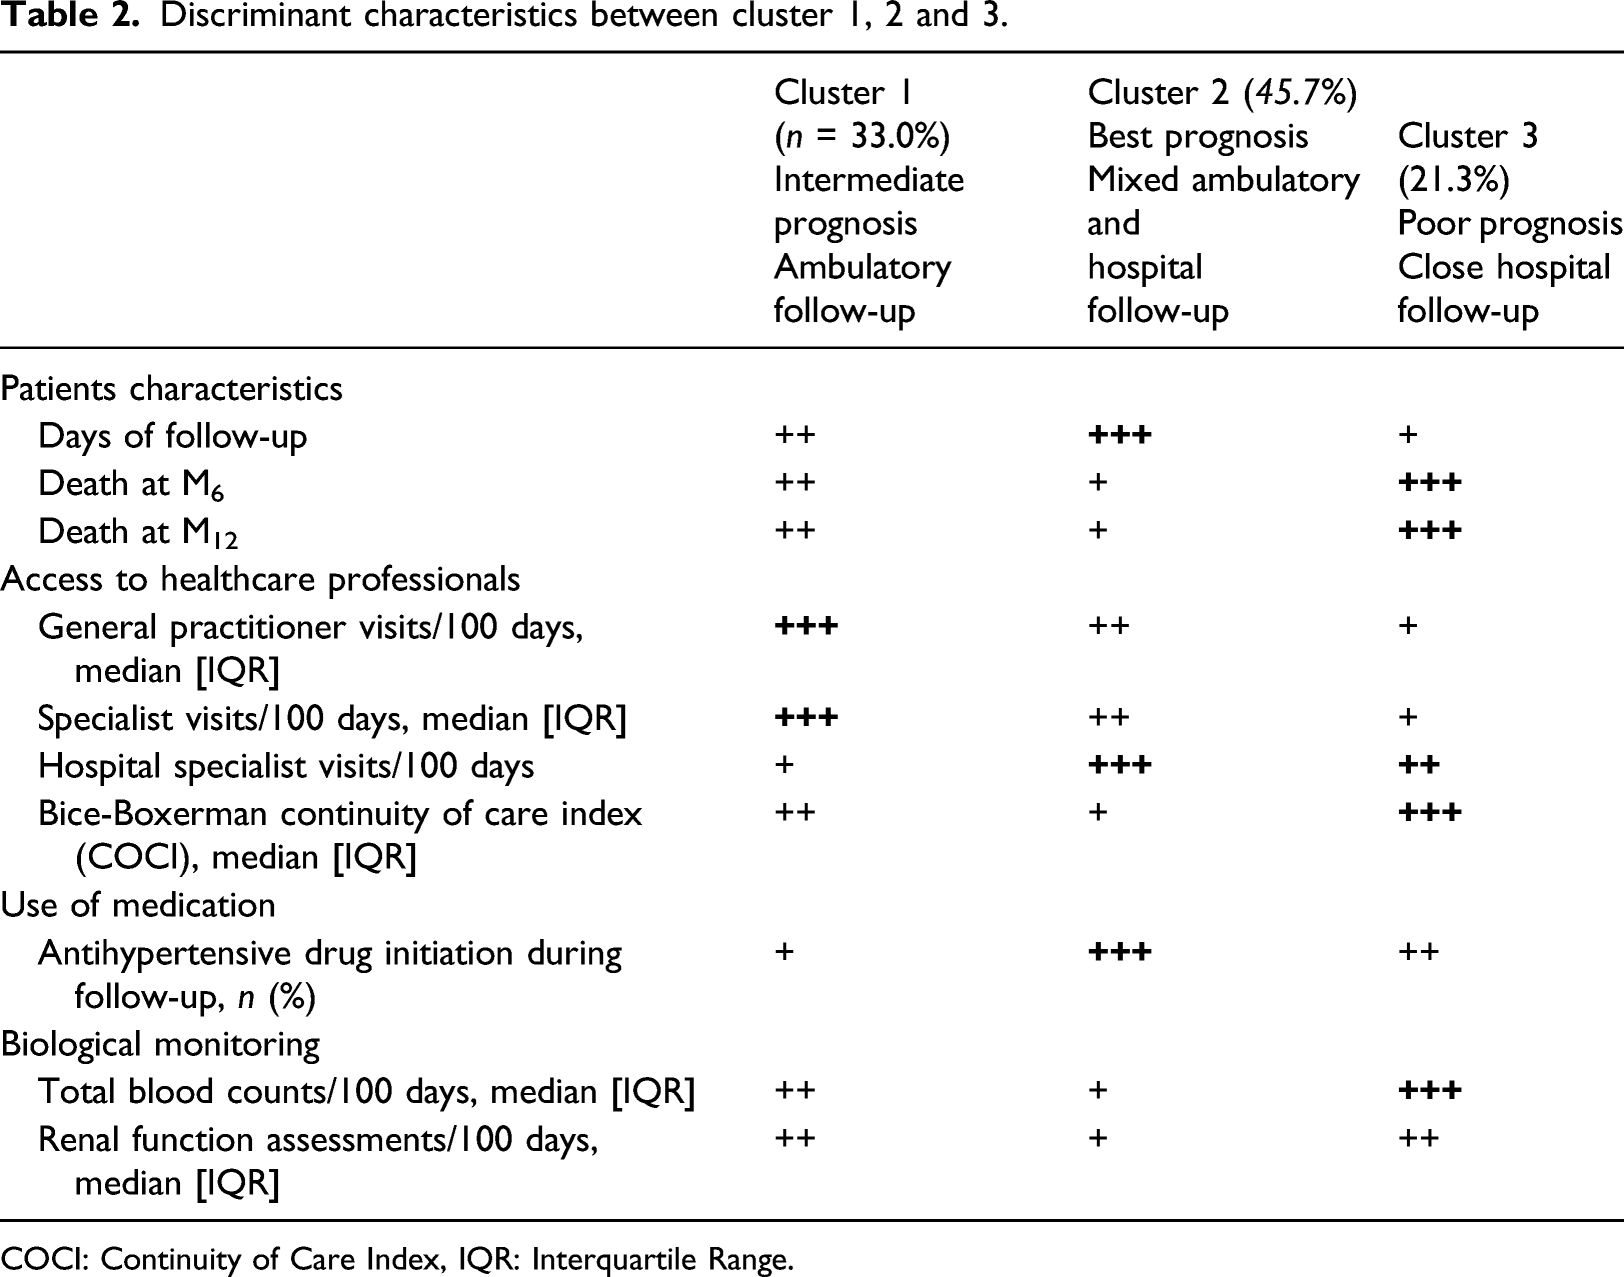
COCI: Continuity of Care Index, IQR: Interquartile Range.
We found that continuity of care can be conveniently integrated in analysis of healthcare trajectories through COCI calculation. In our study, we found that cluster 3 was associated with a higher COCI as compared with cluster 1+3. Previous studies showed that COCI was correlated with a lower requirement for ED services among multiple chronic conditions patients, supporting our observations. 23
Concerning ambulatory biological monitoring, our results indicated a relatively adequate biological surveillance in the population, since French learned societies recommend a three-monthly clinicobiological evaluation for mRCC patients, including TBC and renal function assessments (approximatively 1 biological test per 100 days). 24 We found differences between clusters for the number of TBC/100 days, with cluster 3 being associated with the highest rate, probably in connection with the poor 6-month and 12-month prognosis in this cluster. Integrating biological data in care trajectory analysis can provide useful hallmarks of disease evolution. For example, Ben-Assuli et al. found that clustering patients according to serum creatinine levels trajectory can be an indicator of serious illness resulting in multiple ED visits 25 . We found that cluster 3 was associated with both a higher rate of TBC assessment, and a non-significant lower rate of ED visit.
Beside these discriminant characteristics, we also found general patterns of suboptimal management, which were uniformly distributed between clusters. First, emergency department visit was a frequently identified pattern, since we found that 40.2% of subjects attended the emergency department at least once in the year following TKI initiation. Emergency department visits, and preventable emergency department visits in particular, are important hallmarks of poor-quality management of the patient or inadequate access to healthcare. 26
Second, our results revealed that only one third of subjects received a reimbursement for drugs prescribed to treat adverse effects associated with oral TKI (i.e. antinausea and antidiarrhea), although anticipatory prescriptions are advised for all patients, to ensure that adverse effects related to TKI treatment are rapidly detected and resolved, to prevent unnecessary ED visits and and to improve patient quality of life. This low rate of reimbursement constitutes a hallmark of suboptimal management, which can be targeted for the implementation of health interventions. We also observed that cluster 2 (best prognosis) was associated with a higher rate of initiation of an antihypertensive drug, which can indicate a better management of incident hypertension, which is a specific toxicity related to TKI treatment. 27
Third, we observed that the MPR was high in our study sample (90%), in accordance with literature. 28 Even though this measure is used as an indirect estimation of medication adherence (i.e. whether patient took the medications as prescribed), such indicator, derived from electronic database, should be interpreted cautiously outside the context of daily clinical practice, since MPR decrease can be related to TKI high-grade toxicity leading to temporary drug discontinuation, even in the presence of a patient with good medication adherence. In this context, the use of alternative measures, such as the relative drug intensity (i.e. the amount of drug administered per unit of time divided by the amount recommended) also associated with patient outcomes including survival, should be preferred. 29
Altogether, these results could offer operational perspectives for policymakers to tailor healthcare interventions aiming to secure the management of mRCC patient taking oral TKI. Such intervention should target the reduction of ED visits, by improving continuity of care with a better coordination between community and hospital healthcare providers. Additionally, efforts should be made to improve patient medication adherence and/or dose intensity, as well as to improve patient counselling about management of toxicities. In this perspective, recent initiatives have been implemented in France, such as the national experimentation Onco’Link 2021-2024, which allows the coordination between community and hospital healthcare providers through regular multidisciplinary hospital appointments in day hospitalizations. 30
In terms of treatment sequences, most of the patients in all three clusters were initiating sunitinib. A pattern of switching to axitinib was observed at six months in cluster 1 but not in cluster 2. Rates of first drug continuation at six months and one year were higher for cluster 2 than for cluster 1, consistent with the lower death rate in this cluster. So far, TKI treatment sequences of mRCC patients has been poorly evaluated, even though this information can provide insights about patient prognosis. Indeed, Finek et al. found that TKI treatment sequence in this population of mRCC patients was related to OS, with a higher observed OS in patient receiving axitinib as a second line of treatment, as compared with second line sunitinib or everolimus, after controlling for important confounders including the patient performance status. 31 Such results should be confirmed by analyzing the exhaustive database, since we observed in our case study sample only 4 subjects receiving axitinib.
This case study has several limitations. First, the small sample size associated with the use of the sampled database precluded analyses of the effect of the year of TKI initiation on healthcare use behavior and treatment sequences (given successive changes in the mRCC guidelines). In this context, a higher level of granularity in the description of care (i.e. type of specialist or hospital practitioner) or the addition of other variables corresponding to access to other types of healthcare professionals (i.e. nurses, social workers) would provide a more in-depth description of the three clusters. Caution is required in the generalization of these results to the entire French population of mRCC patients.
Second, reimbursement data did not exhaustively capture the care pathways of mRCC patients taking TKI, since cancer subjects can be included in clinical trials in which drugs are provided free-of-charge by pharmaceutical companies, without reimbursement retrievable. This may introduce a classification bias when studying treatment sequences, with subjects being incorrectly considered as having “no oral anticancer treatment”; or in the identification of patterns of suboptimal management. However, since patients enrolled in clinical trials constitute a very specific population, characterized by a strict follow-up with regularly programmed hospital appointments, exclusion of such patients is not expected to introduce a flawed interpretation of patterns of suboptimal ambulatory management, which can be observed in the real-life setting.
Third, despite the use of a sequential pattern mining method, we did not study the time between consecutive cares. This information is important, since short intervals between consecutive cares may indicate disease worsening. More complex methods could be used in this context, such as the Hirate Yamana algorithm, which adds a temporal dimension to pattern mining. Finally, we used the Charlson comorbidity index to assess comorbidity, but more validated measures, not retrievable from the EGB database, such as the Memorial Sloan-Kettering Cancer Center prognostic score 32 or Heng risk score 33 might provide more accurate information about the ability of the CM-SPAM/FAMD method to discriminate between subjects in terms of prognosis.
As a perspective, in the context of growing healthcare expenditures and shrinking health budgets, organizational initiatives based on data-driven interventions might bring opportunities to improve mRCC management. Our methodology, using EGB sample, gave preliminary results which should be reproduced in the exhaustive national database, which would allow a more territorialized analysis, since EGB is not representative at the scale of the region and the department. Analysis on data from the SNIIRAM could help identifying remote territories with specific healthcare resources requirements, and tailoring efficient healthcare interventions.
Conclusion
This case study demonstrates that the use of data from administrative healthcare databases, coupled with sequence mining and clustering methods, can identify homogeneous groups of individuals in terms of prognosis and healthcare use behaviors, facilitating the identification of particular points in healthcare trajectories at which health-promoting actions are required.
Supplemental Material
Supplemental Material - Identifying homogeneous healthcare use profiles and treatment sequences by combining sequence pattern mining with care trajectory clustering in kidney cancer patients on oral anticancer drugs: A case study
Supplemental Material fot Identifying homogeneous healthcare use profiles and treatment sequences by combining sequence pattern mining with care trajectory clustering in kidney cancer patients on oral anticancer drugs: A case study by Cyril Baudrier, Yohann Tran, Nicolas. Delanoy, Sandrine Katsahian, Brigitte, Sabatier and Germain Perrin in Health Informatics Journal
Footnotes
Declaration of conflicting interests
The author(s) declared no potential conflicts of interest with respect to the research, authorship, and/or publication of this article.
Funding
The author(s) received no financial support for the research, authorship, and/or publication of this article.
Ethical approval
Access to the database is legally authorized without the need for permission from the national data protection agency (CNIL). The study protocol was approved by an ethics committee (CER REF 2020-02-20).
Data availability
The data supporting the findings of this study are available on request from the corresponding author. The data are not publicly available due to privacy or ethical restrictions.
References
Supplementary Material
Please find the following supplemental material available below.
For Open Access articles published under a Creative Commons License, all supplemental material carries the same license as the article it is associated with.
For non-Open Access articles published, all supplemental material carries a non-exclusive license, and permission requests for re-use of supplemental material or any part of supplemental material shall be sent directly to the copyright owner as specified in the copyright notice associated with the article.