
Abstract
Alzheimer’s disease (AD) is one of the most common forms of dementia contributing to more than 70% of the cases. The factors accounting for the cause and progression of neurodegenerative diseases like AD are primarily genetic, in addition to life style and environmental factors. Early and accurate diagnoses of AD empower practitioners to take timely clinical decisions and preventive actions. This being the motivation, the work proposes a novel pattern matching and scoring method on genetic material towards devising an effective classifier. We propose a distinctive disease causing gene sequence pattern identification using suffix trees as a base detection model with an accuracy of 91.5% in linear time complexity. A scoring mechanism is implemented to assign scores to genes based on the severity of the disease causing and disease resistant Single Nucleotide Polymorphisms associated with the genes. These scores are then used as a remarkable feature in the gradient boosted decision tree classifier to enhance the classification of AD versus healthy control. The efficiency of the proposed gene powered EGBDT classifier is evaluated on ADNI benchmark data set with the prediction accuracy of 94.16% and is found to be efficient compared to the recent works in the literature.
Keywords
Introduction
Alzheimer’s disease (AD), the most common form of dementia, is a degenerative disorder of the brain that leads to memory loss. AD was discovered in 1906 by Alois Alzheimer, a German neurologist, and psychiatrist. He found that AD had aggressive effects of dementia, leading to memory, language and behavioural defects along with difficulty with speech, frequent agitation and confusion. The disease leads to the shrinkage of the cerebral cortex, fatty deposits in blood vessels, and atrophied brain cells. As the disease has no prescribed cure till date, there is a pressing need to predict the disease at its earliest stage which will help saving lives of people around the globe.1–3 The effects of the disease can only be mitigated by following certain memory-related exercises which help the brain cells to constantly remain active and increase their retention capacity.
Alzheimer’s disease leads to cognitive decline that impacts daily life and is often confused with normal ageing and dementia. AD looks harmless at the initial stages but it manifests itself harmful at the later stages. The person with the disease may have slight memory issues in the nascent stages and can regain the memory relatively quickly. However as the disease progresses, it becomes more and more difficult to regain memory. The presence of AD may complicate other diseases, if present and in the case of elder people, it may ultimately lead to death. Though there are various ways to diagnose AD, the major challenges are to predict this disease at an initial stage. The best way to mitigate the disease is to predict the existence of AD at the earliest stage possible, which is the motive behind this work. 1
There are several modalities that are prevalent to detect the presence of AD such as genetic material, magnetic resonance imaging (MRI), positron emission tomography (PET), and cerebrospinal fluid (CSF). 2 Any changes that take place in a body is found to have an impact on the genes present in the body and hence genes serve as an excellent tool for detecting the presence of AD. Among genes, there are several ways of performing analysis like microarray, single nucleotide polymorphisms (SNPs) and so on. In this work, we have taken the gene sequences as well as SNPs for the prediction of AD. In this work, pattern matching algorithms, machine learning and data analytic techniques are found to be extremely useful and play a pivotal role in early disease prediction.4,5
This work focuses on effective AD prediction as well as finding the associated genetic materials which aids in the faster prediction of AD and enables clinicians in decision-making process for possible treatment at an early stage. The distinctive gene pattern causing AD is found by considering the disease causing genes using suffix trees which helps in finding gene pattern matches. For the purpose of disease prediction, the work focuses on SNP data and it involves two steps. In the first step, a hazard score is generated based on the presence of SNPs. The hazard score serves a dual purpose, as an early indication of degree of disease severity and an important criterion for disease prediction at later phases of classification. The second step involves the classification of AD by adding the computed hazard score as an important feature to the enhanced gradient boosted decision tree(EGBDT) classifier making the computation more efficient. GBDT has been chosen due to its inherent nature of providing very low misclassification rates.
Related works
AD has affected about 50 million people worldwide and about 200,000 people have lost their lives in 2019 alone. There are two main variants of AD. Early onset of Alzheimer’s disease (EOAD) affects people younger than 65 and nearly five million people in the United States have been affected with EOAD. Genes like APP, PSEN1, and PSEN are found to be the primary causes of EOAD. 6 The remainder of AD cases occur as late onset of Alzheimer’s disease (LOAD) in adults aged 65 and above and are classified as Sporadic AD. The causes of AD rely on so many factors such as age, race, genetics, habitat, and comorbidities. 7 It is very much evident that genes play a pivotal role in the disease prediction and have an impact on the cause of disease.8,9 By using medical informatics, medical data can be analysed and used for deriving meaningful information which in turn aids clinicians to make better decisions for treating AD.10,11
The genes causing AD are obtained8,9 and from the genes identified, the gene sequences and SNP sequences have been gathered. 12 The gene sequences can best identify the cause of the disease and SNPs can be best used in the prediction phase. For the cause of disease, pattern has been found in many studies earlier among the different genes considered. The common algorithms used for pattern matching include Knuth–Morris–Pratt (KMP) Algorithm and Rabin Karp Algorithm. 13 But when these algorithms are used against gene sequences, these algorithms have processing difficulties due to the length of the sequences. Suffix trees act as one of the best algorithms for the identification of gene sequences as suggested by. 14 Due to its nature of constructing edges based on patterns, pattern matching becomes much easier in suffix trees.
The impacts of SNPs are widely studied all over the world in the causal and protection against AD. This has produced a wide range analysis and has ultimately resulted in formulation of mechanisms to predict disease known as the hazard score primarily based on the impact of SNPs on a disease. In a few earlier researches, authors have tried to calculate hazard score based on age-specific genetic risks associated with AD. 15 This work aims at developing a hazard score mechanism completely based on the presence of the disease causing and resistive SNPs and their 120 corresponding impacts. This model is being developed with an idea of having a simple indicative mechanism as well as to enhance features set for predictive analysis.
Various classification methods with the main goal of achieving high accuracy and least misclassification are found in literature. 16 proposed the use of logistic regression ensemble (LORENS) in the process of classification where the genes are classified into just two groups and has an efficiency of 75% for a partition with a minimum of five partitions.16,17 One of the most efficient tools for classification of AD is the support vector machines (SVM), which generates a hyperplane that acts as a criterion in the separation of disease-causing and non–disease-causing genes.3,18–20 However, as the sample size becomes extremely higher, the efficiency gradually decreases.
To overcome the defects in the case of larger data sets, Deep Neural Networks (DNN) have been utilized to maintain the consistency in accuracy of prediction. 1 DNN has a performance which is better in image processing compared to the processing of genetic data and hence decision tree based algorithms are being utilized to the maximum extent for prediction related to genetic data. The defect of decision trees is their scope as they can work only on small data. 21 The efficiency of decision trees can be improved by more complex trees which use plenty of subtrees as in the case of Random Forests9,22–25 have proposed the usage of Gradient Boosted Decision Trees(GBDT) as an effective algorithm in classification due to the high efficiency that is associated with them. The algorithm weighs the misclassified inputs in each stage and focuses on accommodating them in the next stage. The learners are adjusted based on a differential function computed based on the misclassified inputs. The accuracy achieved is high compared to other classification methods24,25
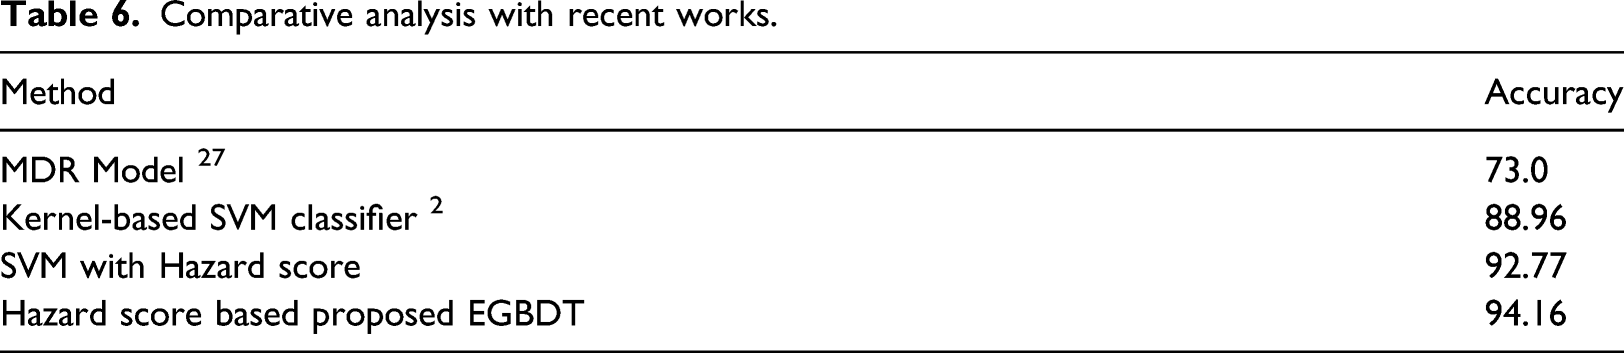
A machine learning based framework to discriminate subjects with AD or mild cognitive impairment (MCI) using a combination of four different biomarkers such as fluorodeoxyglucose positron emission tomography (FDG-PET), structural magnetic resonance imaging (sMRI), cerebrospinal fluid (CSF) protein levels, and Apolipoprotein-E (APOE) genotype have been proposed by 2 using ADNI data set. Kernel-based multiclass support vector machine (SVM) classifier with a grid-search method is applied to classify various classes like AD versus healthy control (HC), mild cognitive impairment-stable (MCIs) vs. mild cognitive impairment-converted (MCIc), AD versus MCIs, AD versus MCIc, HC versus MCIc, and HC versus MCIs. Singular value decomposition dimensionality reduction technique is employed to reduce high dimensional features into a lower-dimensional feature. The combined multimodal classification has improved the classification performance over the unimodal classification as seen in the previous work. 26
The main contributions in the work are as follows: • A novel method is introduced for identifying and quantifying the impact of disease causing and disease constrained SNP mapped proteins to predict the associated risk for disease progression. • GBDT classifier is enhanced with gene score as a feature towards improving the prediction accuracy and time complexity. • The proposed model is a generic prediction model that is applicable to any progressive disease prediction like COVID.
Methods and Materials
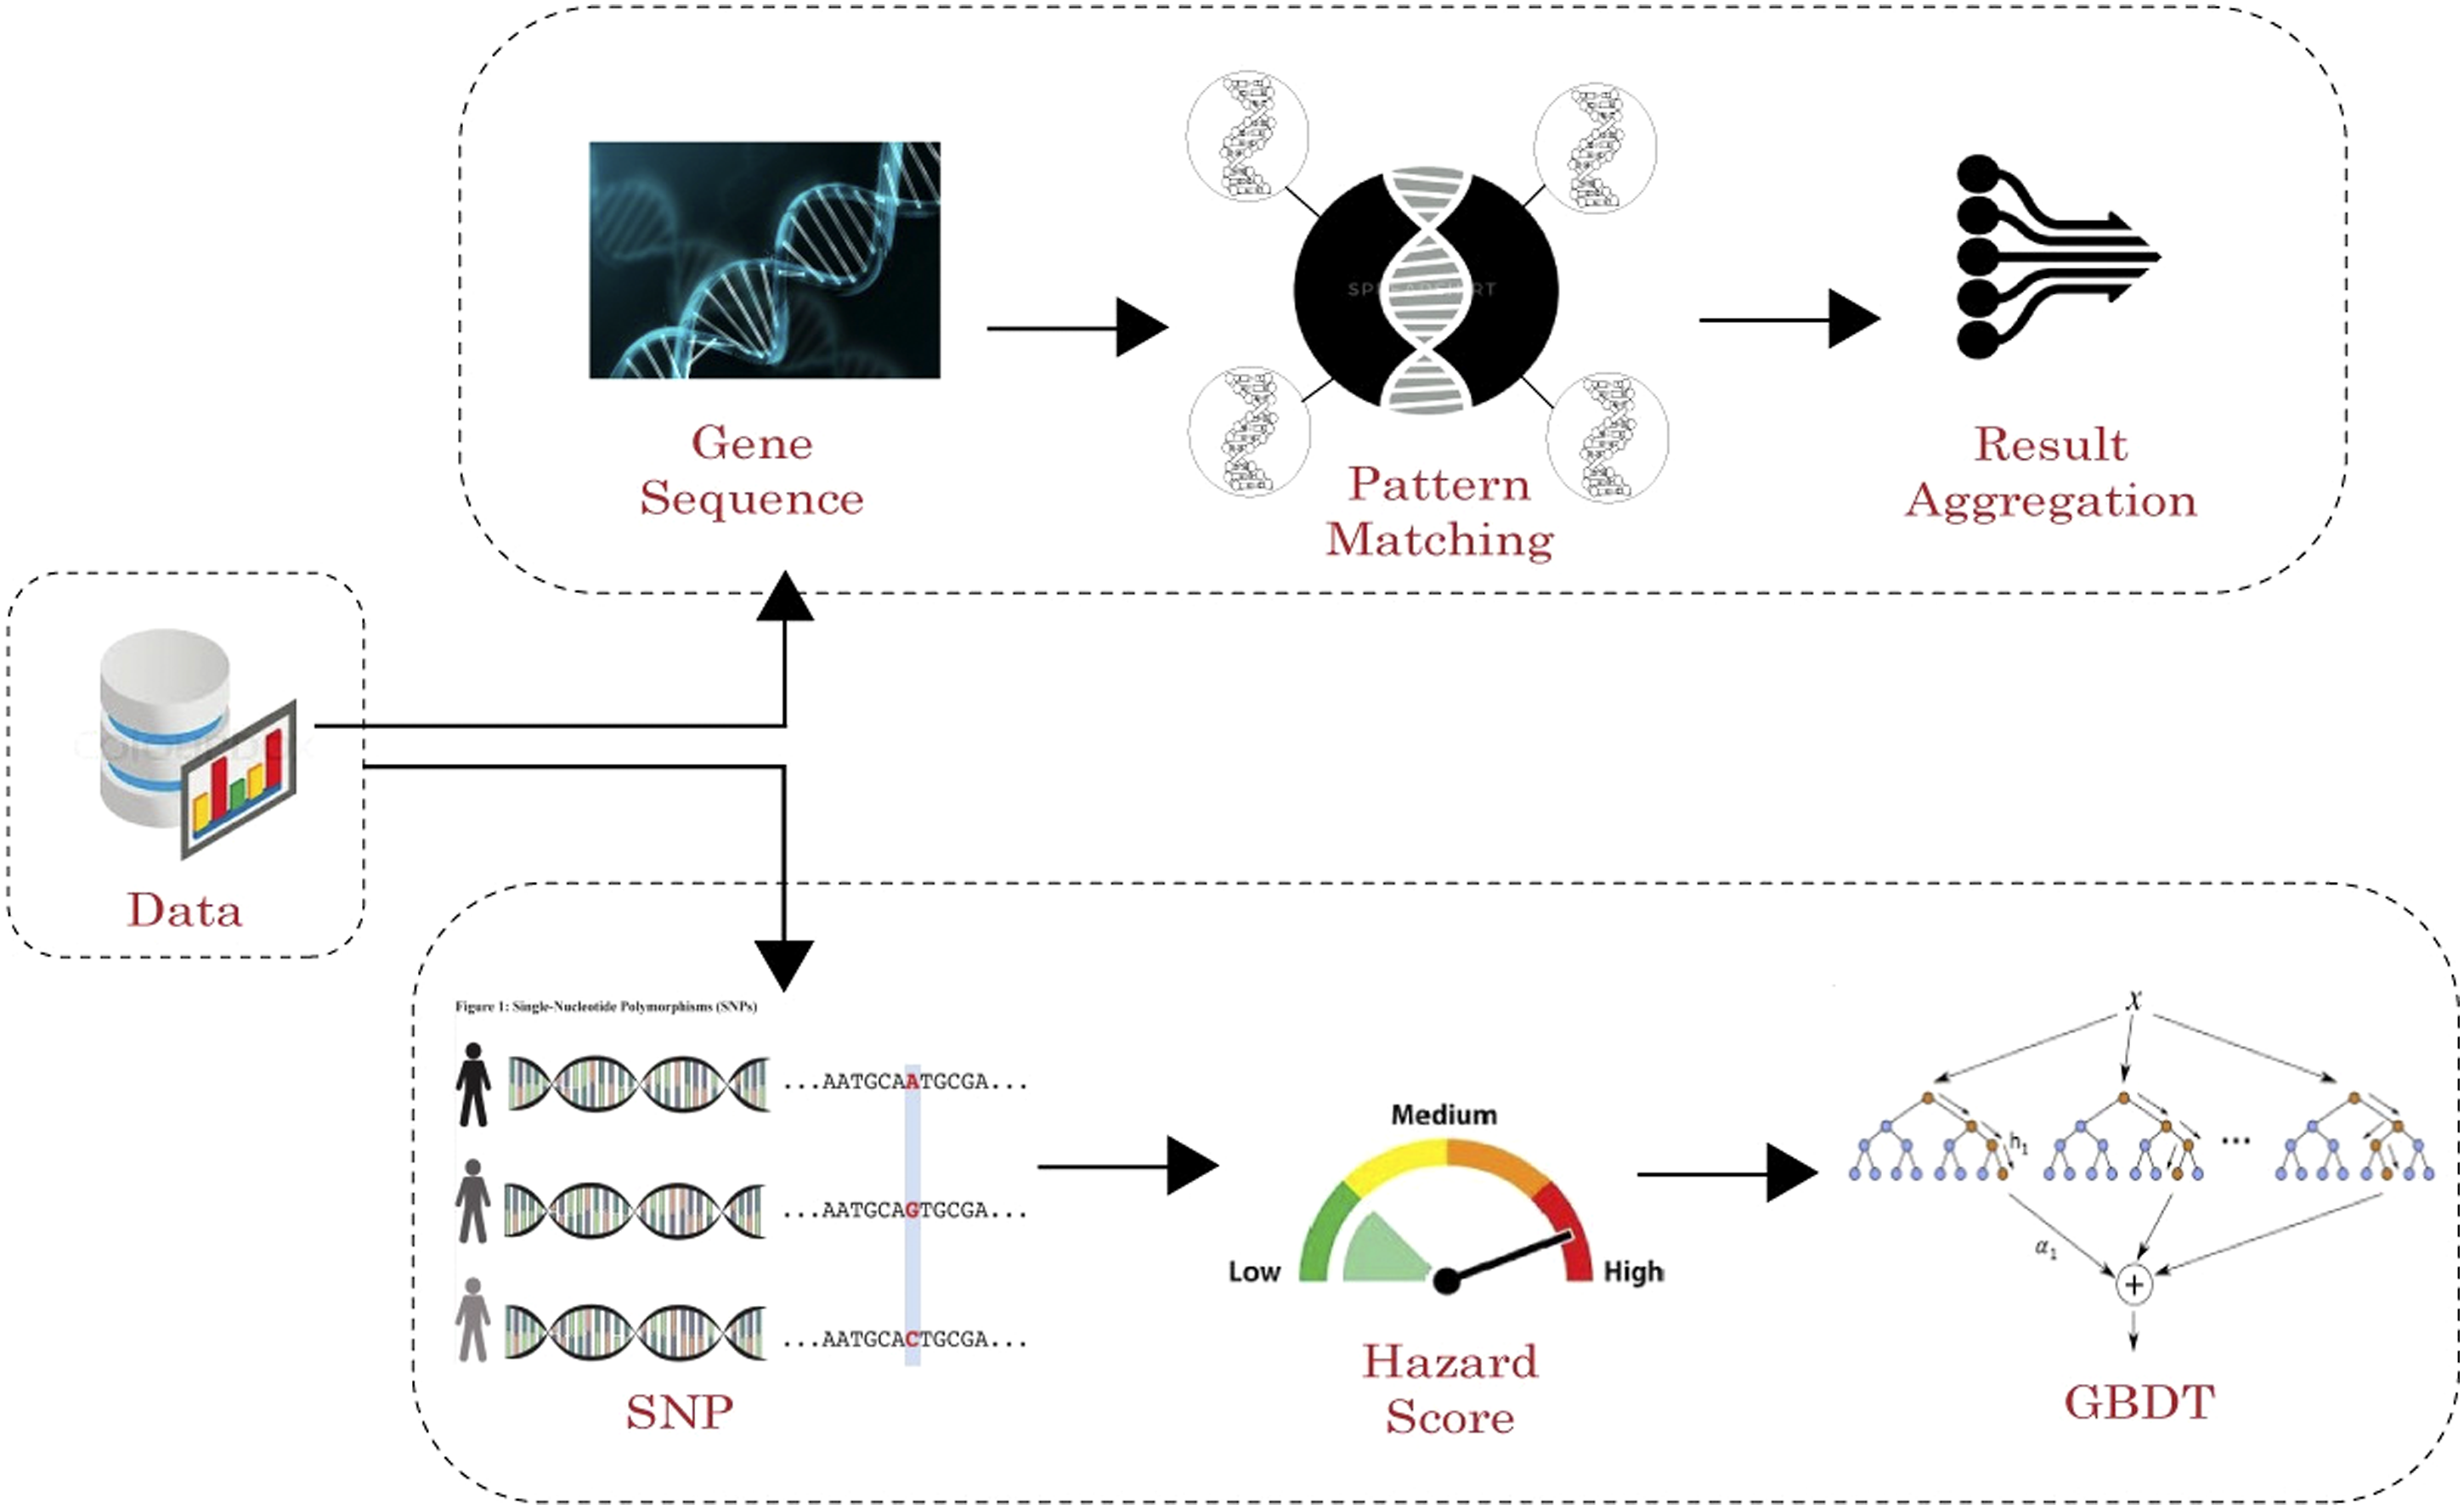
The proposed work involves the following phases of detection as depicted in Figure 1. • Finding the common disease causing gene sequence pattern with suffix trees on SNP mapped protein sequences. • Generation of hazard score for genes to reveal the progressive stage of disease • Disease detection based on gradient boosted decision tree enhanced with additional feature that can improve the prediction accuracy. Disease Predictor using gene powered GBDT classifier.
Input
The data is obtained from the Alzheimer’s Disease NeuroImaging Initiative (ADNI) (http://adni.loni.usc.edu/data-samples/data-types/genetic-data) and GWAS database (https://www.ebi.ac.uk/gwas/). The data provide sufficient information about the relevant SNPs that impact the disease. Around 730,525 records can be found in the data sets. This data are used for the hazard score generation and classification purpose. For the purpose of pattern matching, the gene sequences are obtained from the National Centre for Biotechnology Information (NCBI) database (https://www.ncbi.nlm.nih.gov). The entire sequence is obtained in a file for a particular gene that is being considered.
Pattern Matching
As many diseases can be associated with genes, one of the efficient ways of predicting diseases is using genes and gene pattern matching has been considered for disease prediction. The pattern matching works by generation of patterns and then checking the patterns with other sequences.22,27
The DNA plays a key role in gene analysis and the genes are viewed in the form of genetic sequences. The DNA in every nucleus of an organism is exactly the same in all cells except reproductive cells. DNA is made up from four different bases (nucleotides), adenine (A), thymine (T), guanine (G), and cytosine (C) for every living organism. The bases on one strand of DNA form base pairs with a second strand of DNA to form the double helix. But the base pairs that can be formed are limited; adenine (A) can only form a base pair with thymine (T) and guanine (G) can only form a base pair with cytosine (C). So when we know the sequence of bases on one strand of DNA, we also know the sequence of bases on the other strand of DNA. The order of bases is referred to as the sequence.
The gene Sequence is generally very long and hence these sequences need to be converted into smaller sequences like protein sequences for easier and faster computation. The conversion of gene to protein sequences is aided by the DNA codon table which is represented in the Figure 2. The genetic code (referred to as DNA codon table for DNA sequences) shows how we uniquely relate a 4-nucleotide sequence (A, T, G, C) to a set of 20 amino acids. It describes a set of rules by which information encoded within genetic material is translated into proteins by living cells.
9
DNA codon table (https://www.wpclipart.com/medical/microscopic/genetic_code.png.html).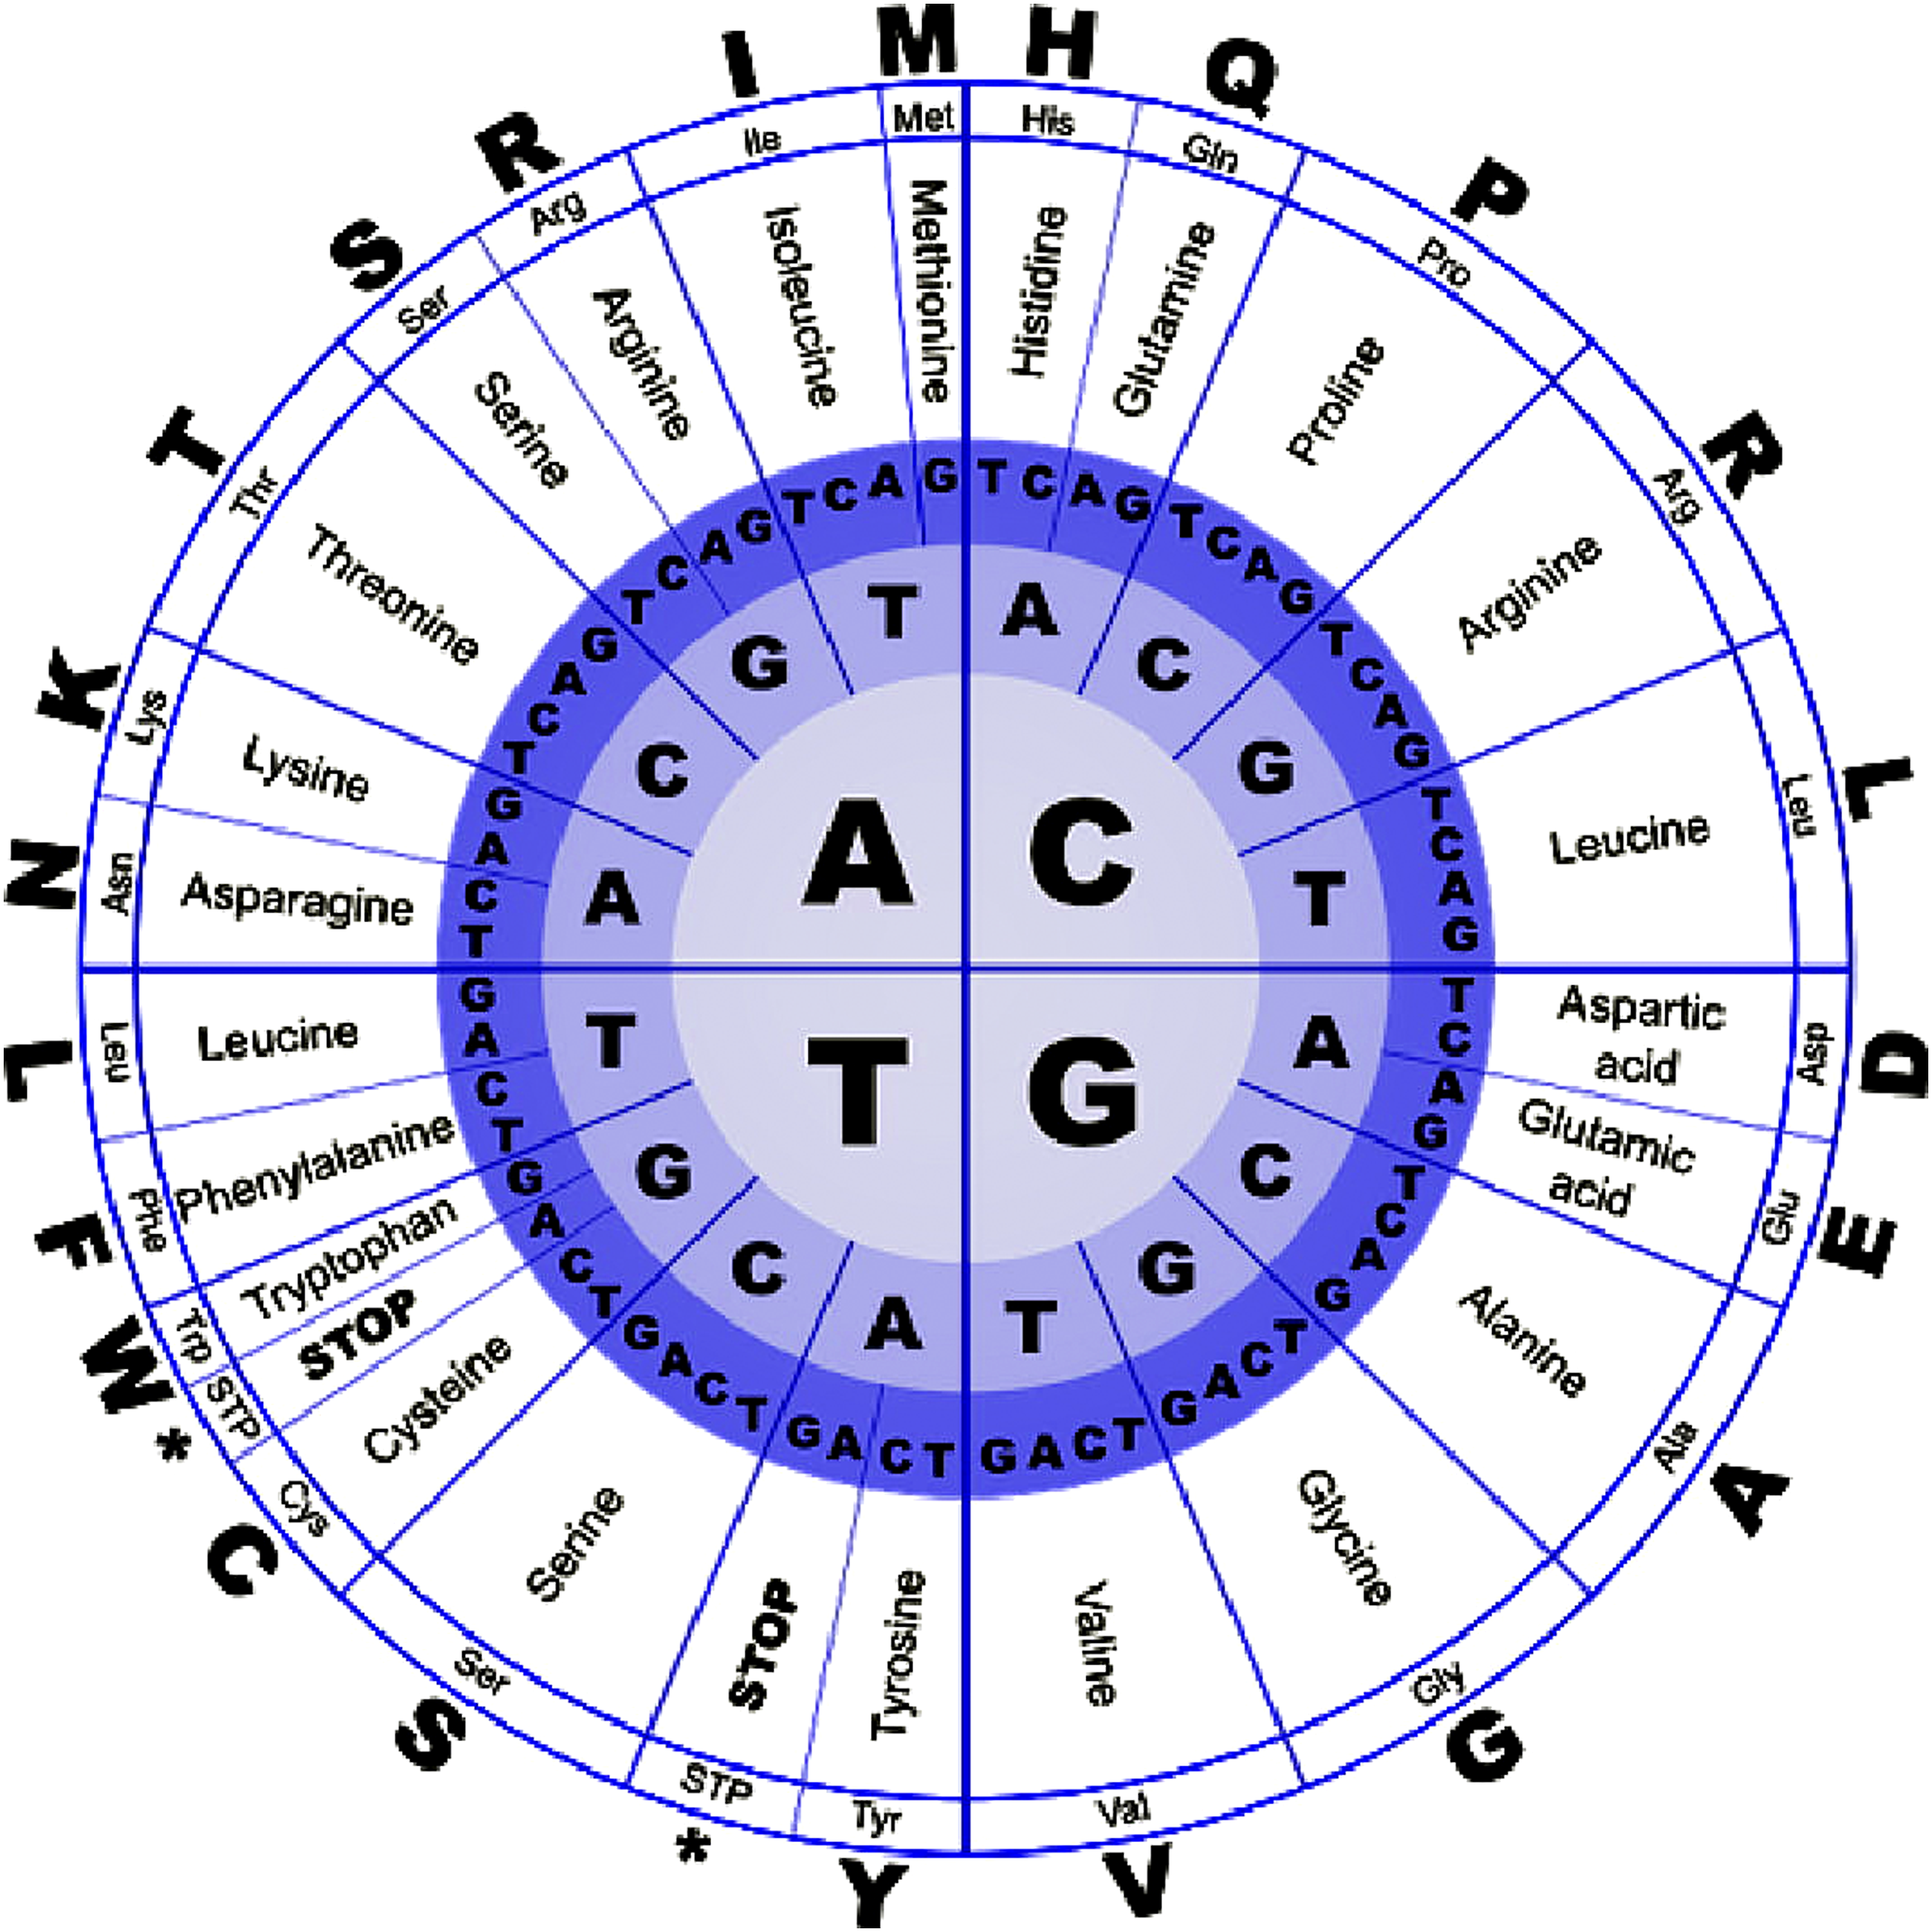
After the conversion of gene to protein sequence, pattern is obtained using suffix trees. Suffix tree is a compressed trie of all the suffixes of a given string as their keys and positions in the text as their values.
14
The construction of a suffix tree for the string S takes time and space linear in the order of the length of the string. The suffix tree is characterised as follows • The root can have any number of children (0 to many). • All the internal nodes must have a minimum of two child nodes. • Every edge created in the tree is labelled with a non-empty substring of the main string. • The outgoing edges from a single node cannot have labels beginning with the same character.
Once suffix tree is constructed from the sequences, several operations can be performed quickly, for instance locating a substring, locating matches for a regular expression pattern etc. From the suffix trees, the sequences are compared and a search pattern is determined as per the steps detailed below.
• Starting from the first character of the pattern and root of suffix tree, do the following for every character.
- For the current character of the pattern, if there is an edge from the current node of the suffix tree, follow the edge.
- If there is no edge, return back and search for the next character.
• If all characters in the pattern have been processed, that is, there is a path from root for characters of the given pattern, then store the pattern.
Pattern matching through suffix trees.
The complexity of the conversion of the gene sequence to the protein sequences is of the type O(n) where n is the length of the gene sequence that is under processing. The complexity of the generation of the suffix tree is of the type O(m + n) and the complexity in the identification of the substring from the suffix tree is also O(m + n) where m and n are the lengths of the two protein sequences that have been under consideration as analysed from Algorithm 1.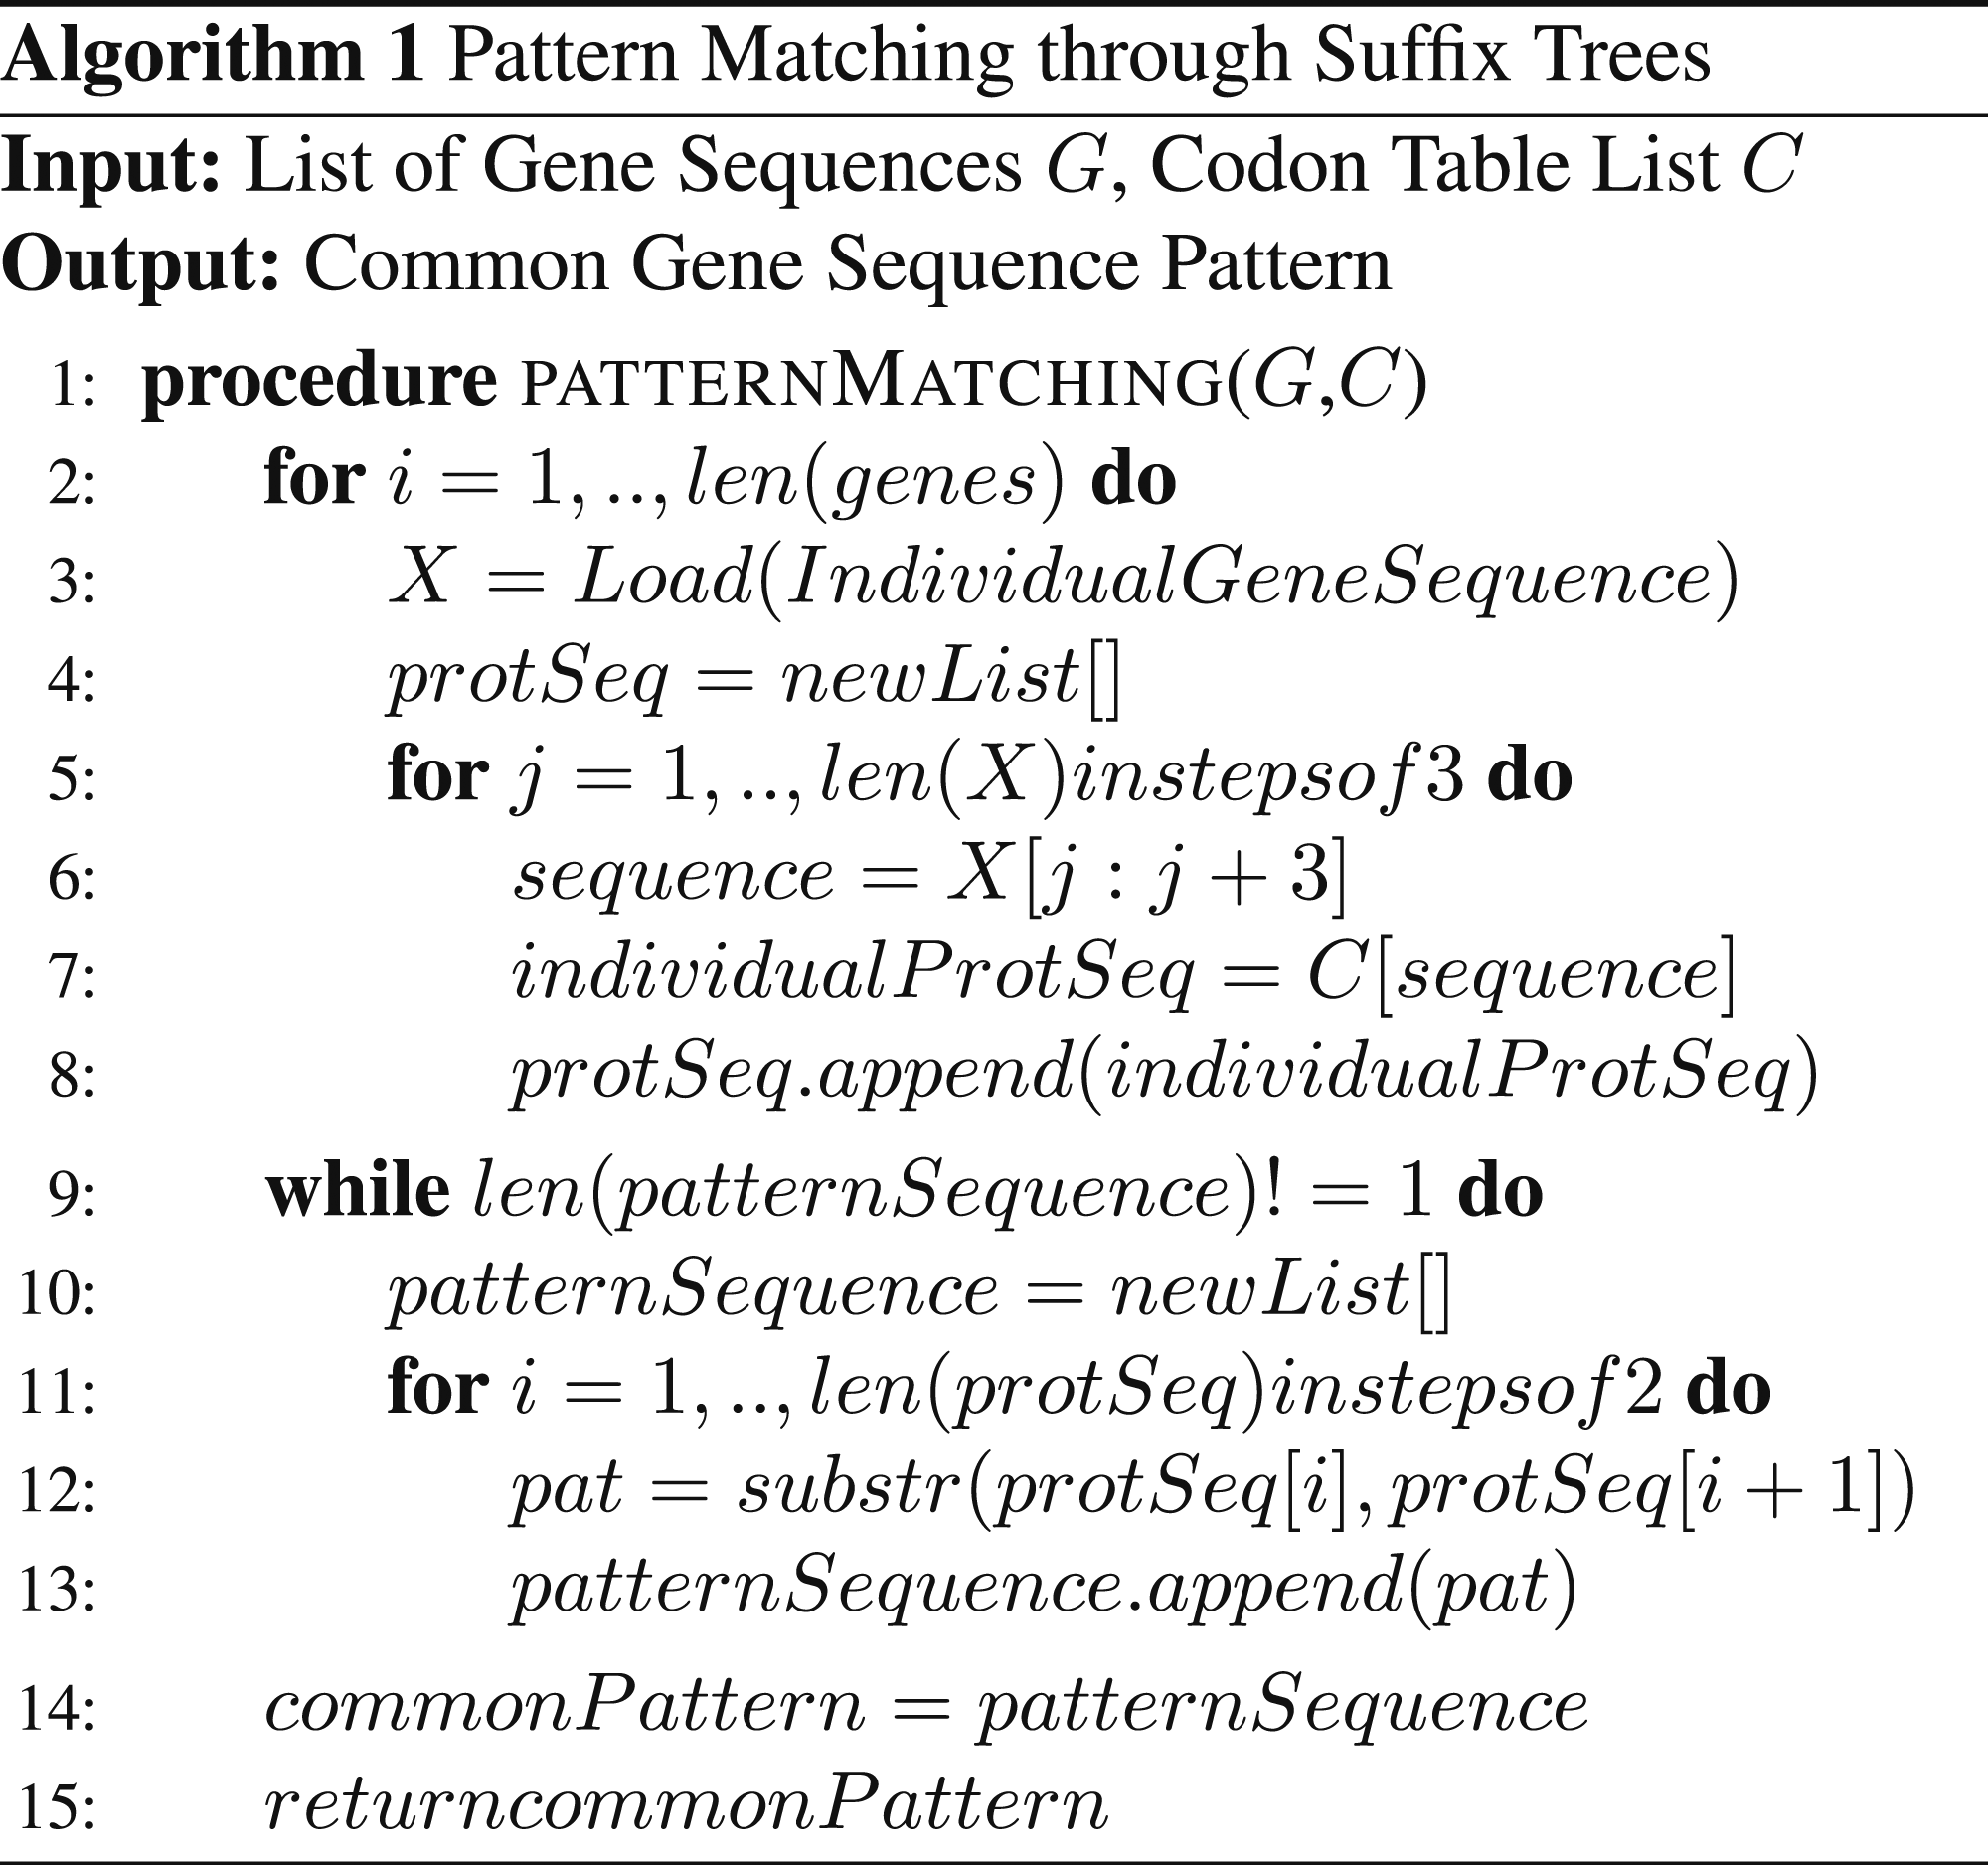
Gene Scoring: Hazard score
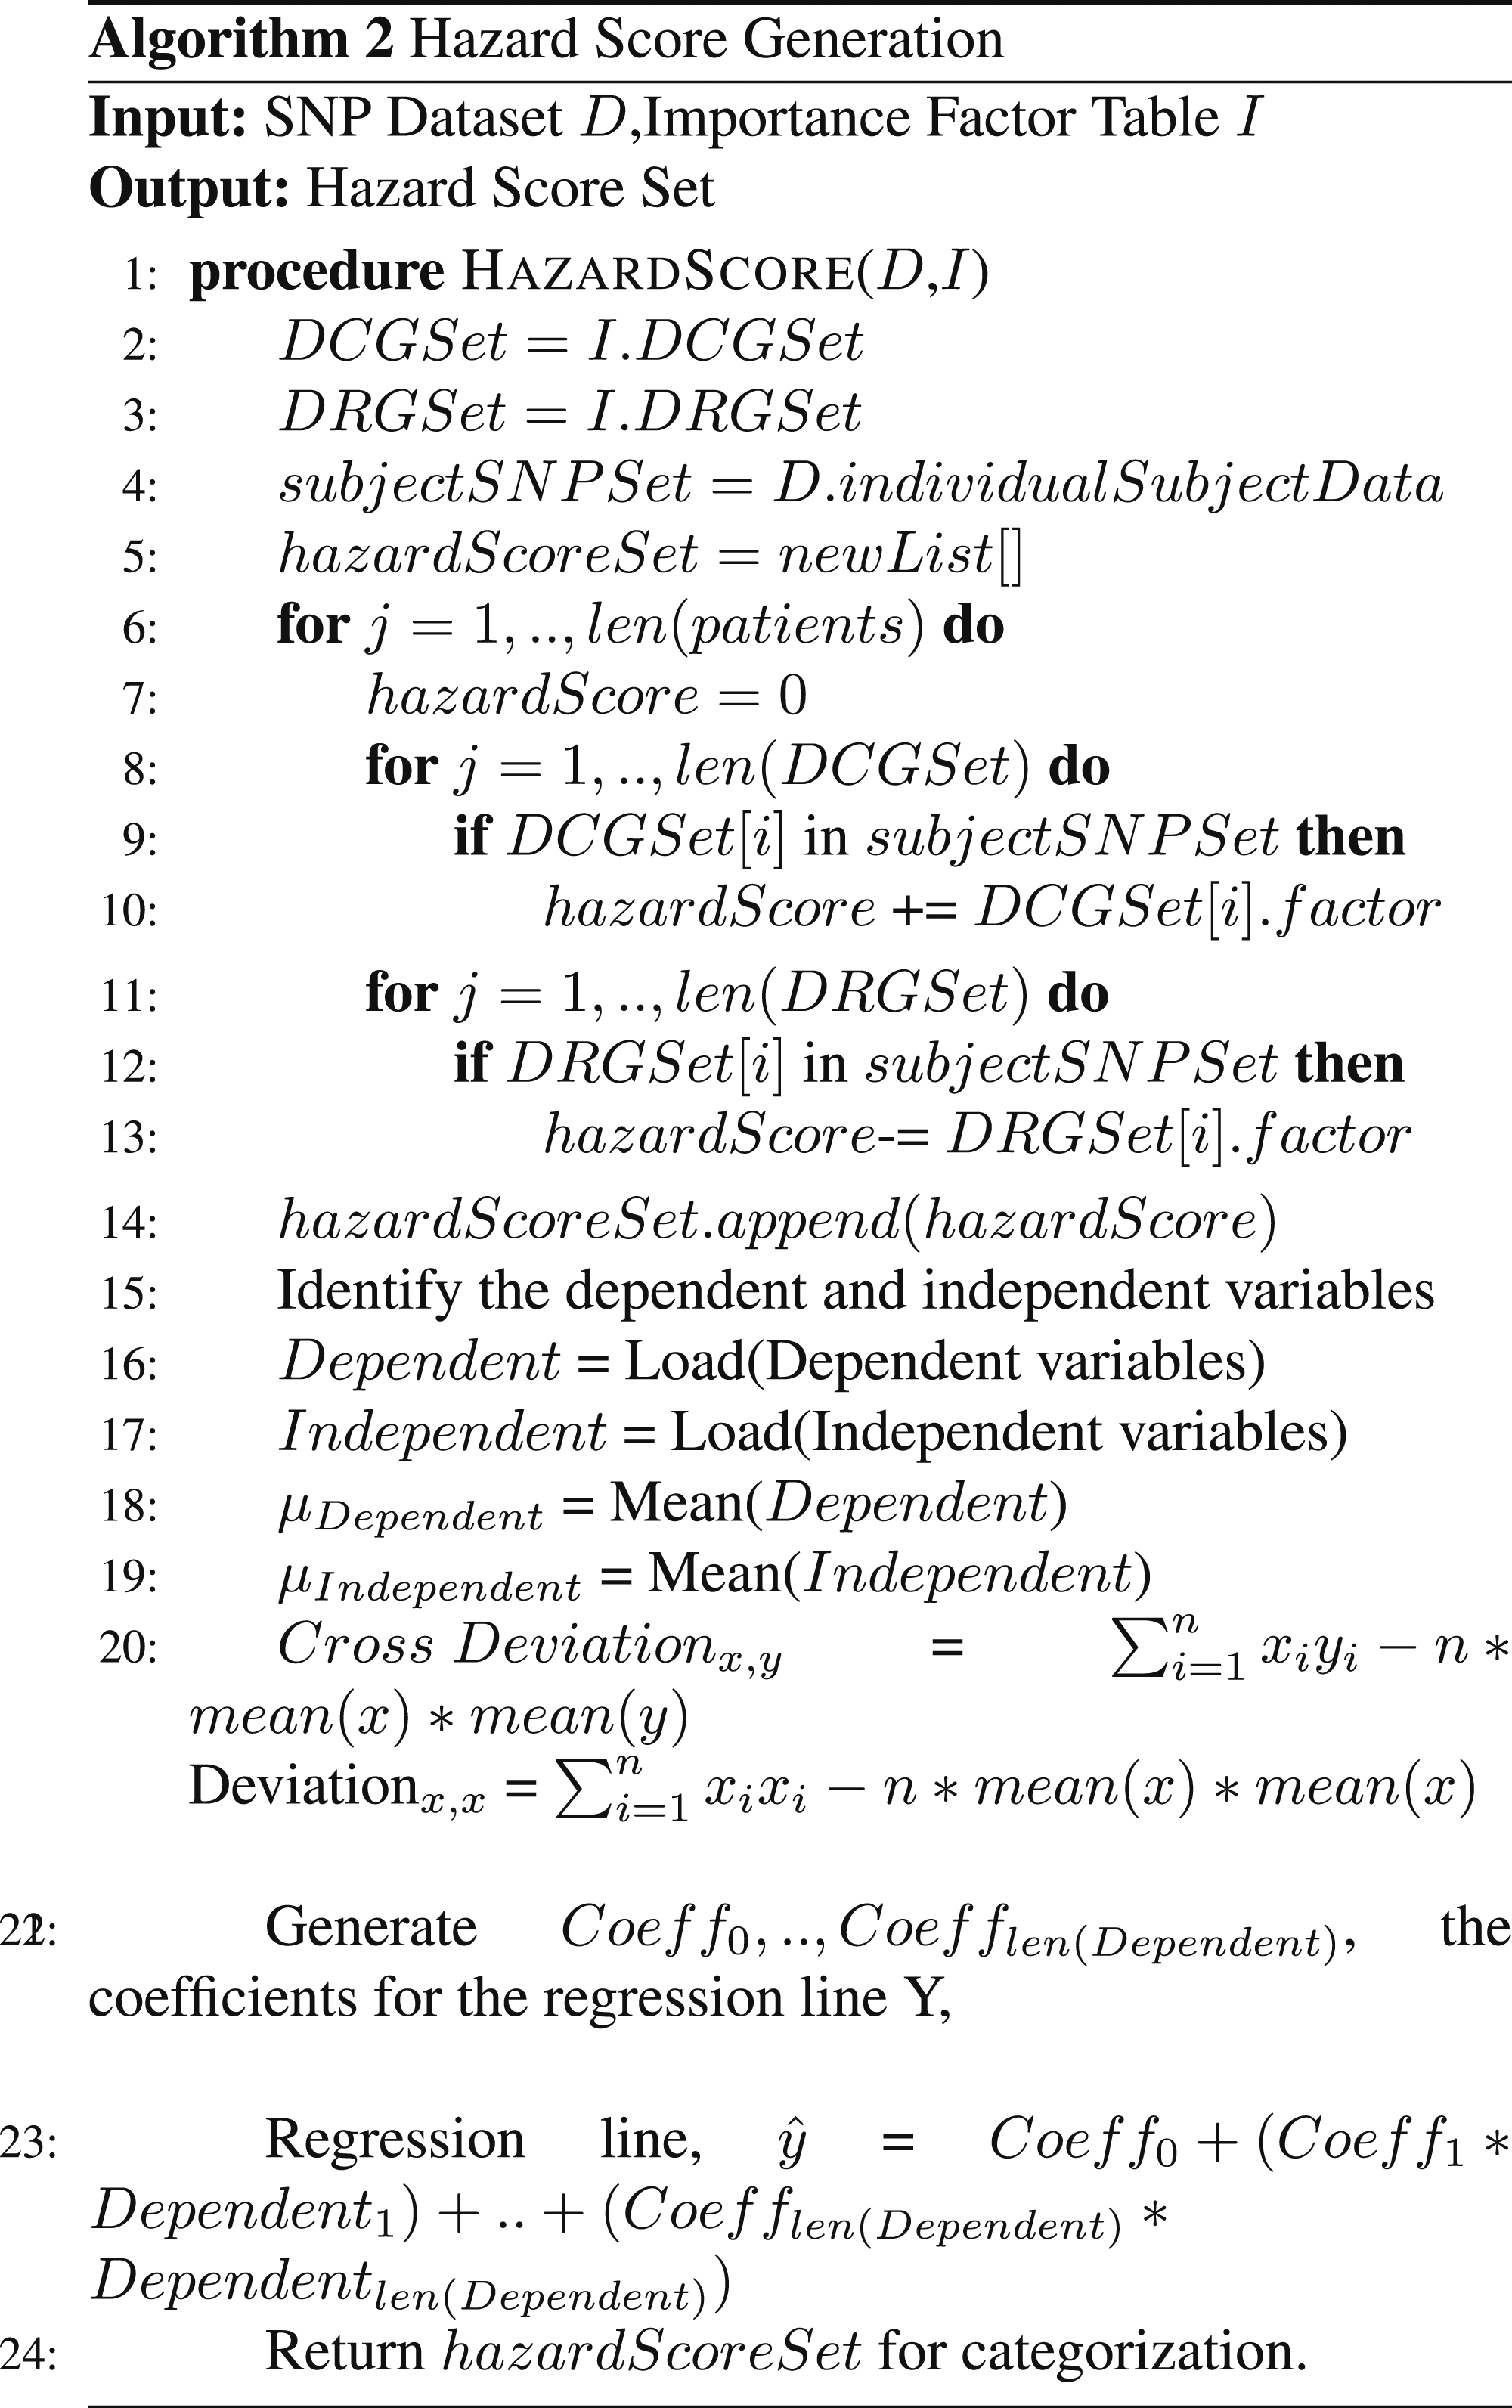
The polygenic scoring aims at generating the hazard score based on the disease causing and disease resistive genomes. The SNPs causing the disease are identified, but as every SNP need not cause the same impact on the disease, there exists a difference in the impact they cause on AD too. Based on the severity of the effect of disease causing SNPs, a hazard factor has been generated. On the other hand, SNPs that impede the occurrence of the disease have also been identified and the scaling factor (or impact factor) of the SNPs are accordingly computed. 15

Impact analysis for top five genes involved in causing Alzheimer’s disease.
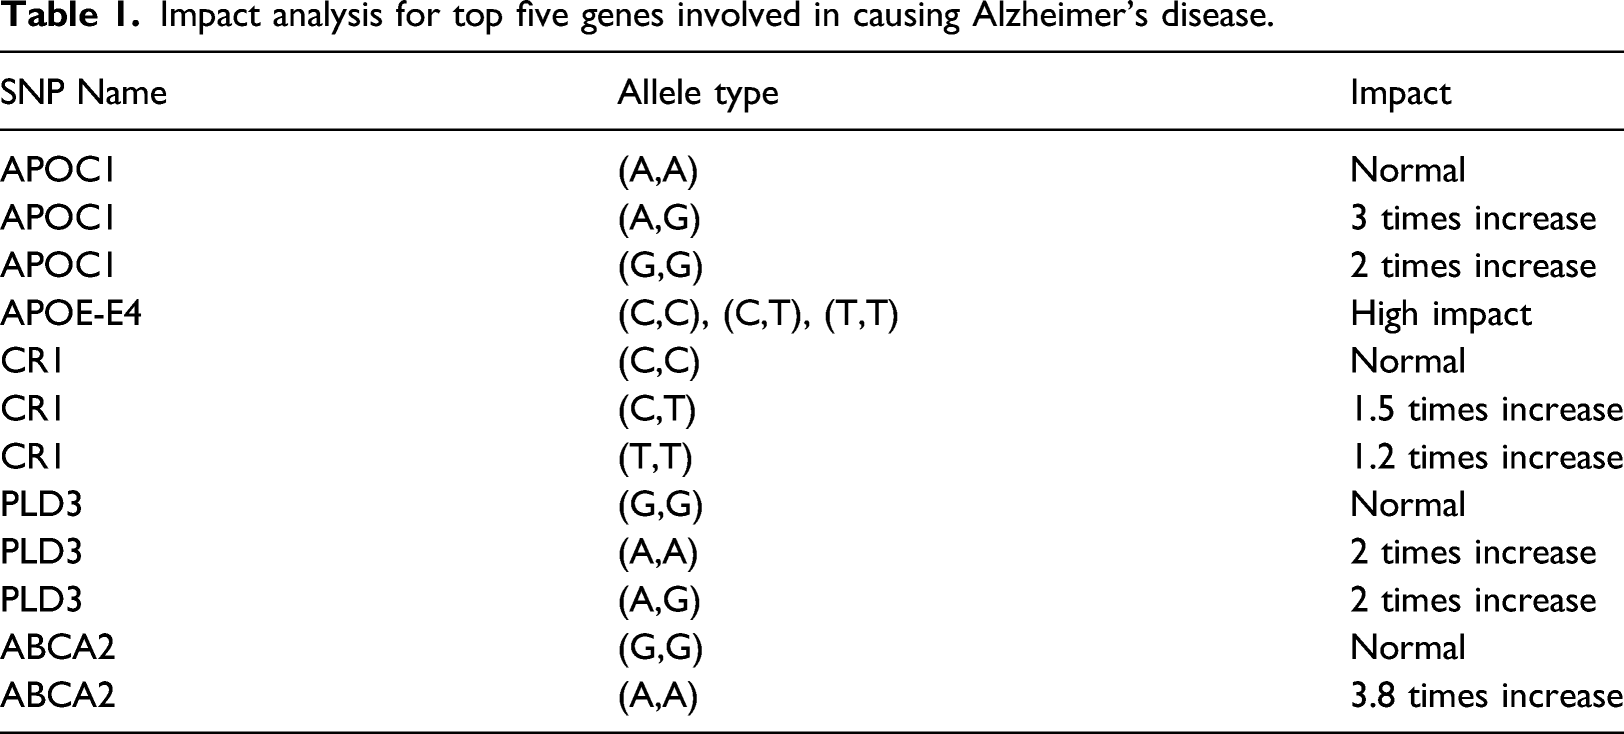
The variation of the allele type also has varied impacts in the score prediction and hence this factor also needs to be considered while predicting the score to make the score generation much more reliable. 15 These allelle type variations have been computed for many disease causing and disease resistive genes. 22 The scores are computed for each patient and are plotted in a graph and gradient descent is performed with the aim of obtaining a clear line of separation for the patients suffering from the disease and those free from the disease. The scores are adoptable as a stand-alone mechanism for early disease prediction and are also considered as one of the predicting factors along with other features during disease prediction.
The regression line is constructed using gradient descent and the line is of the form as shown in equation (2).
The value of m and c can be determined by least square estimate. The least square estimate can be found by taking the cross derivation of x and y and the squared deviation around x as shown in equation (3) and equation (4). Finally, the value of m and c are computed as shown in the equation (5) and equation (6) respectively.


The workflow of the scoring mechanism is summarized in algorithm 2. The algorithm runs on linear time complexity and is also space efficient.
Hazard score generation.
Enhanced Gradient Boosted Decision Trees
Though gene scoring is a preliminary mechanism to predict the presence of AD, there is a need for an extensive classification mechanism which can give a more accurate prediction of the disease. In this work gradient boosted decision tree is used as the classifier and the computed hazard score is used as an additional feature to improve accuracy and reduce overfitting along with regularization. A new data set can be generated from the existing one by selecting features (SNPs) that cause and prevent diseases like AD, MCI, diabetes, hypertension, and thyroid.
The enhanced gradient boosted decision tree (EGBDT) follows the boosting learning mechanism where several weak learners are combined together sequentially to produce a strong learner in steps with improved accuracy. EGBDT algorithm initially analyses the microarray data set for errors and finds the data points that are difficult to classify. The number of stages k needs to be defined at the preliminary step (1).
A base learner F0(x) is formulated initially and then based on the loss function and residuals the learner is adjusted using the function h(x) at each of the k stages of execution. The loss function plays a pivotal role in deciding the efficiency of the classifier and normalization of the loss function is the key to avoid overfitting of data.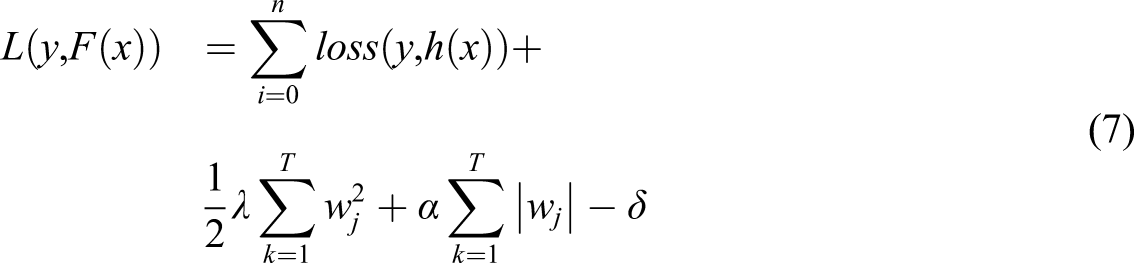
Normalization is achieved through L1 and L2 regularization with, α and λ as the regularization factors. The L1 regularization makes the weights sparse and the L2 normalization makes the weights to be as small as possible. In this work, in addition to L1, L2 normalization, depth of the tree is considered as an additional factor to the loss function for effective results as shown in the equation (7).
The negative factor is included for the depth of the tree owing to the reason that greater the depth, greater is the complexity in computation and the sparsity decreases which reduces efficiency. The residual, res is computed for each feature in the data set in each stage of the k iterations. Based on the results obtained from the residuals, the new model is made to accommodate the residuals and thus results in a new function to denote the model. Based on the loss functions, the learning module is re-modified and tested again comparing the result on augmented data with the original data set. After each stage of computation, the weights are again modified to accommodate more samples efficiently. The learner self-adjusts itself such that the misclassification rate is reduced to a minimal level possible. The mechanism is outlined in algorithm 3.
EGBDT classification.
Since the algorithm involves classification and regression, the complexity of execution of the algorithm in the training phase is O(nml) where the number of training samples is represented by n, the number of features considered is represented by m and the number of trees formed in the process is represented by l. The main computation cost that can be reduced is the number of trees that are being formed and reducing the number of nodes in the trees will have an impact on the formation of additional trees. The complexity of the algorithm in the prediction is given by O(ml). These trees can handle mixed types of features much more efficiently than other classifiers like Random Forest. Hence, the enhanced gradient boosted decision tree algorithm offers higher efficiency than other classification algorithms.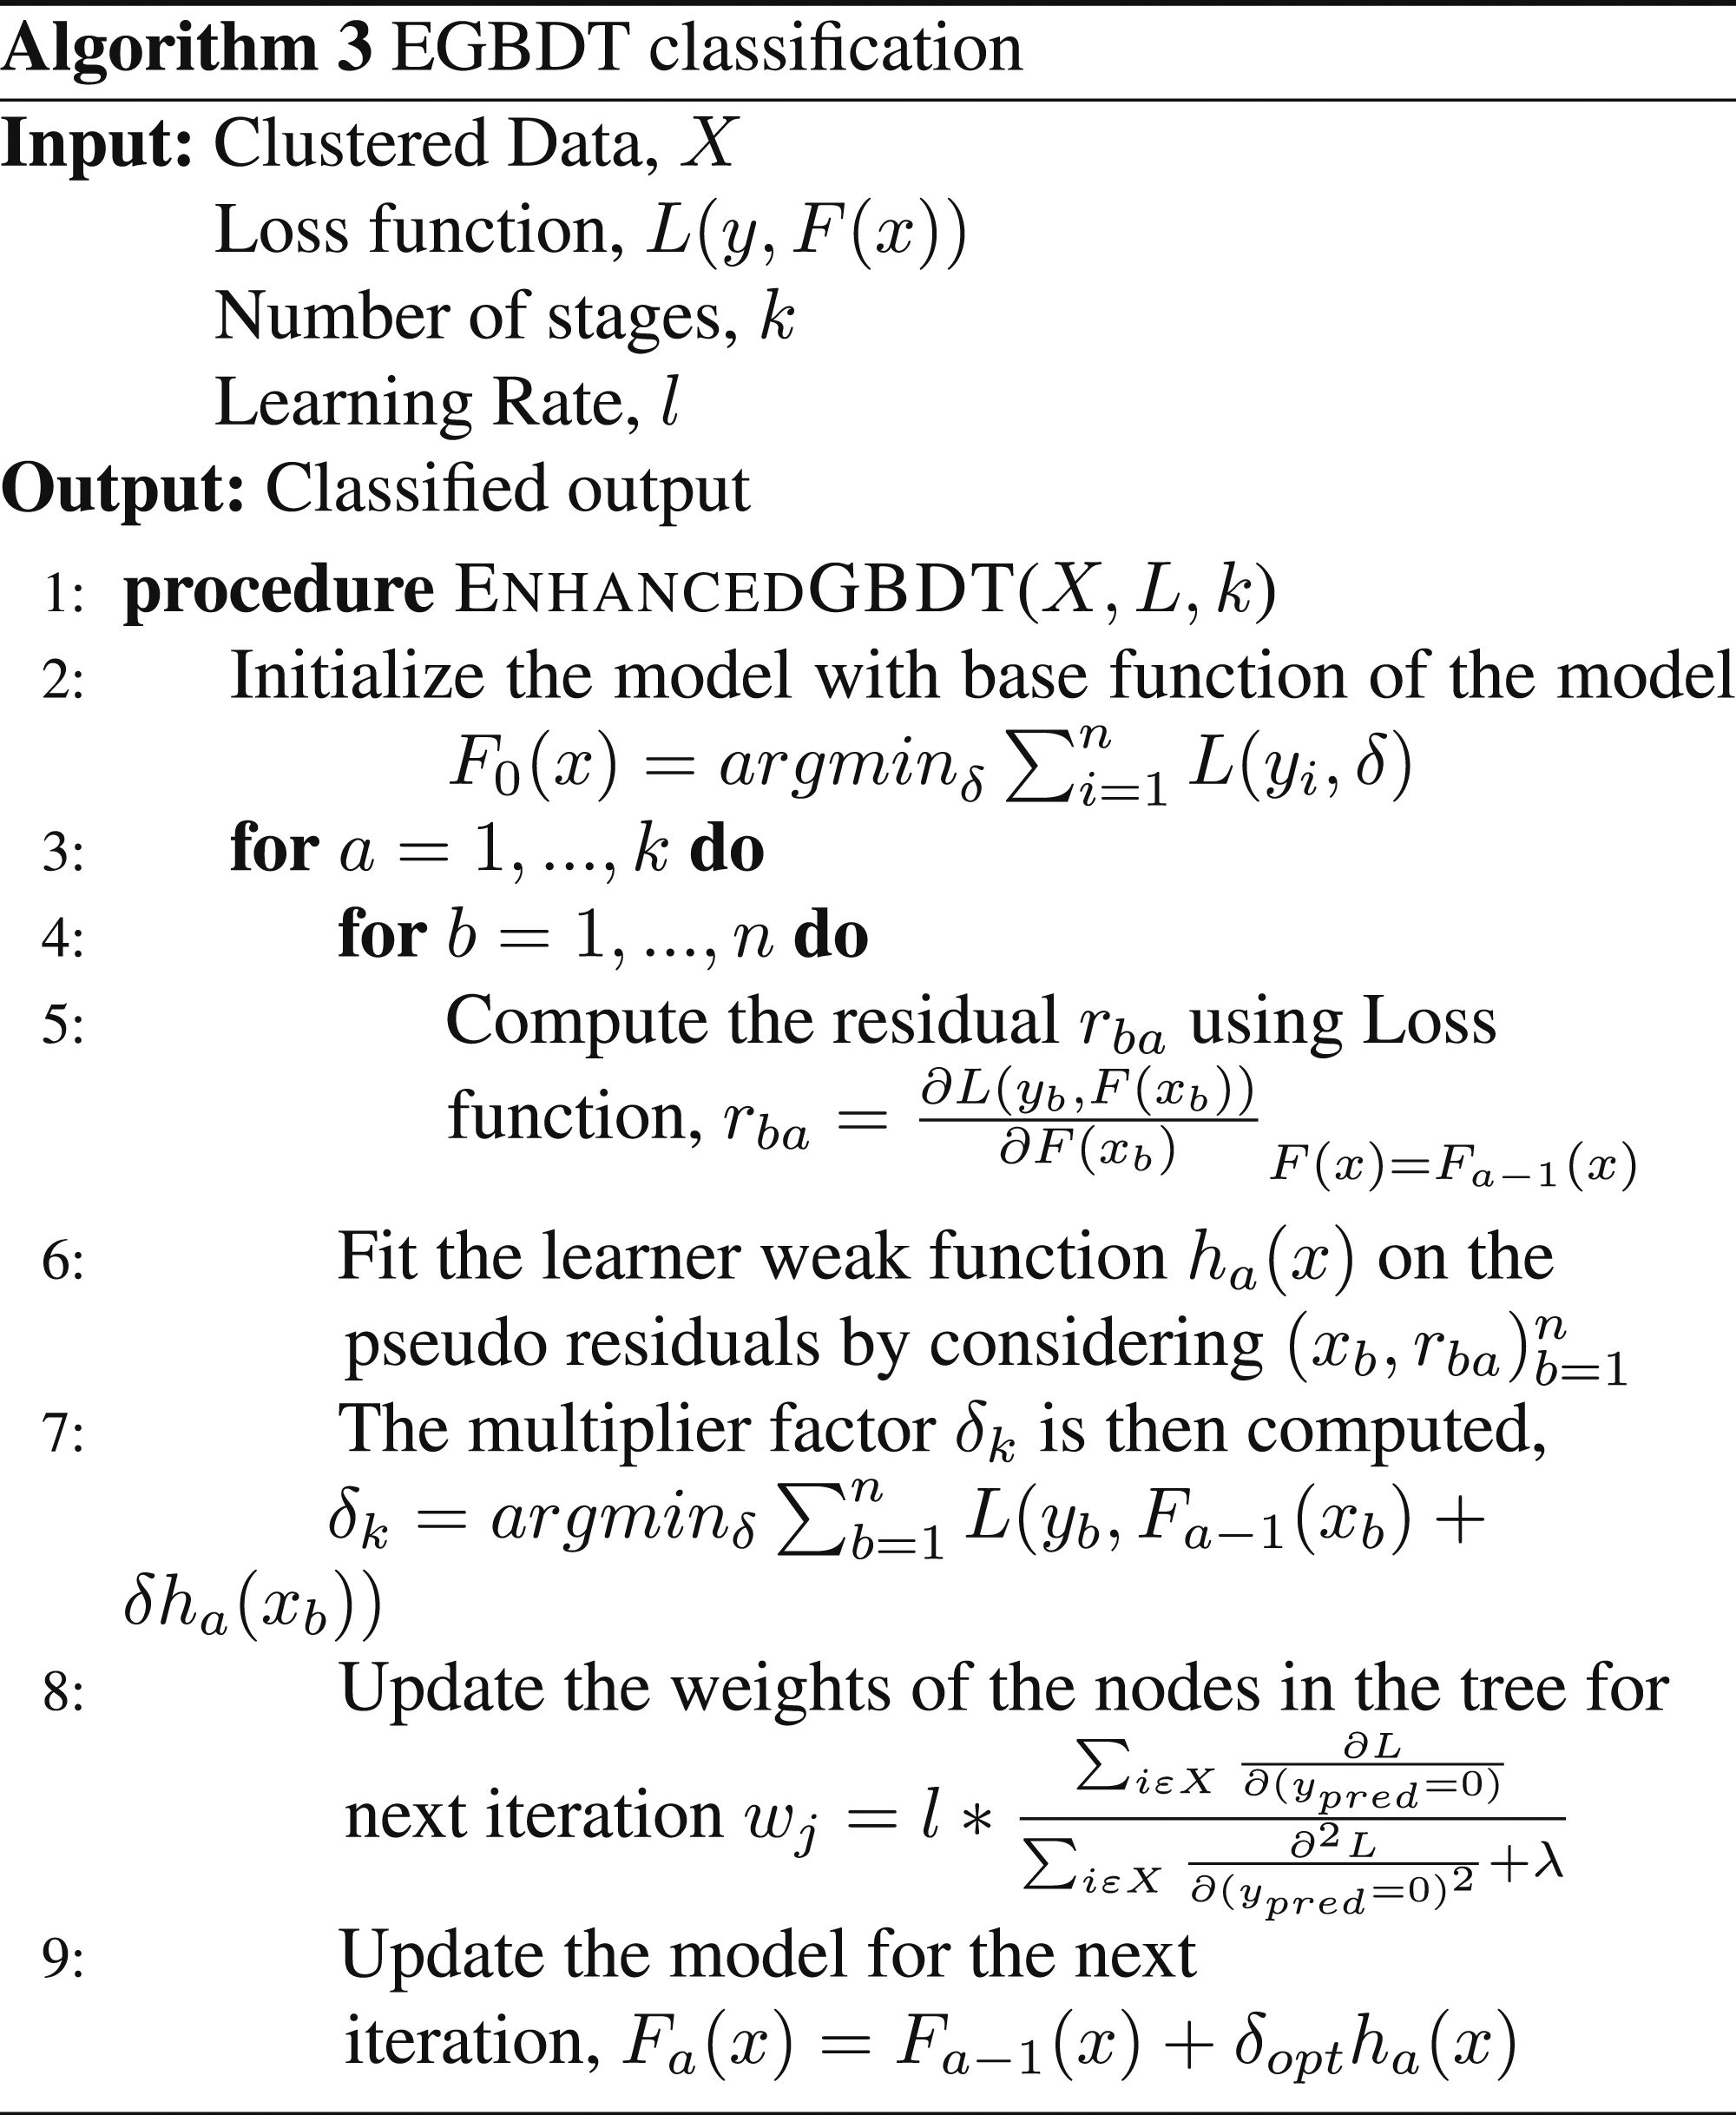
Results and Discussion
The proposed work generates common patterns among the disease causing genes through pattern matching with suffix trees, followed by the hazard score generation for each of the subjects under consideration. The relevant features are then applied during classification using gradient boosted decision trees classifier along with the computed score as a discriminating factor.
Pattern Matching and Suffix Trees
As the SNP sequence of genes is extremely large, the computation of pattern matching is carried out after the conversion of SNP sequence to protein sequence.12,15 The SNP sequence conversion is mainly done to reduce the computation burden. This step plays a significant role in the process for result calculation by reducing the gene sequence to one-third of its original size in protein sequence conversion.
Despite the high processing capabilities of the suffix tree algorithm, not all genes can be run in the algorithm at once and hence genes are taken as combinations.The computation is performed and then the results are merged to produce an output which is in cognizance with all the combinations of genes that have been tried out in the computation process. The combinations have been chosen such that there exists a lot of similarity between the constituting elements of the combination and hence the result turns out to be accurate.
The genes have been surveyed and around 50 genes have been taken into consideration with each gene having different impact on the disease and they have been ranked. A sample of genes has been listed in the order of their impact. • APOC1 • APOE-E4 • CR1 • PLlistaD3 • ABCA2 • PSEN1 • PSEN2 • APOE-E3
The genes have been grouped and the computation has been performed for each group and results have been aggregated. The suffix tree constructed using the protein sequences is shown in Figure 3 corresponding to the gene group (APOC1, APOE) which provides the common pattern.9,8 Protein sequence for APOC1 and APOE genes.
When common sequences of varying length are available, the maximum length substring is considered. The entire set of genes were run and the following sequence pattern came up after converting the resultant protein sequence to gene sequence as shown in Figure 4 Extracted sequence pattern.
Presence of this pattern can be checked for predicting AD and the accuracy of this pattern in AD prediction is validated by evaluating the NCBI database (https://www.ncbi.nlm.nih.gov) for this pattern matching and the accuracy of matching was evaluated as 91.47%. The usage of suffix trees has helped in computing pattern matching using linear time complexity and hence has paved the way for an effective disease detection model.
Hazard Score
The hazard score generated in this phase is a very good indication of the dangers associated with AD that are currently present in the subject’s body. As the hazard score is reflective of the disease causing and disease resistant SNPs, it is found to be a good analyzer for revealing the state of the disease and also the future risks of getting the disease (15). Following the observations made on the disease causing and disease resistant genes and their respective impact factors, hazard scores have been generated as shown for a subject in Figure 5. The disease causing and disease resistant SNPs present in the subject have been identified and listed in the output. Hazard score details.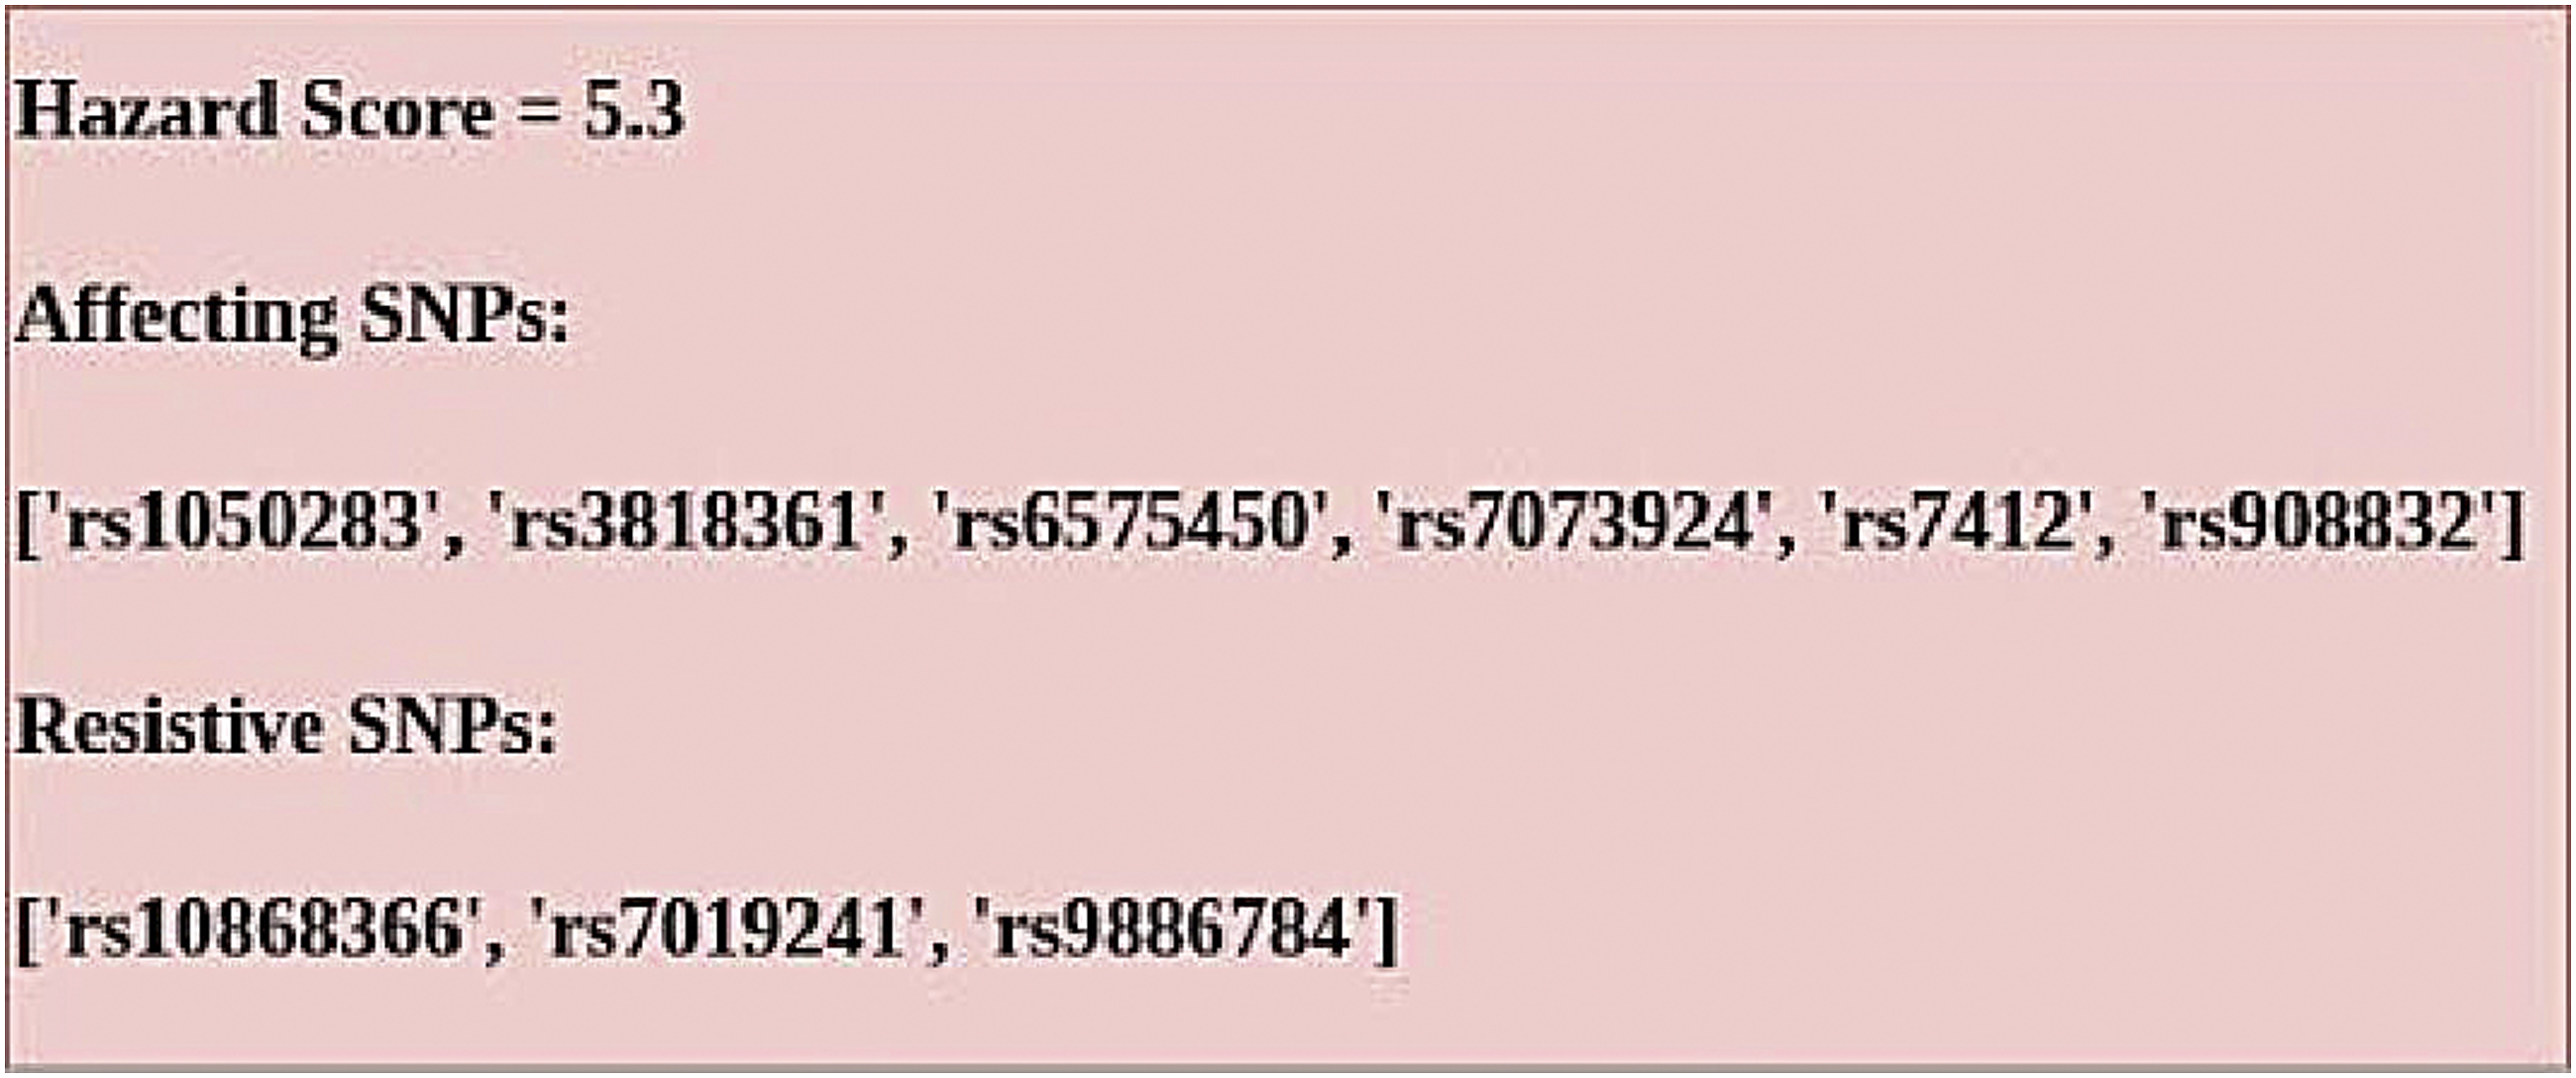
To adopt this score to label the degree of progress of the disease, a regression line using gradient descent has been utilized and based on the result of the regression line, the results have been classified into four different groups based on the risks involved in the disease. The classes are listed as follows 1. Remote chances of getting AD 2. Currently not affected by AD 3. Early stage of AD 4. Affected by AD
These groups have been well demonstrated in Figure 6 which represents the regression line for the hazard score of 50 patients considered. Figure 6 clearly describes the required state with respect to the hazard score generated. Regression line on the hazard score of 50 patients.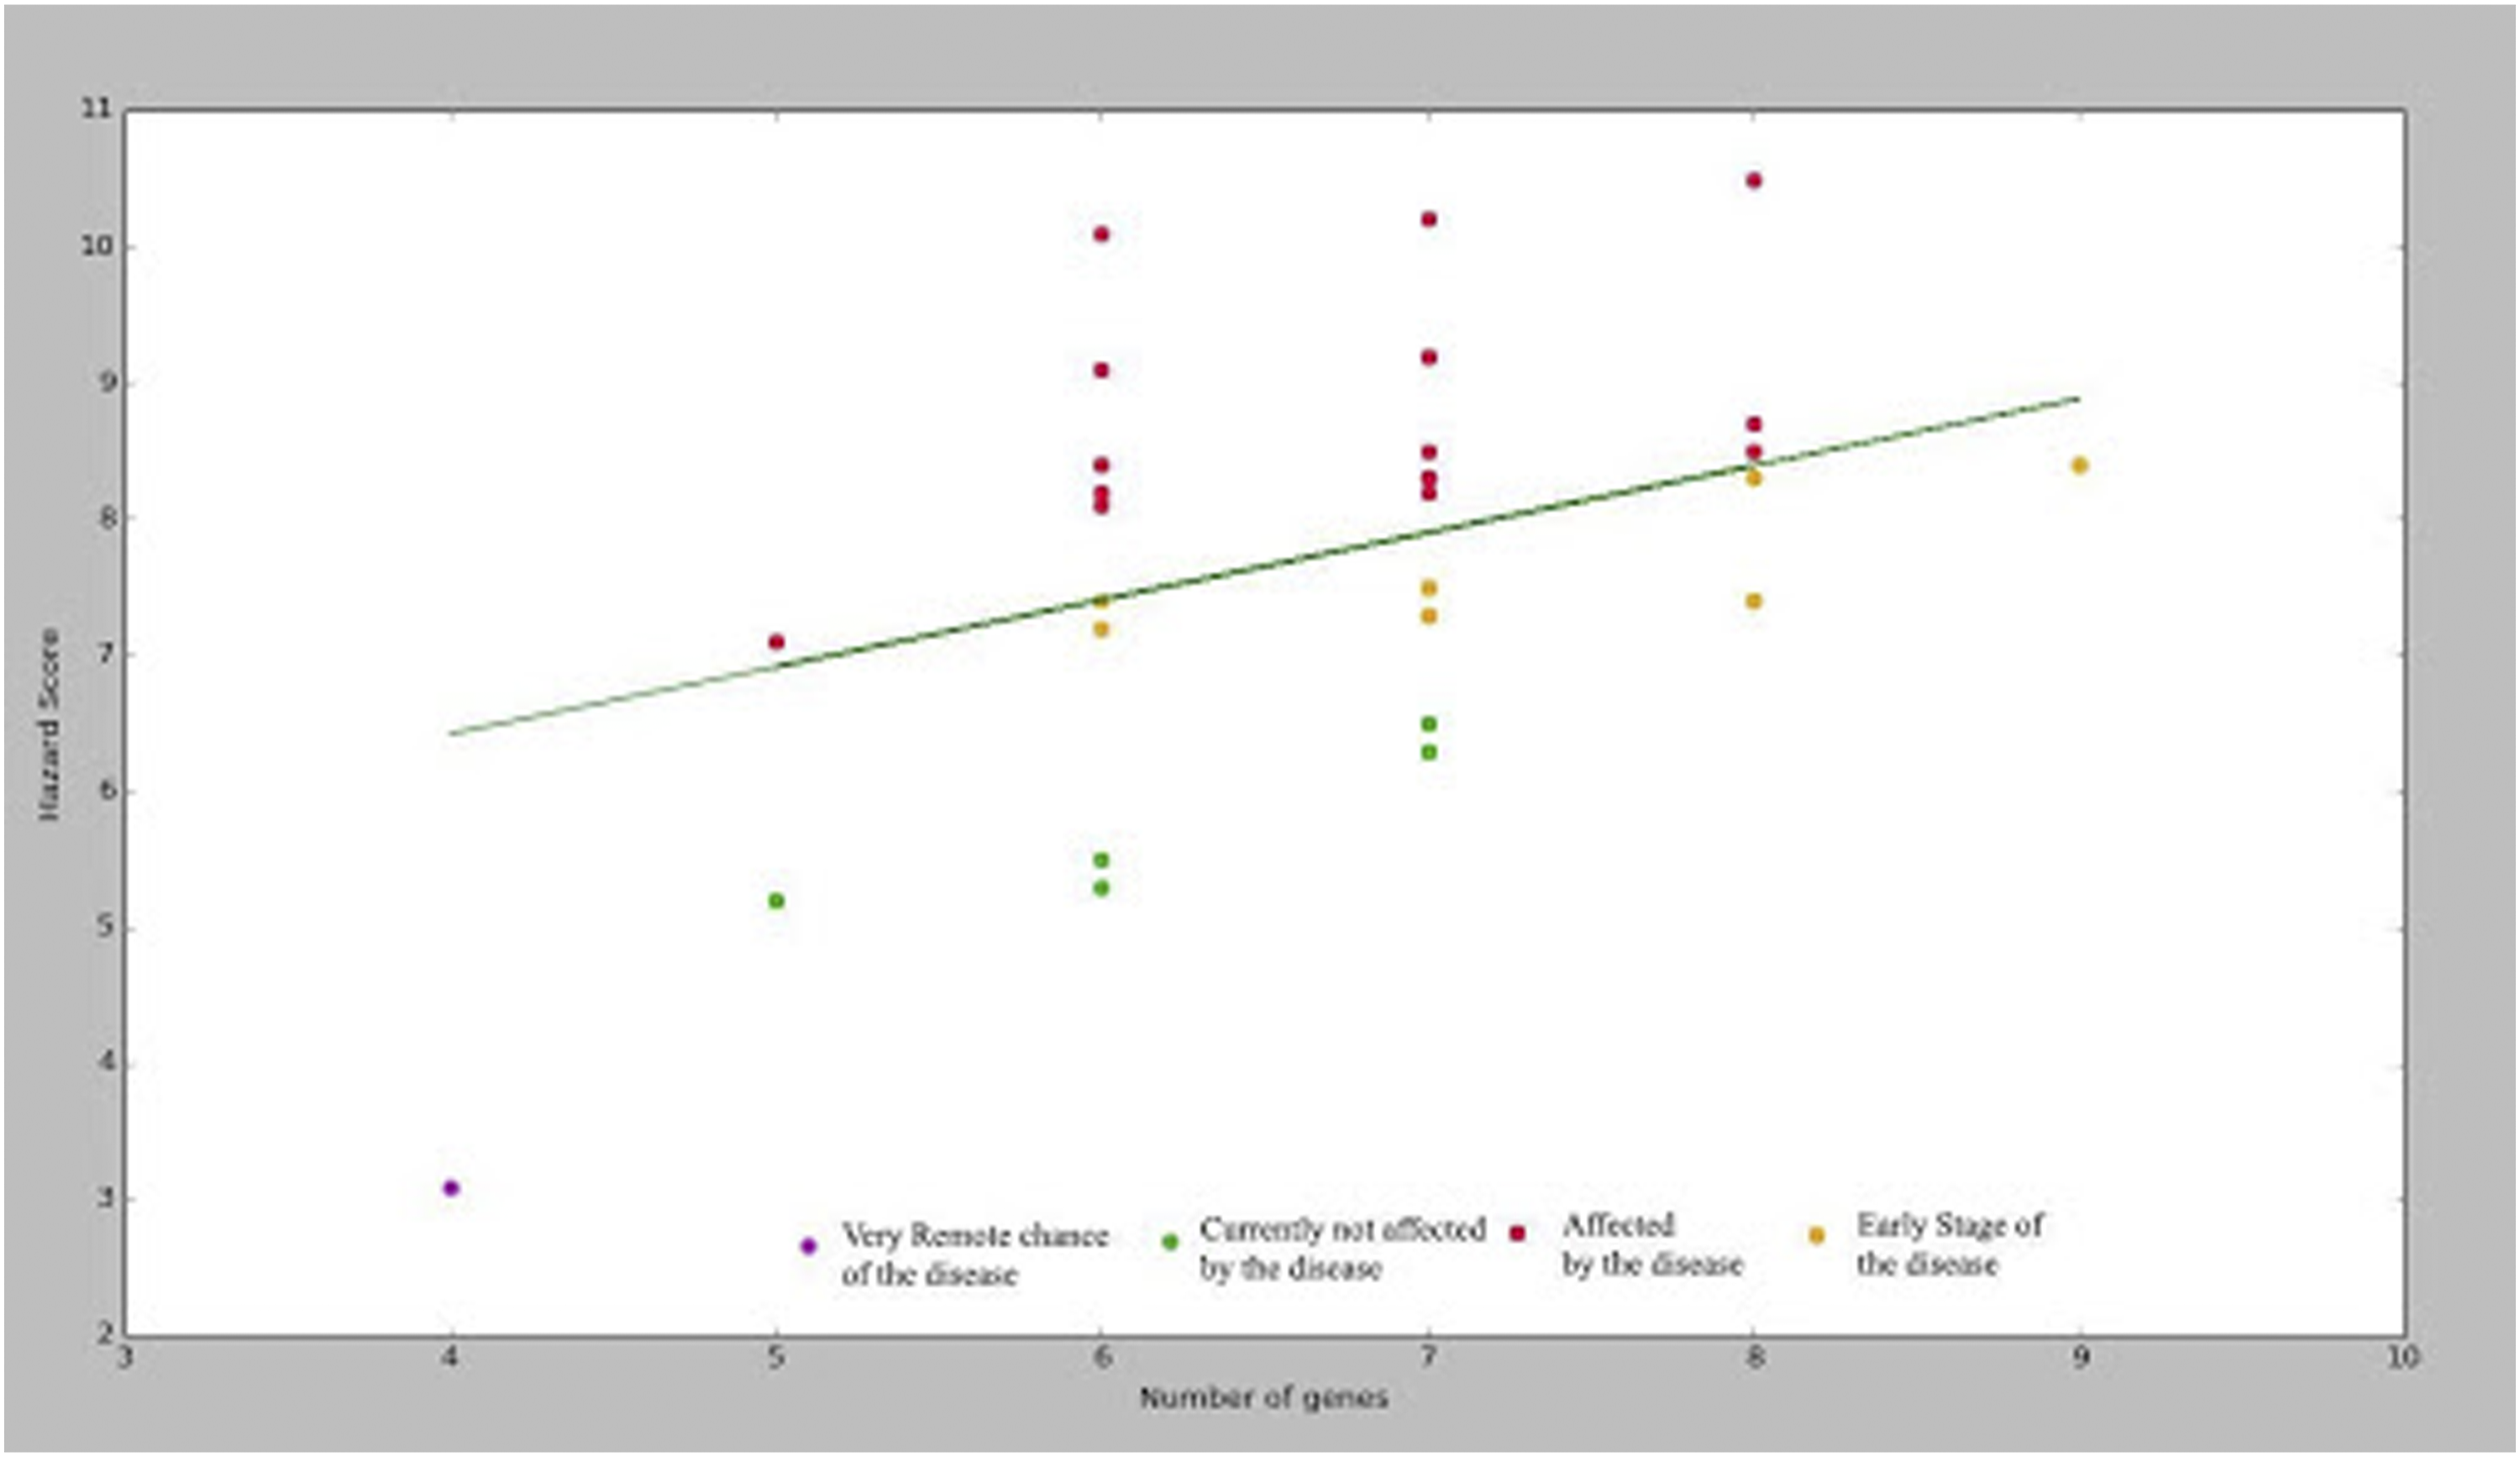
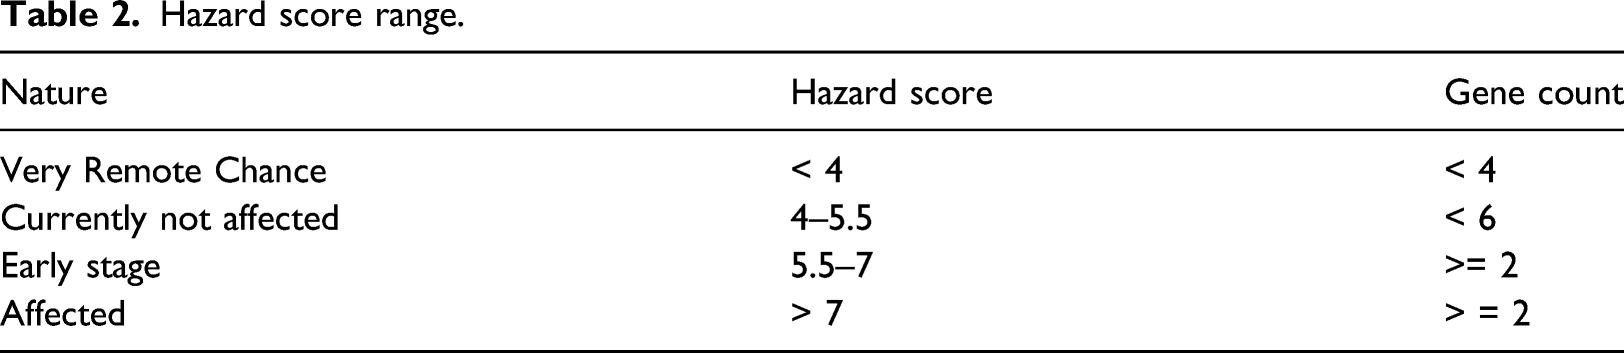
These classes are based primarily on the range of the hazard scores with higher scores leading to more severe presence of the disease and lower scores leading to absence of the disease. Observations can be made with respect to the number of genes and the hazard score generated. The relation between the number of genes present and the hazard score is complex as certain genes have extremely high impact leading to extremely high values of hazard scores. Furthermore, a large number of genes with extremely low impact could result in lower values of hazard score. So, the relationship between hazard score and number of genes is difficult to predict.
Hazard score range.
Hazard scoring helps not only in predicting the disease but also act as an indicator to identify the patients who are at risk of suffering from AD in later stages of life and hence helps in predictive analysis. This can be used in the field of personalized medication as the variations in genetic materials are well reflected in the score. This score being fed as one feature in the classification phase, improves the efficiency of classification as it well delineates disease causing genes from others.
Classification using EGBDT
A new data set is constructed using 730,525 records from the Alzheimer’s Disease NeuroImaging Initiative (ADNI) http://adni.loni.usc.edu/data-samples/data-types/genetic-data and GWAS database https://www.ebi.ac.uk/gwas/ taking into account the presence of certain disease causing SNPs, and disease resistant SNPs of diseases like AD, MCI, diabetes, blood pressure, thyroid, cholesterol with the computed hazard score as additional data feature. On doing this, around 123 features were obtained and classification is performed using the enhanced gradient boosted decision tree. Some of the important features are SNPs, risk alleles, p-value (probability of type-I error made in a hypothesis testing), mapped gene, associated trait, Chr (chromosome), position in base pair.
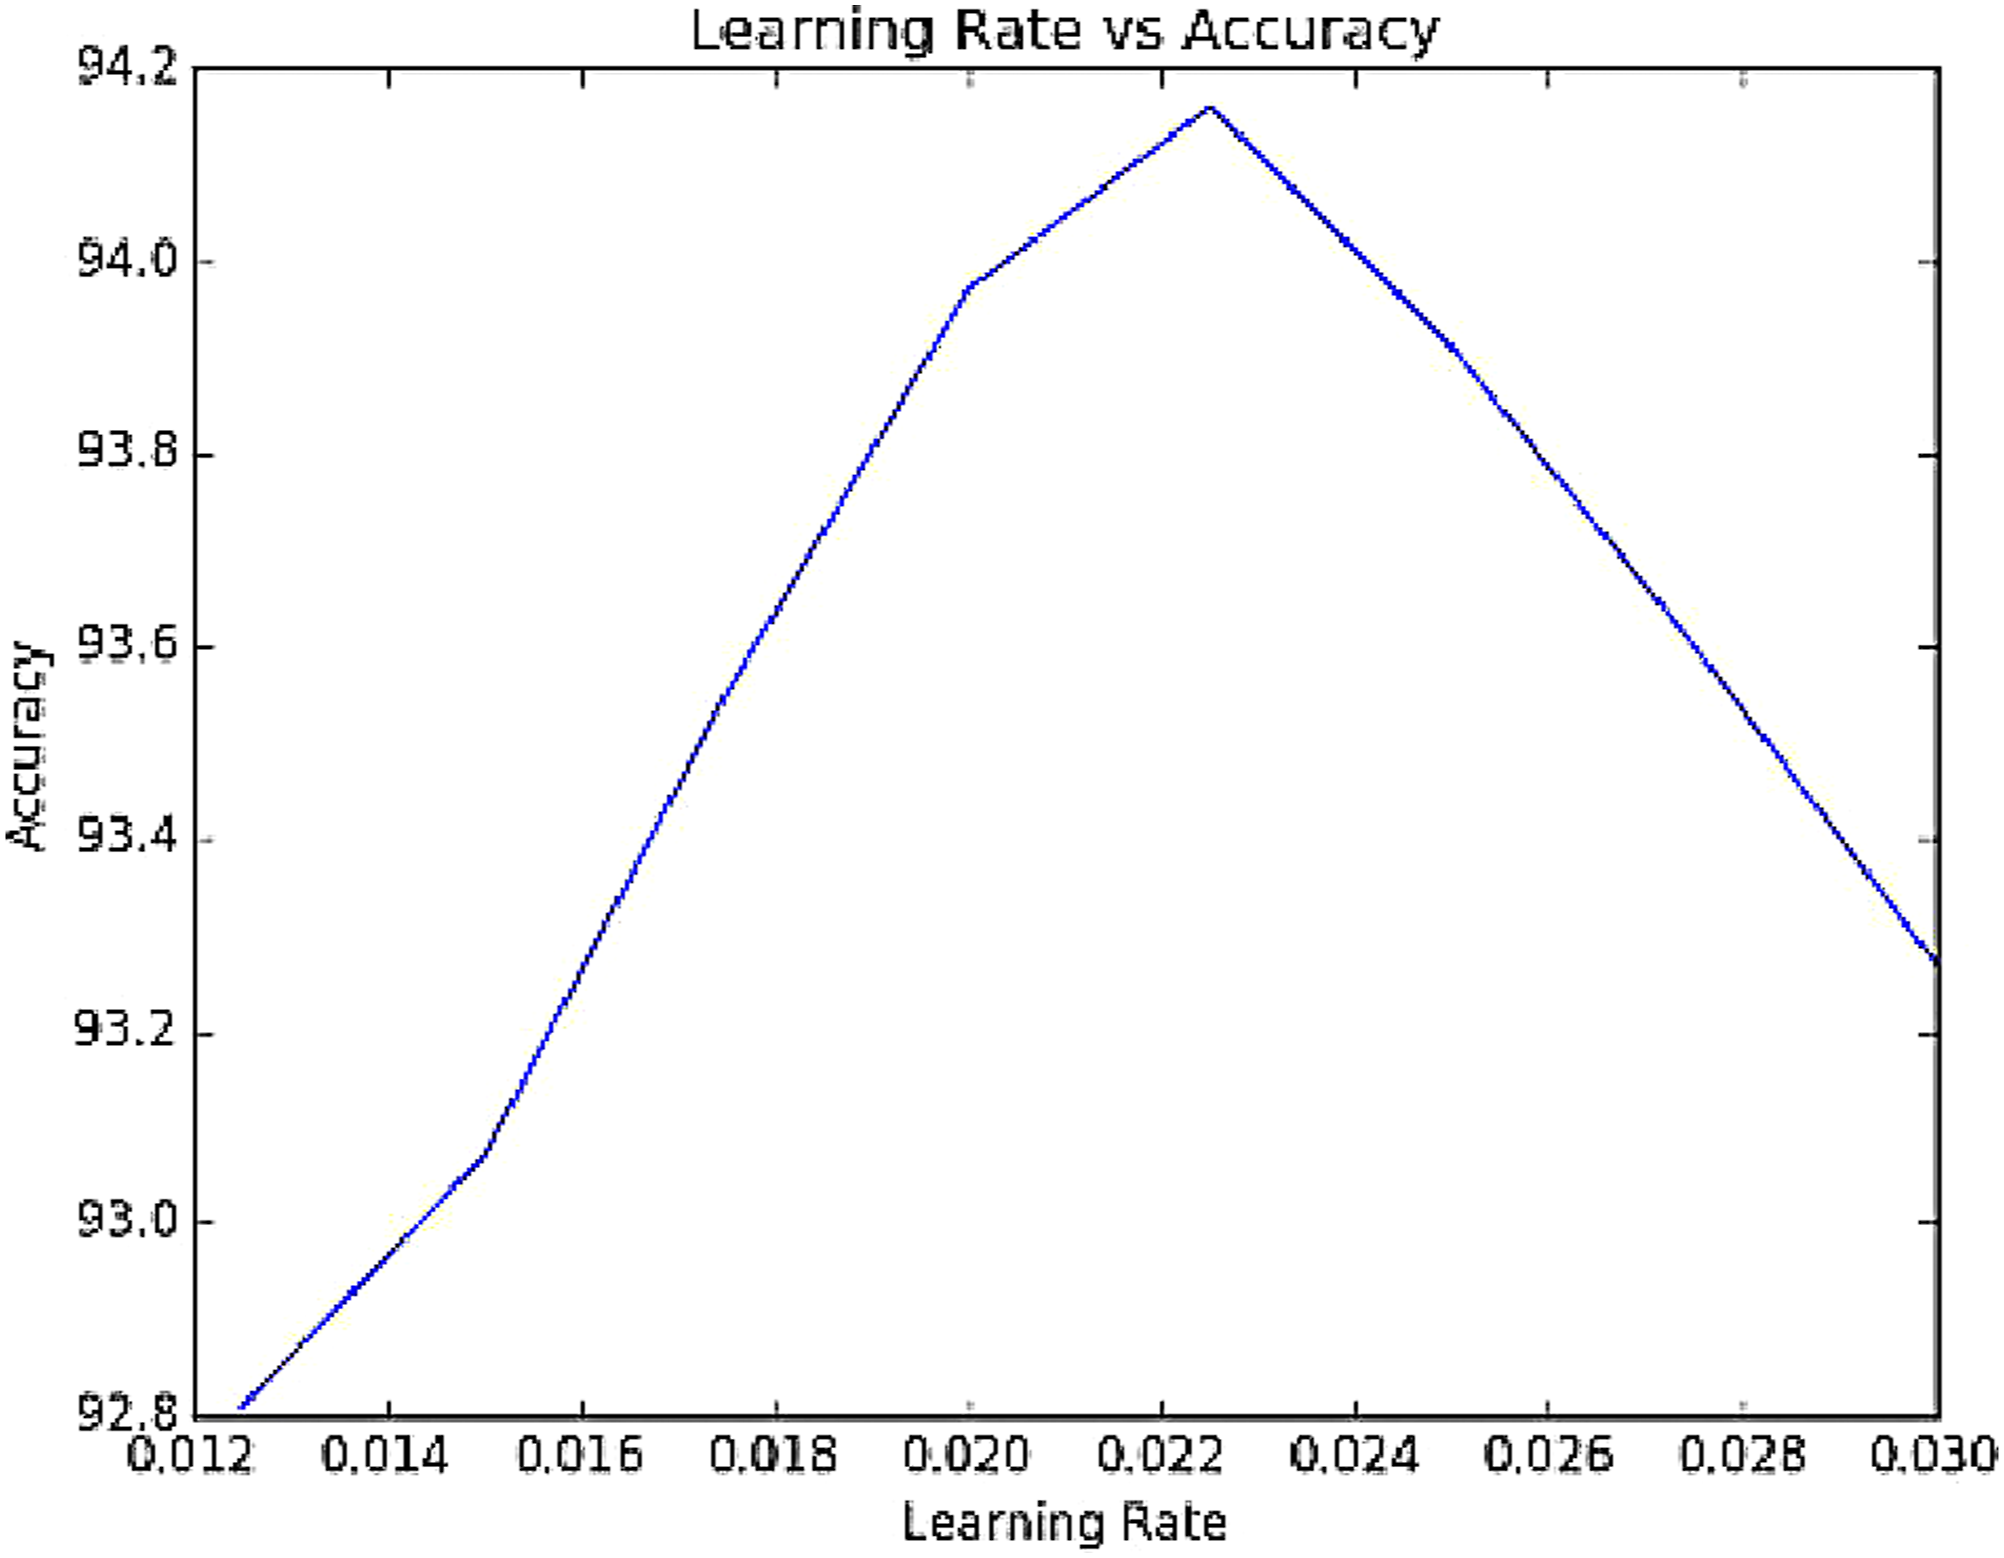
In the enhanced GBDT Algorithm, number of trees to be constructed and learning rate is some of the key factors that play a pivotal role in fine tuning the results to achieve highest accuracy. The effect of these key factors has been experimented and presented. The number of stages k, is varied for the enhanced GBDT algorithm and the corresponding accuracy in classification for the data set are visualized as shown in Figure 7 and the optimal number of trees has been fixed as 500. The learning rate for the data set, l is also varied and Figure 8 gives a representation of the variation of learning rate and accuracy rate of the classifier and from this statistical data, the ideal leaning rate is selected as 0.0225 for which the accuracy is maximum. Variation of accuracy with number of stages. Effect of learning rate on accuracy.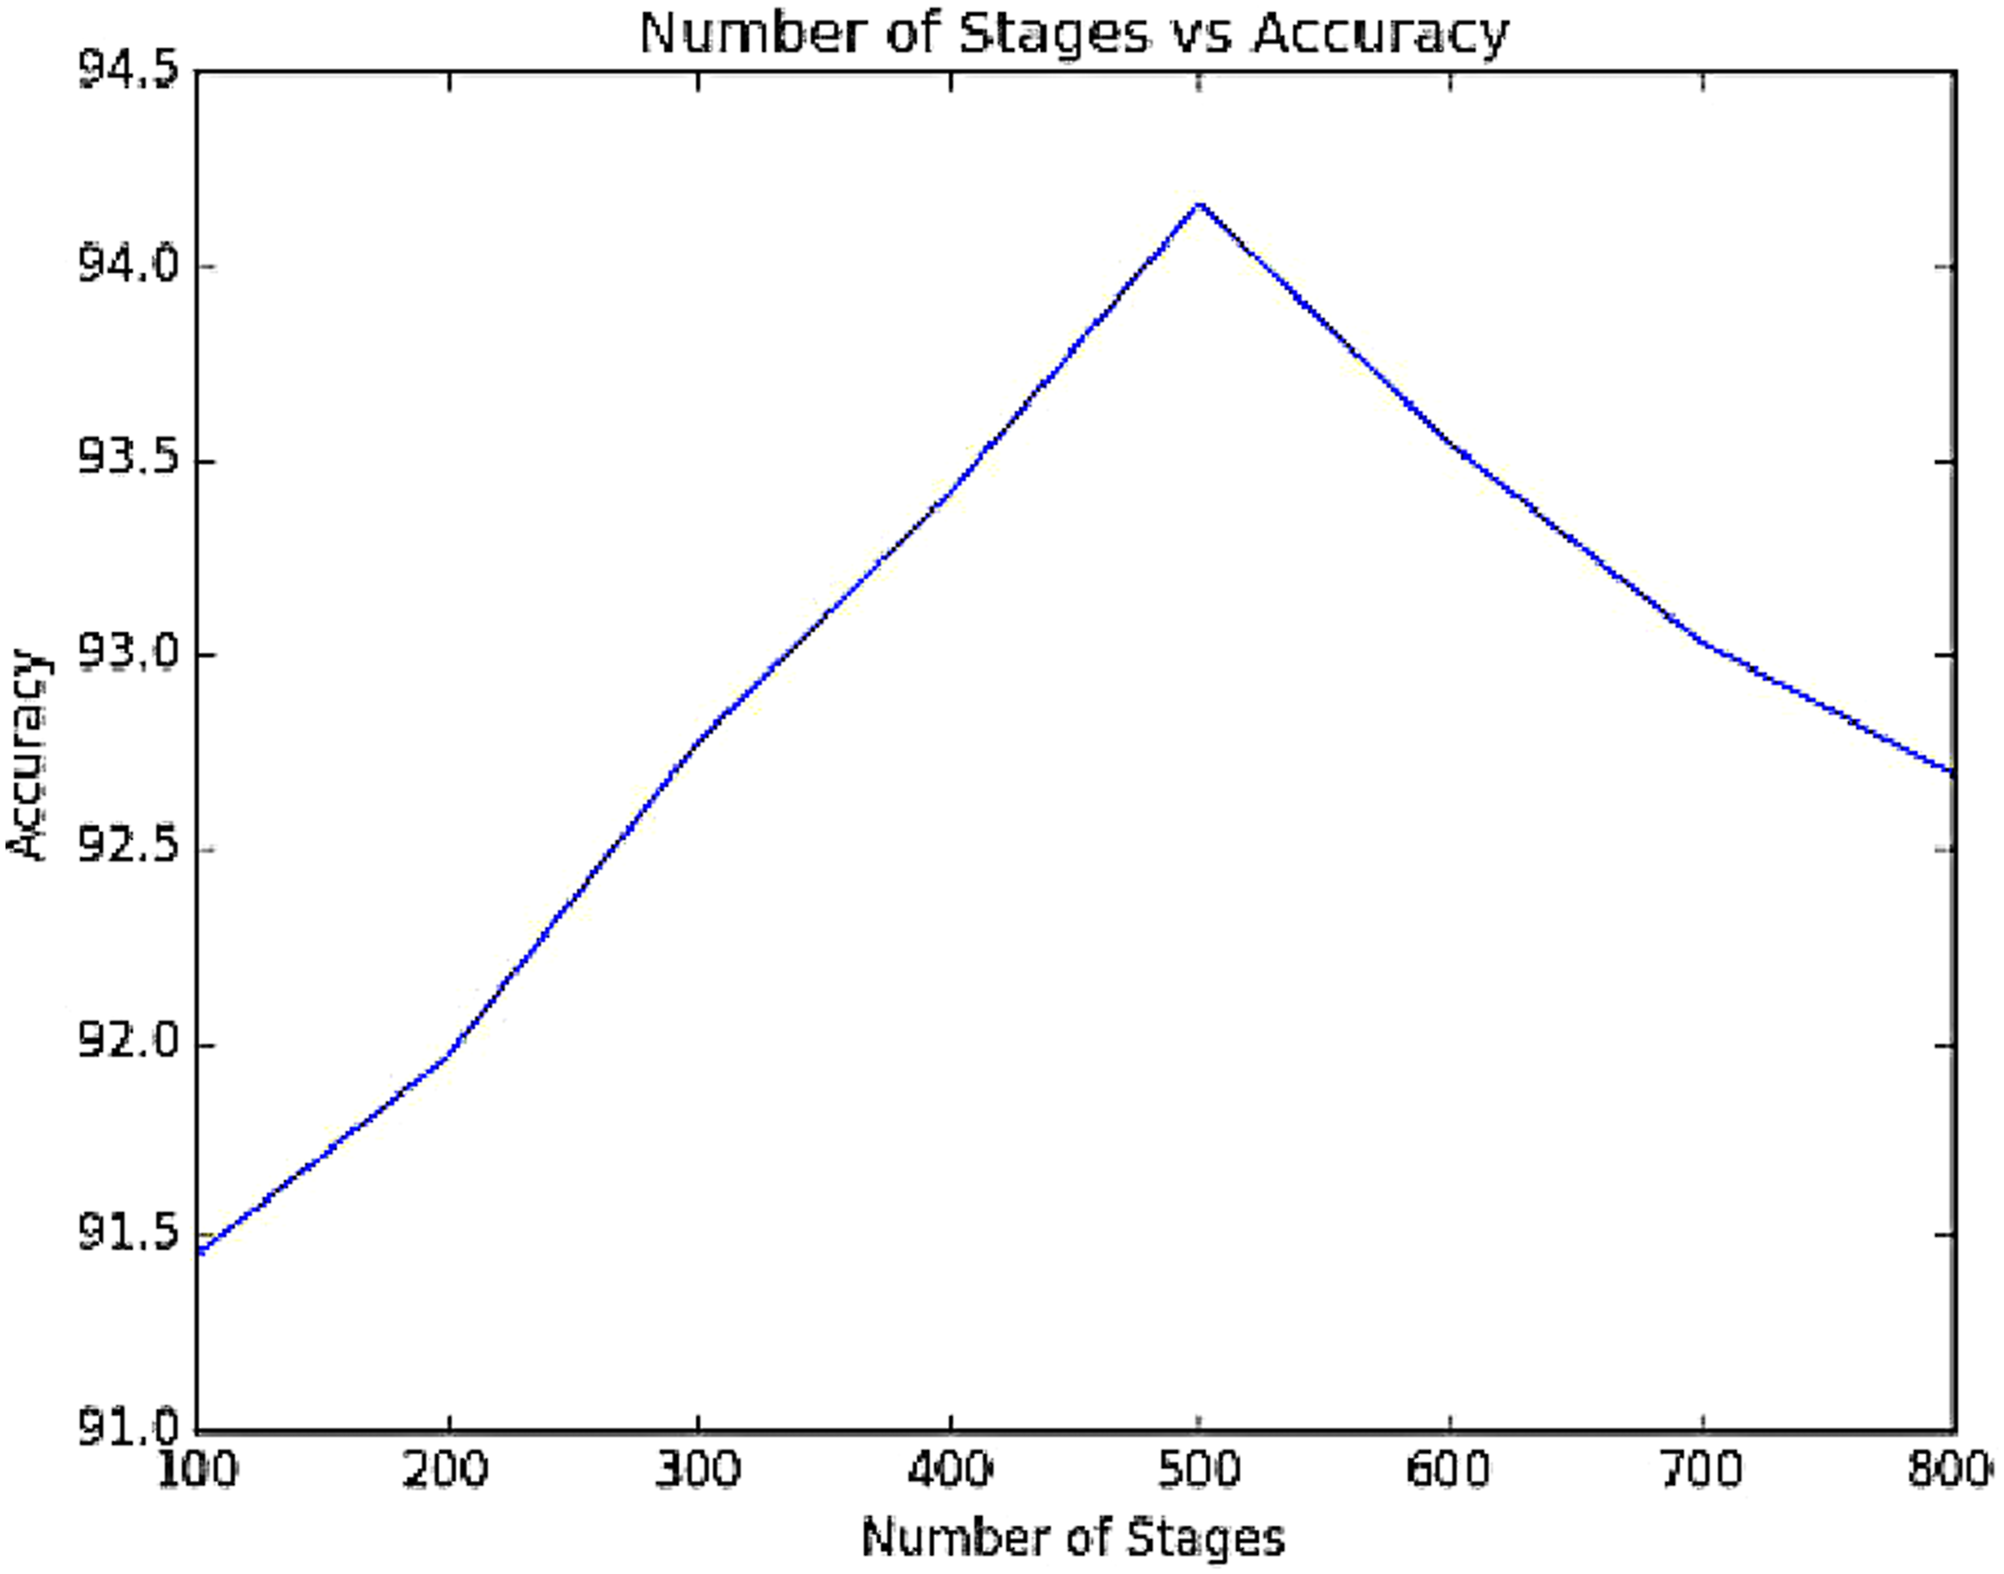
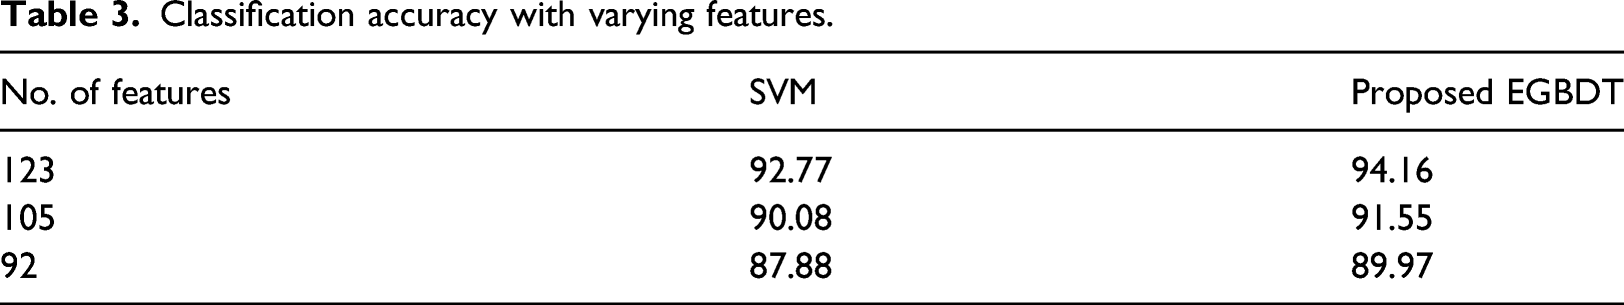
Classification accuracy with varying features.
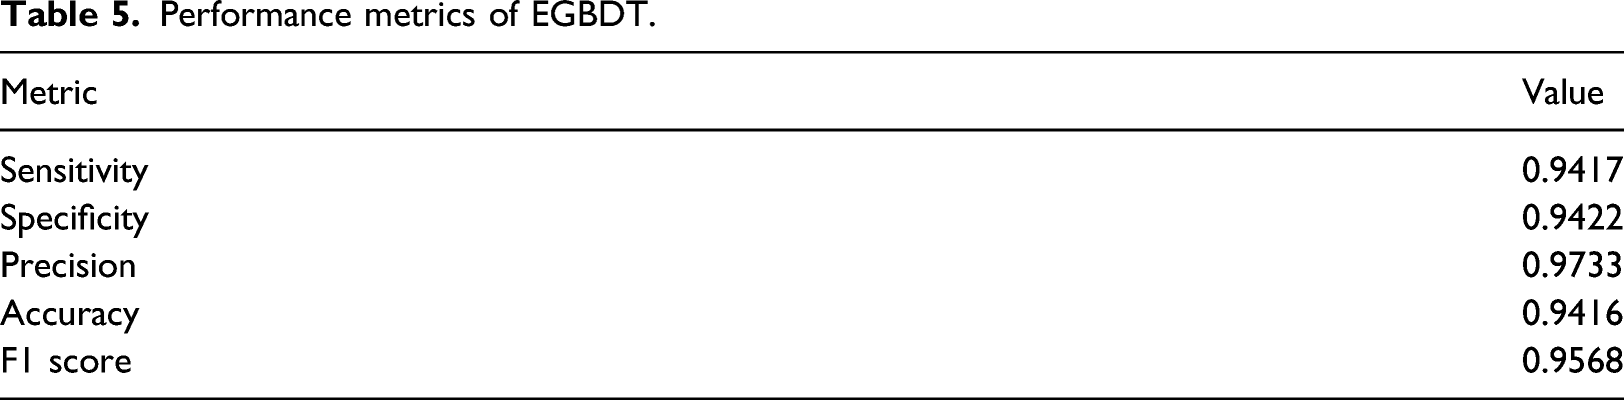
Performance metrics of EGBDT.
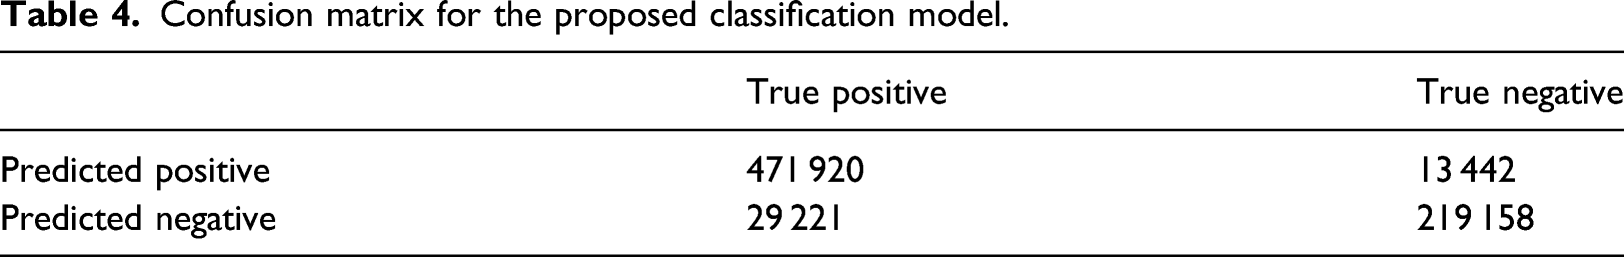
Confusion matrix for the proposed classification model.
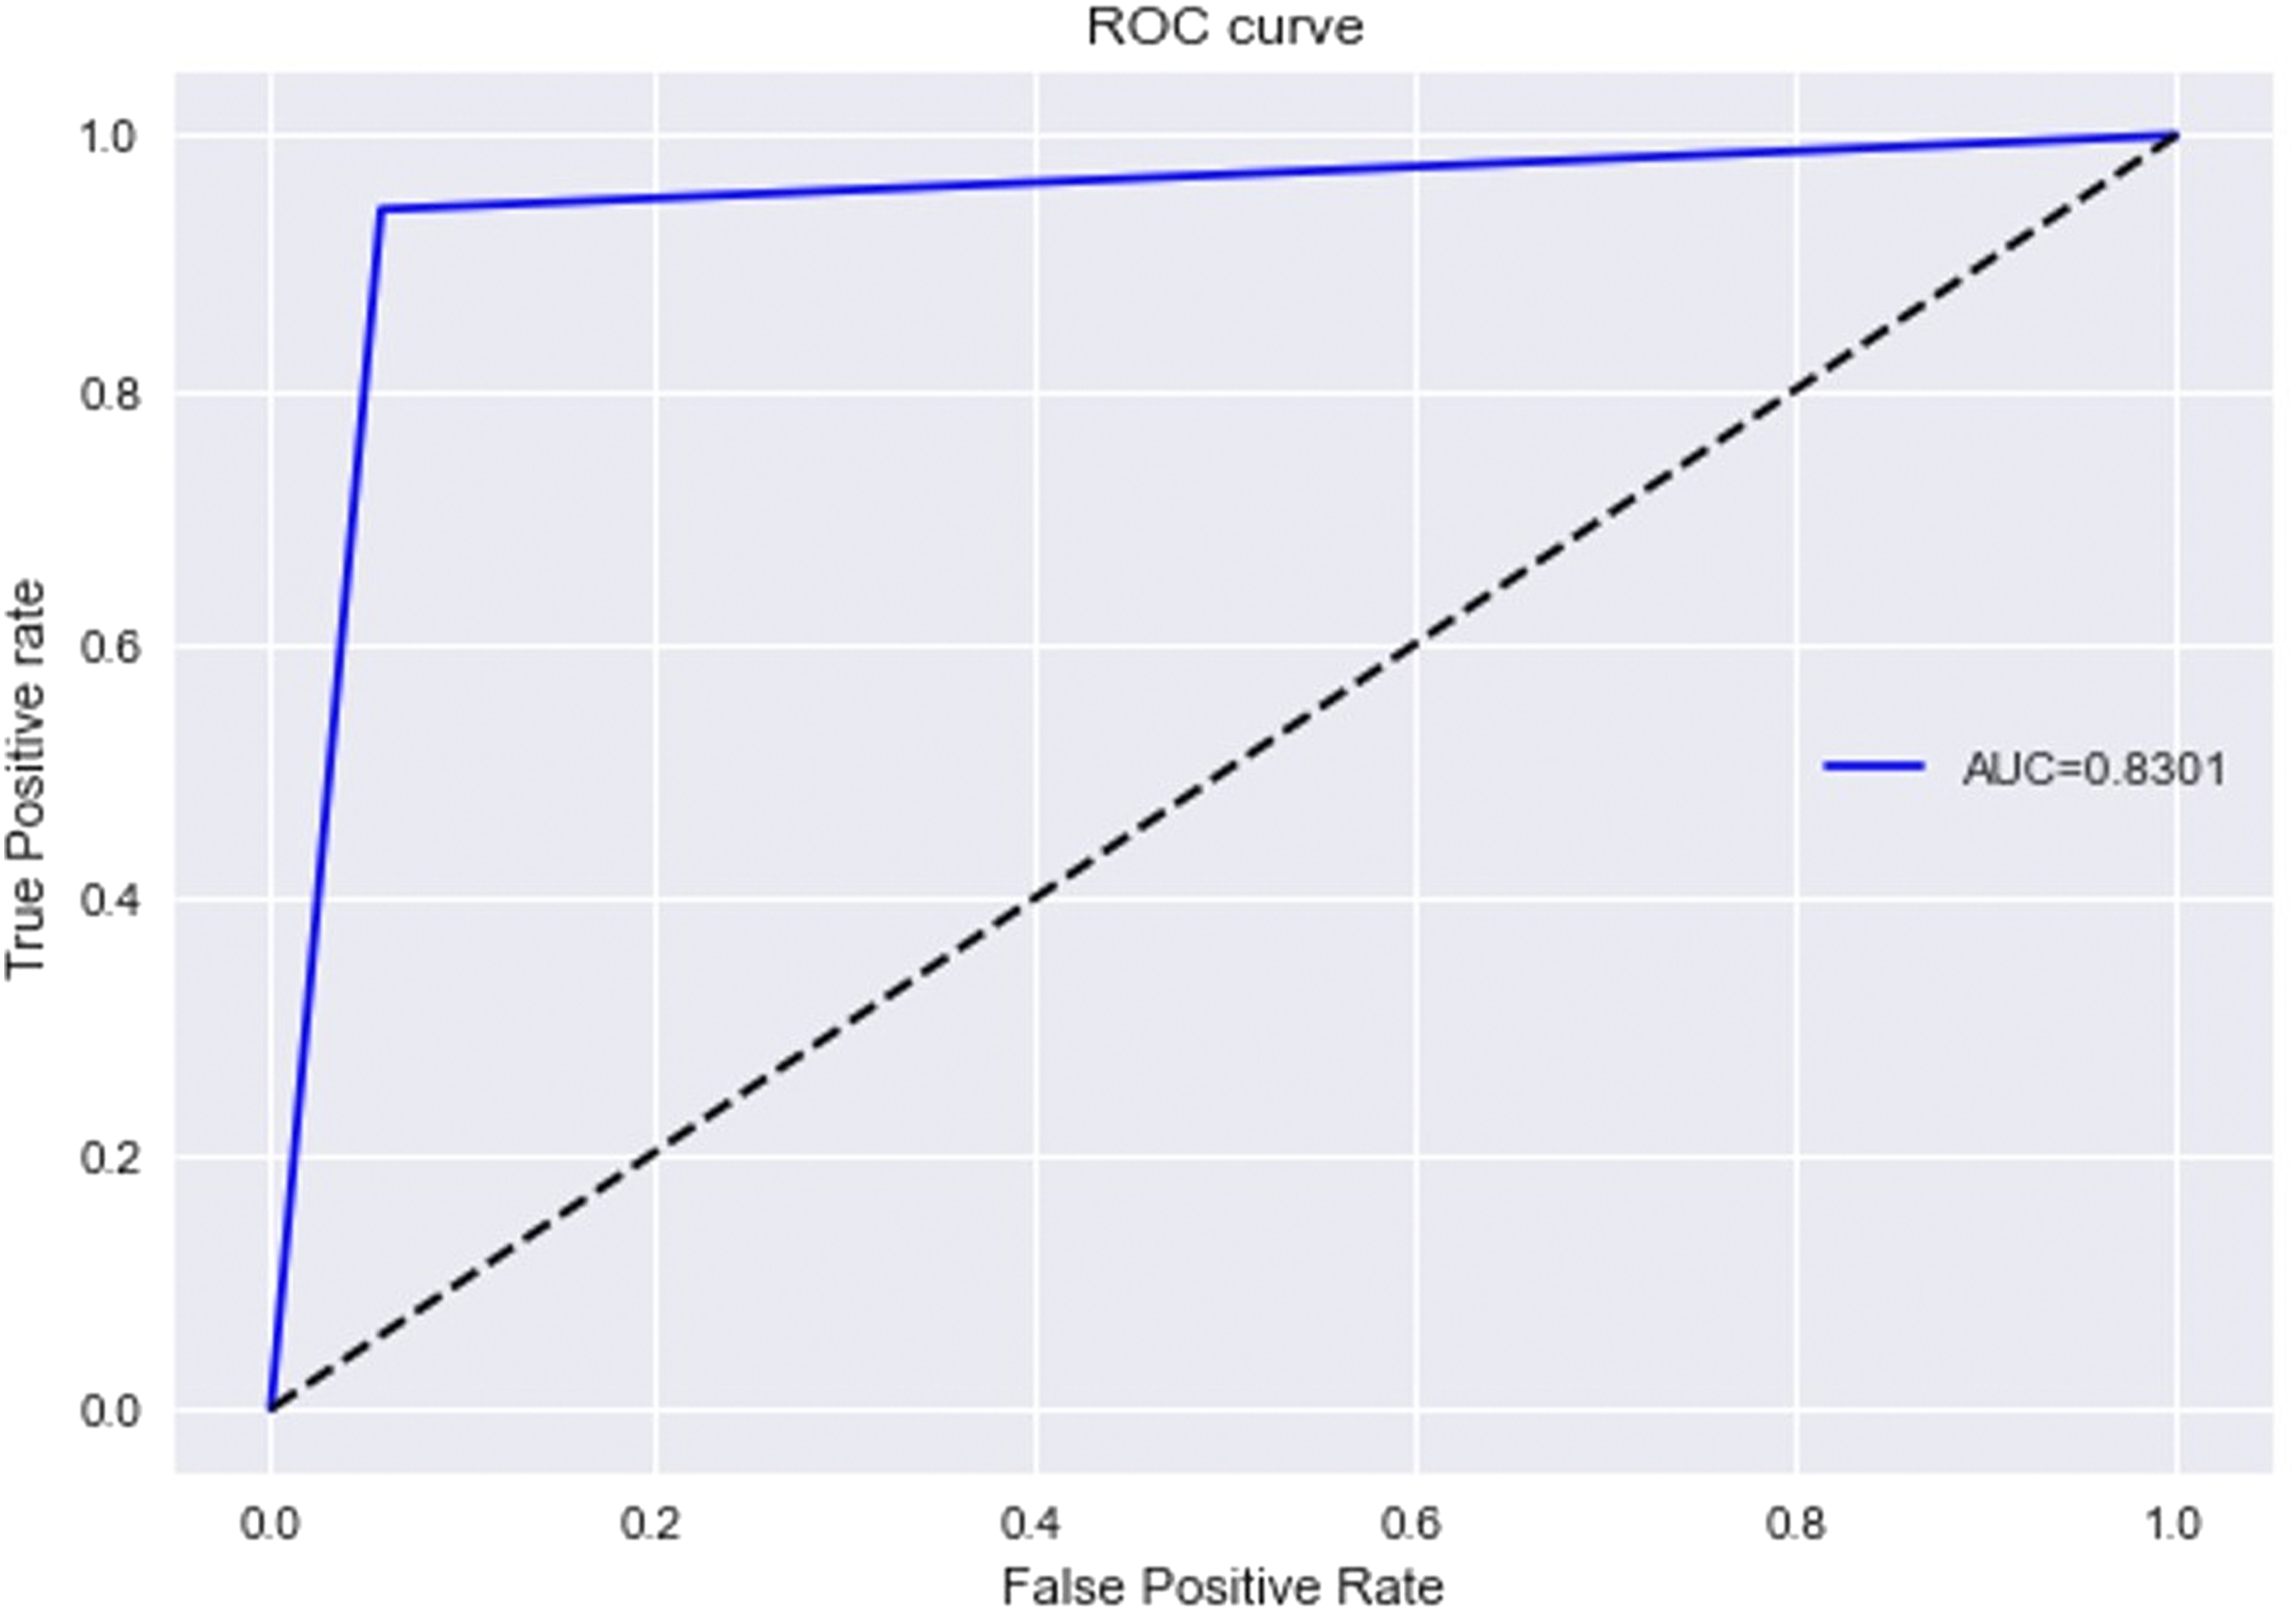
Roc curve.
Comparative Performance Analysis
Comparative analysis with recent works.
Conclusion
A two phase model for the early diagnosis of AD has been devised with a pattern matching mechanism using suffix trees followed by a hazard score generation process for effective classification. In the first phase, the identification of distinctive disease causing gene pattern using suffix trees has been used as a AD detection model at an early stage with an accuracy of 91.5%. A suffix tree is constructed for finding gene pattern that causes AD in linear time complexity. In the second phase, the hazard score is computed using the disease causing and disease resistant genes and it provides a good scope for deciding the severity level of the disease independently. Subsequently, it is employed as an additional criterion in the classification of AD versus healthy control with gradient boosted decision tree. The performance of the proposed EGBDT classifier has been analysed for effectiveness in prediction and time complexity. Results show that it is effective in identifying AD with higher prediction accuracy of 94.16% in comparison to some recent works on ADNI data set. The proposed work will significantly aid early diagnosis of the disease which in turn helps in clinical decision making towards controlling the rate of progression for AD. The clinicians can use this as a decision-making tool while diagnosing and treating AD. The proposed model is applicable to track the risks involved in aggravation of any progressive disease like COVID. Apart from the genetic changes, there are other changes that occur in the brain and the close examination of these changes also plays a significant role in the diagnosis of the disease. In future, this proposed mechanism can be combined with different imaging modalities like MRI and PET to formulate a holistic multi-modality model for still better prediction of AD.
Footnotes
Declaration of conflicting interests
The author(s) declared no potential conflicts of interest with respect to the research, authorship, and/or publication of this article.
Funding
The author(s) received no financial support for the research, authorship, and/or publication of this article.