
Abstract
Background
Multi-perspective process mining is an analytical approach that uses data to gain objective insights and uncover hidden problems in business processes from multiple perspectives.
Objective
In this paper, we apply multi-perspective process mining techniques in the emergency process through a goal-driven performance evaluation method in order to understand and diagnose the timeliness of the emergency process.
Methods
Unstructured and multi-disciplinary emergency data is analyzed by following Goal-Question-Feature-Indicator (GQFI) method. In this paper, the GQFI method is extended with perspectives, and the insights in the enriched event data are examined by a decision tree model. All of them are applied in a systematic way in relation to the goal of assessing and improving the emergency process in a university hospital.
Results
We detected the deviations (e.g., skipping the triage and consultation request steps) and two bottlenecks in the emergency process. Among the suggestions for improving the process, are performing defensive medicine in a harmless manner, classification of the emergency services, ensuring triage step is applied to all patients and effective usage of the call system application in consultation activities.
Conclusion:
The results of this study showed that goal-oriented multi-perspective process mining is effective in identifying process improvements in emergency services.
Introduction
In emergency services, accurate and timely interventions save lives while the smallest delay may lead to irreversible outcomes.1,2 These special departments have critical characteristics that sometimes pose serious challenges, for example, the urgency of patient care. Unlike physicians providing outpatient care, emergency professionals race against time. 3 In addition, emergency services are multi-disciplinary and require cooperation with other healthcare services. In 2018, the government of the Republic of Turkey put into effect new legal arrangements to reduce the work intensity of emergency professionals and overcrowded emergency departments. These arrangements specifically aimed to prevent long hospital stays through accelerating the consultation process and opening new clinics. In 2020, the quality of emergency services has been even more important due to cases related to COVID-19. 4
Process mining, an effective technique in business process management, 5 is increasingly applied in the healthcare domain for the purposes of process diagnosis and improvement. 6 Recent reviews in the literature7–9 indicate that research on process mining applications has been undertaken in a variety of healthcare specialties. The idea behind process mining is to discover, monitor, and improve actual or applied processes. The observed behavior of health services can be constructed from healthcare data already present in hospital information systems, and existing clinical pathways can be validated with respect to protocols using conformance checking techniques. Still, some studies report the challenges faced when using process mining techniques in the healthcare domain.10–12
Researchers increasingly apply process mining techniques to actual emergency processes13,14 using different perspectives, including organizational15,16 and time.17,18 Various process mining techniques, such as traces explorer, conformance checking, and performance analysis, have been conducted, and qualitative/quantitative benefits have been reported in previous studies.19,20 Emergency data has been analyzed to understand 21 or measure the similarities 22 of process traces via visual analytics tools. Relatively little research has been performed for the purpose of identifying improvements based on insights obtained from enriched emergency data through the multi-perspective process mining and root cause analysis techniques.
In this work, we applied multi-perspective process mining techniques to the emergency process of a university hospital in Turkey by following a goal-driven process mining approach.23,24 This approach provides to monitor, control, and improve process performance based on a goal-driven method in order to incorporate domain knowledge through an iterative analysis and also the practice of distributed process mining. As a difference in this study, we create a combined process map which allows us to see control flow and performance perspectives in an integrated view. Then event data is enriched and insights are investigated through a decision tree. In doing so, we analyze the timeliness of the emergency process, present the features of process mining to identify various indicators of a reliable evaluation, and enable to discuss suggestions for the improvement of the emergency process in the hospital. More specifically, the research steps of the work presented in this paper are as the following: 1. creating a table called extended GQFI (“Goal-Question-Feature-Indicator”) that addresses project goals, questions, features, indicators, and perspectives of a process mining project by guiding the use of multi-perspective process mining techniques in the emergency department; 2. following the table, during which the process mining analysis is executed and the results are used as inputs for evaluating process performance; and 3. proposing process improvement opportunities related to process performance indicators.
The remainder of this paper is structured as follows: the background section provides information on process mining and related work. The implementation section presents the application and the results of the goal-driven process mining project in the emergency process. The conclusion section discusses these results in relation to the literature, presents the overall conclusions, and offers recommendations for future work.
Background
Process mining is a relatively young research discipline that sits between computational intelligence and data mining on one hand, and process modeling and analysis on the other hand. 25 Process mining includes process discovery (extracting process models from an event log), conformance checking (monitoring deviations by comparing model and event log), social network/organizational mining, automated construction of simulation models, case prediction, and history-based recommendations. An increasing number of tools supports process mining functionality, such as ProM, 26 Disco, 27 Minit, 5 ARIS, Celonis, and Perceptive Process Mining. Basically, there are three main aims of process mining: process discovery, conformance, and enhancement. Another purpose of applying process mining is finding the root causes of performance or compliance problems in processes. 28
The root cause analysis starts with an existing event log and enriches it with relevant contextual information.29,30 Process mining can be applied from multi-perspectives focusing on control-flow, resource, data, time, and function. 31 It can also be implemented online or offline. The results of process mining can be used to reason about processes (e.g., redesign) or to make decisions within the processes (e.g., for operational support). Process mining provides various benefits, with the most favored being the improvement of processes through diagnosing bottlenecks, uncovering delays, identifying overlaps or duplications, and eliminating rework by reviewing the discovered process maps.
Studies that applied process mining techniques to the emergency process with various goals from different perspectives.
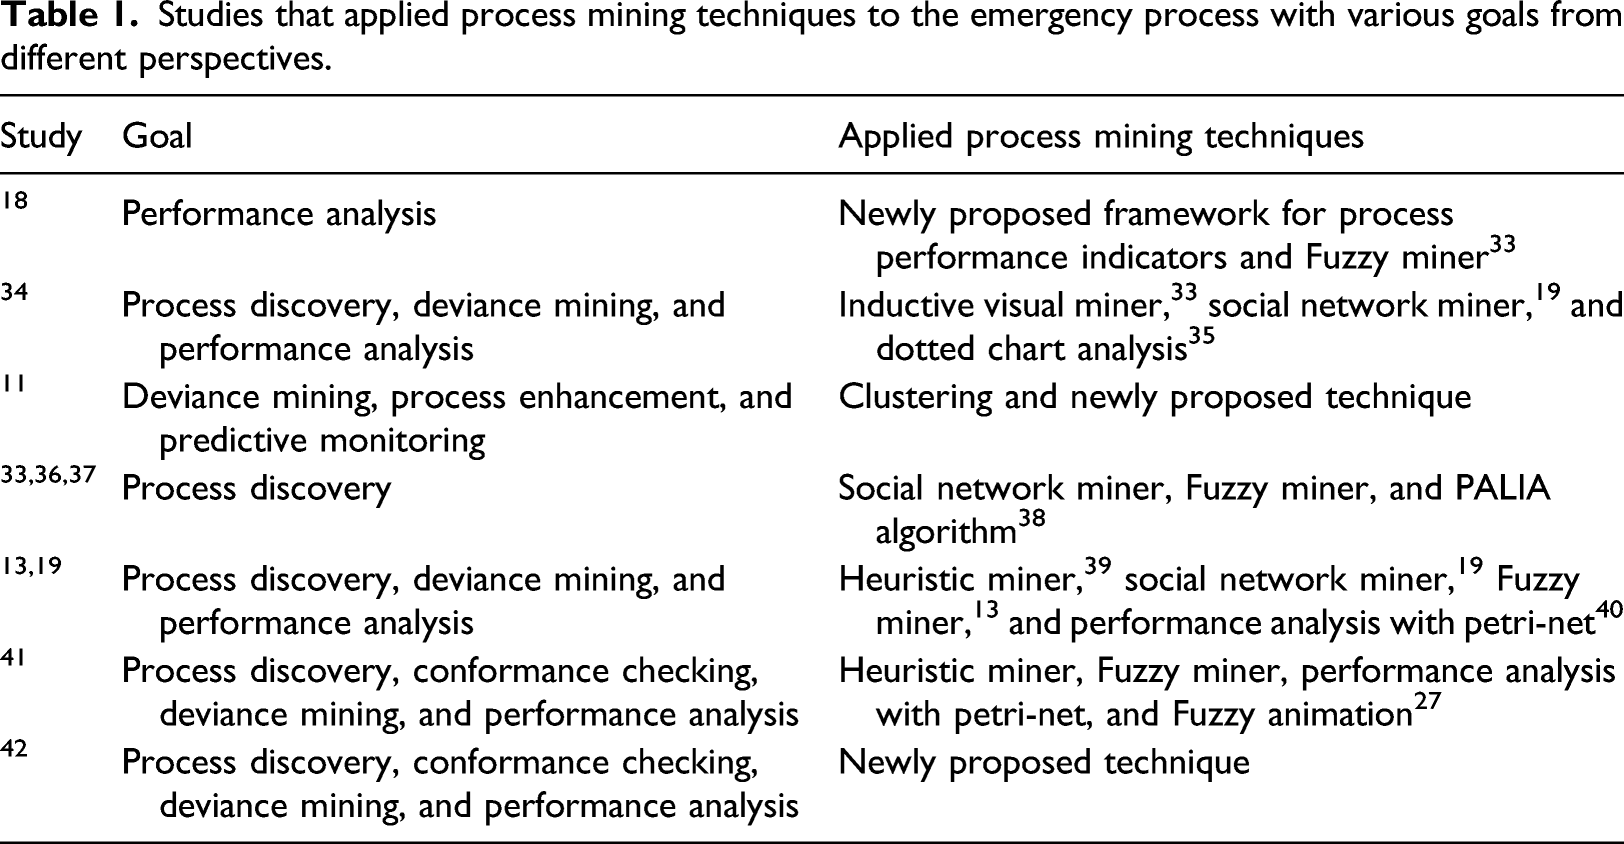
The current study covers all three aims of process mining, as well as activities such as traces explorer and performance analysis from multiple perspectives. Enriching event data allows medical staff to identify root causes of outliers, deviations, and bottlenecks. For this purpose, the basic statistics for the mostly followed traces, exceptional traces, bottlenecks, and deviations of the actual combined emergency process are created and analyzed. Furthermore, opportunities for improvement are identified to maximize outcomes and the quality of emergency care. The validity of the findings is also confirmed with the medical staff working in emergency services.
GQFI is a process mining-based process evaluation method for improving healthcare processes.
23
This method is suitable for unstructured processes, such as healthcare, and provides a guide for the state-of-the-art process mining techniques, extension of data preprocessing steps, data visualization techniques, process exploration, and outlier detection. It helps achieve project goals such as improving a process with respect to particular key performance indicators (KPIs), obtaining concrete data, and answering performance oriented questions, for example, especially frequently posed questions (FPQs).
6
In this study, we extend GQFI method by a root cause analysis and multi-perspective process mining as shown in Figure 1. GQFI (Goal-Question-Feature-Indicator) with root cause analysis.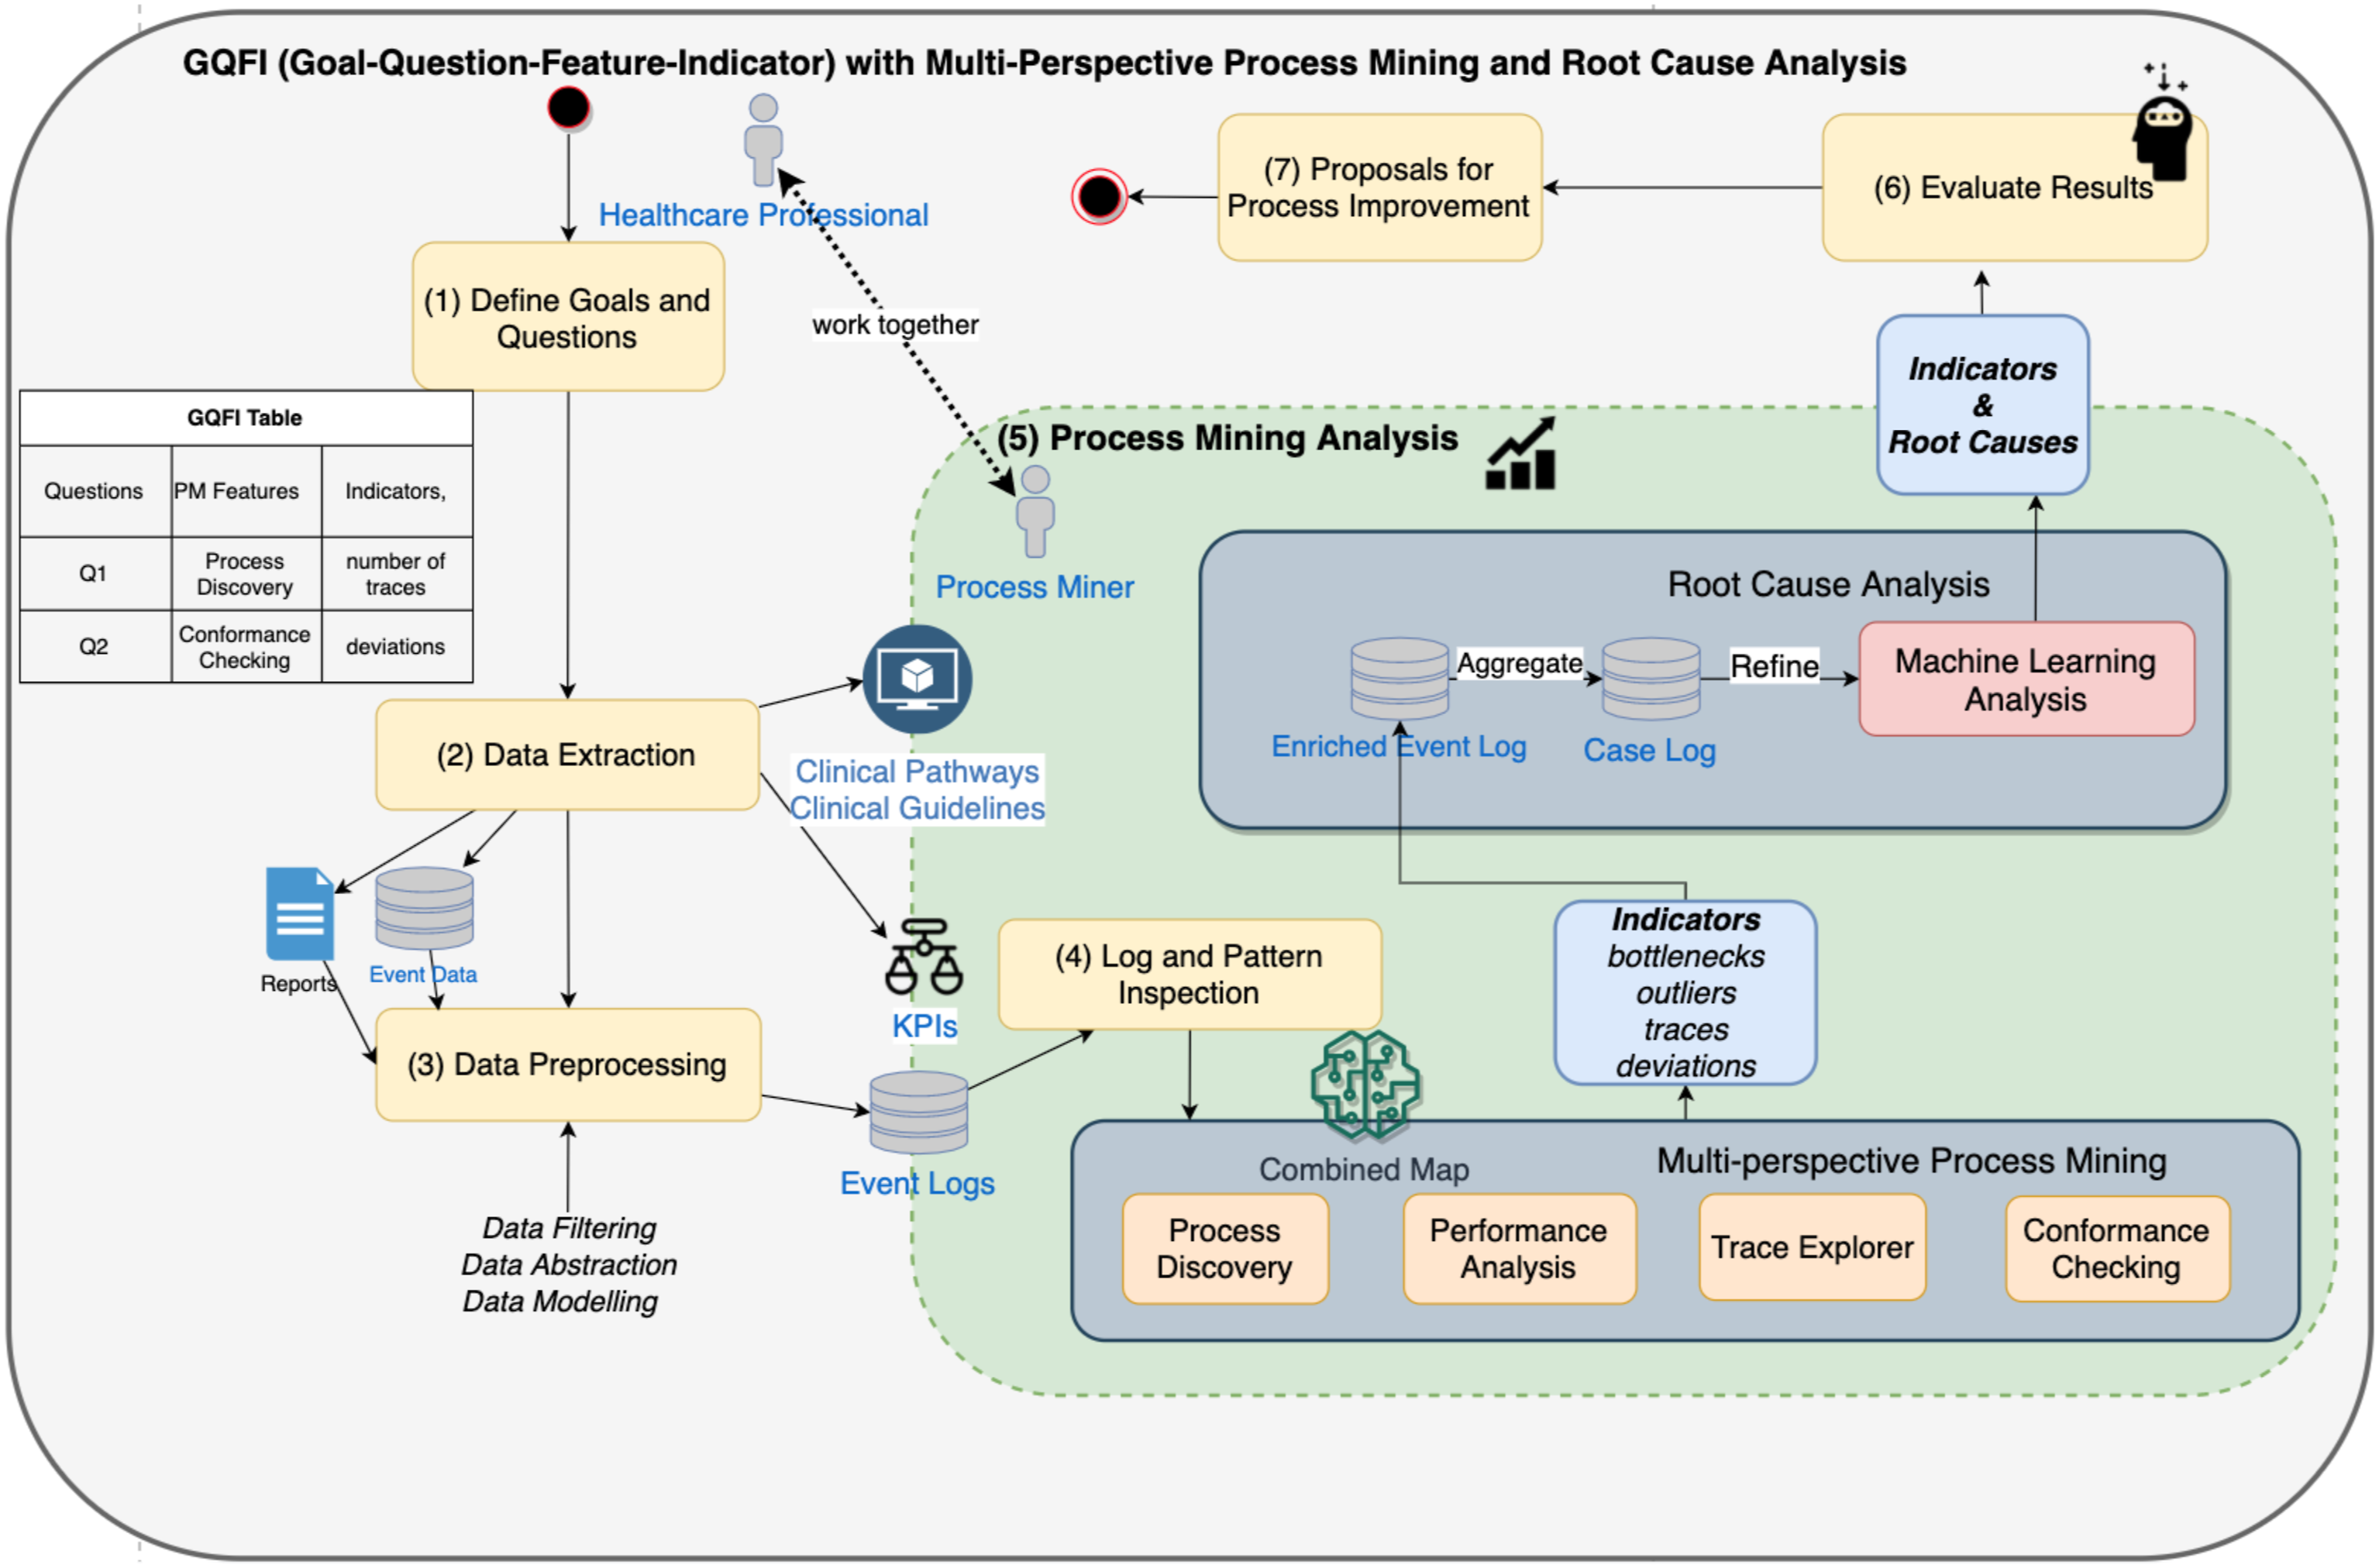
This method can deal with a large amount of healthcare data by distributing process mining activities and obtaining valuable information in seven steps: (1) Define Goals and Questions: The scope and goals of the project and questions to be answered are defined and a GQFI table is created following the guidance of the Goal-Question-Metric (GQM) framework
44
with a hierarchical structure. (2) Data Extraction: The data on cases (patients), activities, and timeframe is extracted from the hospital information system (HIS). (3) Data Preprocessing: Event data is formatted as event logs, and abstracted or filtered as sub-processes, as required for healthcare processes.
19
(4) Log&Pattern Inspection: Event logs are visualized in a log/pattern inspection activity, and a broad overview of the process is obtained in a short time to fully understand the datasets, their limitations, and opportunities. (5) Process Mining Analysis and Root Cause Analysis: After data preprocessing and visualization steps, sets of process mining techniques are used in a distributed way by focusing on specific characteristics of the datasets in terms of questions and indicators. In this study, we extended this stage with using a root cause analysis approach. The outcomes of process mining techniques are used to enrich event logs. These can be multi-perspective outcomes such as bottlenecks, outliers, traces, and deviations. Enriched event logs are aggregated in the case level. Data and resource perspectives are used in the case level in order to refine these logs for machine learning analysis like creating a regression tree. (6) Evaluate Results: The answers of questions and the distributions of indicators are evaluated, and improvement opportunities are gathered. (7) Proposals for Process Improvement: The findings are used to create proposals for process improvement. It should be noted that many process mining techniques and activities are available; however, when dealing with big healthcare data, the executions of process mining activities and the tasks of the proposed method should be distributed. Some tasks can be supported with process mining tools but not all tasks can be performed using a single process mining tool.
Implementation on emergency process
Among healthcare processes, the emergency process has unique features due to the certain steps being undertaken in a shorter time and the end of the process being defined. In the triage system, the state of the patient is assessed and color-coded priorities are assigned. This process ends when the patient is discharged from the emergency room or admitted to the service.
The current study is carried out by following the GQFI method and using multi-perspective process mining techniques. The discovery of the emergency process, trace exploring, and conformance checking are performed using the Disco 27 and R-bupaR 45 tools.
The GQFI method provides a concrete bridge that links the questions to the process mining features and indicators, which is expected to ease process mining applications and lessen the need for advanced process mining skills. When we answer the questions, we have quantitative insights about the emergency process in terms of indicators. Then, we have the opportunity to propose improvements to the emergency process.
Defining goals and questions
In this initial stage, the project’s scope, goals, questions, and indicators related to the goals are defined in order to select the process mining features to be examined. The scope of the analysis is emergency process of a university hospital. The clinical data was extracted from the activities of the emergency department in March 2018 and there has been no change in process protocol since then except the actions are taken in practice as a result of this work. The execution of the emergency process is briefly described below.
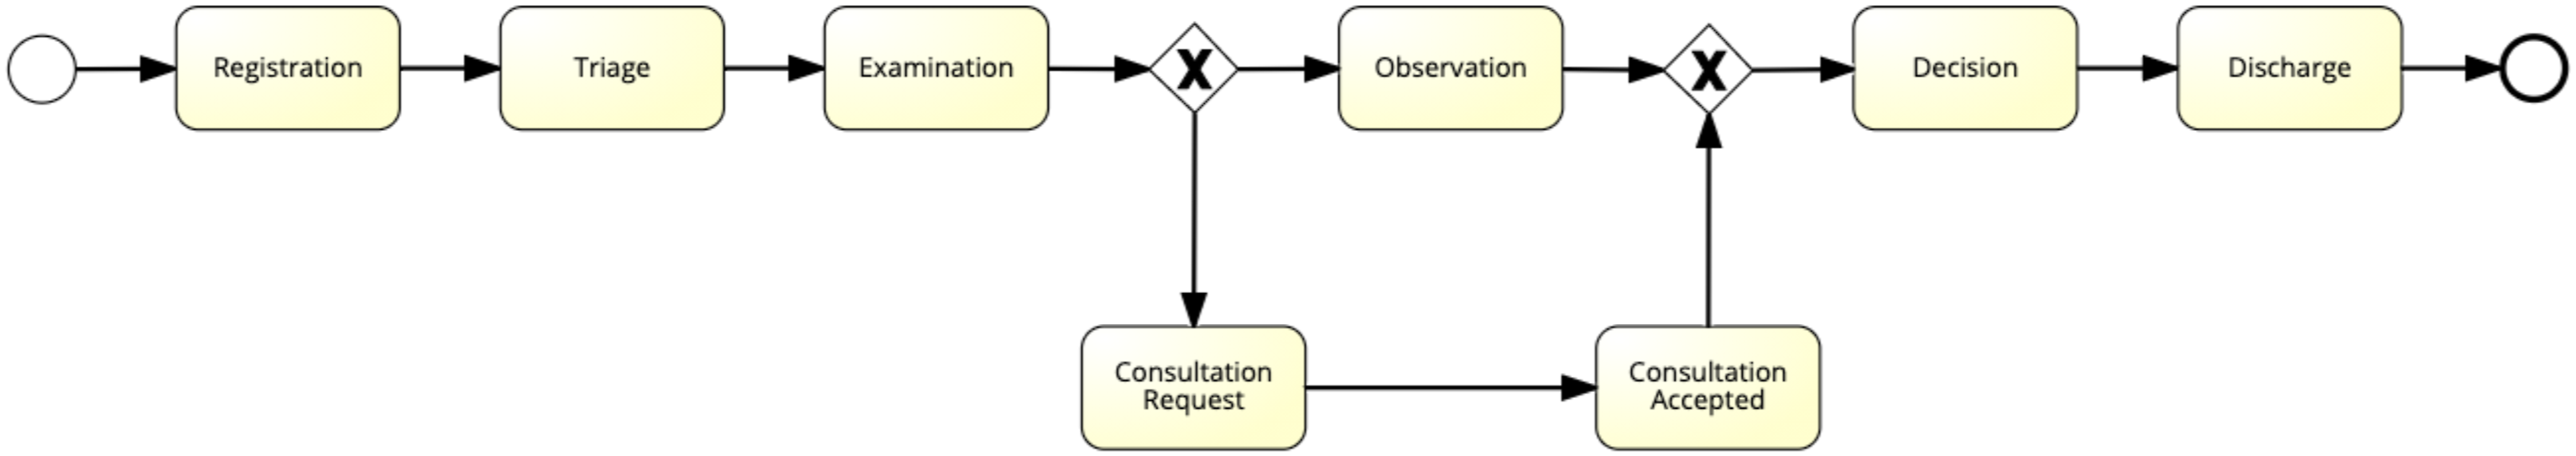
The emergency process starts with the registration of a patient to the emergency department. The high level BPMN process model of the applied emergency process in the university hospital is shown in Figure 2. When the patient arrives at the waiting room, her/his triage score is determined by a nurse according to color coding, in which extremely severe cases are labeled with red, mild injuries with green, and the rest with yellow. Then, the treatment of the patient is considered based on the triage color code. In the triage step, the patient is initially examined by a physician. Depending on the priority level of the triage, the patient waits for laboratory tests in a waiting room or in a ward. In this stage, the physician may want to consult another physician. When the physician obtains the results of the examination, s/he has three possible decisions: If the case is urgent, directing the patient to an appropriate service of the hospital; discharging the patient after giving recommendations or writing a prescription; or admitting the patient to the intensive care unit or the emergency service or referring her/him to another hospital for further care or surgery. High level BPMN model of emergency process.
43
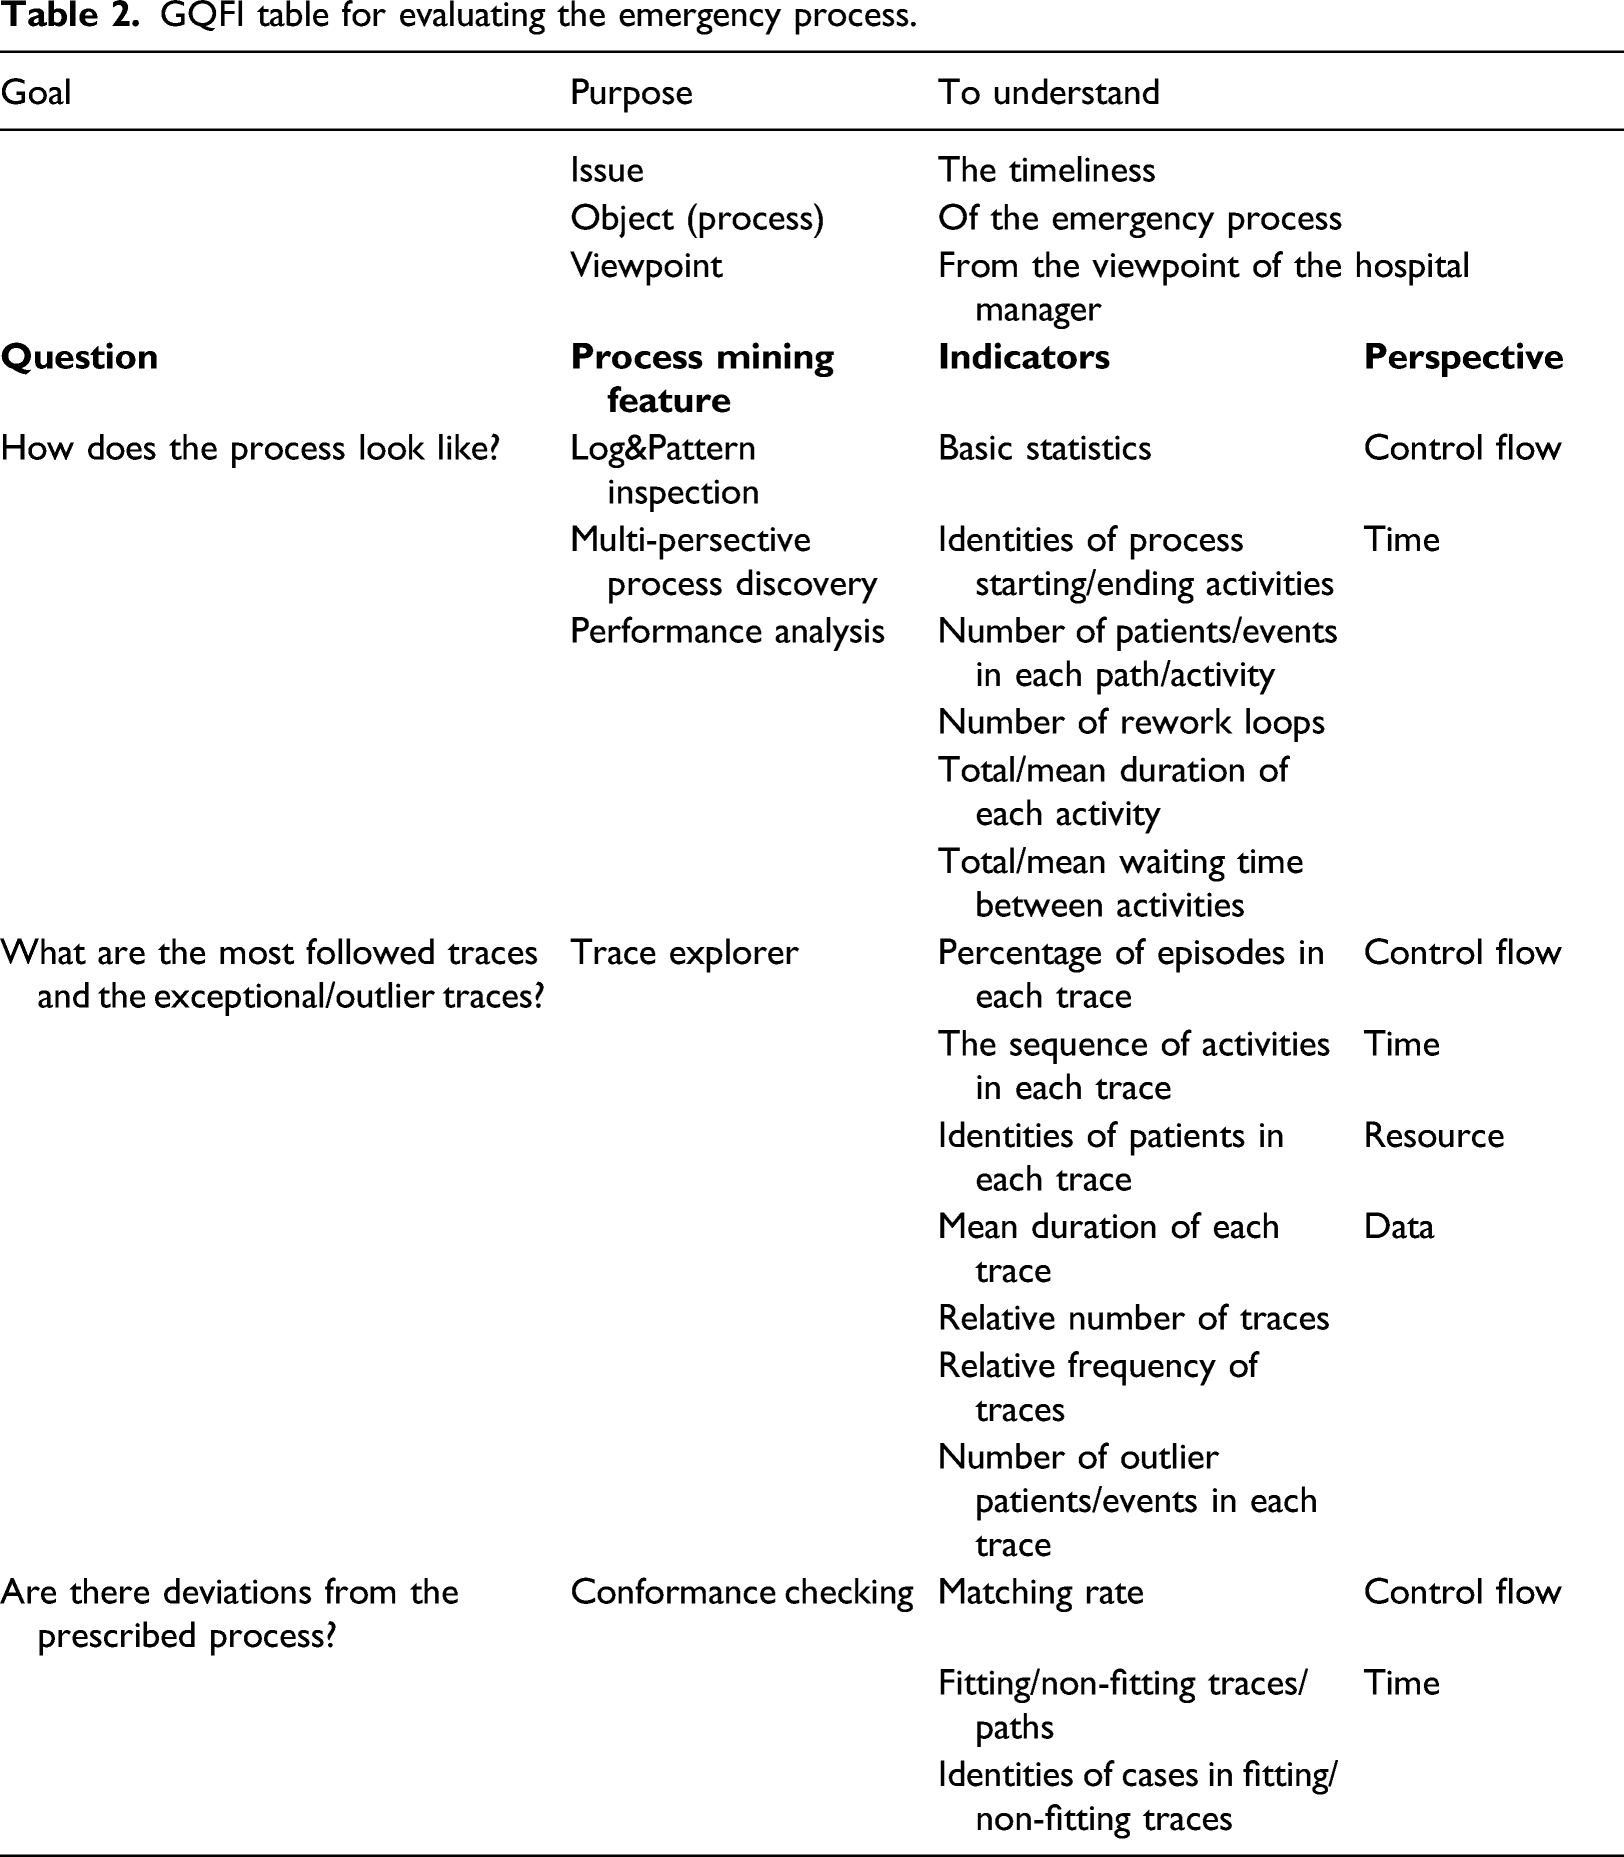
GQFI table for evaluating the emergency process.
Data extraction
After the GQFI table is constructed, the emergency data and other contextual data are obtained. The emergency data consists of event information belonging to 894 patients/cases. The activities related to patient admission, triage, diagnostic and treatment, and other emergency process activities are recorded as event data in the hospital information system. The emergency data is obtained from three different reports included in this system. The first report lists the performance indicators of the emergency process, the second contains consultation information, and the third comprises the list and details of the examinations applied to the patients. These reports are designed according to the object (entity) perspective rather than the process-flow perspective to address all the steps from the beginning to the end of the emergency process.
To perform process mining analysis of the emergency process, at least three types of data features are required: patient/case ID, activity name, and timestamp. In addition, the resource attributes, that is, the examining physician and emergency room, and other data attributes, including demographic characteristics such as age and gender of the patient, triage color code, diagnosis, and decisions, are obtained. Last, the contextual data such as KPIs, 47 process model, 48 clinical guideline, 43 and reports are provided by the quality staff of the hospital.
Data preprocessing
This stage comprises the steps of data formatting, filtering, abstraction, and clustering for each question. The event data needs to be formatted as an event object model 5 to apply process mining techniques. This formatting is performed automatically through the software developed within this study. The object-centered event data in the emergency department reports are merged according to the patient identities and converted to event logs.
Typically, an emergency process consists of the steps of arrival at the emergency room, registration, triage, examination, observation, consultation, and decision-making activities. A patient can perform any of these activities any number of times. A case object is a patient in this process model,5,6 and an event object relates to each activity undertaken for each patient.
Example of an event log.

Log and pattern inspection
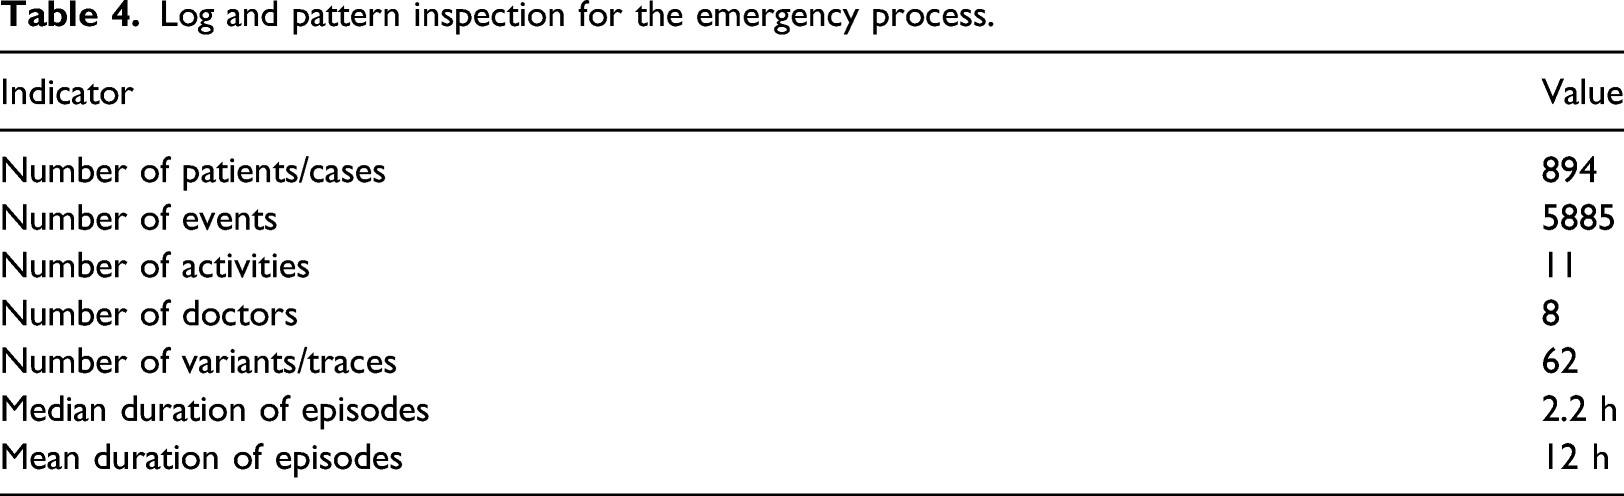
Log and pattern inspection for the emergency process.
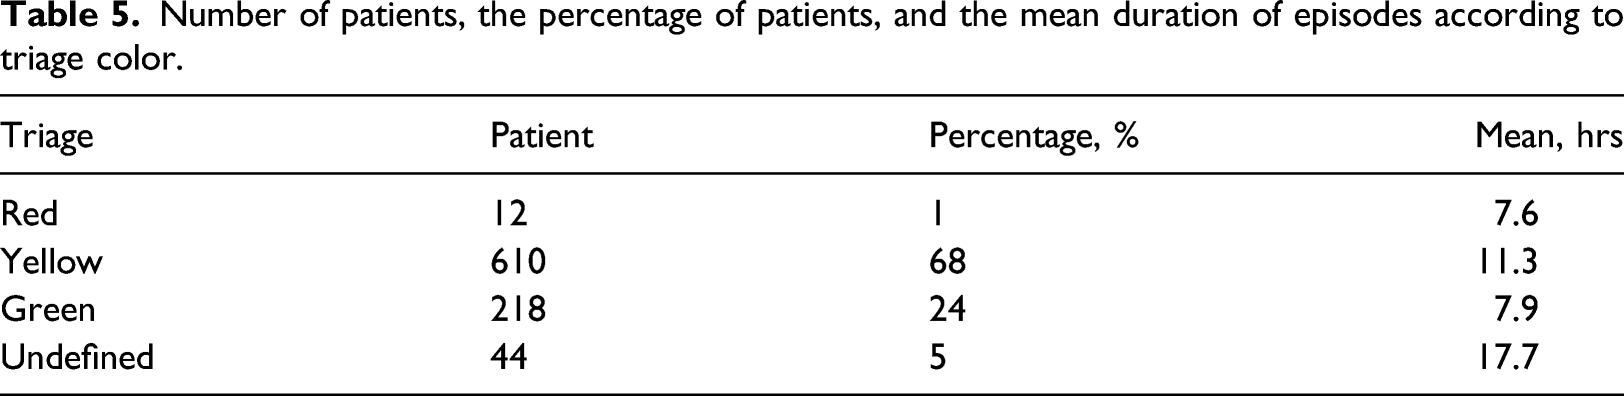
Number of patients, the percentage of patients, and the mean duration of episodes according to triage color.
Generating answers to the predefined questions
After data preprocessing and visualization steps, sets of process mining techniques are used in a distributed way by focusing on specific characteristics of the datasets in terms of questions and indicators.
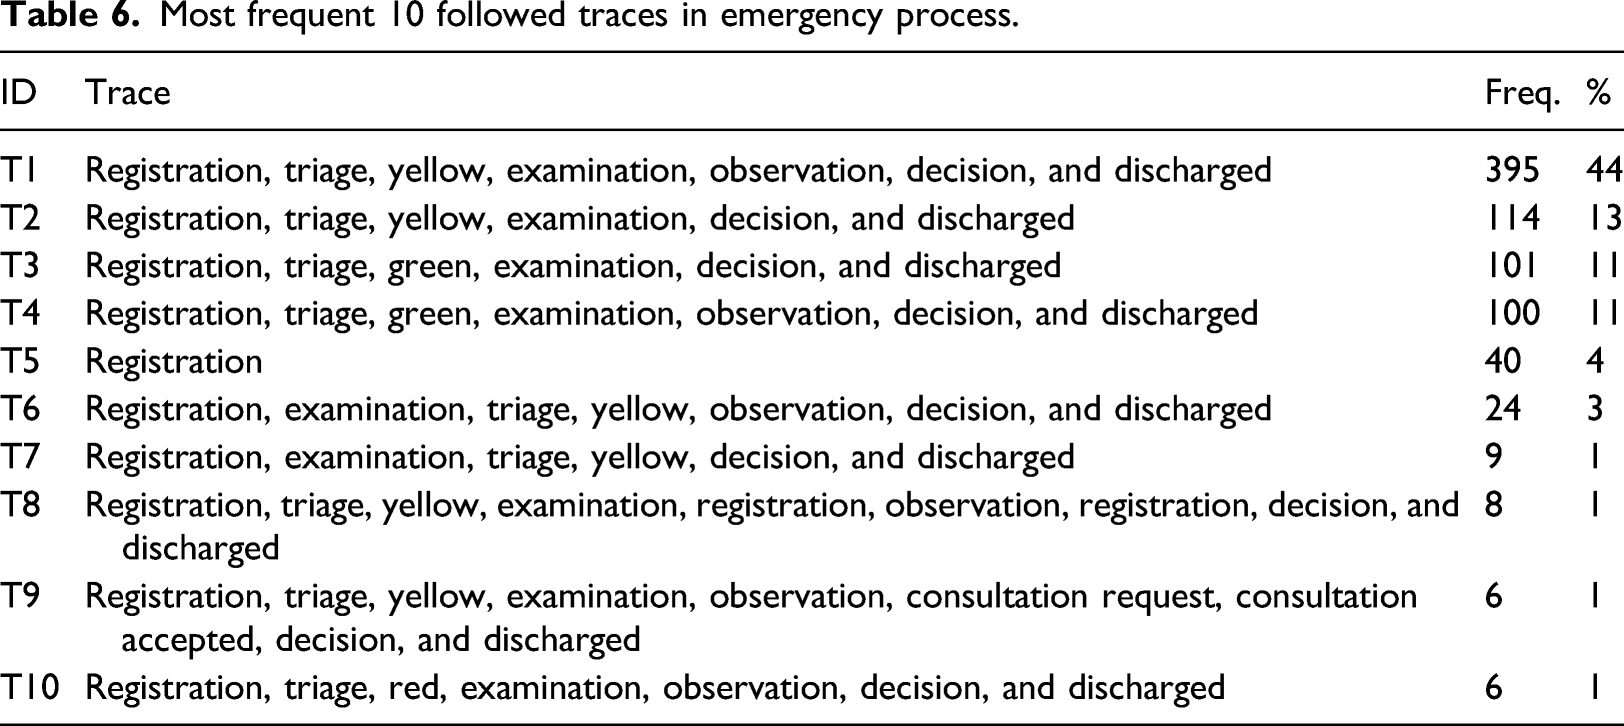
Q1. How does the process look like? The operational scenario is designed to answer this question shows the general characteristics of the emergency process based on the process map, statistics, performance, and patterns. It includes two process mining features. The first is log and pattern inspection, for which the detailed statistics of the process are obtained using Disco. There are 894 patients and 5885 events categorized under 11 main activities; thus, the dataset is relatively small. The timeframe of the data is approximately 2 months. The mean duration of episodes is 12 h (7.6 h for the red color code, 11.3 h for yellow, and 7.9 h for green). For some cases, however, the process lasts up to 46 days which are considered as outliers. The greatest relative frequency values belong to the 19–25 age range (16%), female gender (56%), and yellow triage status (68%).
The second process mining feature is multi-perspective process discovery. For this purpose, a combined process map of the emergency process is created to demonstrate how the process looks like (Figure 3). We prefer to use outputs of Disco
27
in order to get information about frequencies and performance because the usage of it is very simple and takes very little time. Figure 3 shows the actual emergency process and presents what happens in the emergency department. The patients mainly follow a sequential path beginning with registration in the emergency room, determination of the triage status as yellow, examination, and leaving the emergency room after decision and discharge activities. This sequence can be considered as main process and reflects the expected process model (as shown in Figure 2) and, therefore, can be used for conformance checking. We provide detailed information about the process in the following paragraph. Combined process map of the emergency process with time performance and frequencies.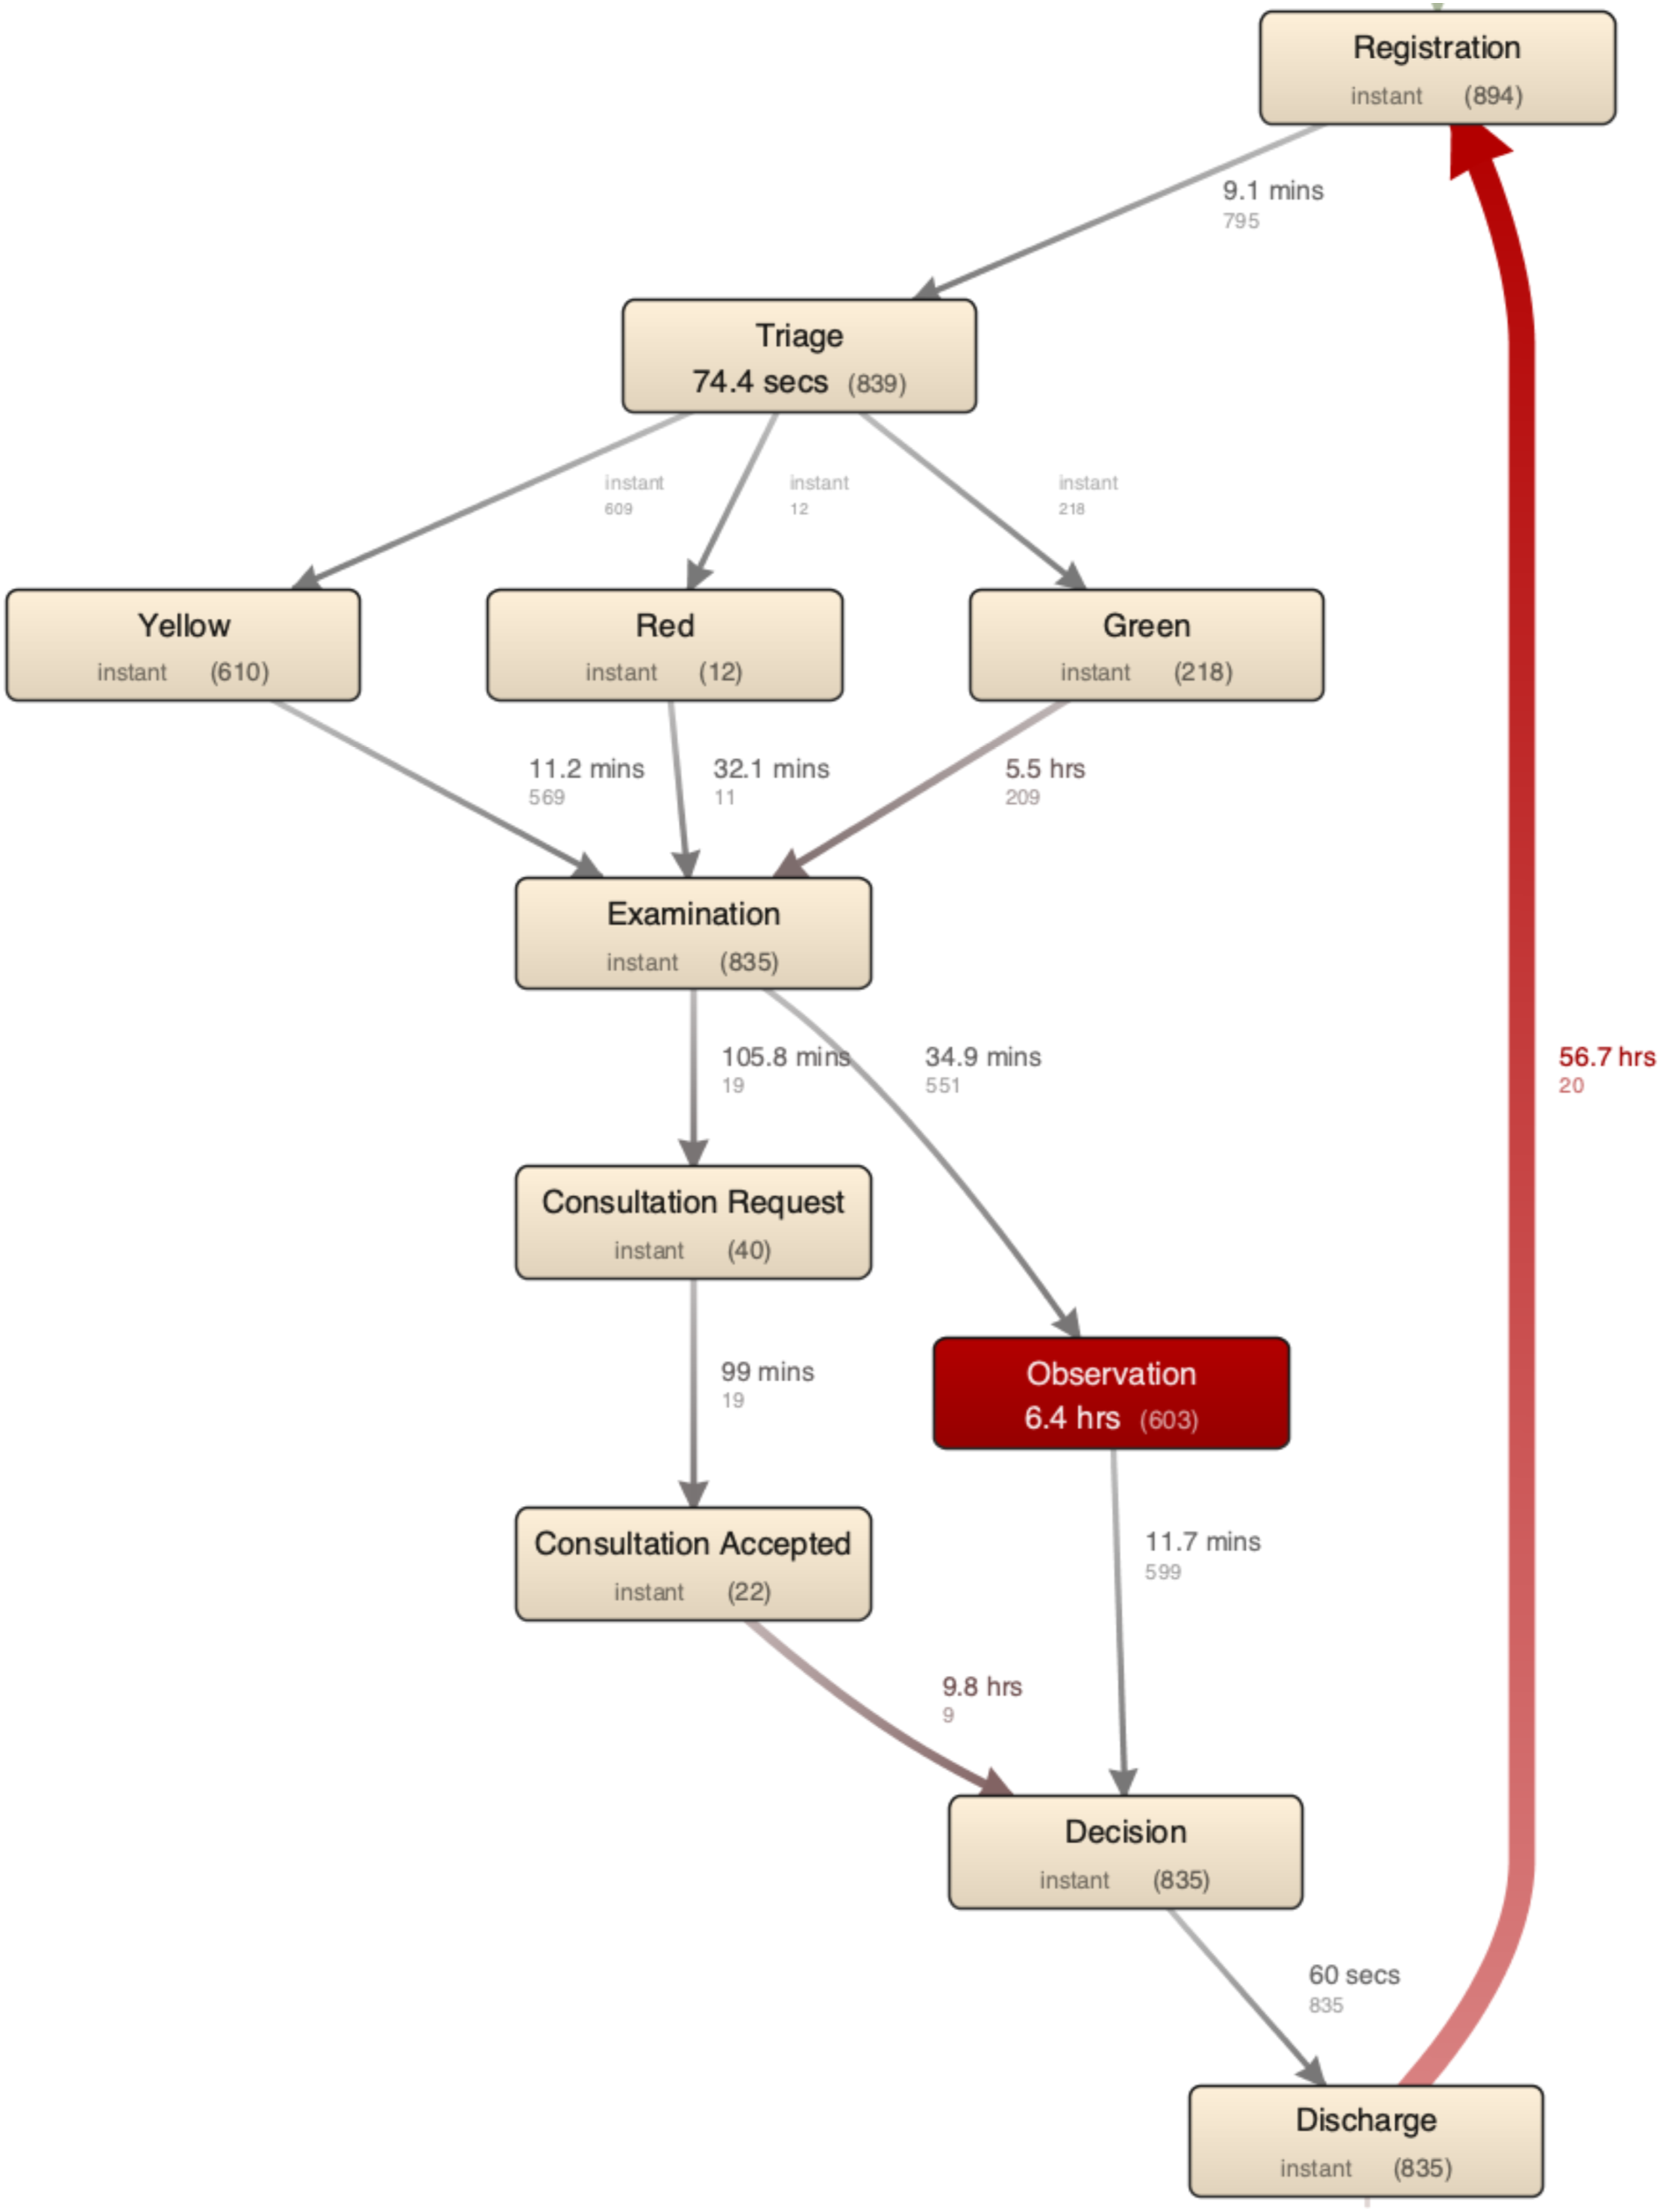
All the episodes start either with “registration,” the first step of the process, or directly with “examination,” “observation,” or “consultation request.” After registration, the most of episodes move to the “triage” step where it is split into three alternative paths: “triage,” followed by “yellow triage code” in 610 patients. There is no dominant rework loop around the activities; only 21 patients are registered in the emergency service after having been discharged and then spend an average of 56 h. This loop is the nature of the process. The majority of these patients (80%, n = 21) are registered again with the same diagnoses and this is considered as the same episode. The transition from the triage step to the examination step (32 min) lasts longer than expected for the patients with a red color code. The mean duration of consultation is 99 min. The ending activities are “registration (in another service or hospital),” “examination,” “discharge,” “observation,” and “consultation.” The expected ending activities should be “discharge.”
Most frequent 10 followed traces in emergency process.
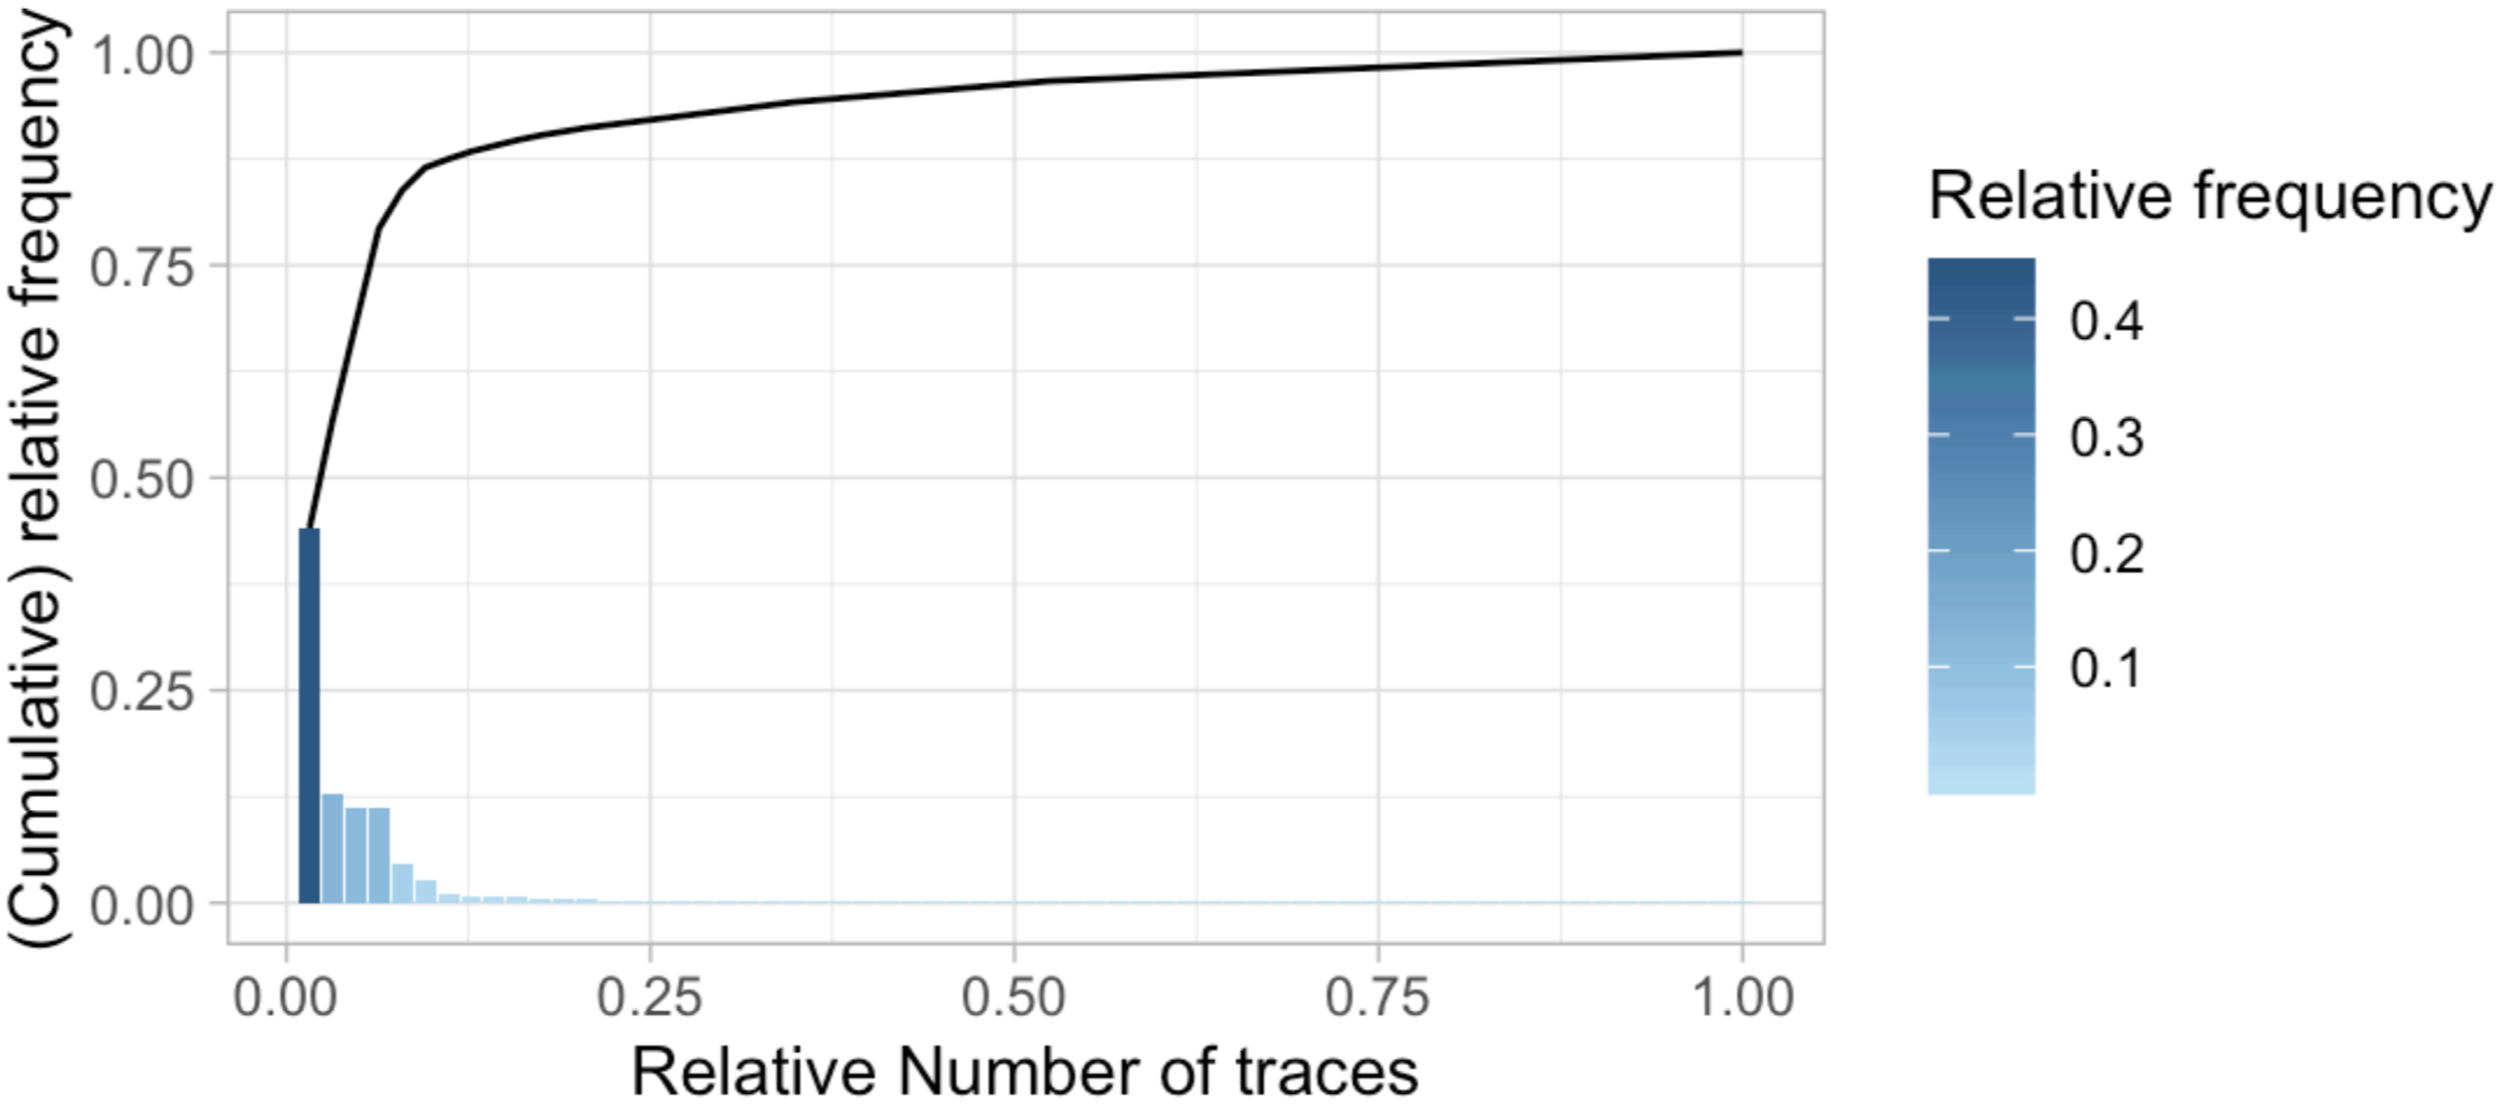
Traces ordered by relative trace frequency.
Decision tree based on throughput time (in hours) of the patients.
Most non-fitting process traces of emergency process.
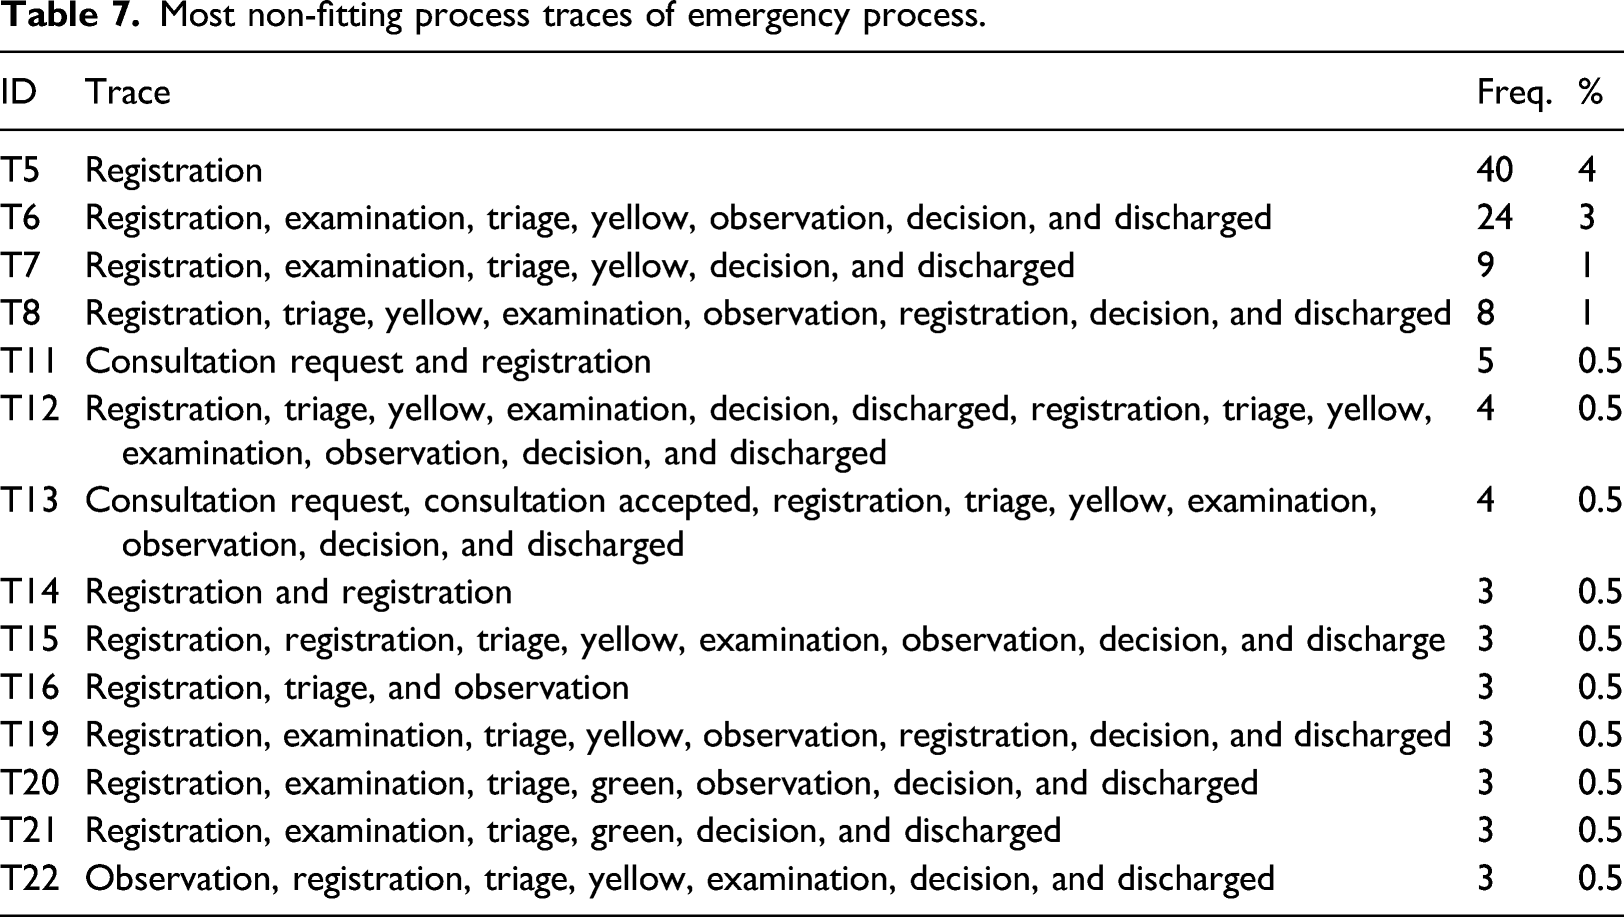
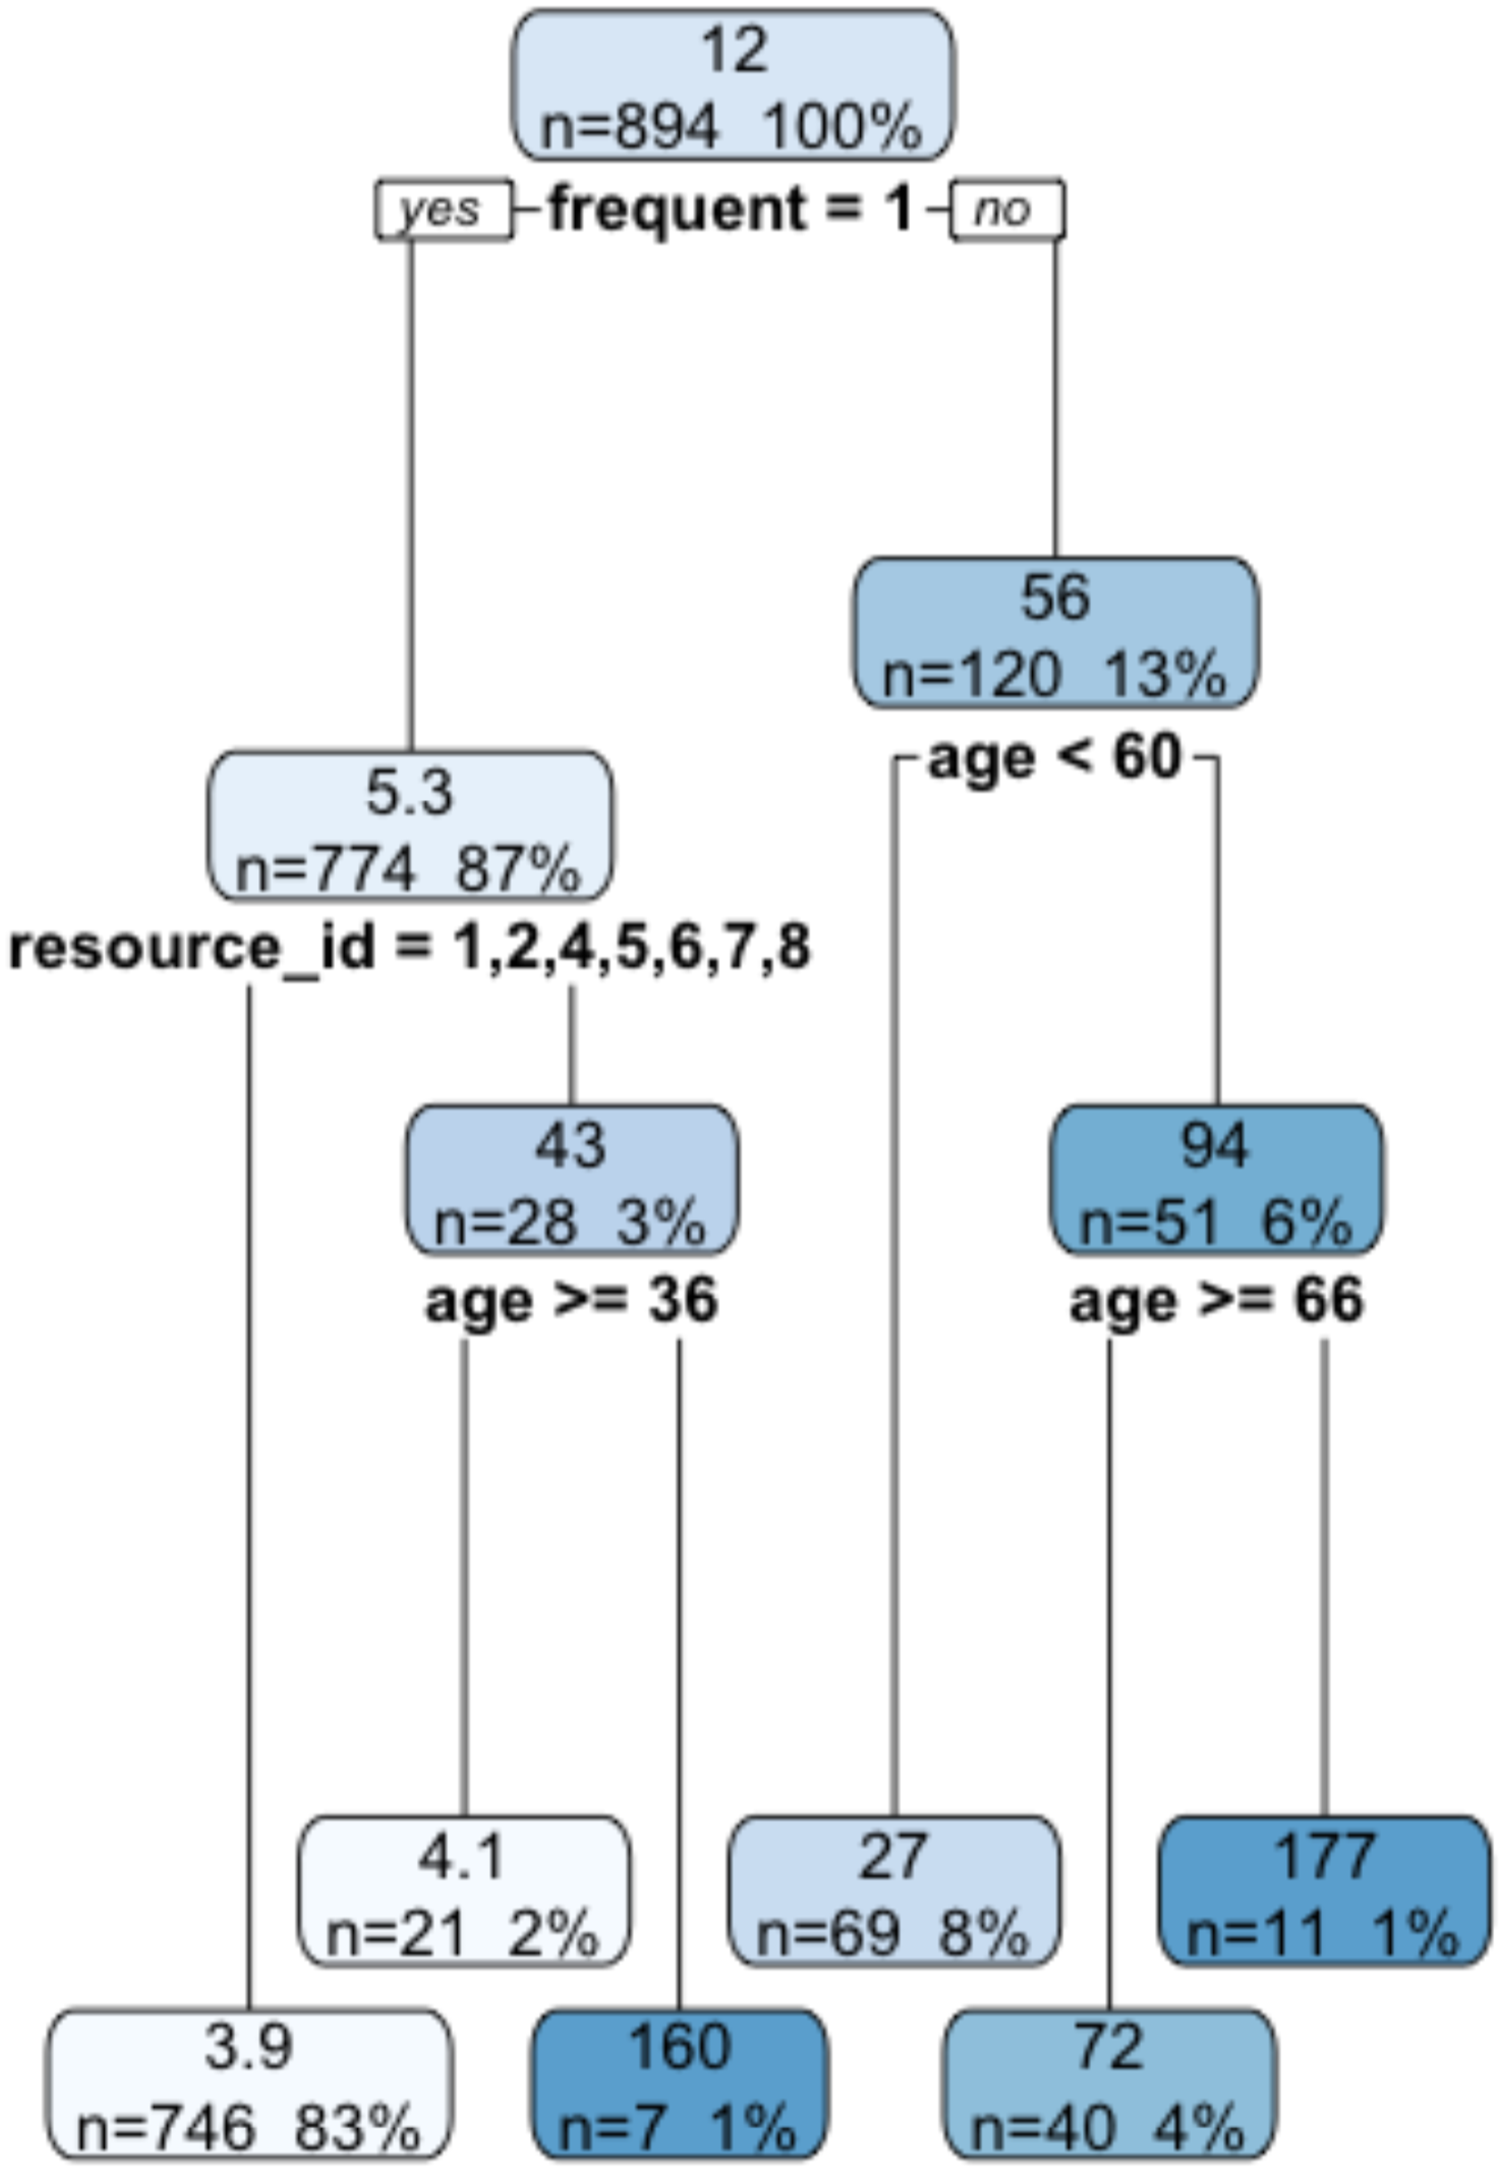
Traces T5 and T11 belong to 45 patients who only enter into the emergency department. In the traces of T6, T7, T19, T20, and T21 (n = 42), the patients are examined after the triage while the patients should have been examined before the triage. In T13, the examination is performed during the observation step. Considering the non-compliant traces, the matching rate between the observed process behavior and the modeled behavior is calculated as 85%. The emergency log is enriched with a new attribute named “deviation” which is “TRUE” if the case follows the non-fitting trace. A decision tree model is developed based on enriched data to understand the characteristics of these deviations. Figure 6 shows that deviations are either have the highest throughput time or the lowest throughput time. This leads to the inefficient use of emergency services’ resources and does not comply with the modeled behavior of the process. Decision tree based on deviations (dark blue leaves are the deviations).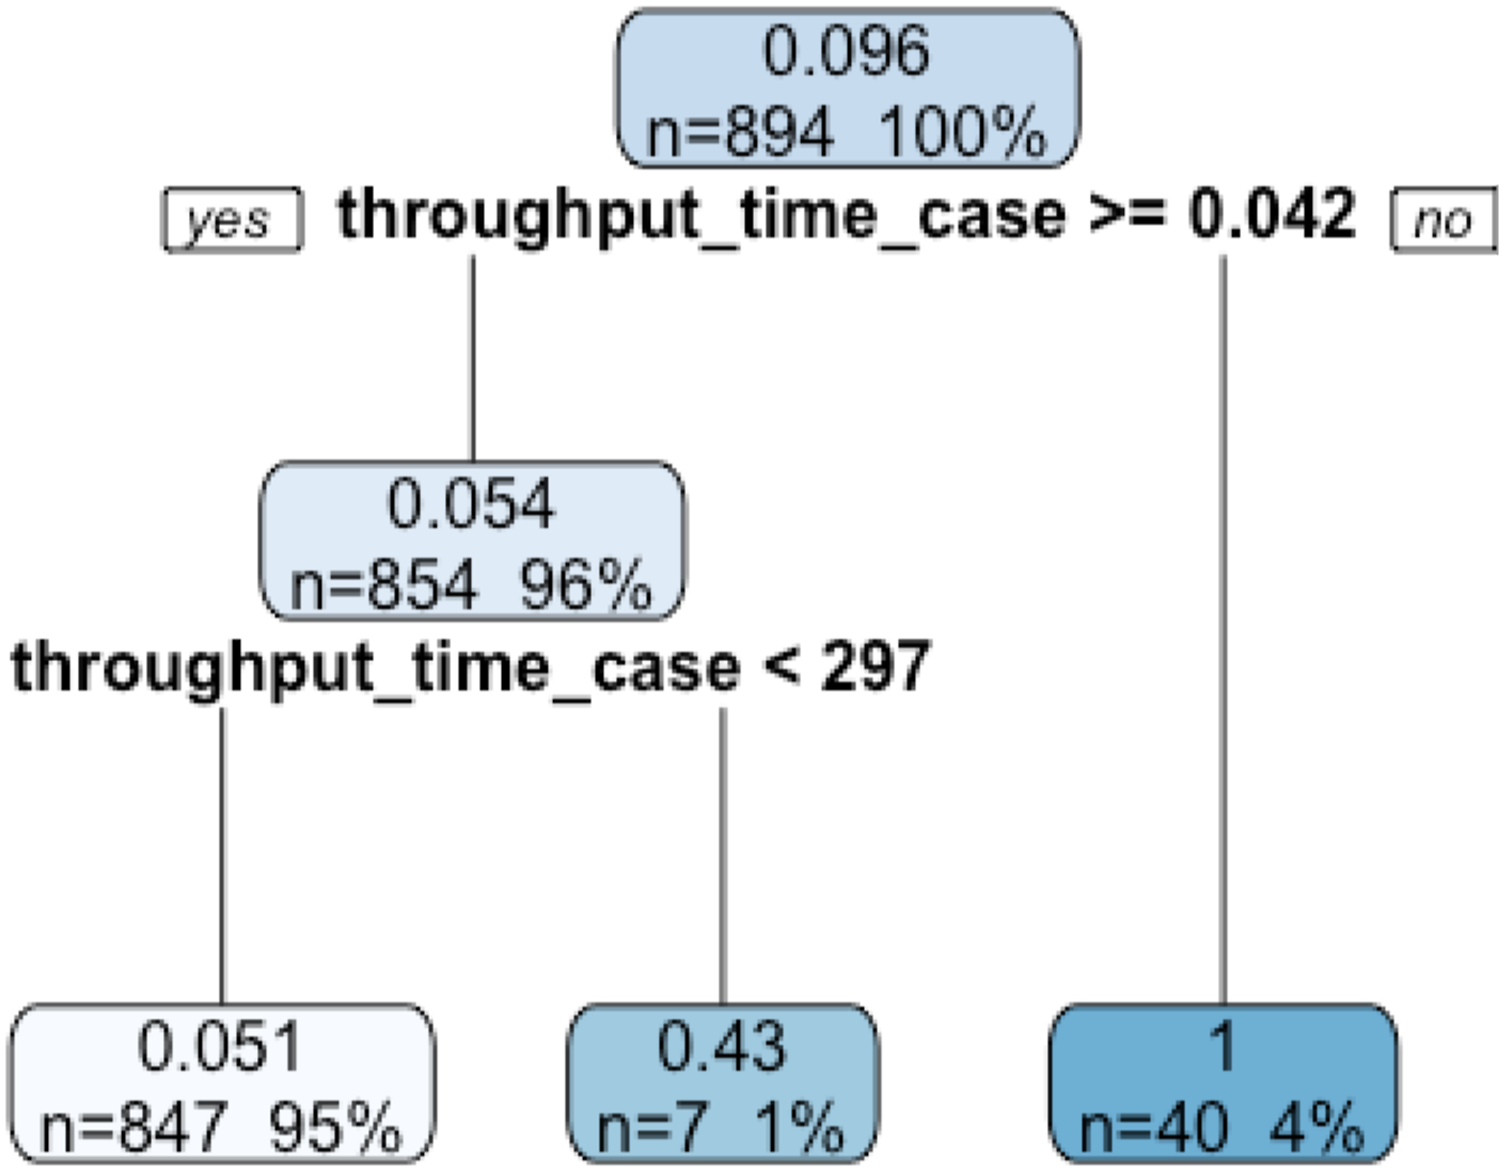
Evaluation of the results
The performance indicators of the emergency process and the quantitative results are summarized below in relation to the predefined questions. 1. How does the process look like?: The information about the frequencies and performance indicates the existence of performance problems related to this process, more specifically the resulting outliers and deviations. Bottlenecks are detected at two different points. The first concerns the waiting time for the patients with a red color code, which is calculated as 32 min from the ending of triage to the end of the examination step. Considering that all the medical orders are requested in very urgent cases, it can be said that the activities that are made to speed up the process cause wrong data entry. The second bottleneck is related to consultation taking 99 min. These values are above the expected value (30 min). 2. What are the most followed and exceptional paths? The emergency process has 62 different process traces. The most followed path covers 44% of all process traces, and 29 infrequent traces are observed. Infrequent traces and older patients have a higher throughput time on average. 3. Are there deviations from the prescribed process?: It is observed that 4% of the patients are examined before the triage step, 5% are admitted to the emergency room and the only consultation is requested or another activity is performed for these. The analysis shows that deviations have the highest throughput time or the lowest throughput time.
Proposals for process improvement
After our discussions with the emergency physicians for each performance indicator, we propose the following improvement suggestions for the emergency process. 1. In relation to the first question, there are time efficiency problems in the emergency department. The first suggestion is about a call system application that should be effectively used to eliminate the bottleneck related to the waiting period in emergency consultations. In this way, the physician could terminate the call by pressing a button in a practical way. In the existing case, even though the consulted physician arrives at the hospital, the knowledge of the answered consultation request cannot be notified. In addition, the waiting time between triage and examination is measured as 31 min for the patients with a red color code. A suggestion for the elimination of this bottleneck is performing examinations at the same time as requesting medical orders. Another suggestion is to perform defensive medicine in a harmless manner
51
and better determine offensive medicine practices. This could reduce both the use of emergency process resources and the patient waiting time. 2. In the second question, a suggestion for infrequent traces is made for the classification of emergency services as gynecology emergency, orthopedics emergency, etc., which is expected to decrease the waiting time to consultation. The second way can be to increase the triage scale to five colors and to ensure that it is applied to all patients presenting to the emergency service. After this suggestion, the hospital authorities started to use The Australasian Triage Scale
52
together with the existing triage scale. 3. In response to the third question, some important deviations are identified in the emergency process, for example, skipping the triage and consultation request steps. To prevent these deviations, adding some controls in the hospital information system is suggested for the system to direct the emergency staff. As a result of this suggestion, a control was added to the system by the hospital authorities in order to guarantee to enter the triage step. The analysis led to a solid control in the system and prevented the happening of the previous problem; therefore, it is expected to increase the efficiency of the emergency process in the hospital.
Discussion and conclusion
Process mining is a set of developing techniques applied for business process management in the field of healthcare and the rapidly growing area is open to further research and practice.
The emergency process consists of seven main activities: registration, triage, examination, observation, consultation, decision, and discharge. In the case explored, the number of presentations to the emergency department and increasing expenditure related to these services appear to pose a great problem. The situation of most patients that presented to the emergency department is urgent, and ideally all should be discharged within 12 h. The determination of the patients’ emergency in the triage step is important for the effective use of emergency services and for the timely intervention to these patients.
In this study, a goal-driven approach is taken through operational scenarios to answer frequent questions for the emergency process in order to understand the timeliness of this process. Extended GQFI table with perspectives provides a business understanding in terms of goal, questions, and indicators, and bridged the questions to the indicators via multi-perspective process mining features. It covers further process mining analysis to mine the other process perspectives, such as time, data, resources, and conformance by enriching event logs over the initial process model. When process mining is extended far beyond discovering the control-flow models; roles, bottlenecks, deviations, amounts of time passed, and routing probabilities in the process can be identified. Such extensions can be helpful to make the process mining results more understandable. Also, indicators of process mining features allow an in depth analysis by dealing with data quality issues of healthcare data. As a result, iteratively defining goals and questions to collect the proposals of process improvements are the opportunities of this study. On the other hand, selecting process mining techniques and using process mining tools in the distributed manner can be considered the threats of the study. Nevertheless, based on two feedbacks from healthcare professionals, it is concluded that strengths and opportunities of the study are more significant than its weaknesses and threats.
As the future work, we plan to conduct further studies in various specialties and also to develop a multi-perspective process mining approach that creates a holistic process model. It will discover healthcare processes from many perspectives such as control-flow, resource, data, function, conformance, and time and represent all of them in a single process model. In addition, we will define a structured process, which will help to summarize analysis results for proposing improvements.
Footnotes
Acknowledgements
This study received ethics approval from Hacettepe University (approval number GO 18/73, Date: 16 January 2018). The authors thank Seval Akgun, a full professor of public health and medicine, Sebnem Yucel, M.D., an associate professor of medical oncology, Murat Dogan Iscanli, M.D., an assistant professor of emergency medicine for their suggestions.
Declaration of conflicting interests
The author(s) declared no potential conflicts of interest with respect to the research, authorship, and/or publication of this article.
Funding
The author(s) received no financial support for the research, authorship, and/or publication of this article.