
Abstract
Quality data for evidence-based decision making become a growing concern globally. Available information needs to be disseminated on time and used for decision making. Therefore, an effective Health Management Information System is essential to make evidence-based decision. This study aimed to measure the change in data quality and information utilization before and after intervention. Facility-based pre-post interventional study design was conducted at Metema hospital from September/2016 to December30/2018. A total of 384 individual medical-records, HMIS registration-books and reports were reviewed. Training, supportive supervision and feedback were intervention packages. About 309 (80.5%) of charts were from outpatient department. Data recording completeness increased from 69.0% to 96.0%, data consistency increased from 84.0% to 99.5% and report timeliness enhanced from 66.0% to 100%. There was a statistically significant difference for data recording completeness between pre and post-intervention results with mean difference of −0.246 (−0.412, −0.081). Also, after the intervention, gap-filling feedback and supportive supervision were given to all departments. In addition, four quality improvement projects were developed at post-intervention phase. The level of data quality and use was improved after the intervention. So, designing and implementing intervention strategies based on the root causes will help to improve data quality and use.
Introduction
Producing quality data supports informed decision making.1–4 However, data is often inaccurate, untimely, incomplete, and inconsistent as a result data are not used effectively for decision-making in developing countries.5–8 In Ethiopia, data quality and utilization of health information remain low, particularly at primary health care facilities and district levels.9–17
Ethiopia’s federal ministry of health launched the Health Management Information System (HMIS) reform.18,19 Accordingly, the national classification of disease (NCoD) was developed as part of the HMIS reform to organize health information. The NCoD was harmonized with different international standards: Integrated Disease Surveillance and Response (IDSR) protocols (using disease names in IDSR list), ICD-10 codes, and Global Burden of Disease (GBD) classification. 20 The NCoD is the national standard system of defining, monitoring, and reporting health conditions and their outcomes. The HMIS is supported with both electronic and paper-based HMIS recording and reporting systems. The paper-based HMIS is intended to capture some patient level and case-based information.
In contrast, the electronic version is intended to register patients at the medical record unit and antiretroviral treatment clinic for patient file tracking and monitoring purposes. The registration books are used to capture a summary of patient-level data. On the other hand, logbooks are used to monitor selected indicators. The reportable data elements vary according to the level of care. It consists of 120 reportable data elements in the case of primary hospitals.
In Ethiopia, several developments in healthcare, such as progress in information technology and increasing demands for accountability, have led to an increase in the number of medical registries over recent years. In practice, however, quite frequently, incorrect patient’s data are registered or data items can be inaccurately recorded or not recorded at all.
To optimize the quality of medical registry data, participatory centers should follow specific procedures designed to minimize inaccurate and incomplete data. 21
Feedback to the providers of the health data is an essential component of any reporting system. Regular supportive supervision and feedback provision were the strategies to ensure data quality and information used for decision making. However, its implementation is irregular and based on inconsistent guidelines.
Metema Primary Hospital has implemented HMIS since 2011. The hospital has implemented an electronic medical record/SmartCare/system at the card room and antiretroviral therapy unit. The hospital has a separately established monitoring and evaluation unit led by master degree holders and other three health information technicians with necessary materials and locally available internet service. The monitoring and evaluation department is responsible for hospital planning, monitoring data quality, and information use, conducting supportive supervision and feedback provision monthly, developing different policies and procedures with other departments and committees, reporting and analyzing hospitals performance. However, there were many problems in implementations while many efforts were made to improve data quality. There was a problem in data completeness, timeliness, consistency, and use of information for informed decision making and performance improvement.
The information revolution is one of the health sector transformation plan agendas to strengthen evidence-based decision-making at all health organizations. However, at Metema Primary Hospital, health care providers and managers at different positions have low attention for data management and evidence-based decision making. Due to this, there was the poor practice of registering, tally, timely reporting, and sense of ownership for the hospital HMIS implementation, which leads to under and or over-reporting of activities that significantly impact national HMIS data quality as for inappropriate decision making.
Constructive and gap-filling feedback and supportive supervision were not given regularly. Overall, the poor practice of using locally generated data for the decision-making process at Metema Primary Hospital at the department and hospital level.
Only few of health professionals and card room workers were trained on HMIS. Although a performance monitoring team evaluated reports monthly, the team did not meet timely and did not evaluate the leading performance indicators against the expected plan. Lot Quality Assurance for selected data elements and was done solely by a single health information technician who was not recommended by the standard. Action plans were not developed at all the time for identified gaps.
In the HMIS unit, the monitoring and evaluation practices were unacceptable from data quality assurance, supportive supervision, gap-filling feedback, and information use perspective. Performance monitoring meetings were not conducted regularly for each reporting unit, and refresher training was not given for existing and new staff.
This study was conducted to improve data completeness, consistency, report timeliness, and information utilization by identifying root causes and implementing intervention strategies that were important for data collection, processing, analysis and interpretation, and evidence-based decision making. After implementing the selected strategies, the hospital data quality, evidence-based decision-making will be improved, service quality, utilization, patient and staff satisfaction, and resource mobilization will be improved. Thus, the study was conducted to assess the change in data quality and information use status before and after the intervention.
Methods
Study design and setting
A facility-based pre-post interventional study design was employed from September 30/2016, to December 30/2018. The study was conducted at Metema Primary Hospital, which is located in the West Gondar zone, Amhara region, Northwest Ethiopia. It is 37 km far from Sudan, located in the Ethio-Sudan border. The hospital serves a total population of 320,000 and migrant workers who works in investment activities. In addition, the hospital provides preventive, curative, and rehabilitative services.
Leishmaniasis and multidrug resistance tuberculosis diagnosis and treatment, neonatal intensive care unit/NICU/are special services delivered by the hospital.
The hospital had 54 beds, 12 general practitioners, 14 midwives, 81 nurses of all types, 3 emergency surgery and obstetric officers, 3 radiographers, 11 laboratory technicians, 1 biomedical technician, 3 health information technicians with a total staff of 215 human resources including supportive and other health professionals.
There is an HMIS platform to enter and analyze reportable data elements/indicators. Six departments or case teams are expected to submit service delivery, mortality, and morbidity monthly and quarterly reports to the hospital monitoring and evaluation department.
Nature of the intervention
On September 30, 2016, a multi-disciplinary team was organized to address the data quality and information use problem. The hospital medical director, case managers of the surgical department, admission ward, operation theater, outpatient department, emergency, and Matron, the heads of M and M&E, pharmacy, laboratory service, and finance and human resource coordinator were the team members. A strategic problem-solving approach was applied for action-oriented learning. 22 Defining the problem, setting an objective, conducting a root cause analysis, generating alternative strategies, comparing strategies, selecting a strategy, implementing the strategy, and evaluating its impact on the problem were the eight steps of the strategic problem analysis and solving approach.
The team defined the problem as poor data quality and information use and set an objective to increase data consistency from 84% to 95%, data recording completeness from 69% to 90% and report timeliness from 66% to 100% within 8 months after implementation. The team spent 6 months conducting a root cause analysis, generating solutions and implementing the selected strategy. Staff related factors, policy/procedure-related factors, environment-related factors and HMIS related materials were analyzed in the root cause analysis. Based on the root causes identified, the team identified the best strategy for intervention. The interventions were discussed with M&E staff, physicians, nurses, and other supporting staff and revised multiple times based on feedback. The team set objectives and developed measures to determine whether a change leads to an improvement, then tests a change in the actual work setting. Finally, the team applied the plan, do, study and act (PDSA) cycle, 23 focuses on planning, trying, observing the results, and acting on what is learned.
Supportive supervision was conducted regularly to departments by monitoring and evaluating units, and feedback was given to all departments every month. In addition, during intervention time, a report timeliness monitoring logbook was developed at the facility level to monitor department and Hospital report timeliness.
Staff training
In response to the identified root cause analysis finding, HMIS training that focused on introduction to data quality, data quality assurance techniques, data recording and reporting procedures and information use was given for 92 health professionals and 9 card room workers from January 5 to 7, 2017 (for 3 days). Additionally, the same training was given for eight new health professionals from May 2 to 3, 2017. The training contents were derived from the national HMIS reform training manual. The training was delivered by HMIS experts from the study hospital. Refreshment training was also repeated two times after 2 months for 2 days to ensure sustainability and adherence.
Study data
Outpatient, inpatient, maternal and child health and emergency and accident department clients’ medical record, Registers and HMIS monthly reports from September 30/2016 to December 30/2016 for pre-intervention and from September 30/2018 to December 30/2018 for post-intervention were included in the study.
Sample size determination
In this study, three sample sizes were determined (for data recording completeness, report timeliness, and data consistency). Thus, the sample size for data recording completeness was calculated by using a single population proportion formula: n = z2 (1 − p)/d2, where n = the required sample size, Z = standardized normal distribution value at the 95% CI, which is 1.96 p = 50% (proportion for data recording completeness) d = the margin of error, taken as 5%, substituting the value, in the formula, =1.96 2 × (0.5) (0.5) 0.052 = 384.
Thus, a total of 384 patient charts were used to check data recording completeness both at pre-and post-intervention phases. Whereas, to measure report timeliness and data consistency, purposely 3 months HMIS reports and registers were used at pre and post-intervention phases. Additional data were collected from hospitals HMIS registration books and reports for only September 30–December 2016 and September 30–December 30/2018 reporting period.
Variables and measurements
Data collection tools and procedure
Before data collection, patient medical record number was used to identify charts from central register to select the sample. Data collectors reviewed and extracted data from patient charts by using a data compilation checklist to check the completeness of the data recording tool. Hospital reports and registration books were utilized for additional data collection for consistency, report timeliness, and information utilization. Data were collected by two health professionals who work outside the hospital under the supervision of the supervisor. A 1 day training was given for data collectors and supervisors on the objective of the study and how to review the documents as per the data extraction compilation checklist. Pretest was conducted on 19 client’s files, registers, and reports at Ayikel Primary Hospital to check the validity of the data compilation checklist before the actual data collection.
Data processing and analysis
The collected data were entered to EPI info version 7 and exported to SPSS version 20 for further analysis. An independent t-test was used to compare the difference between pre-and post-intervention, 95% confidence interval, and p-value was used to know the statistical significance.
Results
A total of 384 patient charts were reviewed. About 309 (80.5%) of charts were from the outpatient department, 46 (12%) from emergency, 31 (8.1%) from the emergency department, 19 (5.0%) from maternal and child health, and 10 (2.5%) charts were from inpatient department.
Data record tools completeness
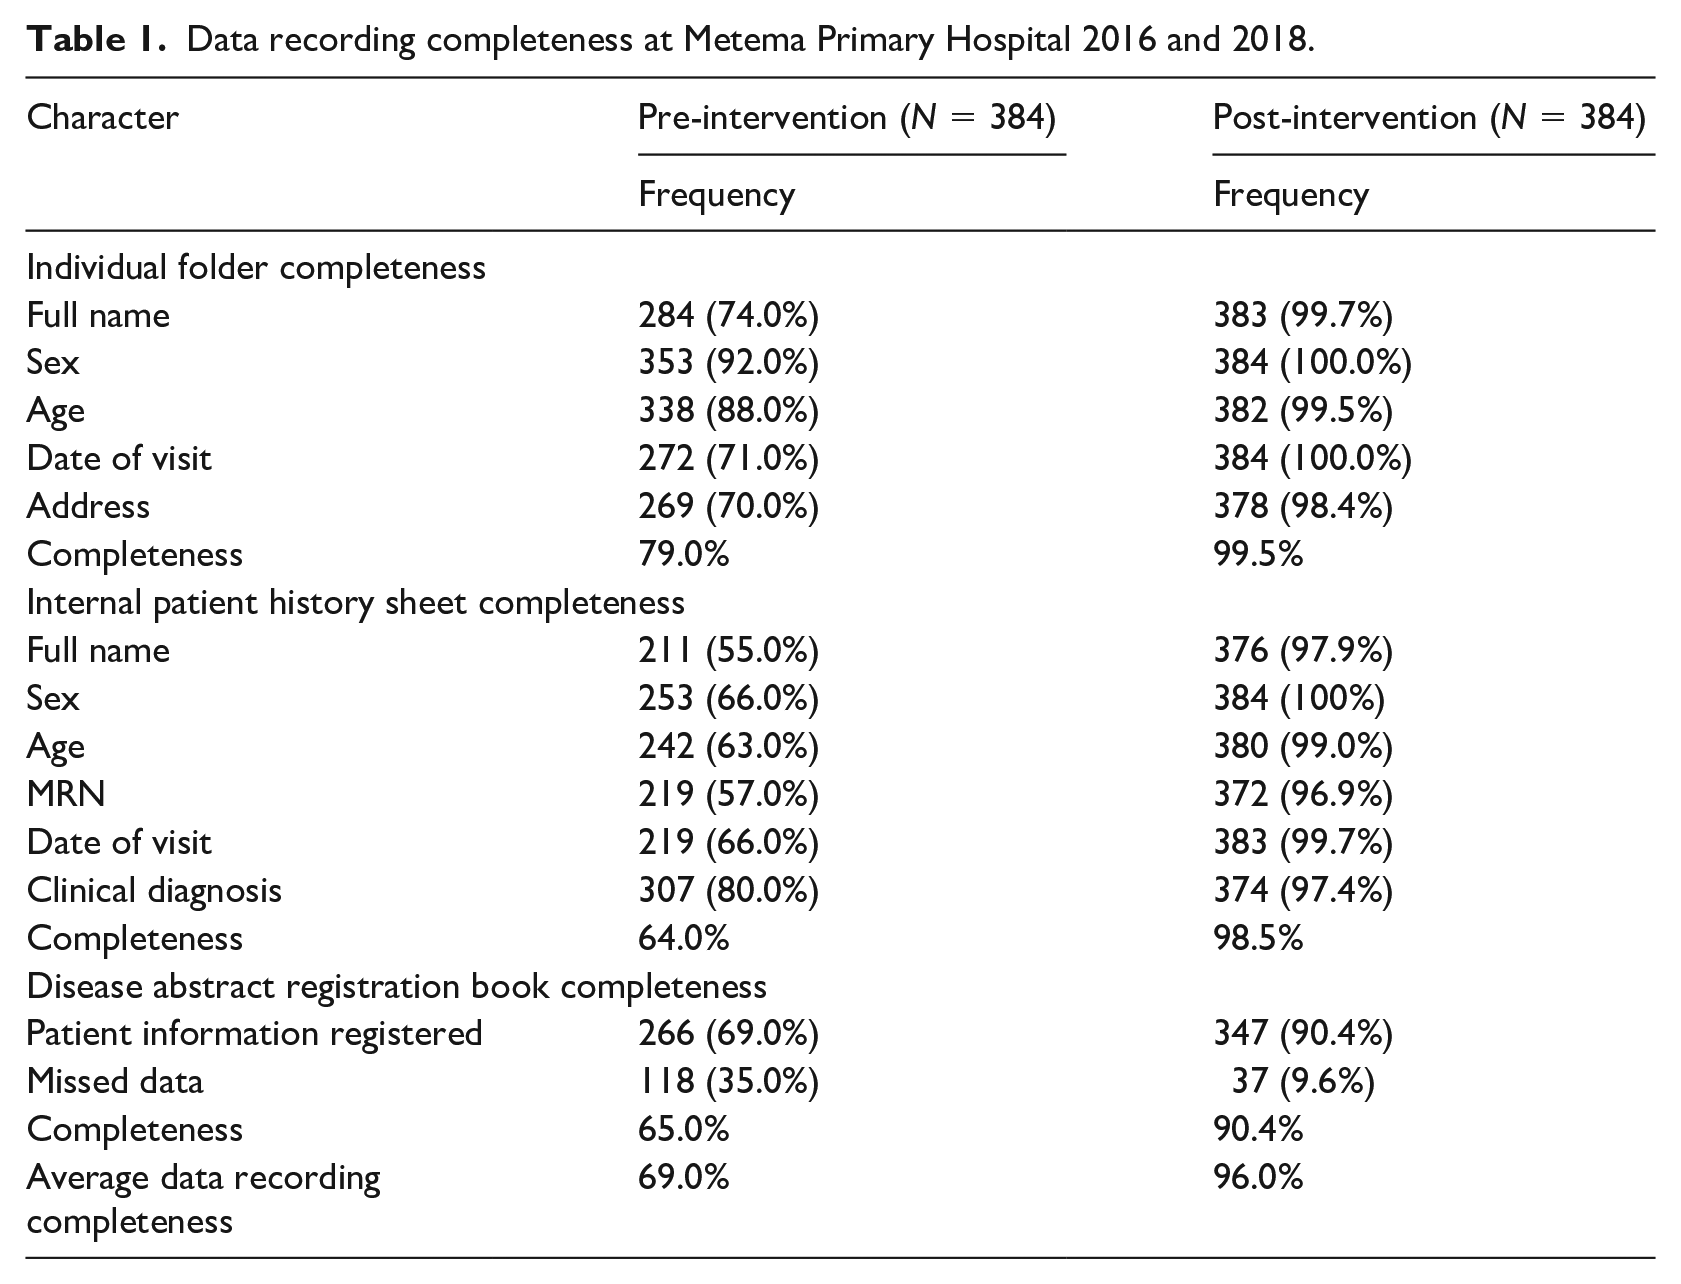
Among 384 client charts reviewed, 99.5% of individual folders, 98.5% of patient history sheets, and 90.4% of disease abstraction registration books were completed at the post-intervention phase while it was 79.0%, 64.0%, and 65.0%, respectively at pre-intervention phase. The average completeness of data recording tools was 69.0% at pre-intervention and increased to 96.0% after intervention strategies were implemented (Table 1).
Data recording completeness at Metema Primary Hospital 2016 and 2018.
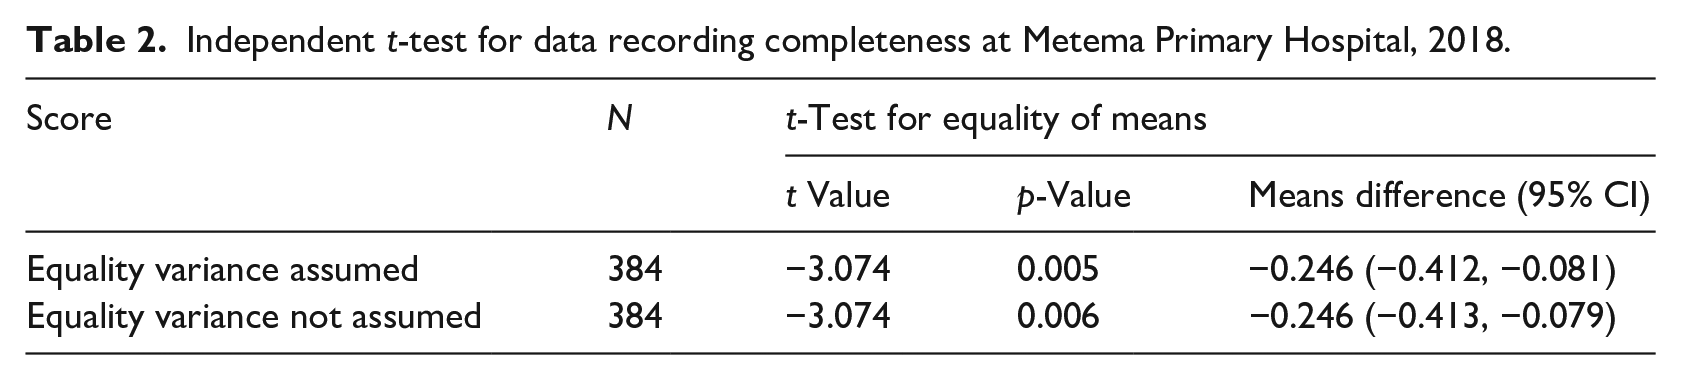
In the t-test analysis, a significant difference between pre-and post-intervention data recording completeness was found with a mean difference of −0.246 (−0.412–0.081) with a statistical significance p-value of (p = 0.005) (Table 2).
Independent t-test for data recording completeness at Metema Primary Hospital, 2018.
Data consistency between registration book and reports
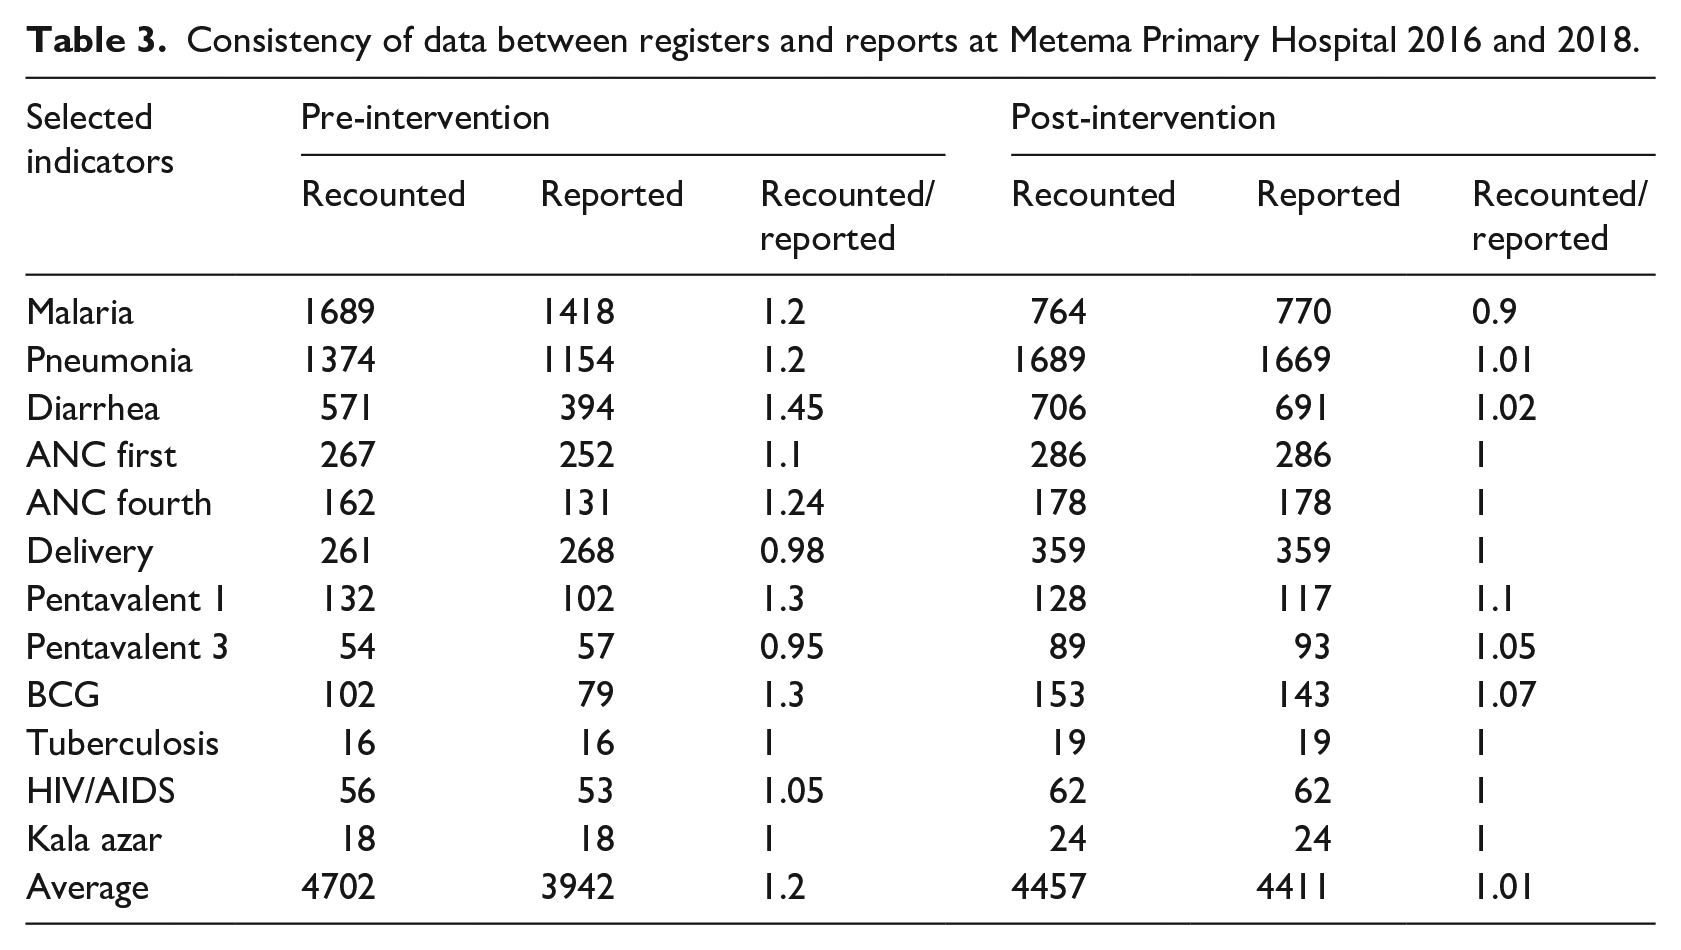
During pre-intervention time, 4702 cases from 12 selected reportable data elements were recounted from registration books, but only 3942 cases were reported during the second quarter of 2016, with 16% of a discrepancy between registers and report. At the post-intervention phase 4457 cases from selected reportable data elements were recounted from the registration book, and 4411 cases were reported during the second quarter of 2018 with 99% consistency between registers and reports (Table 3).
Consistency of data between registers and reports at Metema Primary Hospital 2016 and 2018.
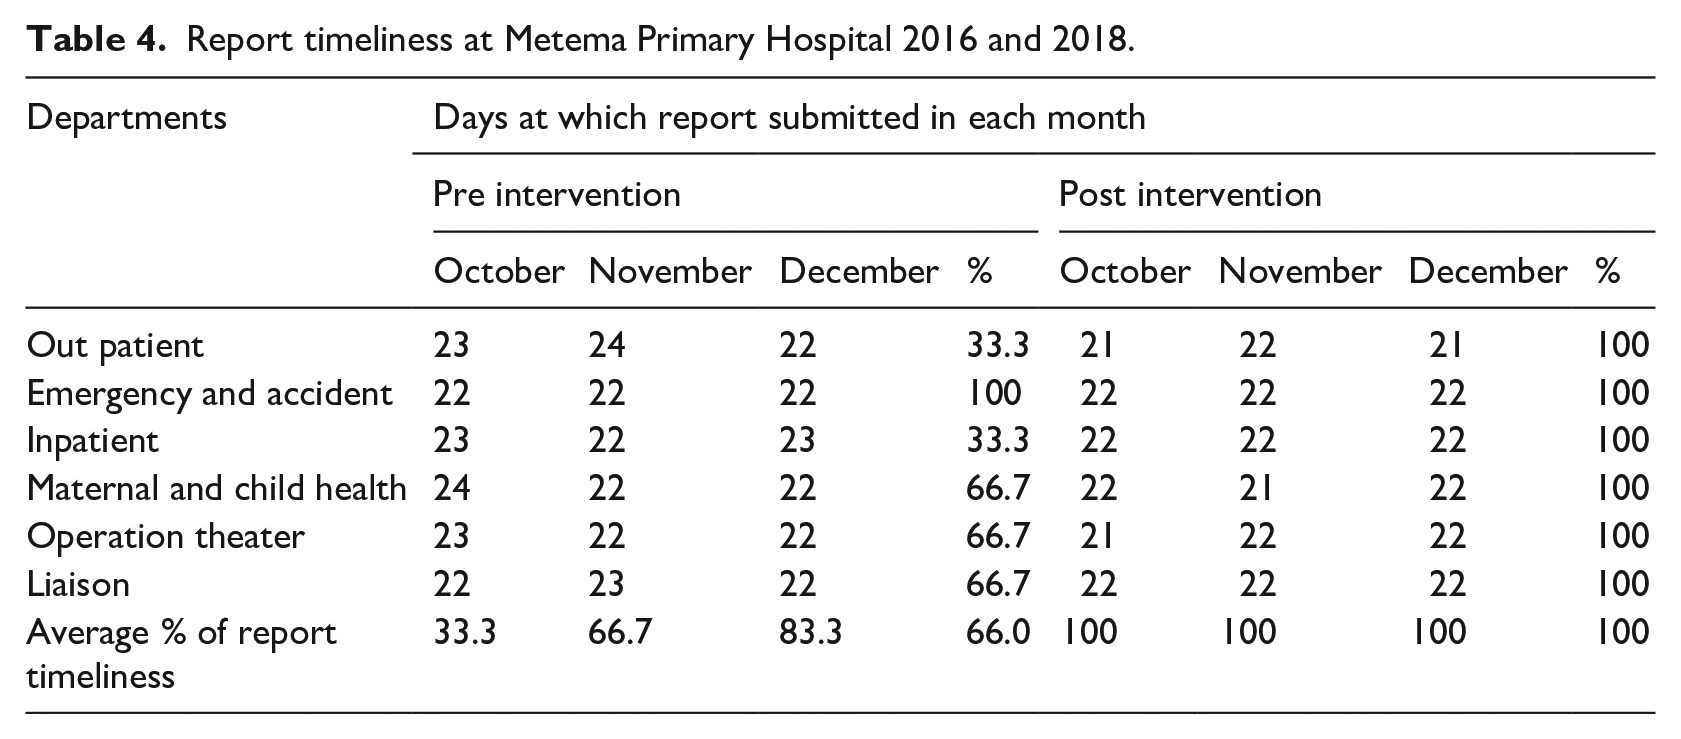
During intervention time, a report timeliness monitoring logbook was developed at the facility level to monitor Department and Hospital report timeliness. The average department report timeliness was 61.0% at pre-intervention. After intervention strategies were implemented, all departments had submitted their report timely and improved hospitals’ average report timeliness from 66% to 100% at the post-intervention phase.
Report timeliness
The average department report timeliness was 61.0% at pre-intervention. After intervention strategies were implemented, all departments had submitted their report timely and improved hospitals’ average report timeliness from 66% to 100% at the post-intervention phase (Table 4).
Report timeliness at Metema Primary Hospital 2016 and 2018.
Information utilization
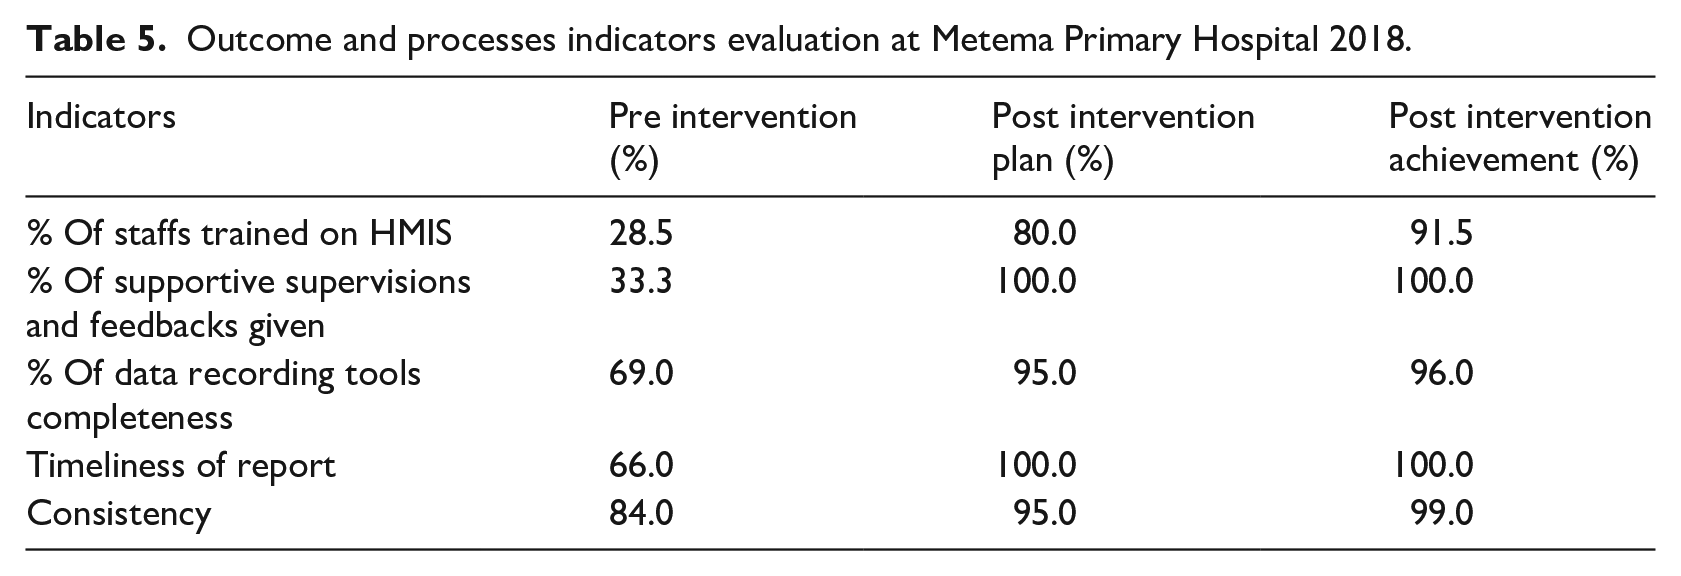
In the pre-intervention Assessment, there was a low motivation to use locally generated data for decisions at Metema Primary Hospital at the department and hospital level. While all departments are expected to evaluate their performance before submitting the report and develop an action plan based on the gaps identified during the evaluation of their performance. Before the intervention, only 33.3% of departments received constructive and gap-filling feedback and supportive supervision. About 71.5% of health workers didn’t take HMIS related training while they had expected to implement this reform. At the department level, performance monitoring, and action plan development were found 28.0% and 22.0% respectively at pre-intervention and increased to 89% and 100% at department and hospital-level respectively after the intervention. After the intervention, gap-filling feedback and supportive supervision were given to all (100%) departments on a monthly basis. Also, four quality improvement projects were developed at post intervention phase after performance evaluation.
Evaluation of indicators after intervention
After intervention strategies were implemented, indicators, and the study objectives were achieved their goals (Table 5).
Outcome and processes indicators evaluation at Metema Primary Hospital 2018.
Discussions
Complete, accurate, and timely health and health-related data would provide health managers with the information required to make an evidence-based decision at each health system level. This study attempted to measure the changes in data completeness, consistency, report timeliness, and information utilization practice for decision making before and after intervention at Metema Primary Hospital. Factors were identified by conducting root cause analysis with different tools. By implemented the designed intervention strategies, data quality (completeness, consistency, and timeliness), and information use were improved in the study area.
Before the intervention, data recording completeness was below the national standard, but after the intervention, the data recording completeness met the national standard. Similarly, data recording completeness at the post-intervention phase was higher than a study done at Ayeder referral hospital), 15 Mekele, 11 Wolega zone, 12 and Kenya. 6 The possible explanation might be due to the interventions implemented, the difference in study design, data collection method, and study area. The studies conducted before were cross-sectional, and the current study is a pre-post interventional study.
Before the intervention, the report timelines in this study was lower than a study conducted at Wolega zone 12 and Tanzania. 7 The discrepancy might be attributed by the study areas that were health posts, health centers, and districts in Wolega, and the difference in the health care system and the study sites that are health centers and dispensaries in Tanzania. Also, the difference after intervention could be attributed by the new interventions introduced in the current study area. Also, the new intervention increased the hospital’s average report timeliness, which met the national standard.
Data consistency between registration books and reports at pre-intervention was suboptimal. However, after the intervention data, consistency showed a significant improvement and met the national standard. Also, the finding was higher than studies conducted in Kenya 6 and at different districts in Ethiopia.12,15,16 The difference might be due to differences in the health care system, study sites (health centers, hospitals, and dispensaries), study approach (cross-sectional) in Kenya, and intervention in this study.
The ultimate goal of implementing HMIS was to enhance evidence-based decision-making practice at all health system levels. The result of information utilization in terms of performance monitoring, action plan, and quality improvement development at the hospital level was low at the pre-intervention phase, but it showed a significant change at the post-intervention phase. The level of information use after the intervention is higher than from previous studies conducted in different administrative zones of Ethiopia11,13,15–17 and Kenya. 6 This implies that the designed intervention had a paramount effect on improving the level of information use. Performance monitoring team functionality and providing feedback before intervention was lower than studies conducted at Mekelle zone, 11 Hadiya zone, 16 and East Gojjam 17 but increased after the interventions and higher than the previous studies.
Data recording completeness, report timeliness, and data consistency at post-intervention were better than at the pre-intervention phase. This indicates the intervention designed and implemented based on the root cause was effective. So, designing intervention strategies based on the root causes and implementing the designed interventions at each health system level will help improve data quality and information use. However, there were some limitations in this study. The first one is the charts reviewed at the pre and post-intervention phase were different, and second, we used secondary data, and some data were missed. Third, the impact was not evaluated. Lastly, the other data quality dimensions were not addressed. Also, there might be selection bias for records. We took a sample record of 384 charts, so it might not be generalizable for other records.
Conclusion and recommendation
Before the intervention, the level of data quality and information use was low at Metema Hospital, leading the health system cadres to plan and pass decisions without evidence. Lack of HMIS training, low rate of supportive supervision and feedback provision identified gaps for poor HMIS implementation. On the other hand, HMIS training, conducting regular supportive supervision and feedback provision improved data completeness, consistency, and report timeliness and information utilization for decision making in the study setting. Therefore, assessing all the other data quality dimension status and information use practice, identifying the root causes and designing intervention based on the root causes will improve data quality and information utilization.
Footnotes
Acknowledgements
The authors would like to thank facilitators and Metemal Hospital staffs which were dedicated to made the study possible.
Author contributions
All authors made substantial contributions to conception and design, acquisition of data, or analysis and interpretation of data; took part in drafting the article or revising it critically for important intellectual content; gave final approval of the version to be published; and agree to be accountable for all aspects of the work.
Competing interests
The authors declare that they have no competing interests.
Funding
The author(s) received no financial support for the research, authorship, and/or publication of this article.
Ethics approval and consent to participate
The study protocol was reviewed and approved by ethical review board of University of Gondar and Permission letter also obtained from Metema Primary Hospital administration. Names of patients and other personal identifiers were not included in the data collection tool.
Availability of data and materials
The datasets generated and/or analyzed will be available upon request from the corresponding author.