
Abstract
The COVID-19 pandemic generated research interest in automated models to perform classification and segmentation from medical imaging of COVID-19 patients, However, applications in real-world scenarios are still needed. We describe the development and deployment of COVID-19 decision support and segmentation system. A partnership with a Brazilian radiologist consortium, gave us access to 1000s of labeled computed tomography (CT) and X-ray images from São Paulo Hospitals. The system used EfficientNet and EfficientDet networks, state-of-the-art convolutional neural networks for natural images classification and segmentation, in a real-time scalable scenario in communication with a Picture Archiving and Communication System (PACS). Additionally, the system could reject non-related images, using header analysis and classifiers. We achieved CT and X-ray classification accuracies of 0.94 and 0.98, respectively, and Dice coefficient for lung and covid findings segmentations of 0.98 and 0.73, respectively. The median response time was 7 s for X-ray and 4 min for CT.
Introduction
COVID-19 (coronavirus disease 2019) is an infectious disease caused by a novel coronavirus, the SARS-CoV-2. The disease was first detected in December 2019, and in March 2020, the World Health Organization (WHO) classified it as a pandemic. In Brazil, the first case was identified on February 26, in the state of São Paulo. By December 2020, Brazil had already confirmed more than 7.4 million positive cases and almost 192,000 deaths due to the new coronavirus, with almost 81 million worldwide confirmed cases and 1.8 million deaths. São Paulo, the biggest state of Brazil and the focus of the disease in the country presented more than 1.4 million positive cases and 45,000 deaths.
The diagnosis of COVID-19 is mainly defined by laboratory exams such as RT-PCR (Reverse Transcription followed by Polymerase Chain Reaction). 1 Despite being the golden standard for diagnosis, the RT-PCR result can take days due to hospital overload, a current reality in Brazil, 2 and is more reliable after a few days of infection. 1 In some cases if the test result is not available, physicians may use an imaging exam to decide the diagnosis of the disease or on patient hospitalization. 3 Long et al. 4 analyzed 87 patients suspected for COVID-19, of which 36 cases were confirmed. From those, six cases were missed at first by the RT-PCR, which exam had to be repeated once by three patients and twice by the other three, after a few days. However, analyzing CT images from the same 36 patients, 35 of them had abnormalities on the scan. Therefore, CT sensitivity was 97.2%, whereas RT-PCR exam was 83.3%.
Although some studies have shown the central role of diagnostic testing in outbreak control, 5 the manufacturing of test kits in (very) high numbers and the logistics involved to distribute such kits in large territories are some of the obstacles to be faced. 6 Brazil is the largest Latin American country, comprising 8.5 million square kilometers and more than 211 million people. Within Brazilian territory, the distribution of COVID-19 test kits requires complex logistics to reach remote villages, including personnel training.
Several initiatives involving telehealth have emerged in Brazil since the beginning of COVID-19, 7 based on the understanding that teleradiology can help overcome the limited number of radiologists in geographically remote areas. 8 For the Brazilian Unified Health System (SUS), present in these remote areas and connected by a unified PACS system, diagnostic imaging support can be particularly important, especially in the absence of virus test kits, contributing to identify suspected cases of COVID-19 and allowing the adoption of interventions by the frontline professionals.
One of these Brazilian initiatives for promoting image analysis automation launched in July 2020 by IdeiaGov, an innovation hub from the São Paulo government, in a partnership with the RadVid19 consortium, was a challenge to detect pulmonary lesions and classify COVID-19 from medical images by applying Artificial Intelligence (AI). The main goal of this initiative was to identify potential AI-based imaging solutions to be incorporated by the SUS in its telehealth COVID system. Two characteristics were particularly desirable in the sought solution: it should be able to deal with a real and diverse set of images acquired in several hospital and clinical settings; and it should be developed in a timely manner.
The challenge consisted of three tasks: COVID-19 diagnosis from X-rays, COVID-19 diagnosis from CT, and lung and opacity segmentations from CT. This resulted in our system being divided in three parts with different architectures for each task, although we recognize that, for example, the CT segmentation and classification tasks could be performed by a multitask model. The challenge lasted 1 month and selected three groups, out of 14 participating groups, for a pilot phase, with our group being the winner of the challenge. The evaluation of challenge submissions was performed by the organizers. Metrics were area under the ROC curve for classification and Dice for segmentation. Before launching the pilot phase, additional classification data was acquired, allowing us to retrain the models developed during the challenge phase and adapt our pipeline to the production scenario.
The main adaptations from the challenge phase to production were: (i) models were retrained with additional data, including public datasets; (ii) the insertion of a “rejection” class for low-quality images or other anatomical structures; (iii) calculations of both segmented volumes, lungs, and opacities; (iv) creation of Dicom structured reports for both X-ray and CT images; (v) the use of a PACS for communication with the RadVid19 PACS; and (vi) design a scalable architecture with multiple GPUs, capable of dynamically allocating additional processors depending on incoming data volume.
The pilot phase started on November 4 and extended until November 23, totaling 20 days. The quantitative results from the models reported here refer to the test set of the dataset organized before the pilot phase. The analysis of a total of 420 X-rays series and 3372 CT series received during the pilot phase is still on course, and we do not have access to their labels. Note that the pilot phase included data that should be rejected by the system, with the idea of the system being robust to human error and to not require human curating of what images are fed to the pipeline, as the system would operate in real-time with images coming possibly from multiple hospitals in the future.
This paper is organized with the following Sections: Data explains how the X-ray and CT datasets were configured for the training and implementation of the architectures in our solution. In Methodology, our decision support system is described in its entirety, starting with a top-level view and going into details such as how images are rejected, prediction and segmentation networks, communication, and output reports. In Results, we showcase quantifiable training results and timings while discussing implementation challenges and final remarks in Discussion and Conclusion.
Related work
Decision support systems based on machine learning have been first used decades ago. Among the various types of decision support systems, artificial intelligence algorithms for medical imaging attracted the interest of practitioners partially due to recent improvement in the assertiveness of the diagnoses.9–12 And although recently they started to be increasingly adopted in real clinical settings,13,14 their clinical applicability is still somewhat limited.15,16
Upon the surge of the COVID-19 pandemic, studies have shown that the disease can be detected via X-ray and CT images,17,18 and numerous image-based diagnosis algorithms have been proposed since then.19–31 Nonetheless, few solutions were tested in real-time clinical diagnoses,28,29,32 which impose challenges that are seldom considered in research studies, such as automatically rejecting improper images, low latency predictions, and calibrated prediction scores.
Data
The RadVid19 is a radiologists consortium supported by the Brazilian College of Radiology and Diagnostic Imaging (CBR), led by the Institute of Radiology (InRad) and Innovation Center (InovaHC), both from the University of São Paulo Hospital (HCFMUSP). During the challenge, the RadVid19 made available 597 X-ray images and 1069 CT images, being 945 for CT classification and 124 for CT segmentation, all for training. There were two additional blind test stages, containing a total of 400 X-ray images, 699 CT images for classification, and 84 CT images for segmentation, which evaluated models submitted by all teams, with our group being the winner of the challenge. Challenge images came from Hospital das Clínicas, Sirio Libnes and Fleury, all São Paulo Hospistals. For the pilot phase, more data from Hospital das Clínicas were made available increasing our classification dataset to a total of 3323 CT volumetric series and 3533 X-ray series. All images provided for classification have the NON-COVID or COVID labels, meaning that NON-COVID images could be of healthy patients or other diseases, including pneumonia. All segmentation images contain lung segmentation and COVID related findings manually labeled, and are all of COVID patients.
X ray
In X-ray model training, the following data sets were used:
RadVid19 challenge dataset: composed of images of the training set and two test sets, from phases 2 and 3 of the challenge.
RadVid19 additional images: composed of images sent via PACS during the pilot phase
CovidX: public dataset, composed of subjects images from different countries (COVID-19 and other pneumonia patients, and healthy subjects)
Rejection: dataset composed of X-ray images from body parts other than chest, and with images with low-quality or cropped lungs (real and synthetic).
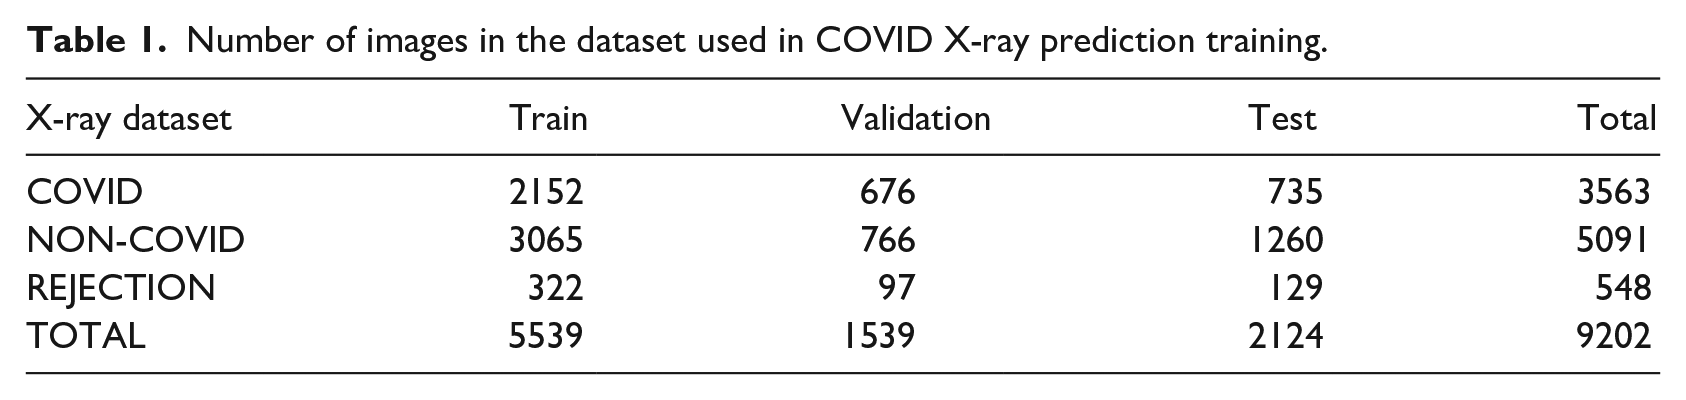
The 7088 series representing the three classes—COVID, NON-COVID, and REJECTION (Figure 1)—were divided into train, validation, and test sets (Table 1).
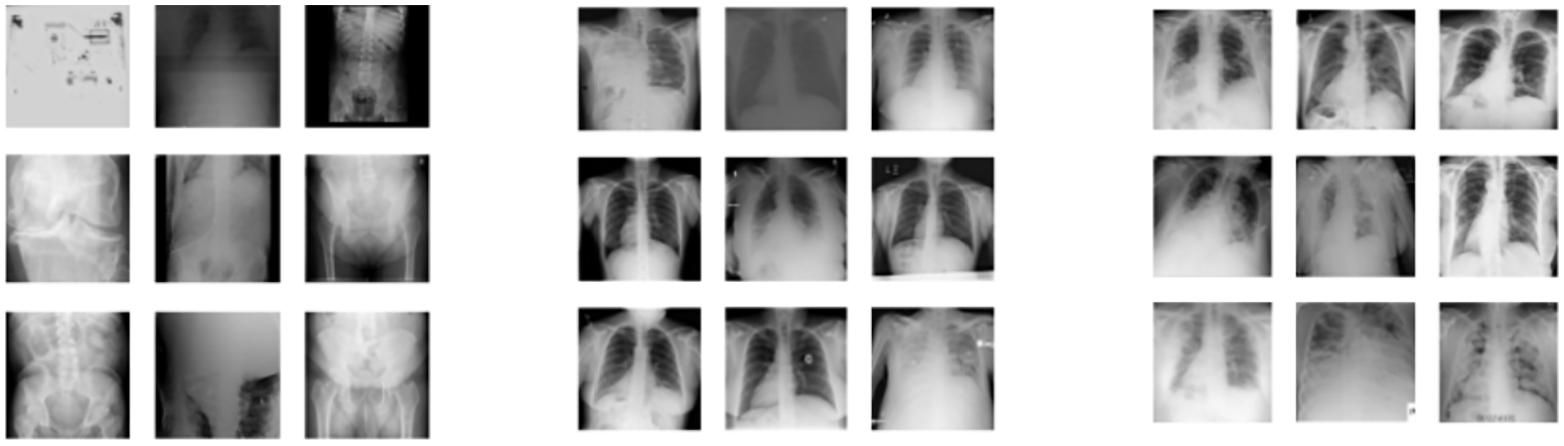
Examples of labeled dataset images: REJECTION (left group), NON-COVID (center group), COVID (right group).
Number of images in the dataset used in COVID X-ray prediction training.
Computed Tomography
During the CT model training, the following data were used:
RadVid19 challenge dataset: composed of images of the training set and two test sets, from phases 2 and 3 of the challenge.
RadVid19 additional images: composed of images sent via PACS.
Rejection: formed by CT data from two datasets, the first representing body parts other than the chest and the second with partial lungs (digitally cropped).
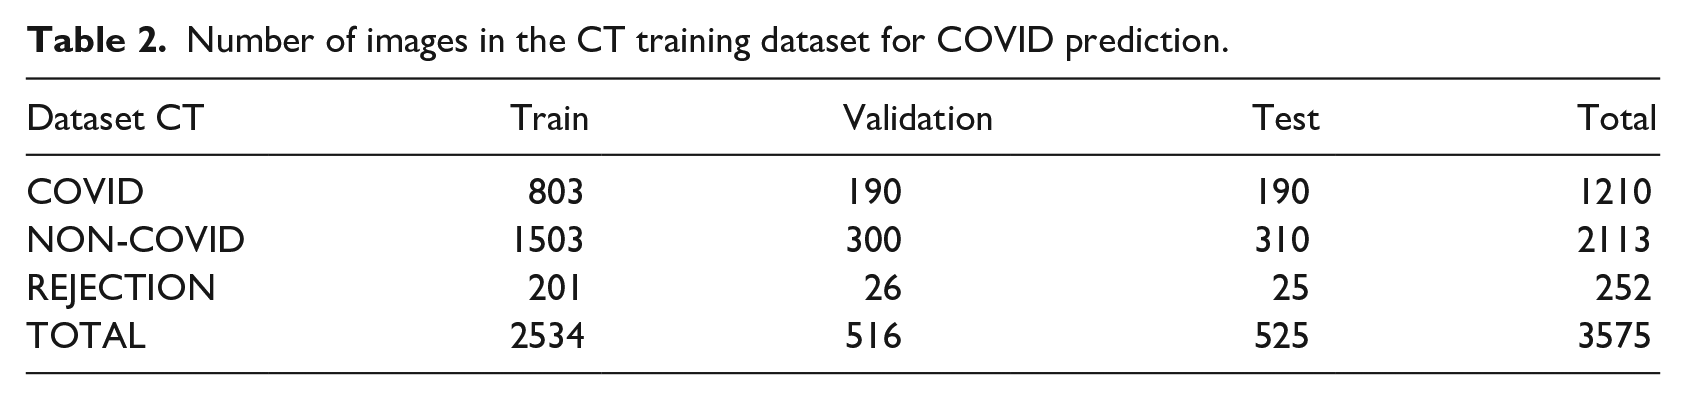
The 3575 labeled series used in the CT dataset were divided into training, validation, and test sets (Table 2).
Number of images in the CT training dataset for COVID prediction.
For the segmentation task, we had 124 manually segmented images, 99 of which were used for training, 12 for validation, and 13 for testing.
Methodology
Deploying deep learning systems to real-time applications requires taking into consideration other aspects often overlooked in machine learning research. These aspects include: real-time transferring, processing, and storing the inputs; ensuring high uptime of prediction pipelines; building and returning to the user understandable reports of the system’s evaluation. All of those aspects come alongside the traditional machine learning development pipeline, that of implementing training and testing an architecture.
This section starts with a top view of our Kubernetes 33 implementation, which manages all the engineering aspects of the solution, and later goes into the architectures and training methods we used, finishing with a description of our PACs implementation and the generated reports. Note that due to the nature of three different tasks on the Challenge phase, our system ended up being developed separately for X-ray classification, CT classification and CT segmentation. These architectures reside and operate inside the Processors on Figure 2. 1
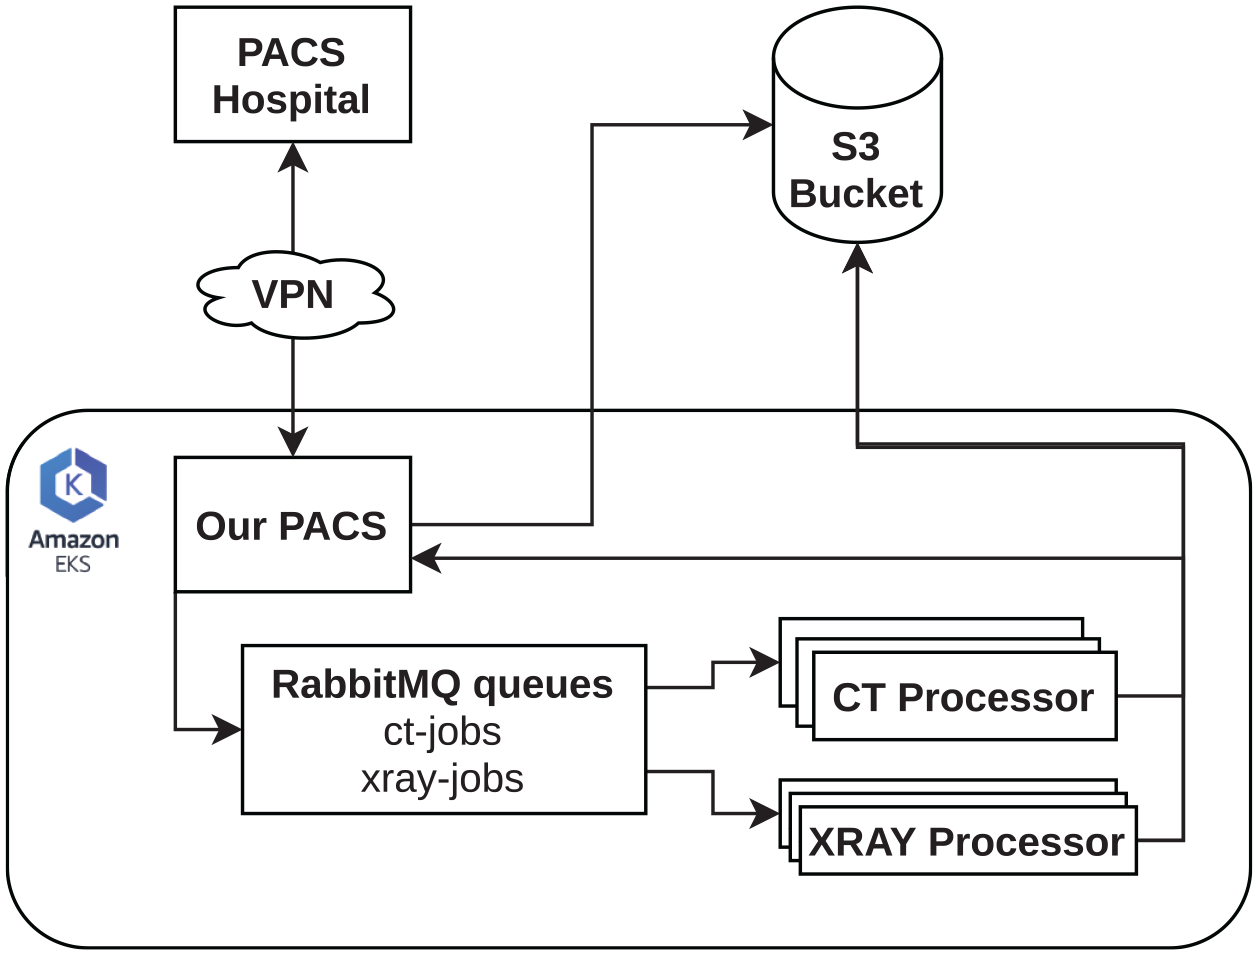
Simplified diagram of our software architecture.
Outline of the system
We used Kubernetes running on Amazon AWS machines to achieve a scalable and robust architecture for running networks in a production environment. The main idea of the system was to receive messages from our PACS, which are queued in an AMQp protocol queue managed by RabbitMQ. Containers managed by Kubernetes consume the messages in this queue, downloading, filtering, and processing the received DICOMs. The series were stored on an S3 bucket. Also, the reports sent back from our PACs are controlled by Kubernets.
Containers labeled “Processors” handled the tasks required to process DICOM files (.dcm). They were built in such a way as never to interrupt the consumption of processing requests, keeping a log of their operation in a separate database (Figure 2). When the CT queue (“ct-jobs”) was greater than or equal to four, new “CT Processors” were activated.
With the DICOM header analysis, secondary series and those that did not fit in the series processing were rejected. Images pre-processing was performed to meet the standard used in training our networks. Heavier processing, such as tomography segmentation, operated on K80 GPUs with increased RAM capacity. Since Kubernetes has the ability to start new machines if the demand for the system increases, the used hardware could be modified and improved at any time during system operation.
Image rejection
Since our system would receive images that are not appropriate to COVID-19 analysis, the first required task is the identification and disposal of these image series (low quality, different acquisition protocol, different body regions, etc.). This identification and rejection of series, both X-rays and CT, was done in two steps.
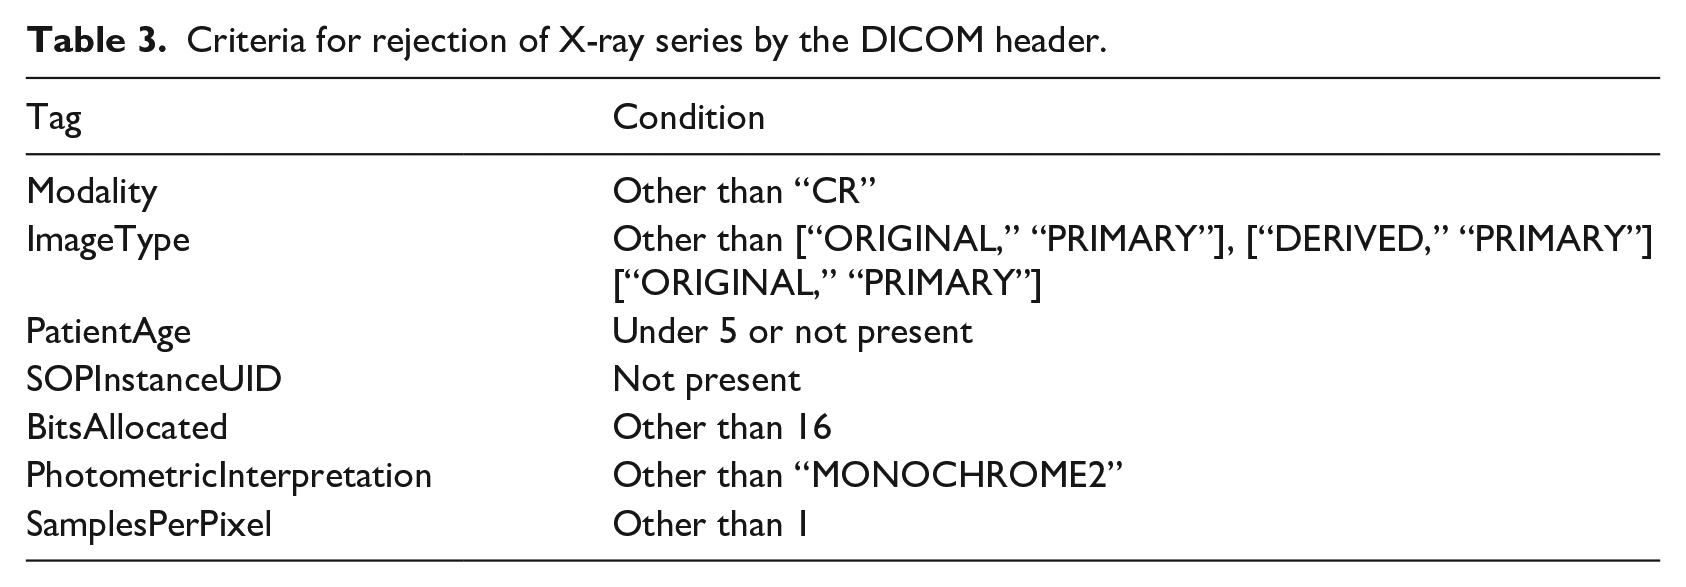
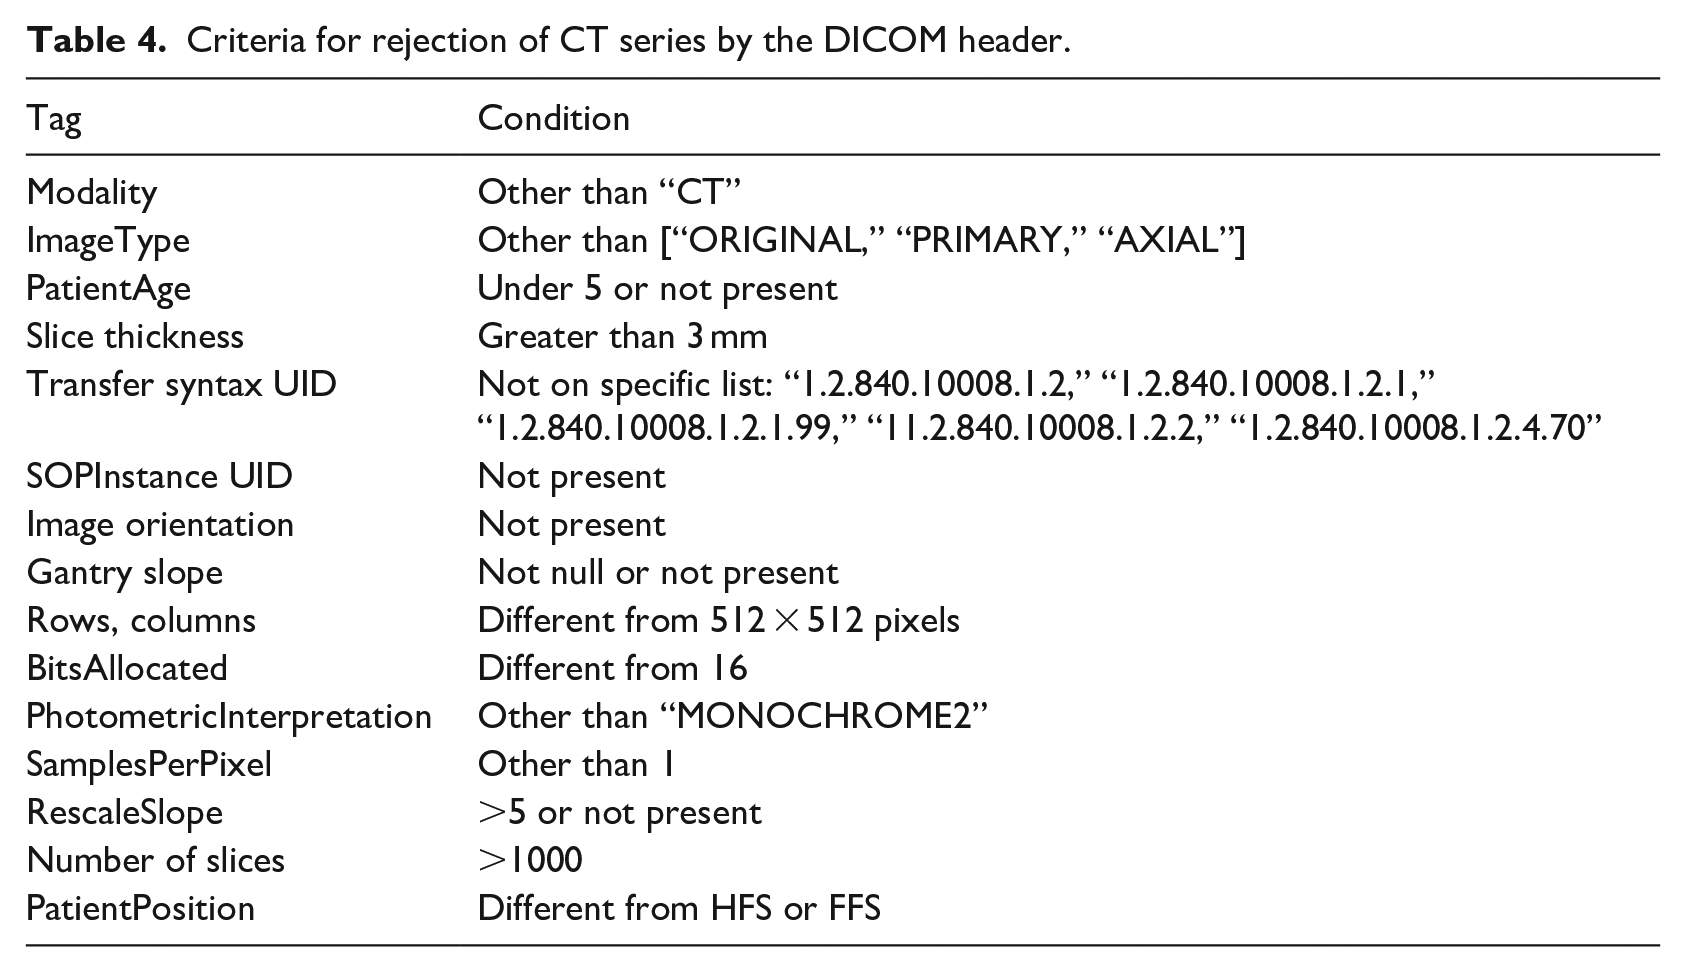
In the first step, the series were rejected by inspection of specific fields in the DICOM header (Tables 3 and 4). In the second step, the rejection was done by a trained network. In the case of X-ray series, the same network that provides the COVID-19 diagnosis also rejected the undesired images (three classes: COVID, NON-COVID, and REJECTION). In the case of CT series, a binary classifier EfficientNet 34 was trained separately on rejection data to discard series that did not apply to the COVID-19 diagnosis but were accepted by the DICOM header inspection.
Criteria for rejection of X-ray series by the DICOM header.
Criteria for rejection of CT series by the DICOM header.
EfficientNet
As seen in previous convolutional architectures, such as ResNet, 35 making the model wider and deeper might help improving performance on different tasks. However, there was no explicit method or mechanism to determine how to expand a network. EfficientNet was introduced as a solution to this problem. Using a base model, denominated EfficientNet-B0, the authors present an algorithmic way of making the model deeper and wider while increasing performance without sacrificing efficiency. EfficientNet was scaled to EfficientNet-B7 on the original paper, achieving 66M parameters against the 5.3M of the base model. Each increase on the models’ parameters is made to help deal better with higher resolution images. In this work, we used different EfficientNet scales in both CT and X-ray classification.
After the last convolutional layer, we introduced a linear classifier responsible for mapping the features extracted by the EfficientNet into a COVID-19 probability of the input sample coming from a patient.
X-ray COVID-19 prediction
For the diagnosis of COVID-19 in X-ray images, we used the EfficientNet B5 model and images with pixels resolution followed by a central crop of pixels. We used Adam optimizer, Cross Entropy Loss, and learning rate of . We applied data augmentation of horizontal flip, random translation, and random rotation during training.
Prediction of COVID-19 from CT
For CT classification, we adapted an EfficientNet-B4, using the volume projection as input, simulating a series of X-rays (Figure 3). The final resolution of our inputs was 512×512. When making the projection with average, COVID findings were highlighted and could be found by the network. In our experiments, this method proved to be more performant than using the consensus of multiple slices’ classification. Optimized training parameters include the use of the Adam optimizer with learning rate, binary cross entropy loss and data augmentation similar to the X-ray network.
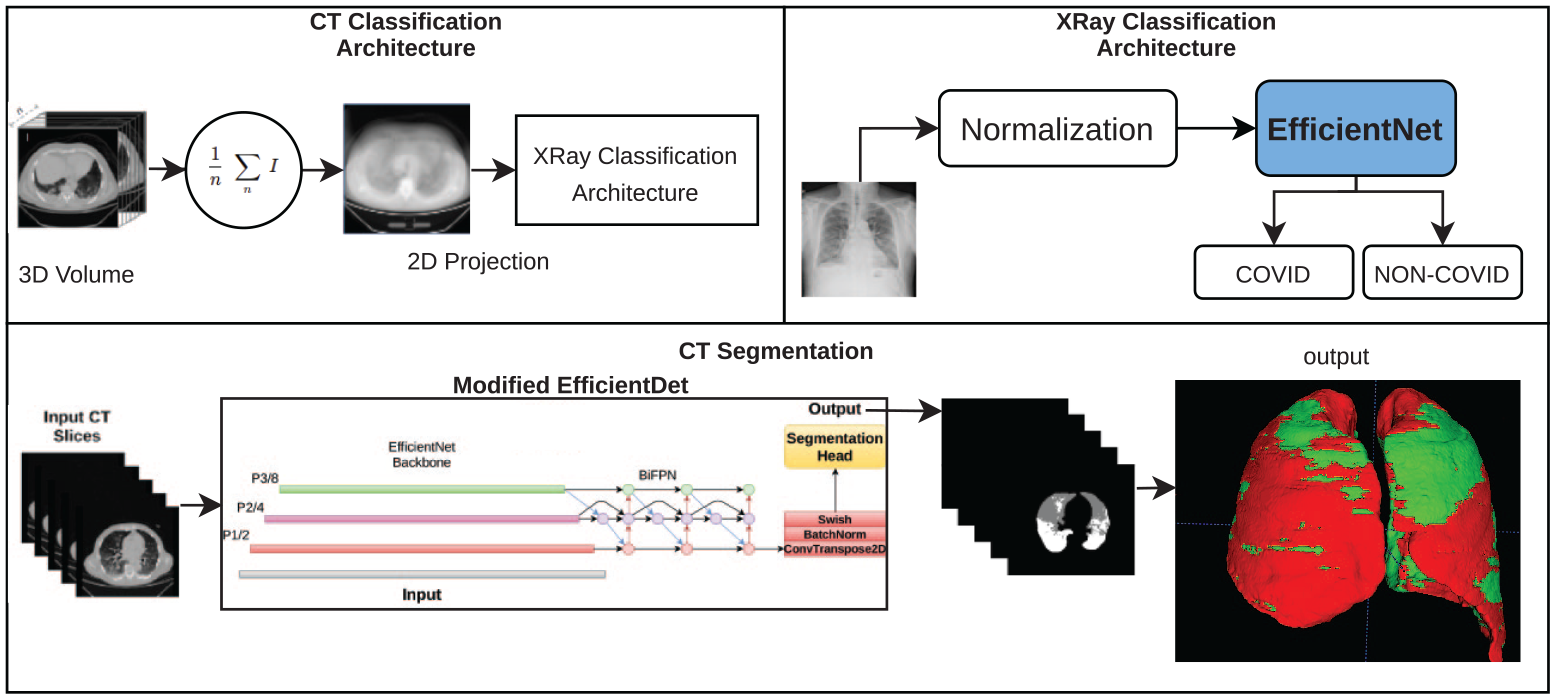
All the architectures used for CT classification and segmentation. Note that the X-ray classification architecture is also used in CT classification with the addition of the 2D projection.
Lung and findings segmentation
To perform segmentation of the lung and findings associated with COVID-19, we used an adaptation of the EfficientDet 36 network (Figure 3). EfficientDet is a recently proposed architecture achieving state-of-the-art in (2D) image-related tasks. It consists of combining features from an EfficientNet backbone in many ways with convolutional, upsampling, and pooling operations, resulting in output feature maps of different scales (BiFPN). 36 Those features can be used to train a given head to perform different tasks, such as object detection and semantic segmentation.
In this work, we employed the original EfficientDet with some modifications (Figure 3), naming it Modified EfficientDet. Firstly, we changed which features from EfficientNet were used as input for the BiFPN, with the goal to access initial features half the size of the original image. Instead of using P3, P4, P5, P6, and P7 as in the original paper, we used P1, P2, and P3 (the three first layers). This resulted in a final BiFPN output that is also half the size of the original image. To bring this representation to the size of the input image, a transposed convolution followed by batch norm and the same activation used by the original network, swish, 37 were added. This new representation was then fed to the segmentation head. Three blocks of depthwise convolutions 38 composed the segmentation head, batch normalization, and swish, followed by a final convolution for channel reduction to the number of classes.
Note that the EfficientNet backbone was initialized from EfficientNet-D4 ImageNet pre-trained weights, while the rest of the network was initialized with Kaiming uniform initialization. 39 When training this network, an input consisted of a batch of random patches. One of the main reasons to use this network is reflected in the possibility of validating over full slices, which can be more effective to detect small findings. It is important to note that since this is a 2D network, we produced a volumetric segmentation from the volume input by stacking over 2D slices of the CT scan.
For the real-world deployment, we used morphological post-processing to calculate edges that are delivered in DICOM reports. Morphological processing based on 3D watershed was necessary to separate the two lungs and allowed us to compare the volume of the findings in relation to the volume of each lung.
PACS and reports
Connection to the RadVid19 PACS was made using the DICOM protocol to send and receive images in DICOM format. Our PACS was implemented using an open-source project called Orthanc. Orthanc’s advantage is that it is open-source, runs on Linux, and therefore can run directly on the AWS cloud.
PACS was the central point of all communication. Every image sent to our PACS first undergoes stability tests to verify if all images were correctly received. Once the stability of the series is guaranteed, it was then sent to its respective processing pipeline, CT or X-rays. Each pipeline returned two reports, one in the Structured Report format and the other in PDF format. Additionally, the CT pipeline also returned the respective segmentation series (Figure 4).
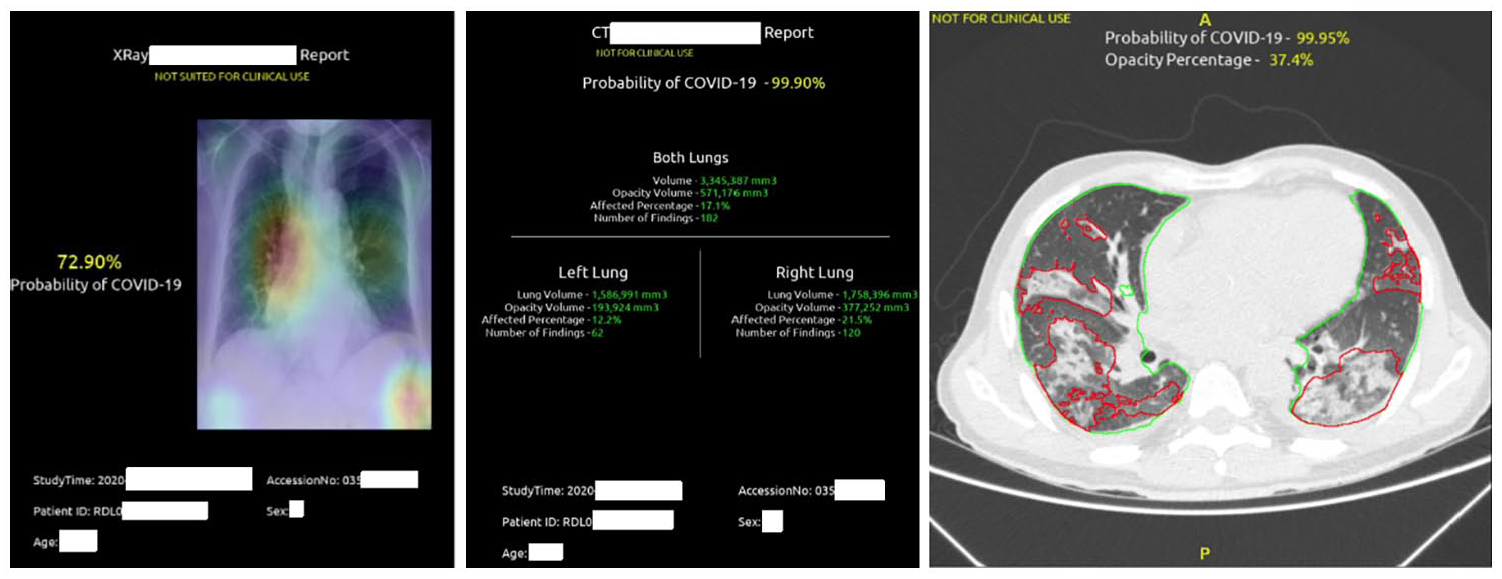
Examples of X-rays and CT reports: prediction of COVID in X-rays, with attention map on the original image (left); prediction of COVID on CT, with percentage of lung involvement (center); lung segmentation and findings (right).
Results
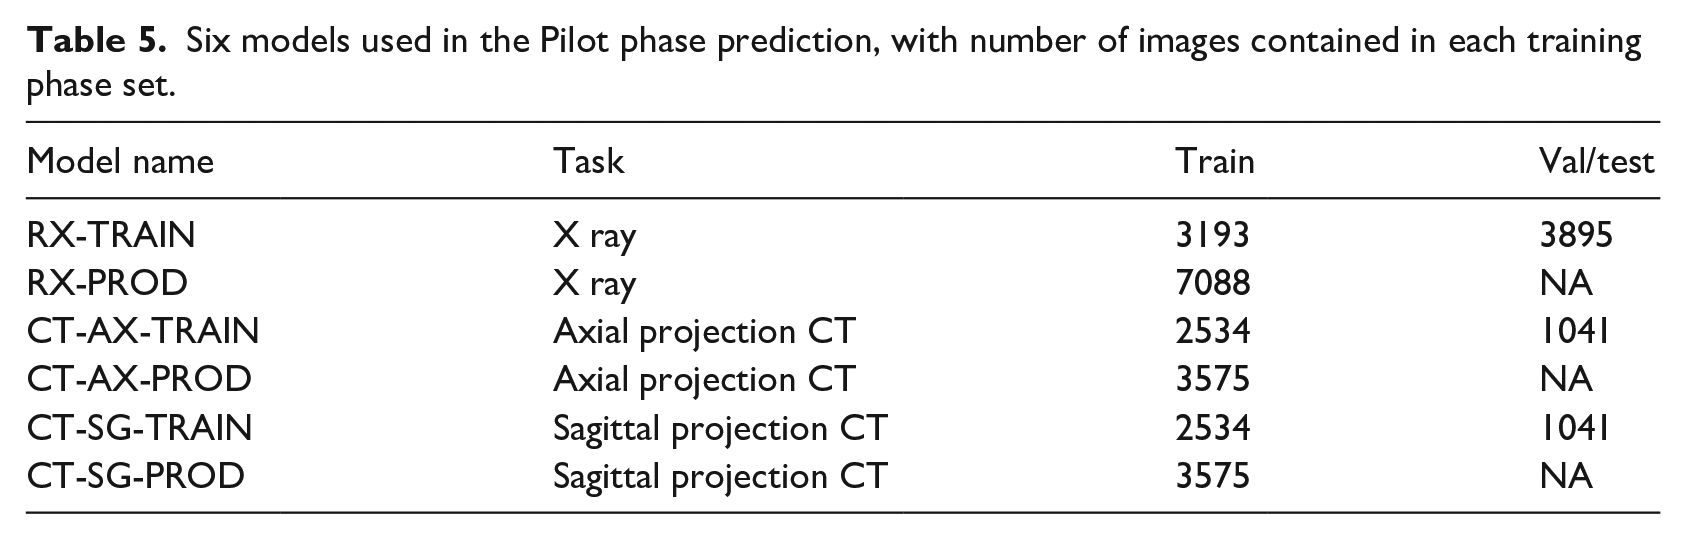
From the X-rays and CT received through the PACs before the pilot phase started, we created a new dataset for each modality and created six models: two for X-rays (RX) and four for CT. The reasoning behind running multiple models is for the health specialists to evaluate which model returned more robust predictions during the pilot phase, since we do not have their labels. Networks trained using data split as training, validation, and test received the TRAIN label. After successful training, we used the whole dataset to train the network, using the optimal number of epochs as the stop point (PROD). Our experience shows that this technique significantly increases the quality of the final models for the final deployment. Thus, this strategy was used for both CT and X-ray. For CT models, AX denotes axial projection and SG sagittal projection. Table 5 shows details of these six models.
Six models used in the Pilot phase prediction, with number of images contained in each training phase set.
Between November the 4th and the 23rd, we received 7092 CT series and 3533 series of X-rays for training and validation. A total of 3372 CT series and 420 X-rays series were for prediction only. Our system scaled the number of operating GPUs according to the demand, which was considerably varied during this period, from 2000 series to 10 series received in a day.
Performance of X-ray models
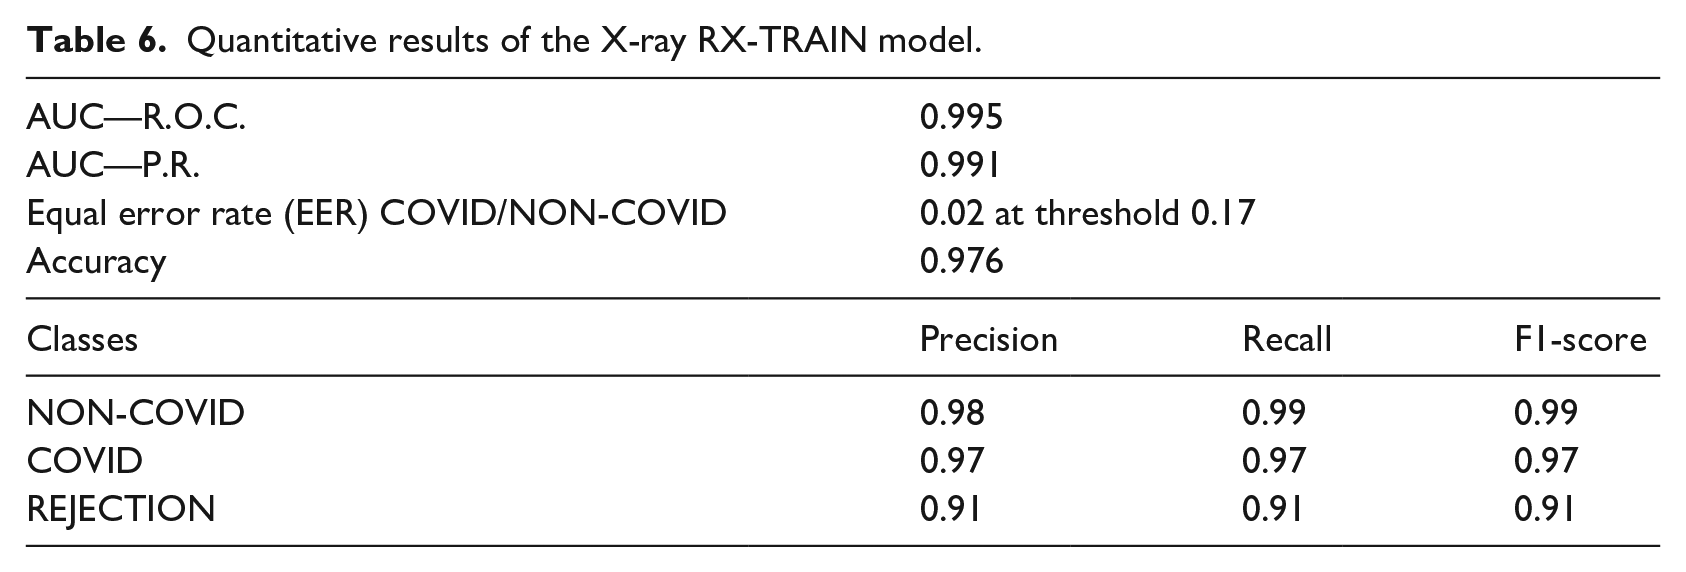
For X-ray images, we used two models from EfficientNet-B5: RX-TRAIN and RX-PROD. The performance of the RX-TRAIN model evaluated in the test set is shown in Table 6 for all classes (COVID, NON-COVID, and REJECTION). In Figure 5 we have the FAR (False Acceptance Ratio) and FRR (False Rejection Ratio) curves when analyzing the COVID and NON-COVID classes. The RX-PROD model was trained with all the data, therefore it is not possible to evaluate its performance using the training data.
Quantitative results of the X-ray RX-TRAIN model.
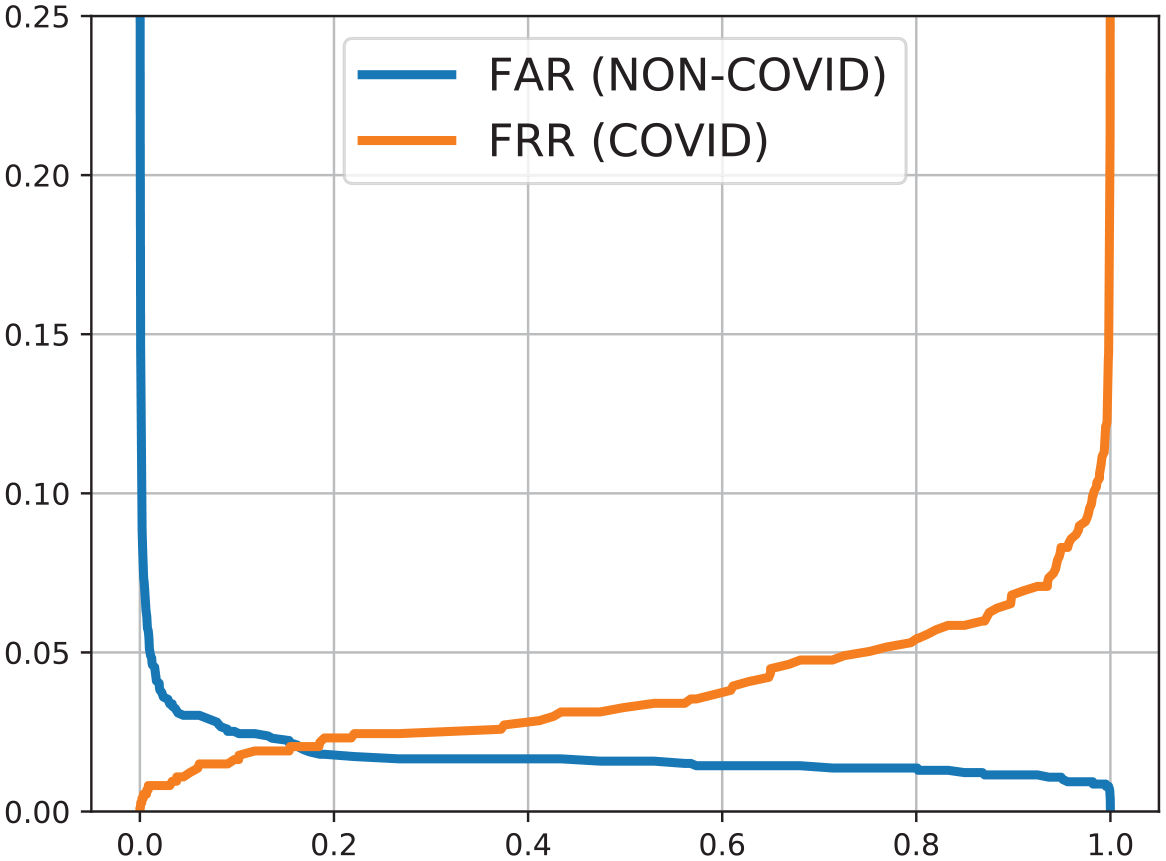
FAR and FRR curves for X-ray RX-TRAIN model.
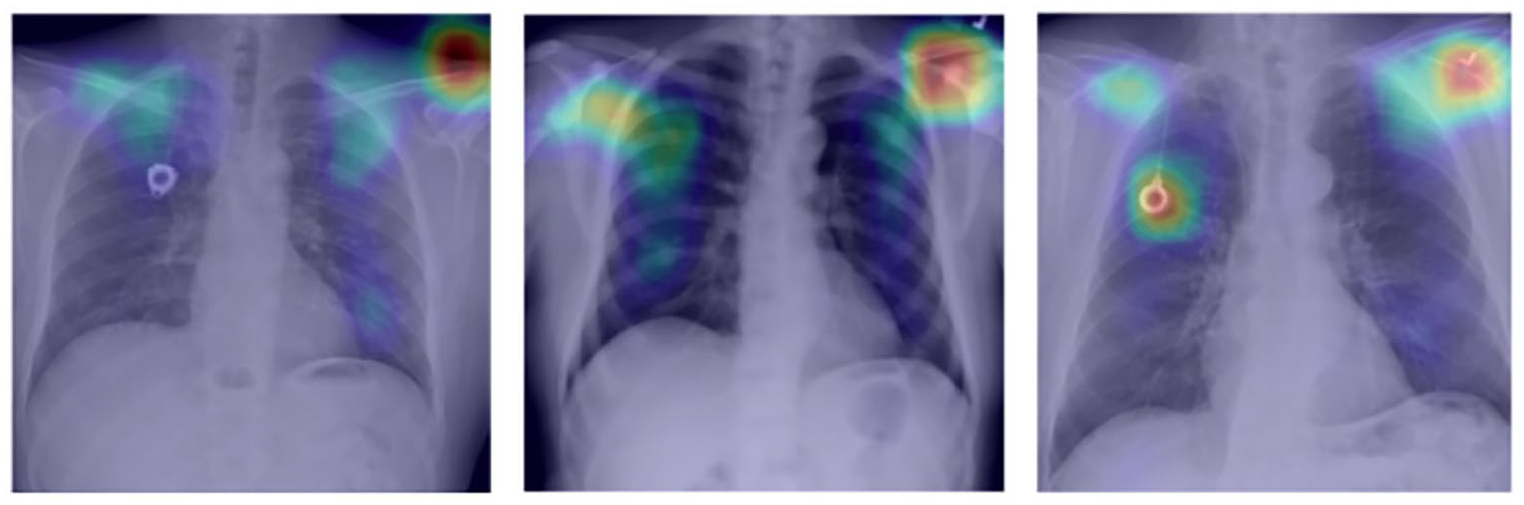
In addition to the probability, our model also returned attention maps, indicating the main points highlighted by the network during the prediction (Figures 6 and 7).
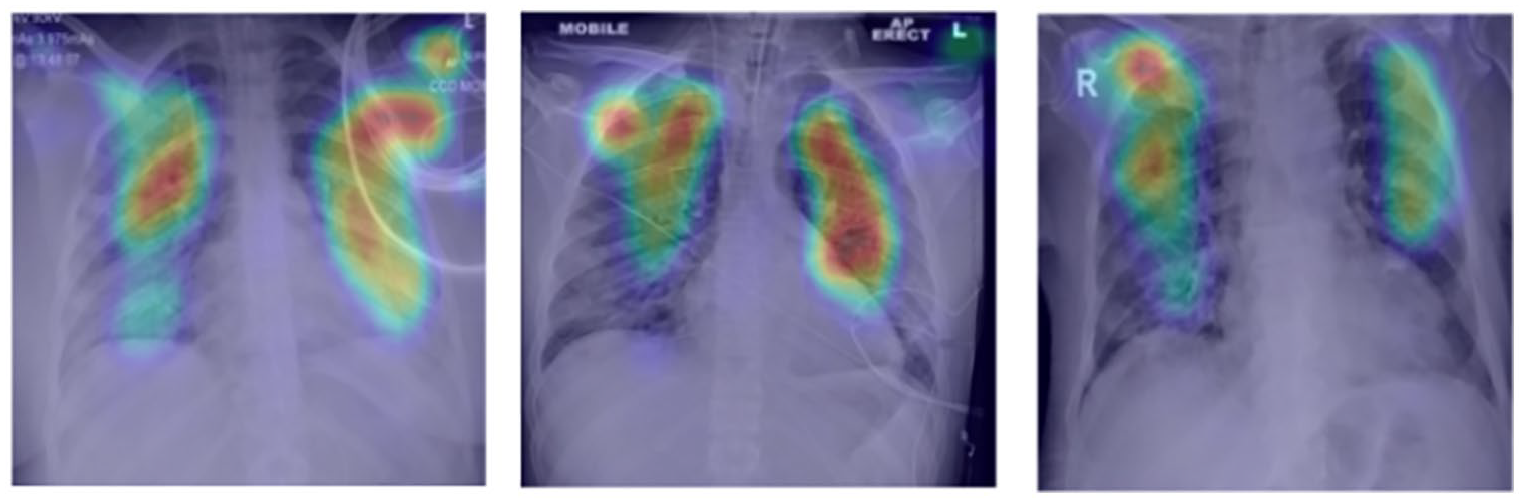
Attention map on X-rays for COVID-19 cases.
Attention map on X-rays for cases without diagnosis of COVID-19.
Performance of computed tomography (CT) models
The average DICE of segmentation in the test dataset, as reported in the result of the first phase of the public notice, was 0.98 and 0.73 for lung and COVID-19 findings, respectively. No changes were made to the segmentation model between the challenge and pilot phase since we did not receive additional segmentation labeled data, but we made several post-processing improvements to estimate the percentage of involvement in each lung, as described in the methodology section, and to assure correct lung separation in production.
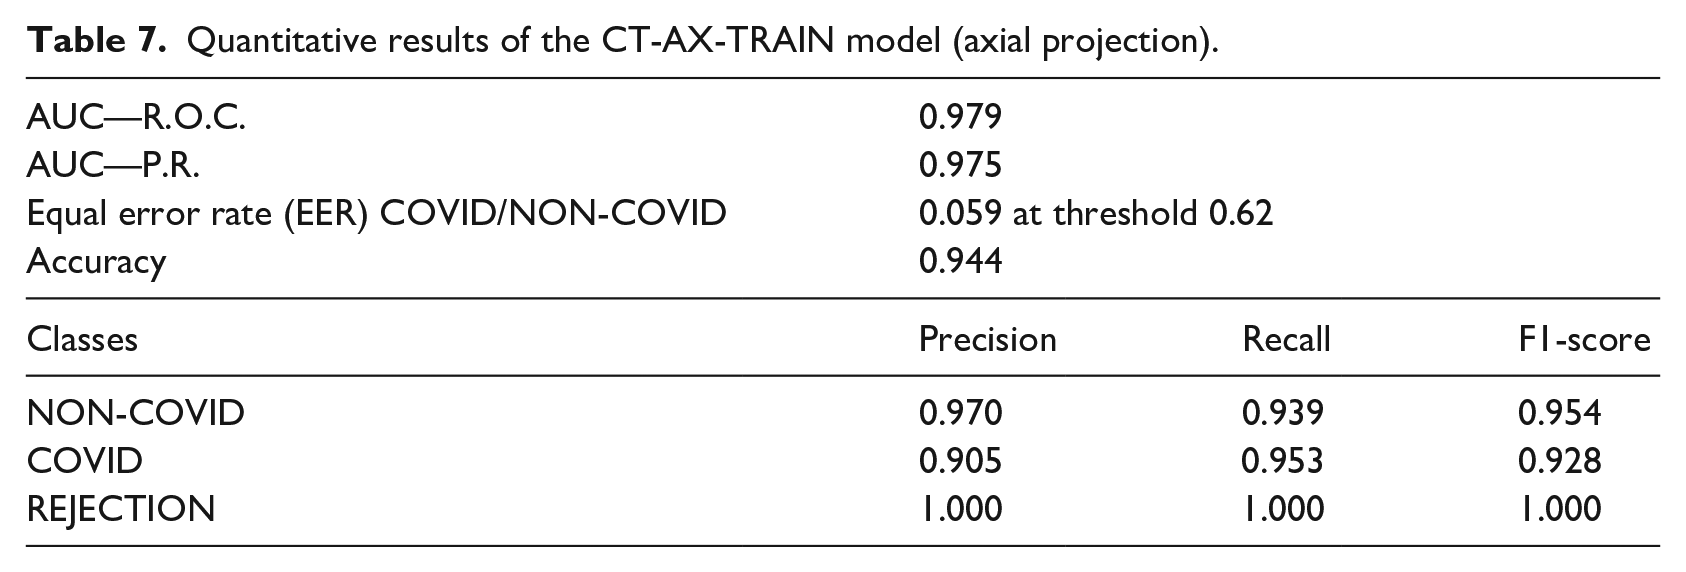
With the additional data acquired for the pilot phase, test metrics for the two models of CT COVID/NON-COVID prediction are presented in Tables 7 and 8. FAR and FRR plots are displayed in Figure 8.
Quantitative results of the CT-AX-TRAIN model (axial projection).
Quantitative results of the CT-SG-TRAIN model (sagittal projection).

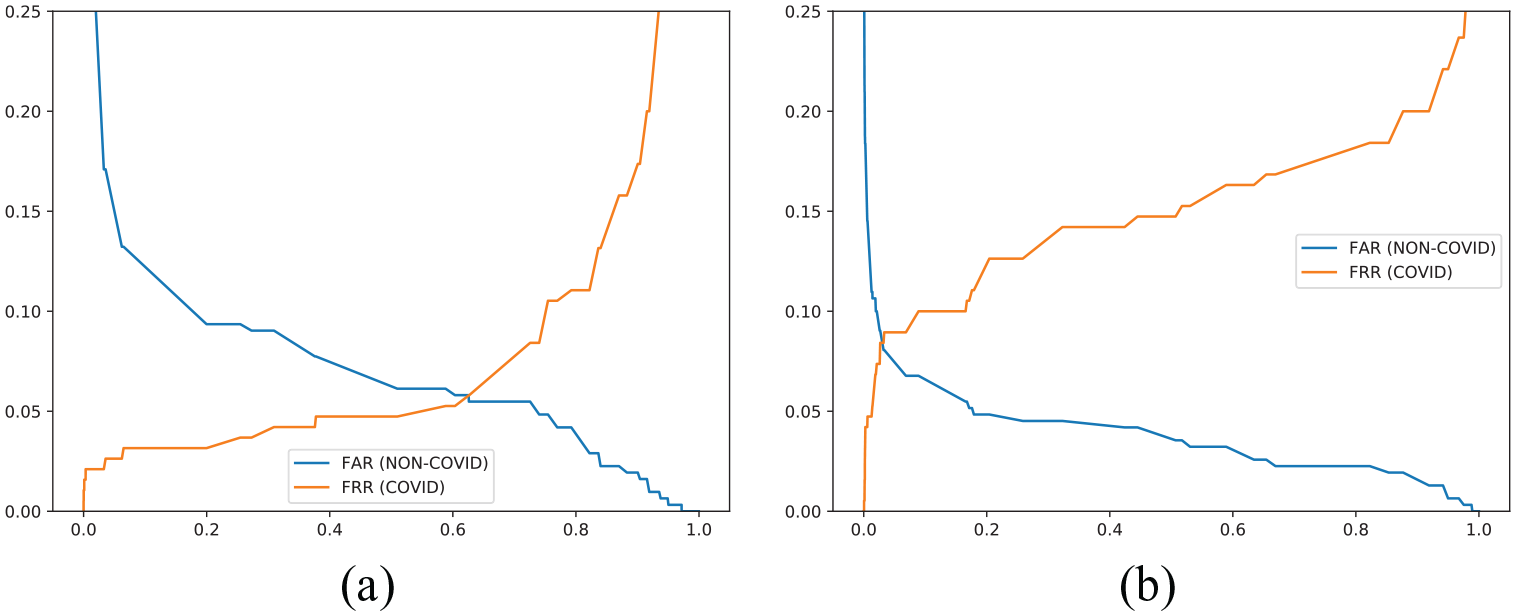
FAR versus FRR curves—COVID/NON-COVID computed tomography: (a) CT-SG-TRAIN and (b) CT-AX-TRAIN.
Processing times
We had two main pipelines, one for X-ray processing and the other for computed tomography. The median processing time was in the order of 7 s per series for X-ray (Figure 9), when running on a 4-core Intel Xeon E5-2686 v4 CPU (AWS p2.xlarge). The tomography pipeline, including the calculation of the COVID-19 findings on all slices of the tomography and the prediction of COVID-19, was the most time-consuming pipeline (Figure 9), and it was running on an NVIDIA K80 GPU with a median time of 3 min (240 s). As an illustration, when using the NVIDIA V100 GPU, the typical processing time was 80 s. In the pilot phase, we used the K80 GPU for cost reasons.
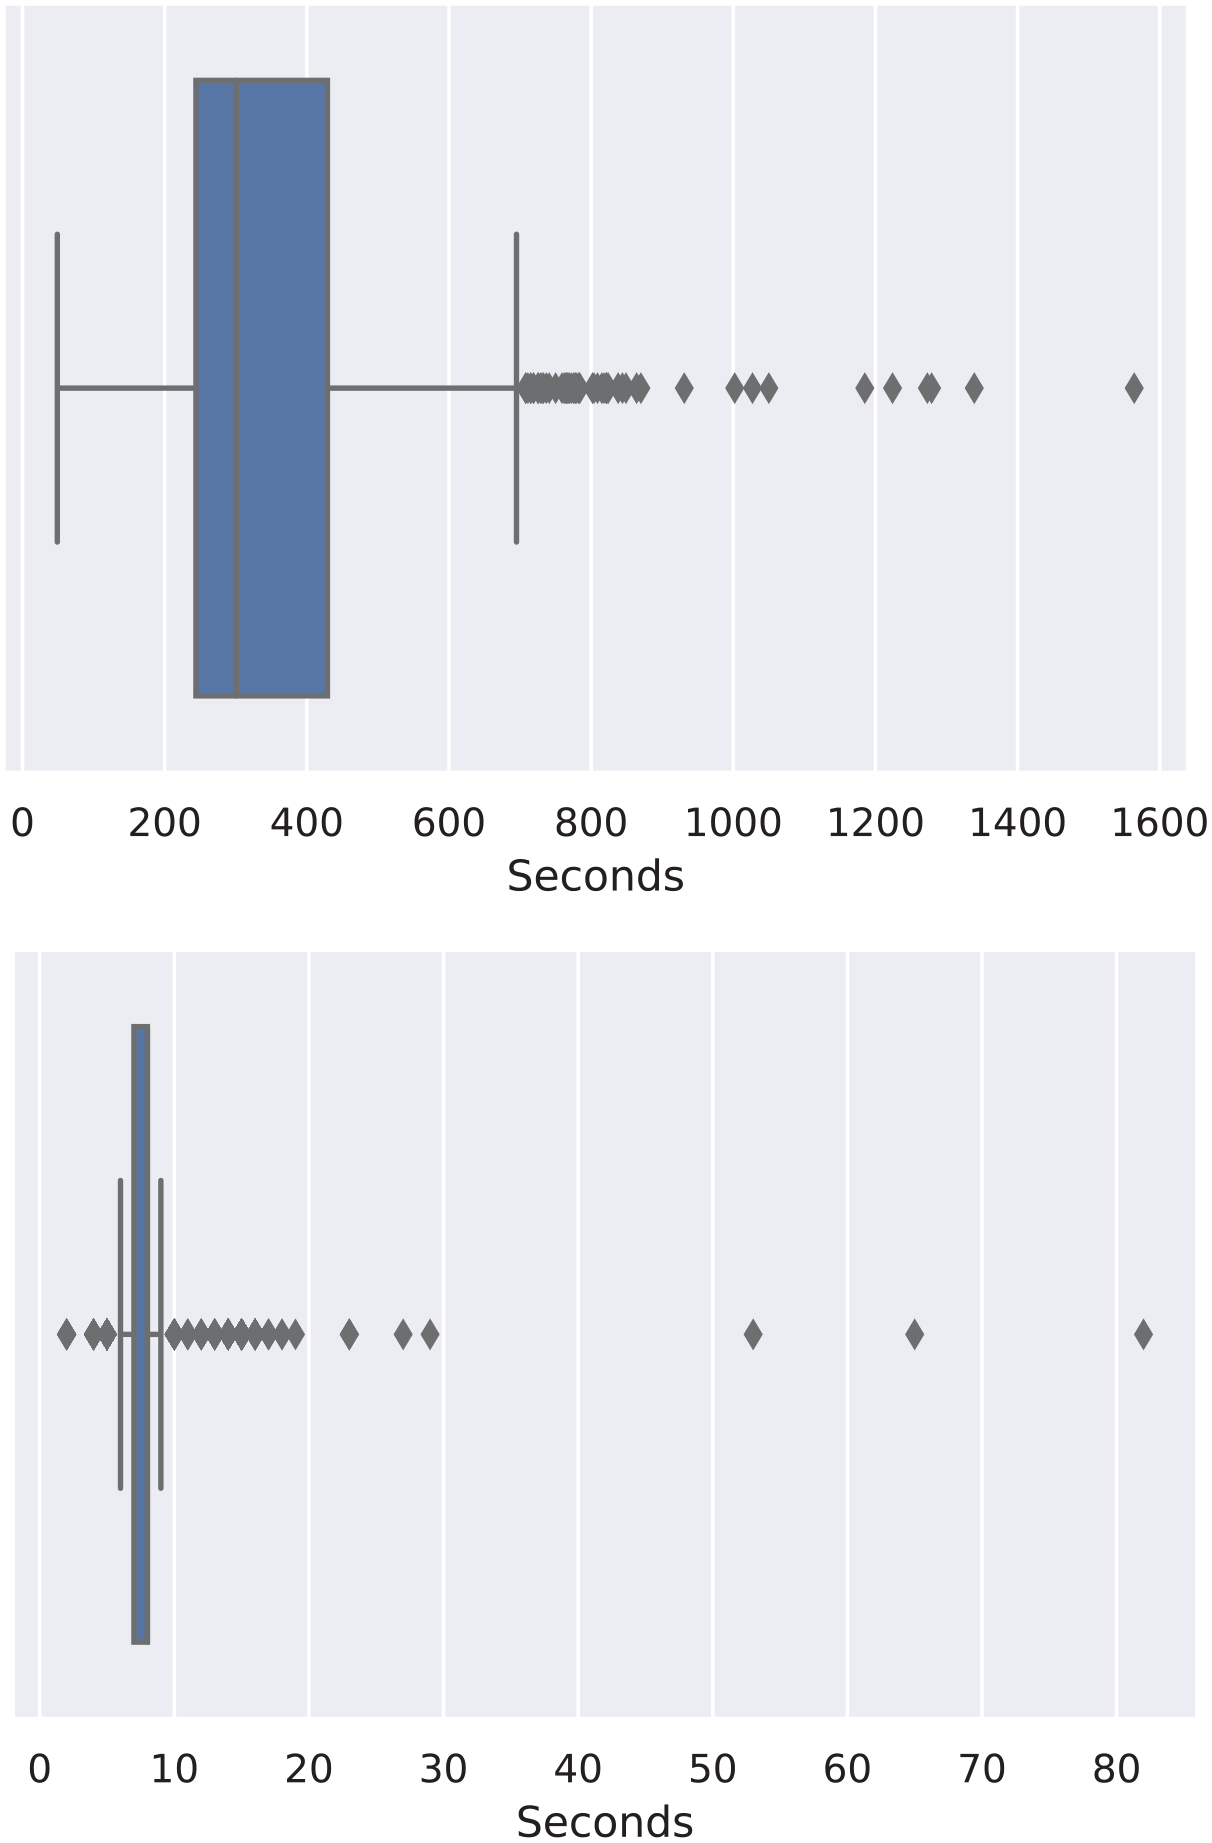
CT and X-ray processing times boxplot respectively.
Discussion
Performance of the pipeline can be discussed in the light of three aspects: quantitative classification results based on chest X-ray and/or CT images; visual (qualitative) results, such as opacities segmentation and attention maps; and scalability and real-time image processing ability.
The same approach for X-ray and CT classification was used, thanks to the idea of creating a 2D projection of CT images. Similar models based on EfficientNet architecture were trained and presented an AUC above 0.97 for both tasks.
X-ray classification did not require image pre-processing besides normalization. However, X-ray images presented high variability in contrast, brightness, and framing. In many cases, the lung appeared cut, with bad visualization, or even the images were from body parts other than lungs. A rejection set was created with poor quality images, but its small size and the subjectivity of the annotation may have led to poor rejection results when compared to other X-Ray classification (COVID and NON-COVID).
The CT analysis comprised an additional CNN to segment lungs and findings as well as to calculate their volumes. The CT segmentation task was long-lasting on the pipeline due to the 3D image processing, in contrast to the classification task, that could be performed very quickly due to our 2D projection approach.
In addition to classifying images, a qualitative analysis was also performed. The report building was challenging and usually not performed on a pure machine learning project. Segmentation results were presented as a DICOM structured report, and attention maps were created by X-ray models to explain classification results. As for the pipeline performance in a production environment, the built system was capable of automatically process series received by PACS, generating the report with useful information for health professionals. In contrast to research pipelines, the system had to cope with a variety of images, not all of them being appropriate for COVID-19 diagnosis. The developed pipeline had to check the DICOM header and to assess image quality through a CNN trained with acceptable images and rejection samples before performing any classification.
The main challenge encountered was the configuration and administration of the receipt of the series by PACS. The DICOM series first underwent stability tests to verify if they were correctly received. Security measures were in place to secure data transfers and keep our Kubernetes architecture isolated from the public internet, with a private connection with the hospital.
Eventually, the PACS became very slow when simultaneously receiving batches of more than 50 series of CT. Also, we decided to keep all series collected by our PACS, accumulating more than 1TB in a local disk, contributing to its poor time response. Future solutions should allocate dedicated hardware to PACS, as well as a more efficient database.
Conclusion
The decision support tool developed and presented here automatically receives, processes, and returns a COVID-19 report from chest images (CT or X-ray) while running in a secure and robust infrastructure on the cloud. Along with the COVID-19 probability, the reports presented the original image containing additional information. The X-ray report included an attention map on the original image, which indicates the areas observed by the model. The CT report included the lungs and findings segmentation on the original 3D image, including their measured volumes. The additional image information serves as decision support for the medical staff to understand the model probability and take the necessary actions. The CT analysis lasts 240 s, and the X-ray 7 s. The fast analysis, pointing to the medical image’s relevant findings, can accelerate COVID-19 diagnosis and decision-making on treatment.
Future work involves the analysis by physicians of the pilot phase results and analysis of the impact of such a system in the daily diagnosis and care of COVID-19 patients.
Footnotes
Acknowledgements
The data used in this work came from a challenge ran by the RadVid19 program, made possible thanks to the public notice published by the IdeiaGov initiative of the Economic Development Secretary of the State of São Paulo, and it is related to the public bidding no. 02/2020, process SDE-PRC-2020/00148.
Declaration of conflicting interests
Funding
The author(s) disclosed receipt of the following financial support for the research, authorship, and/or publication of this article: This study was financed in part by the Coordenação de Aperfeiçoamento de Pessoal de Nível Superior – Brasil (CAPES) process 23038.014333/2020-46 and FAPESP grant 2013/07559-3 (BRAINN Brazilian Institute of Neuroscience and Neurotechnology). R Lotufo was partially supported by CNPq (National Council for Scientific and Technological Development) grant number 310828/2018-0. D Carmo thanks the support from São Paulo Research Foundation (FAPESP) grant 2019/21964-4. G. R. Pinheiro thanks CNPq for the scholarship. L Rodrigues thanks the support from CAPES. Finally, we would like to thank the support from CAPES Grant 23038.004292/2020-80 for funding publication costs.