
Abstract
Overcrowding in emergency departments (EDs) is a primary concern for hospital administration. They aim to efficiently manage patient demands and reducing stress in the ED. Detection of abnormal ED demands (patient flows) in hospital systems aids ED managers to obtain appropriate decisions by optimally allocating the available resources following patient attendance. This paper presents a monitoring strategy that provides an early alert in an ED when an abnormally high patient influx occurs. Anomaly detection using this strategy involves the amalgamation of autoregressive-moving-average (ARMA) time series models with the generalized likelihood ratio (GLR) chart. A nonparametric procedure based on kernel density estimation is employed to determine the detection threshold of the ARMA-GLR chart. The developed ARMA-based GLR has been validated through practical data from the ED at Lille Hospital, France. Then, the ARMA-based GLR method’s performance was compared to that of other commonly used charts, including a Shewhart chart and an exponentially weighted moving average chart; it proved more accurate.
Keywords
Introduction
Management efficiency in production systems is generally evaluated by its ability to achieve the desired performance using limited human, material, and financial resources. Therefore, management plans that maximize production systems for improved resource allocation and more strategic decision making are in high demand.1–7
The effective management of healthcare production systems can become a matter of life and death when decisions are made about allocation of resources in emergency departments (EDs) where patient flow is unpredictable. 8 Efficiently managing EDs is essential to ensure better resource utilization, manage patient flows, and avoid overcrowding situations. In the US, between 1993 and 2003 the EDs demands increased by an average 26% while the number of EDs decreased about 9%.2,9 In France the EDs demands was doubled between 1990 and 2014, 7 and this demand continues to grow.
To handle the unpredictable patient flows, the EDs need significant resources to prevent putting the medical and the paramedical staff under strain that greatly complicates their work, but these resources are limited. 7 A previous study showed that patient influx can generate stressful situation that affect the performance of staff in ED.4,7,8 Early detection of abnormally high patient demands in ED could prevent overcrowding, which will reduce stress, maintain quality, and allow for the efficient allocation of resources. In this paper, we develop a statistical method to enhance detection of abnormally high patient arrivals at EDs with the aim of providing an early mechanism warning of the increased demand for care.
Generally, anomaly detection is one of the vital components for systems monitoring when anomalies are first identified and then isolated to ensure that they can be managed appropriately.10,11 Statistical process control (SPC) is considered as an efficient tool for monitoring production systems. SPC was successfully applied in various domains, including manufacturing, 12 healthcare, 13 and medical research. There are several monitoring charts in the literature including the Shewhart chart, the exponentially weighted moving average (EWMA) chart, and the generalized likelihood ratio (GLR) chart.14,15 The GLR-based monitoring approach has been shown attractive features in detecting abnormalities in time-series data, 16 which make it advantageous for use in several applications.17–19 An essential feature is the GLR approach simplicity and the detection threshold is the only design parameter that requires to be defined. 17 Essentially, the general assumption for univariate monitoring charts such as, GLR-based chart, is that the observations are uncorrelated or statistically independent over time. However, the real data often show serial dependency. Many production systems, such as hospital systems, yield data that have correlation between successive observations. This autocorrelation is expected to affect the performance of conventional SPC charts, 20 violating the assumption of independence; monitoring charts developed under the assumption of independence are compromised by this violation. 20 This paper focuses on the development of monitoring system that combined time-series models and a GLR monitoring chart to detect abnormal ED demands. However, it is worthwhile to notice that GLR test is typically designed based on the assumption that the monitored process and its derived variables follow a predefined probability distribution, generally Gaussian. Unfortunately, such assumption is mostly violated in practice. Indeed, the established detection thresholds become invalid, which alters systematically their detection performance. To overcome this issue, non-parametric chart can be designed to accurately set the detection thresholds when no prior knowledge about probability distribution are available. Here, a nonparametric procedure based on kernel density estimation is employed to determine the threshold of the ARMA-based GLR chart, which extends the flexibility of the developed method. To verify the proposed monitoring chart’s effectiveness, we compare the obtained results to those of state of the art approaches.
The following section briefly reviews the ARMA time-series modeling. In the third section, we introduce the GLR hypothesis testing and its application. The fourth section presents the developed ARMA-based GLR approach. The fifth section presents the experimental results, and the sixth section concludes with a discussion.
Time-series modeling and ED demands
In the few lasts decades, the increasing use of time series data has been motivated by the increasing of the data produced by production systems. Times series methods are widely applied in several application domains. 21 Indeed, Time series approaches are commonly used to capture correlations in production processes.21,22 Stationary processes are considered as one of the most important class of time series models, which assume that the process remains in equilibrium around a constant mean. These models can provide a framework for seeking statistical control when monitoring auto-correlated processes. If we fit a good model that describes well the auto-correlated process, then we can approximate the uncorrelated process and monitored it via statistical hypothesis testing.
Times series methods are widely applied in various domains because of their ease of use, implementation, and interpretation in modeling and forecasting future variables. In hospital systems, in particular EDs, time-series models have been used to predict ED demands.7,23–26 For example, Carvalho-Silva et al. applied a seasonal ARIMA model to forecast ED visits at the Braga Hospital in Portugal. 27 Rodríguez and Hernández presented a method based on time-series models to forecast hourly patient arrival to Tenerife ED, Spain, over 6 years (1997–2002). 28 Kadri et al. proposed an approach based on a multivariate ARIMA model for modeling ED visits in Lille hospital France. 29 Champion et al. used exponential smoothing and the Box-Jenkins approach for predicting the monthly demands for ED of a hospital in Victoria, Australia, from 2000 to 2005. 30 Barişçi analyzed the electromyographic (EMG) signals using an adaptive ARMA. 31 Sun et al. predicted ED demands by fitting ARMA models. 32 They concluded that the time-series models represent a good tool for predicting ED demands and workload of medical staff. Aboagye-Sarfo et al. developed multivariate vector-ARMA forecast models for predicting emergency department (ED) demand in Western Australia. 33 They collected data of the number of monthly visiting patients for 7 years (2006–2012) from public hospital ED in Western Australia.
Autoregressive and moving average models
The main steps to build a successful model are (i) the data analysis and pre-treatment, which usually involves features of studied system, (ii) the model selection, and (iii) the model estimation that determines the optimal parameter values of the selected model before validating the selected model. 34
ARMA model provide a sophisticate and analytical models. It combines elements of moving average and auto-regression to fit stationary time series data. 34 One attractive feature of an ARMA model is that it includes fewer parameters than a moving average or autoregressive process standalone.30,32,35 The ARMA model of order (p; q) also denoted as ARMA(p; q) is written as:

where
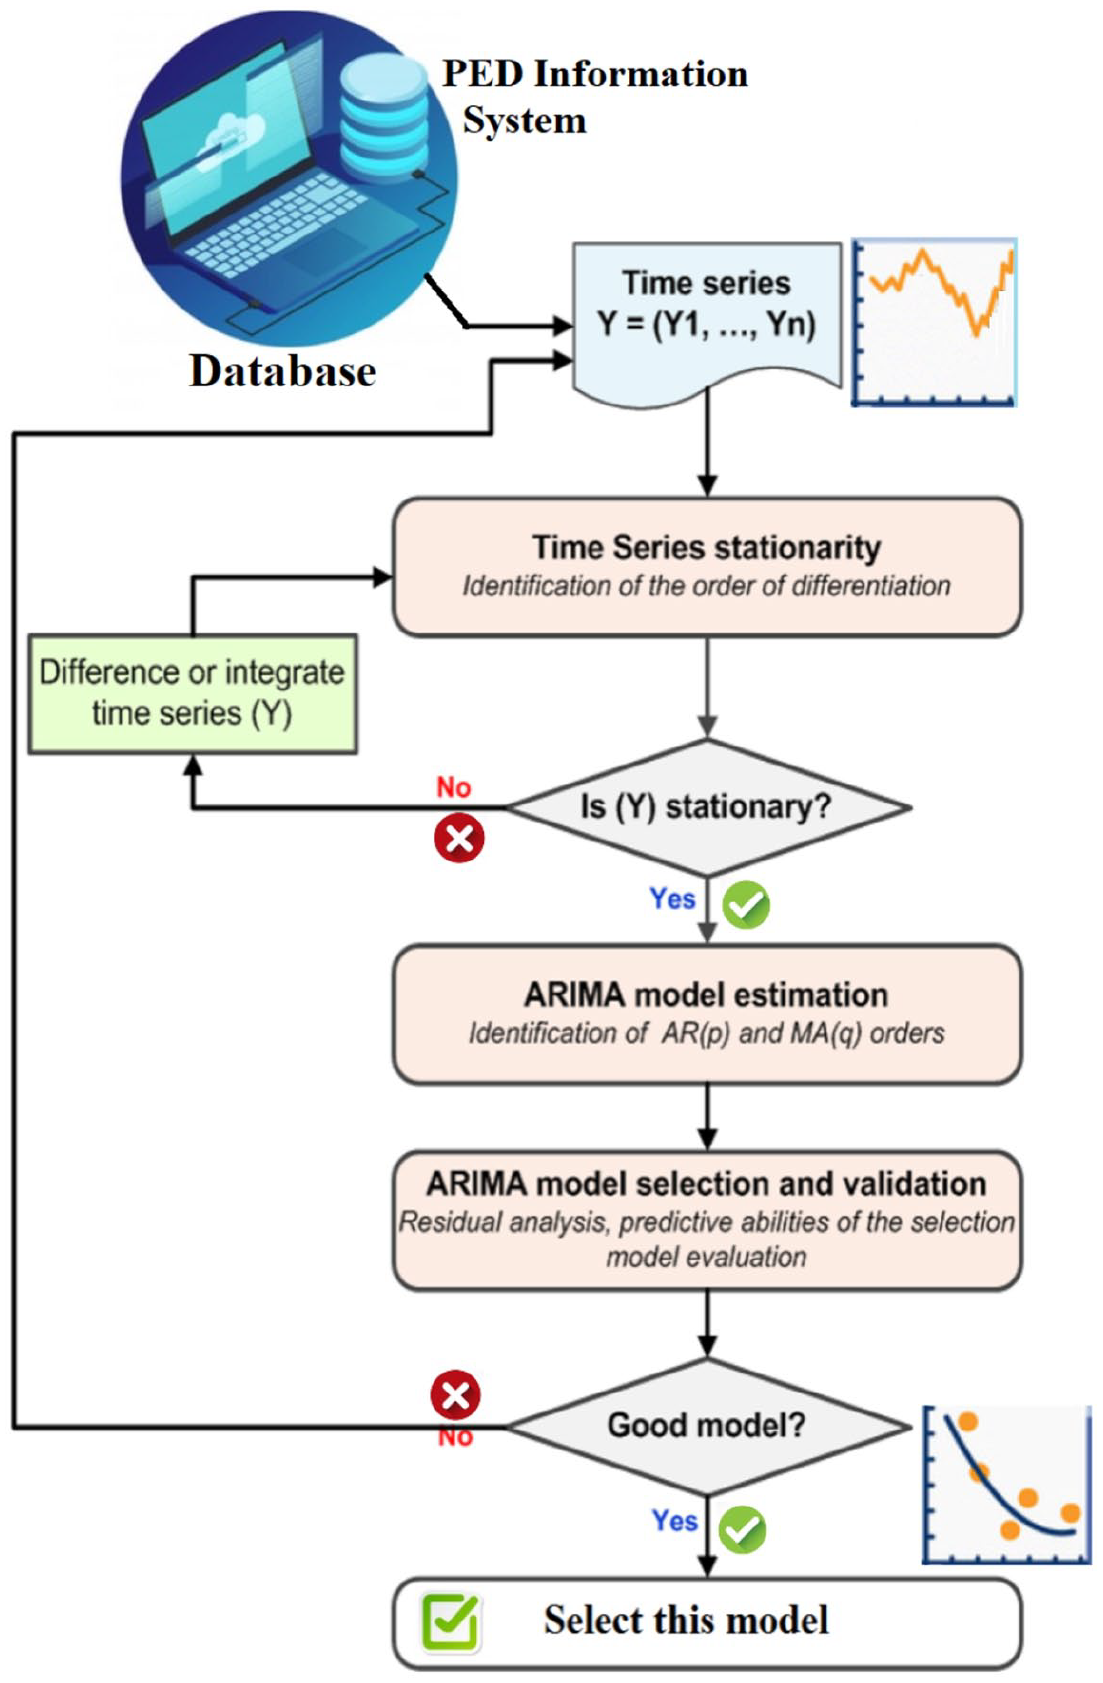
Flowchart of time-series modeling using ARMA.
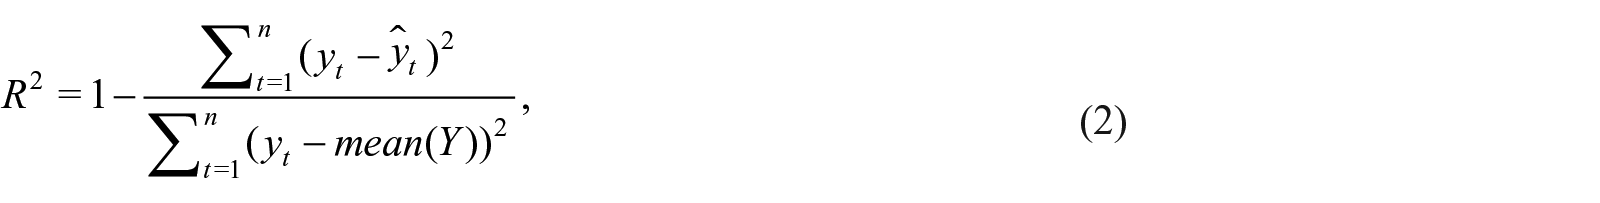
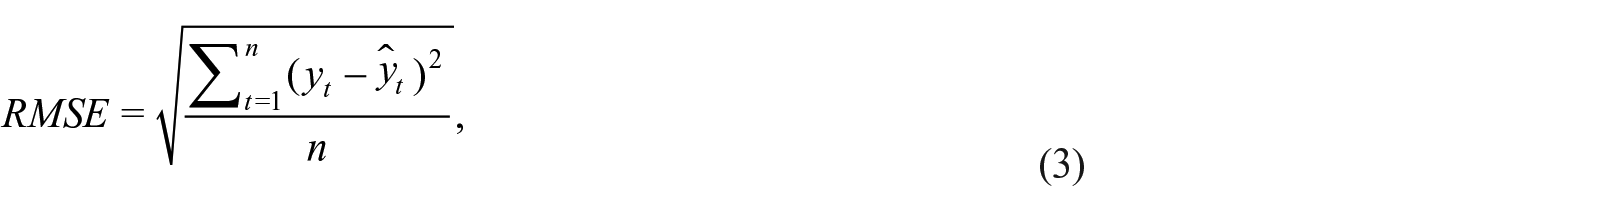
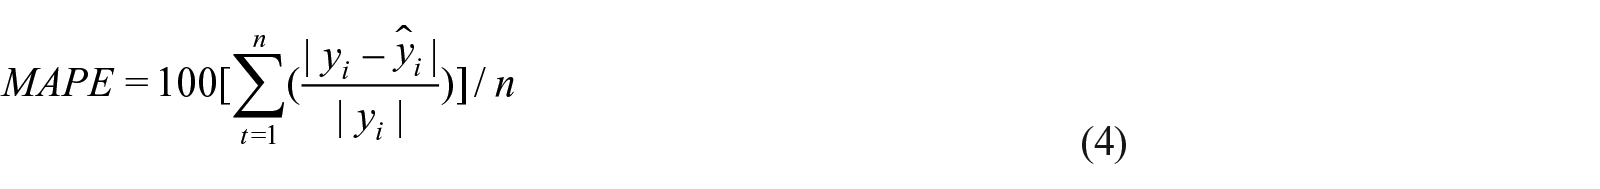
The most suitable models chosen are those that provide the best predictions. To this end, the data is split into training and validation data. The ARMA model is first trained using training data and evaluated via the validation data. The quality of the model is accomplished by analyzing the residuals. Several statistical indicators to assess the model quality including
where
GLR-based detector
Within the hypotheses testing framework, the GLR test represents an effective parametric hypothesis test that can be applied for detecting anomalies and outliers in time series data.
38
It gained a special attention in variety of applications, such as pollution monitoring,
18
road traffic monitoring,39,40 imaging analysis,41,42 electronic systems,
43
and train positioning via satellite.
44
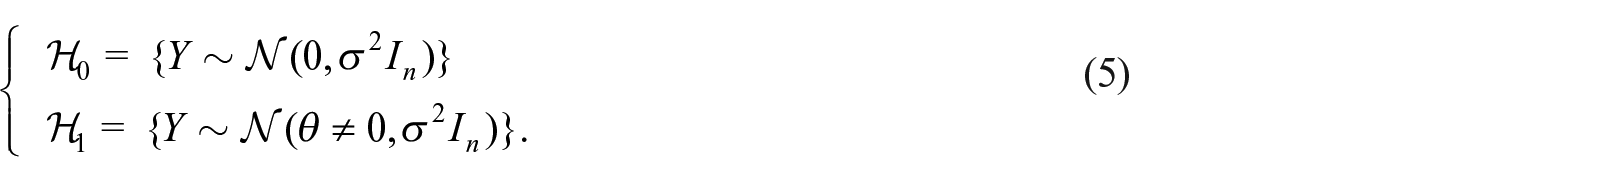
Essentially, the essence of the GLR test is to decide among a null hypothesis
Here,
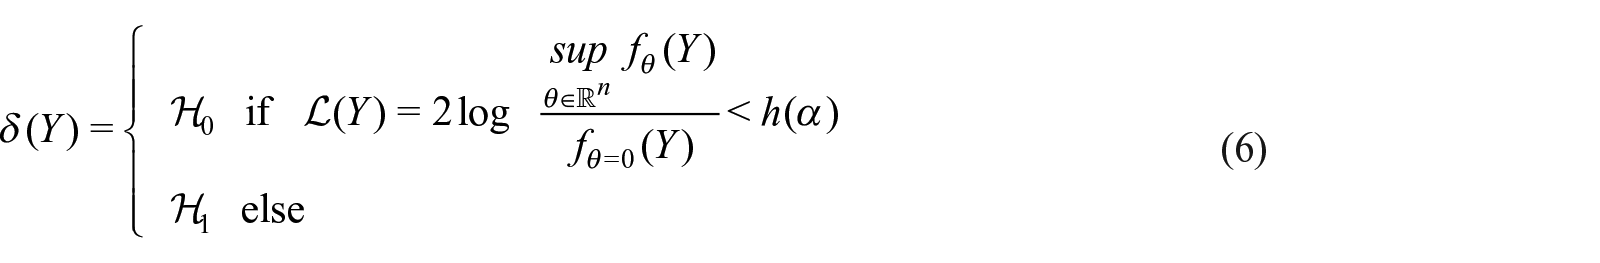
Consequently, the GLR detection statistic,
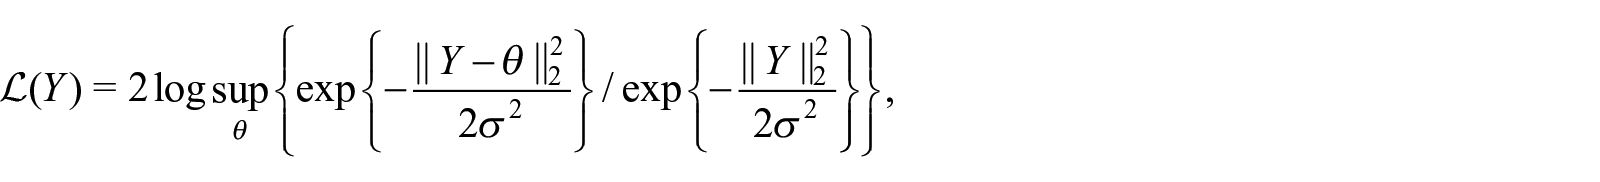
where
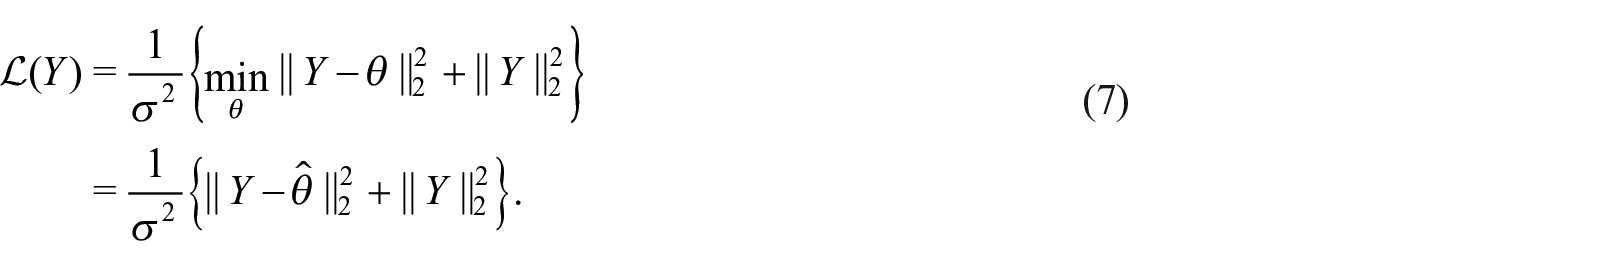
The estimation of

It is worth noticing that the detection threshold

In sum, an anomaly is flagged using the GLR detector if the GLR charting statistic is above the detection threshold,
Anomaly detection using an ARMA-based GLR test
The aim of this study is to detect abnormally high patient demands in ED using based on ED visits time-series data. To this end, we first design an adequate ARMA model to describe the nominal patient flow in ED using data when the ED is operating at a normal state. The reference ARMA model will be used for monitoring the possible abnormal demand for ED services. In other words, the ARMA model is designed based on anomaly-free data and then adopted for monitoring new data. In short, it is used to generate residuals for anomaly detection (Figure 2). Indeed, residuals, which are the difference between the measured and estimated data obtained from the selected ARMA model, are adopted as an indicator to detect ED demand abnormality. The residuals offer pertinent information about the presence of abnormal conditions. Residuals reflect the operating conditions of the inspected ED, in the absence of a stressful situation, the residuals are close to zero, while residuals become larger in the case of abnormally high patient demands in ED. The GLR-based monitoring approach is applied residuals to check the concordance between the patient influx and the predicted influx form the ARMA model (Figure 2). An abnormal event is reported if the residuals surpass the GLR detection threshold. Of course, the general procedure of the developed strategy for monitoring patient flow in a hospital emergency department is depicted in Figure 2.
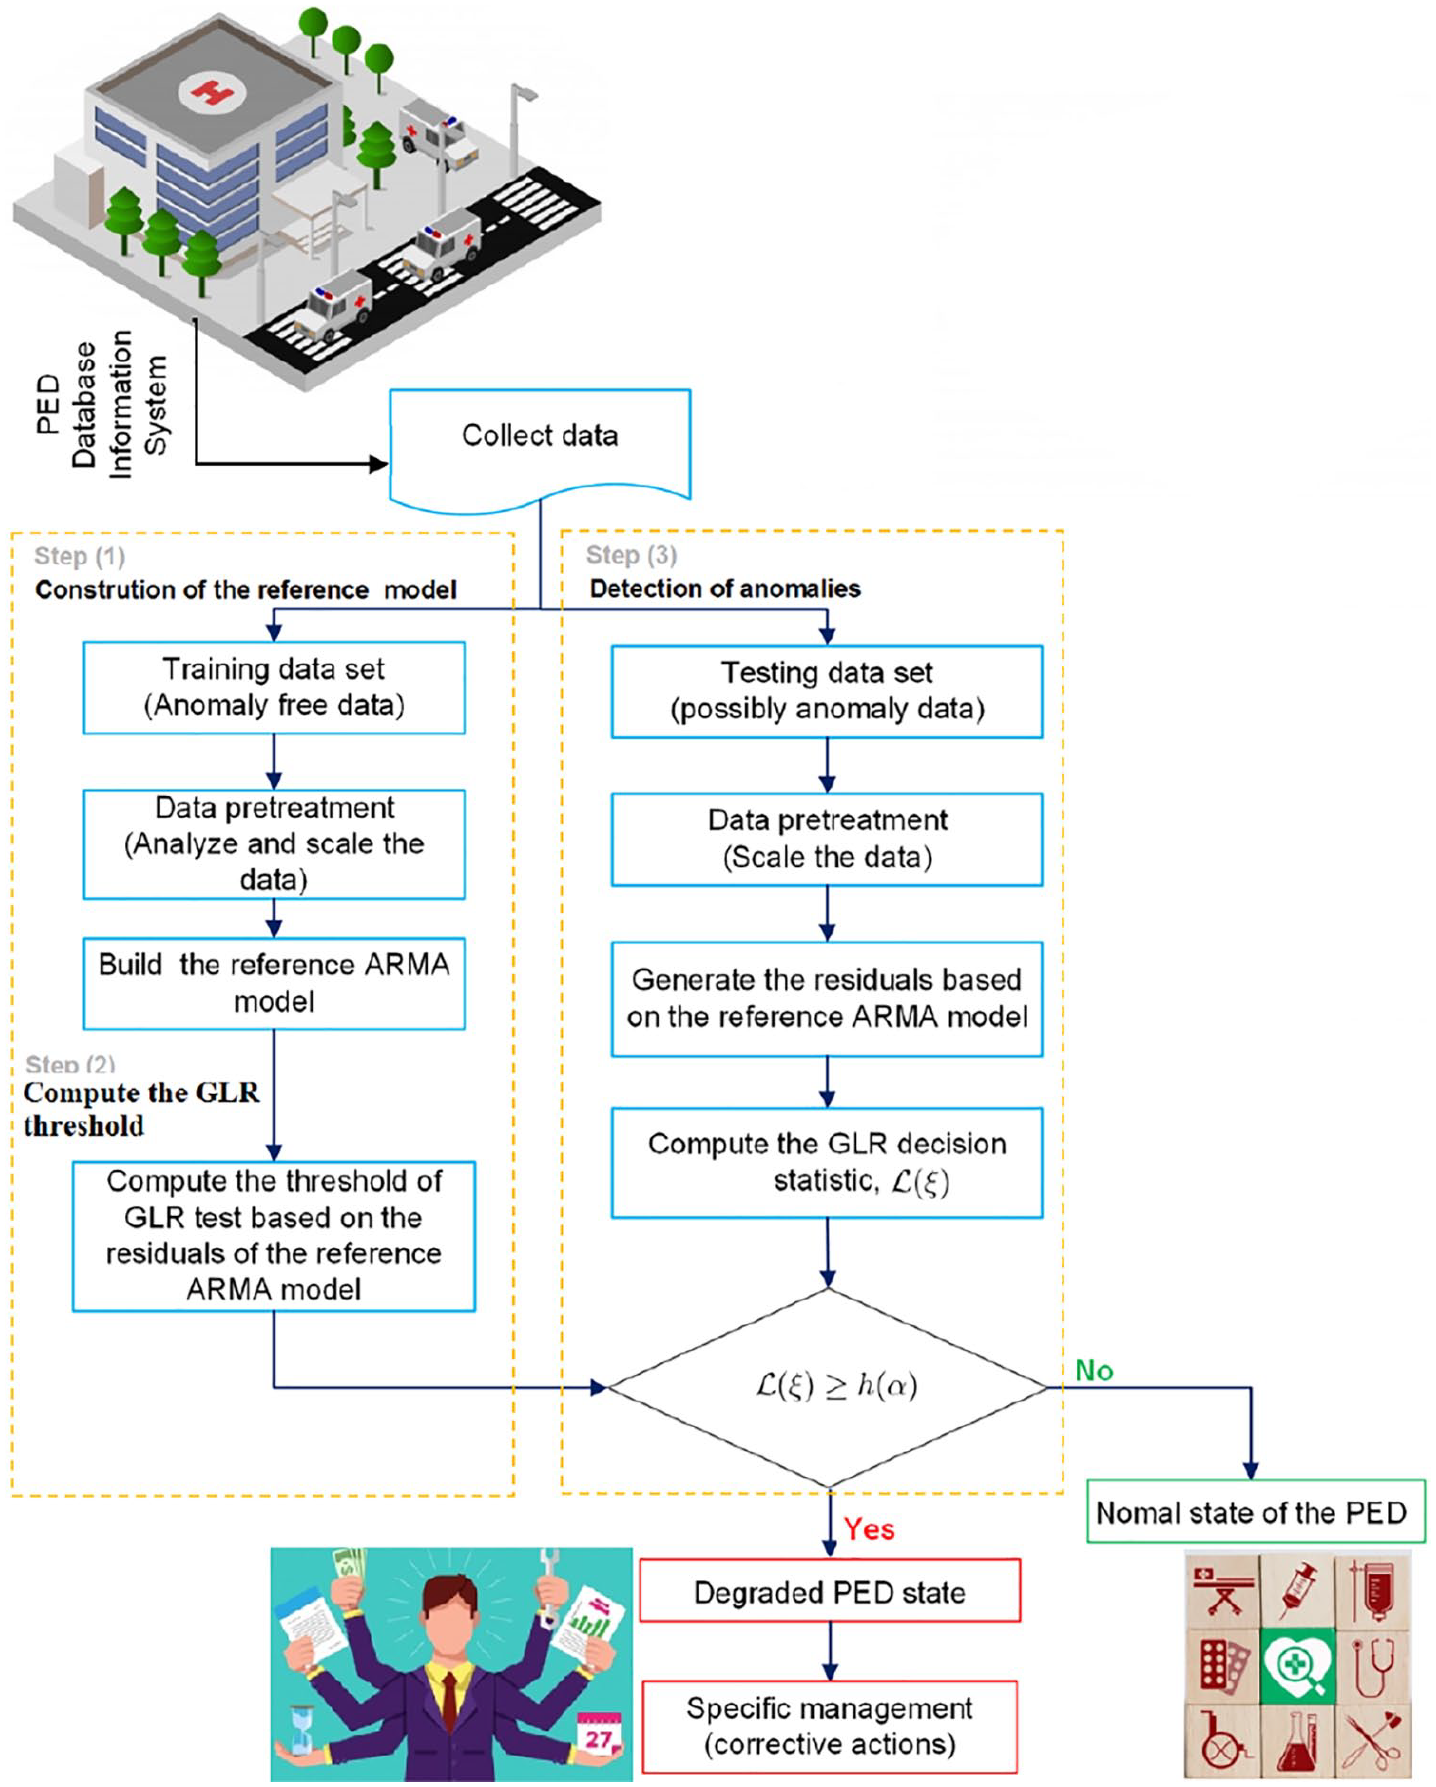
Flowchart of the developed strategy for detecting an abnormal situation.
KDE-based GLR detection threshold
When the underlying process is with non-normal or unknown distribution, KDE can effectively estimate the probability distribution of such observations. To extend the flexibility of the proposed monitoring approach, the detection threshold of the GLR test is computed in nonparametric way using KDE. Assume that


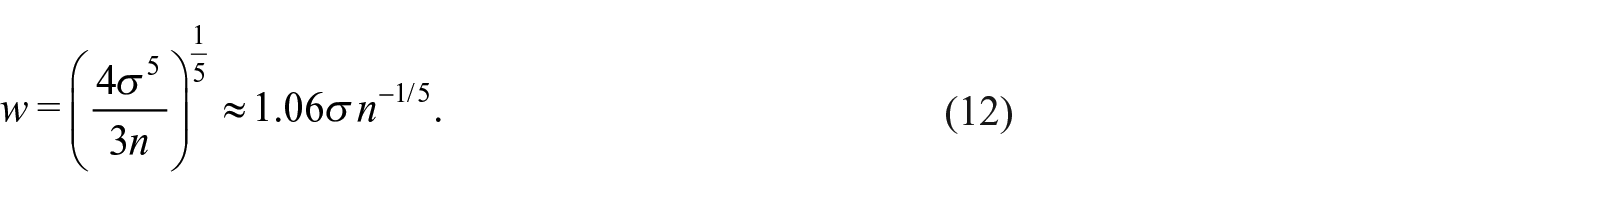
For fitting long-tailed distributions and outliers, a robust estimation of
The detection threshold, h(


The detection threshold, h(

where
Case study
This study is accomplished using data for arrivals to the PED in CHRU-Lille. The CHRU-Lille hospital assists around four million inhabitants in Nord-Pas-de-Calais in France, and its PED admits on average 23,900 patients per year. Also, the PED shares with other hospital departments access to its resources (e.g. clinical laboratory, scanner, and X-rays). The daily attendance to the PED from January 2012 to December 2012 is used in this study. The second co-author has full access to these data following a collaboration with the PED in CHRU-Lille during a HOST research project.
Data analysis
In this study, a time series model has been adopted to construct a descriptive model for patient attendance at the PED dataset. Firstly, we perform a descriptive study of the data to summarize their main characteristic features. A key preliminary step in the time-series analysis is plotting the original observations over time to get simple descriptive measures of the principal characteristics of the series. This enables to preliminarily evaluate data patterns and behavior over time and may reveal relevant features of the series, such as trends, outliers, discontinuity, and seasonality. Figure 3 indicates that daily visits are almost stable during the period of the data set. we can observe the absence of a long-term trend or seasonality in this time-series data (Figure 3). This can be confirmed with the Phillips-Perron test with a p-value of 0.01 less than 5%. Prior to model construction, the data is scaled to zero mean-centered with unit variance.
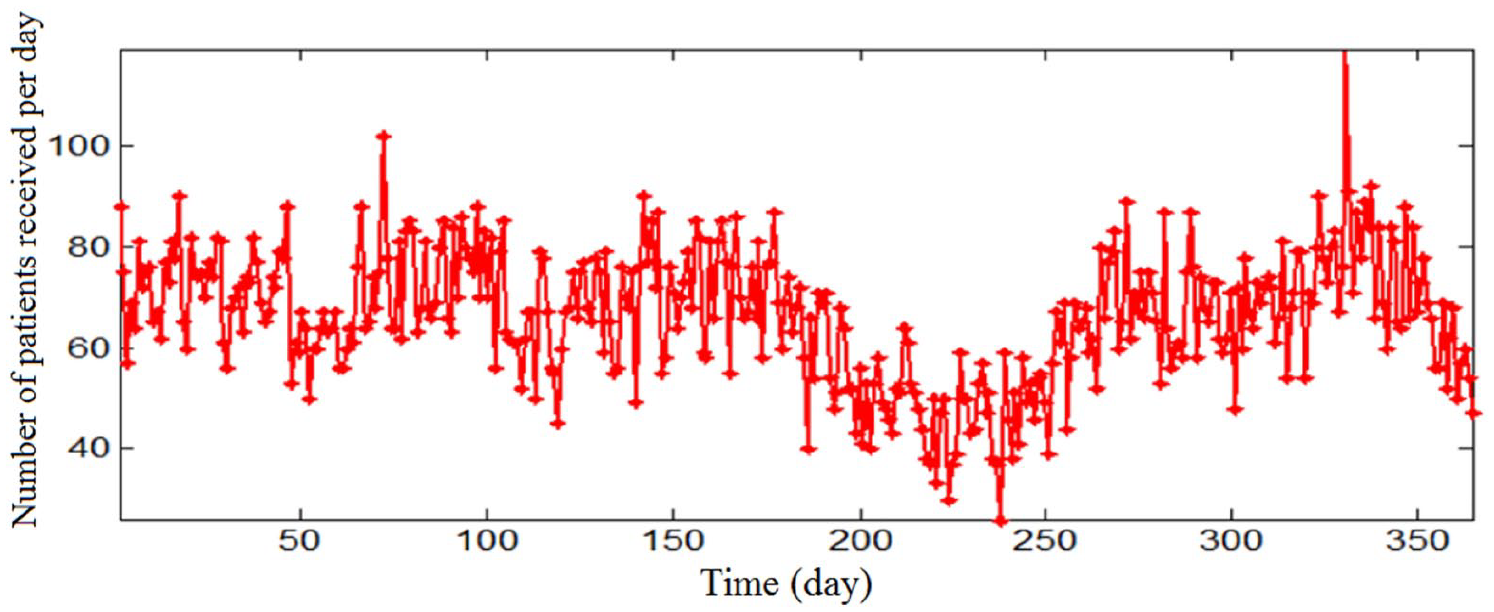
Daily visits at the PED from Jan to Dec 2012.
The catalog of descriptive statistics for the daily patient arrival at the PED presented in Table 1 shows the highest attendance on Sundays and Mondays (69 patients). But in general, the average number of patients arriving at the PED is well distributed on all days of the week.
Descriptive statistics of the PED demands per day of the week.
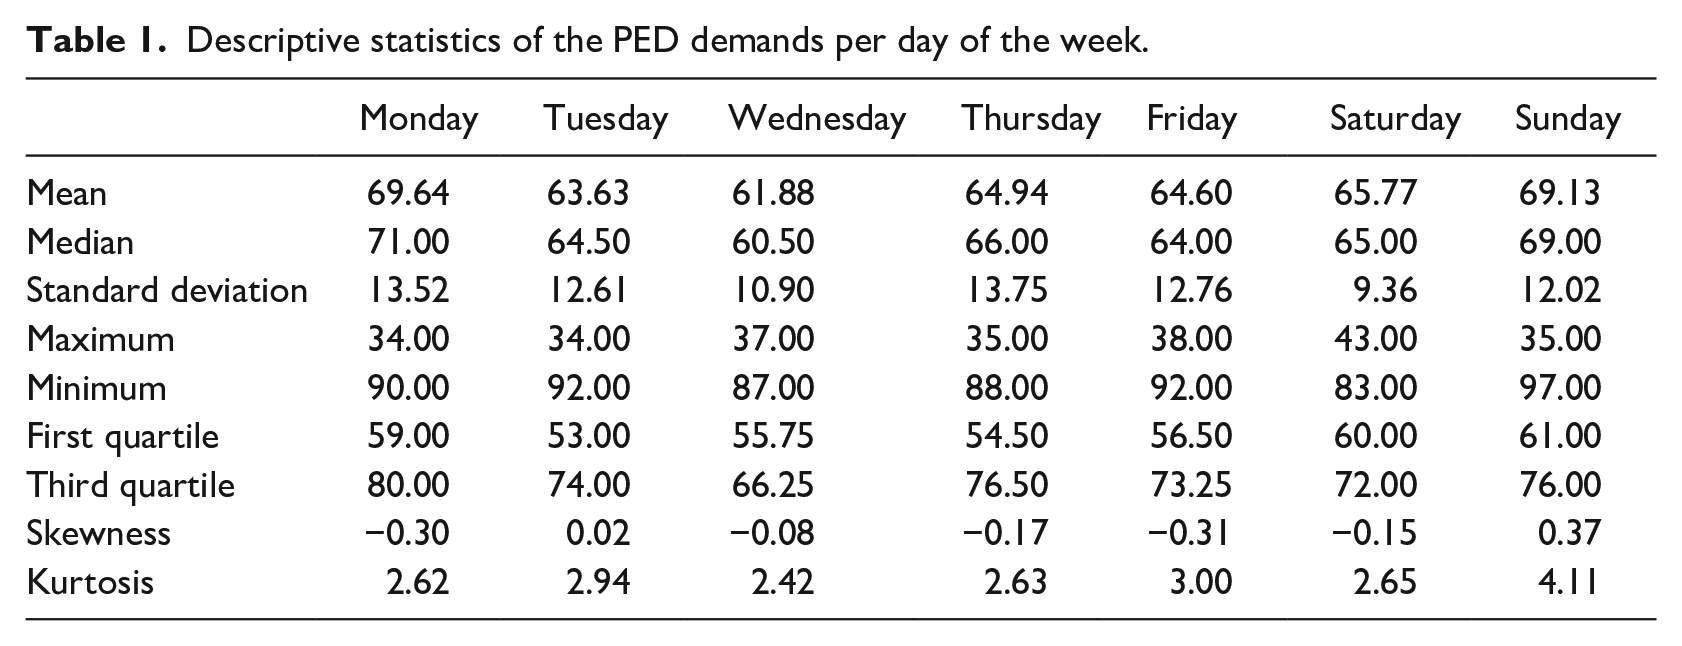
Figure 4 shows the autocorrelation function (ACF) of the daily PED visits data given in Figure 3. Indeed, the plot of the sample ACF, also called a correlogram, often helps to interpret a set of autocorrelation coefficients and to construct models for time-series data. From Figure 4, we observe the presence of an important short-term dependence (short-memory) in data. To model short-term correlations in a time series, the ARMA model can be used.
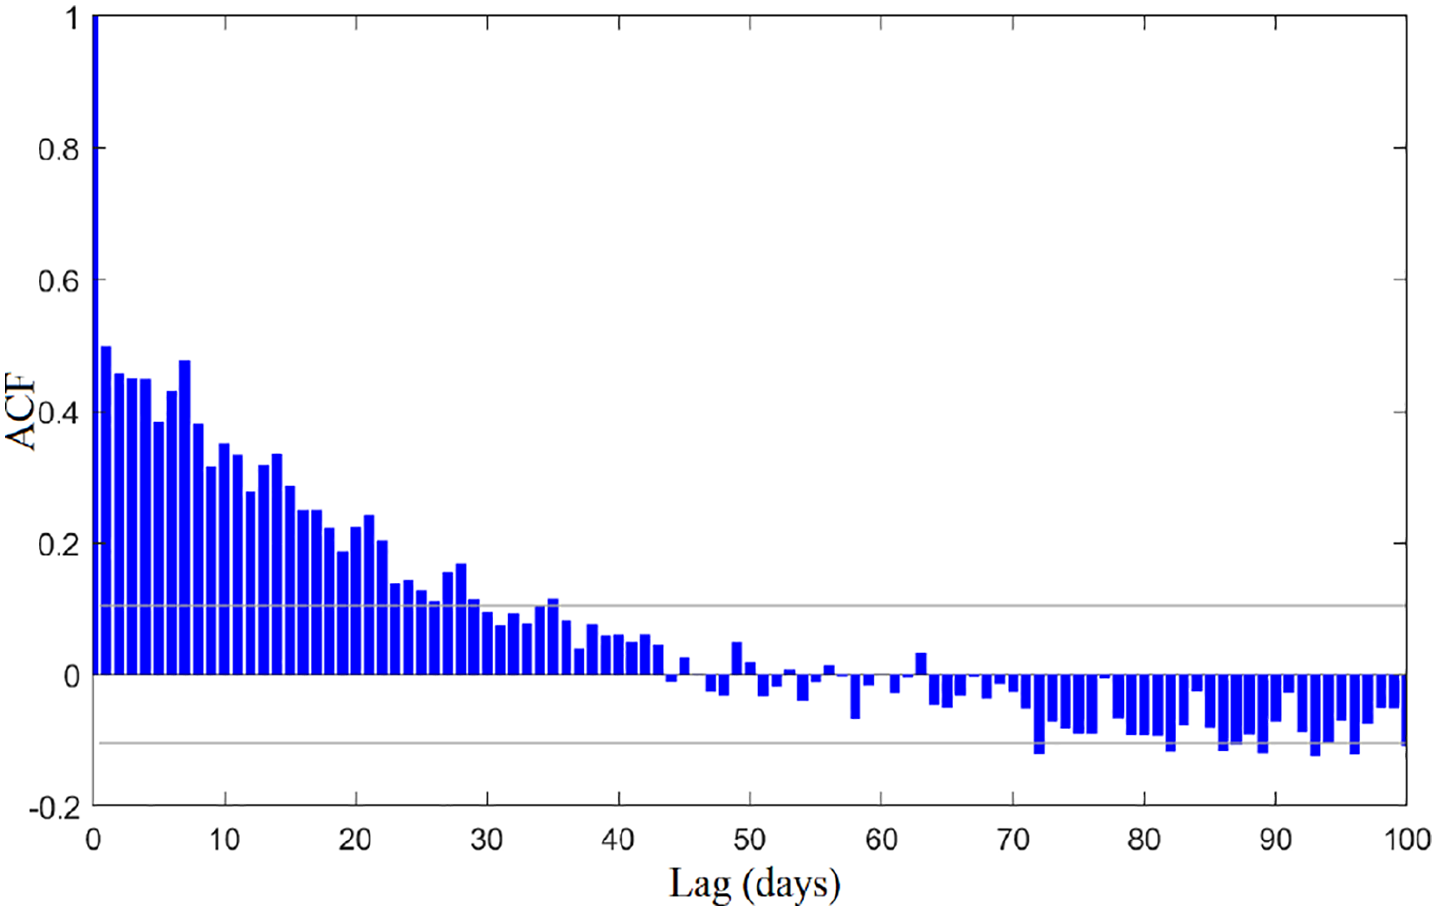
Autocorrelation function of daily patient attendance at PED.
Modeling of PED patient attendances
An ARMA time series model structure is quite enough to model the patient visits at the PED. To estimate the parameters of the selected ARMA model, the method of maximum likelihood estimates is used. 34 The best-fitted model was ARMA(1,1). The maximum likelihood estimates and their standard errors for this best-fit model ARMA(1,1) are presented in Table 2.
Model parameters.
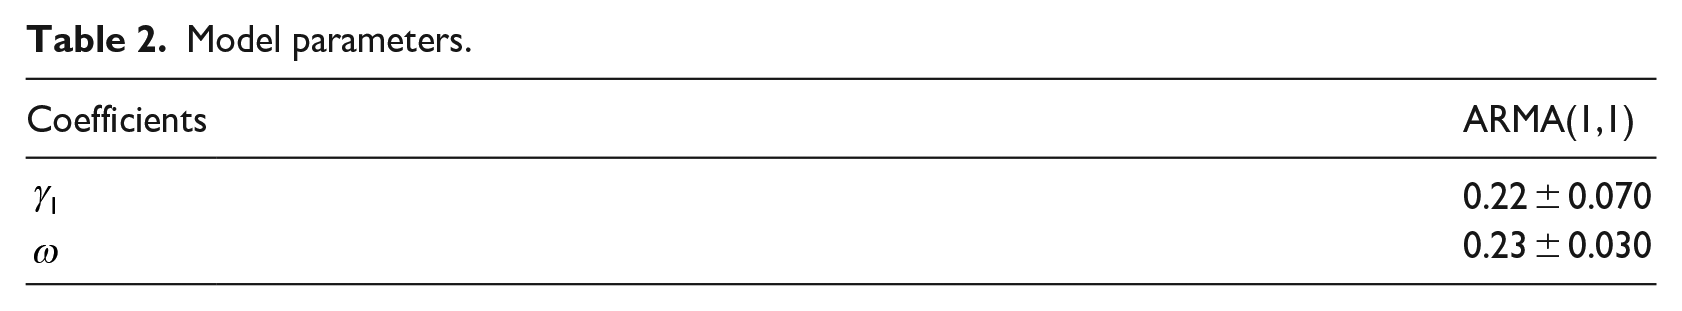
Figure 5 shows the observed and predicted daily attendance obtained from the selected ARMA model. According to Figure 5, the observed data are well-adjusted by the selected model.
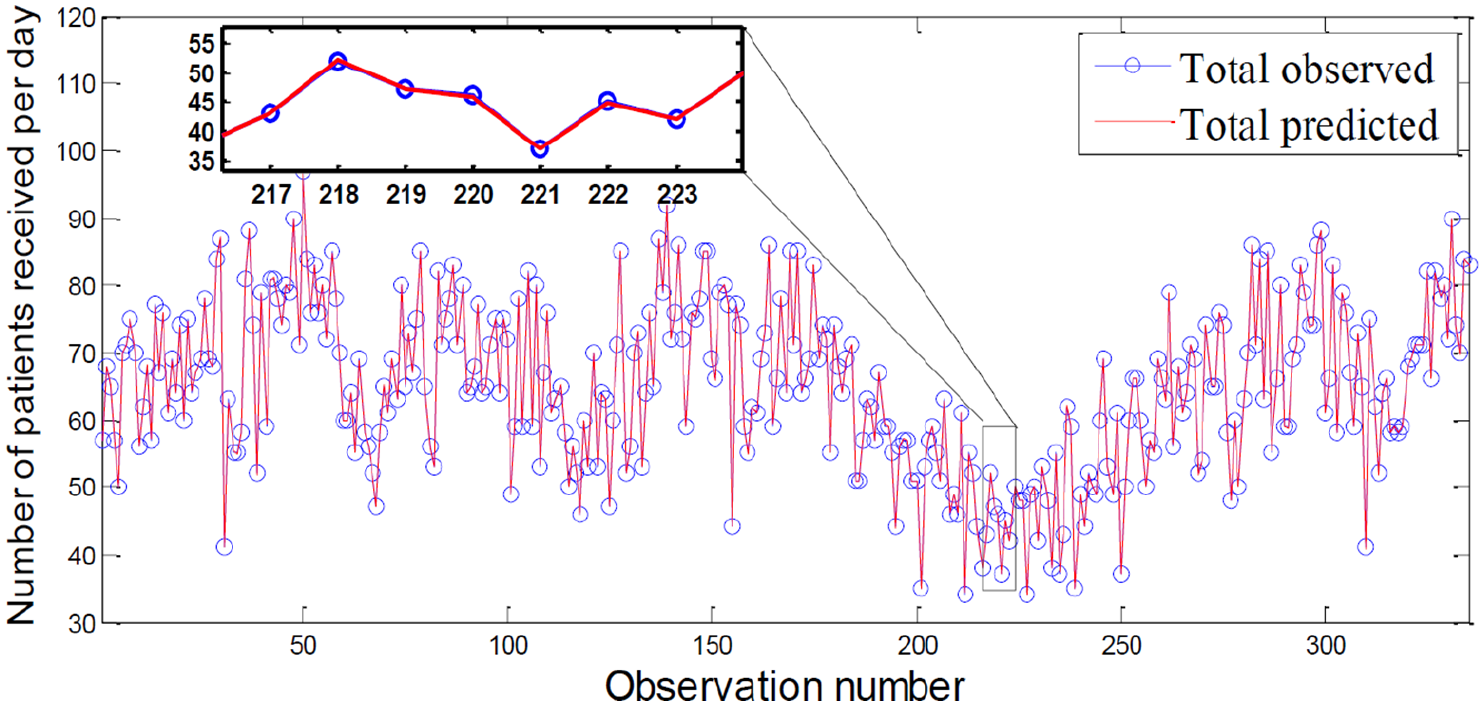
Observed and predicted daily attendance. The blue line and circles represent the actual observed patient visits to the PED included in the training sets, while the red line indicates model fit.
Figure 6 depicts the scatter graph of recorded and estimated PED visits using the ARMA model and the regression line; from which it can be noticed that this scatter plot indicates that the selected model performed reasonably well.
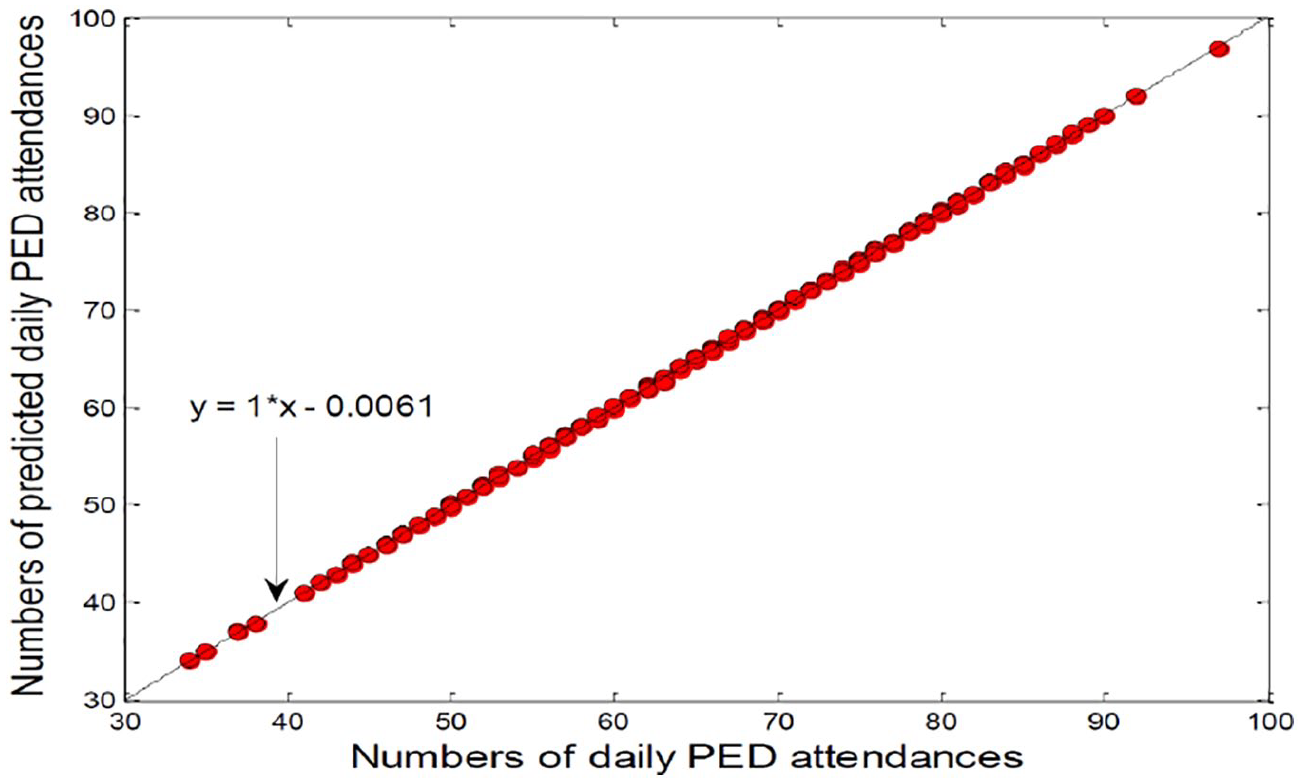
Scatter graph of estimated and recorded PED visits from Jan to Dec 2012.
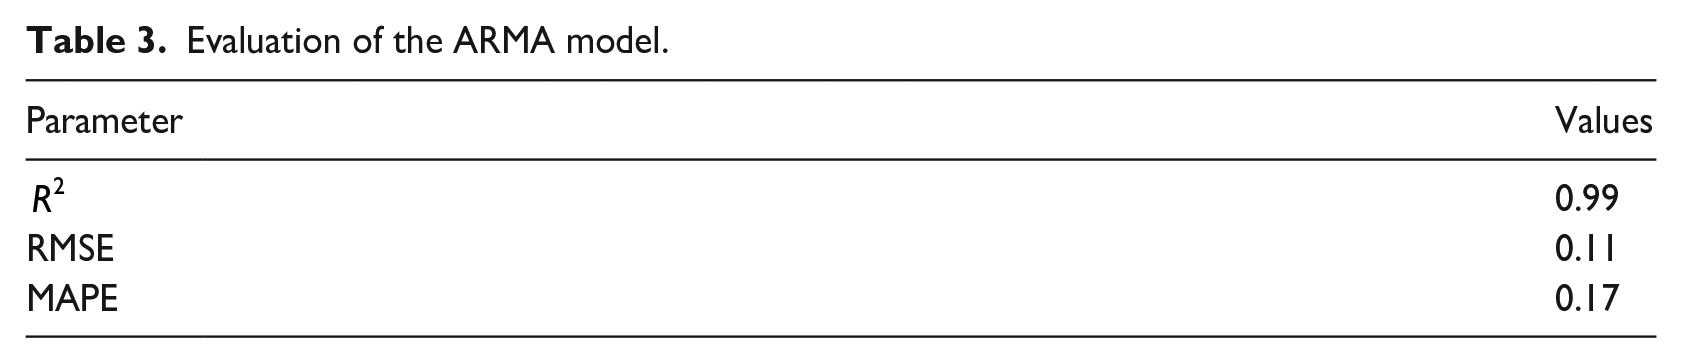
Furthermore, goodness-of-fit results for the daily attendances at PED data studied are summarized in Table 3. Results in Table 3 show that the selected ARMA (1, 1) model with the selected parameters describes well the daily attendances data. The
Evaluation of the ARMA model.
Analysis of the residuals
The second step of modeling is aimed at analyzing and evaluating the residuals of the selected model. Figure 7 shows the plot of the residual of the selected ARMA model for daily attendance at the PED. Form this plot, it can be seen a random pattern and small variations around the zero mean, indicating support for the suitability of the selected ARMA model. Figure 8 depicts the scatter plots of residuals versus estimated values computed using the ARMA model. The Figure 8 displays a random pattern showing a good fit for the designed ARMA (1, 1) model.
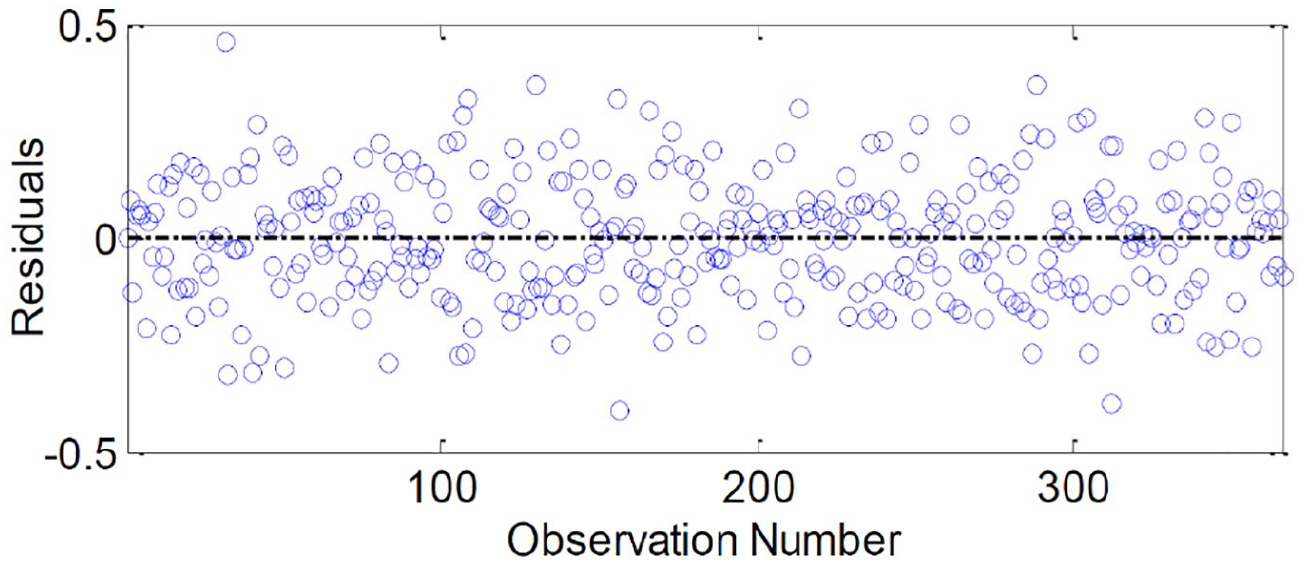
Residuals of the designed ARMA (1,1) model based on training data.
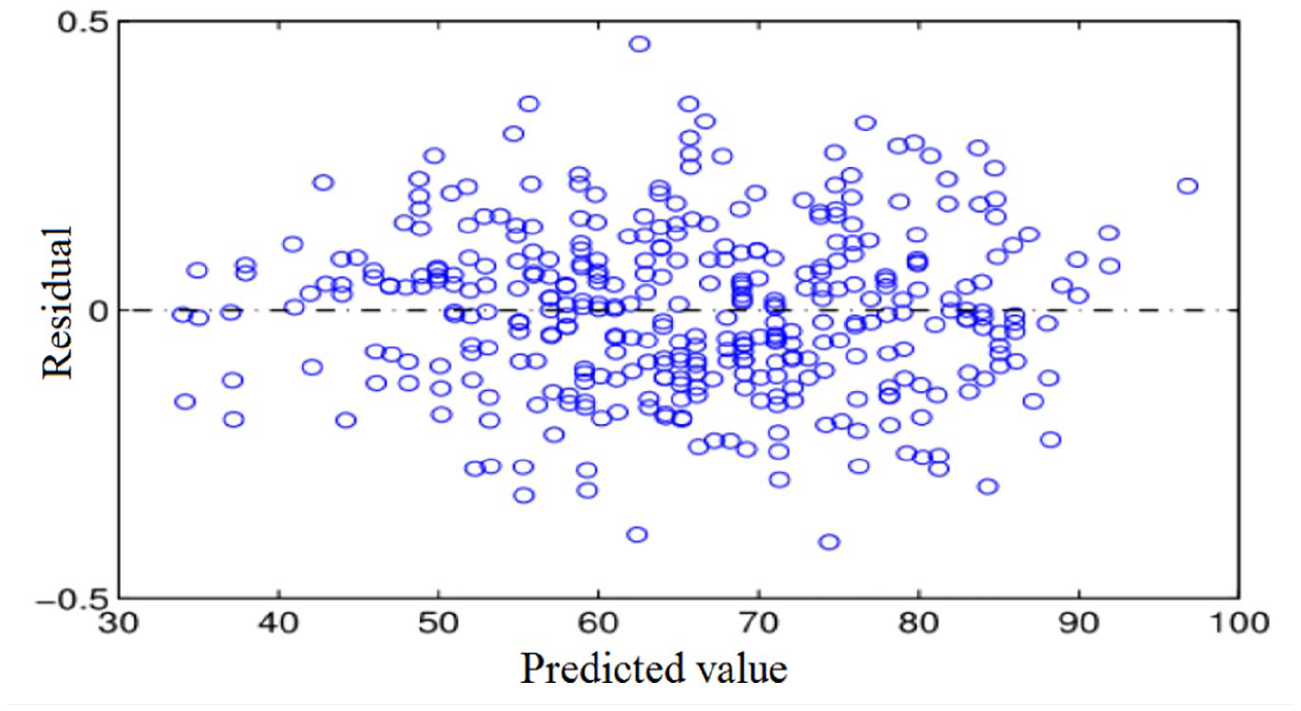
Graphing procedures used to the evaluate equality of the variance: Predicted values versus residuals for selected ARMA model.
Also, to show visually the normality of the residuals, histogram, and Q–Q plot of ARMA’ residuals are presented in Figure 9(a) and (b). Figure 9(a) and (b) shows that the residuals are normality distributed. ACF of residual errors shown in Figure 10 clearly shows the absence of autocorrelation in residuals.
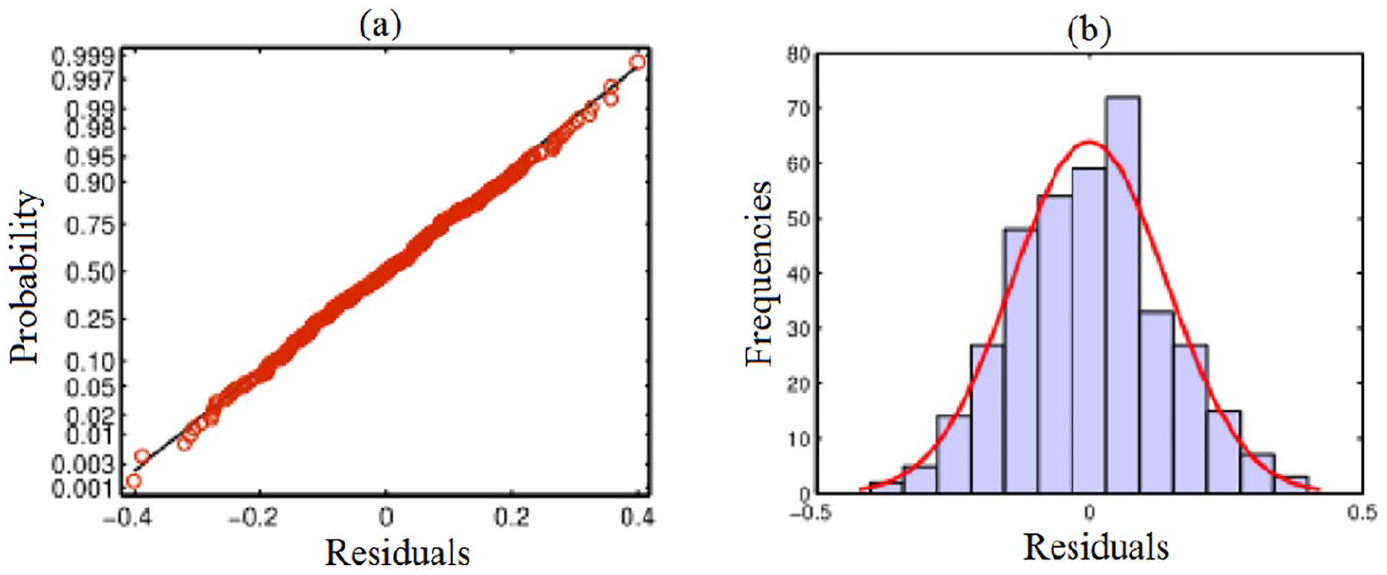
Tests for Normality of residuals: (a) Q–Q plot and (b) histogram.
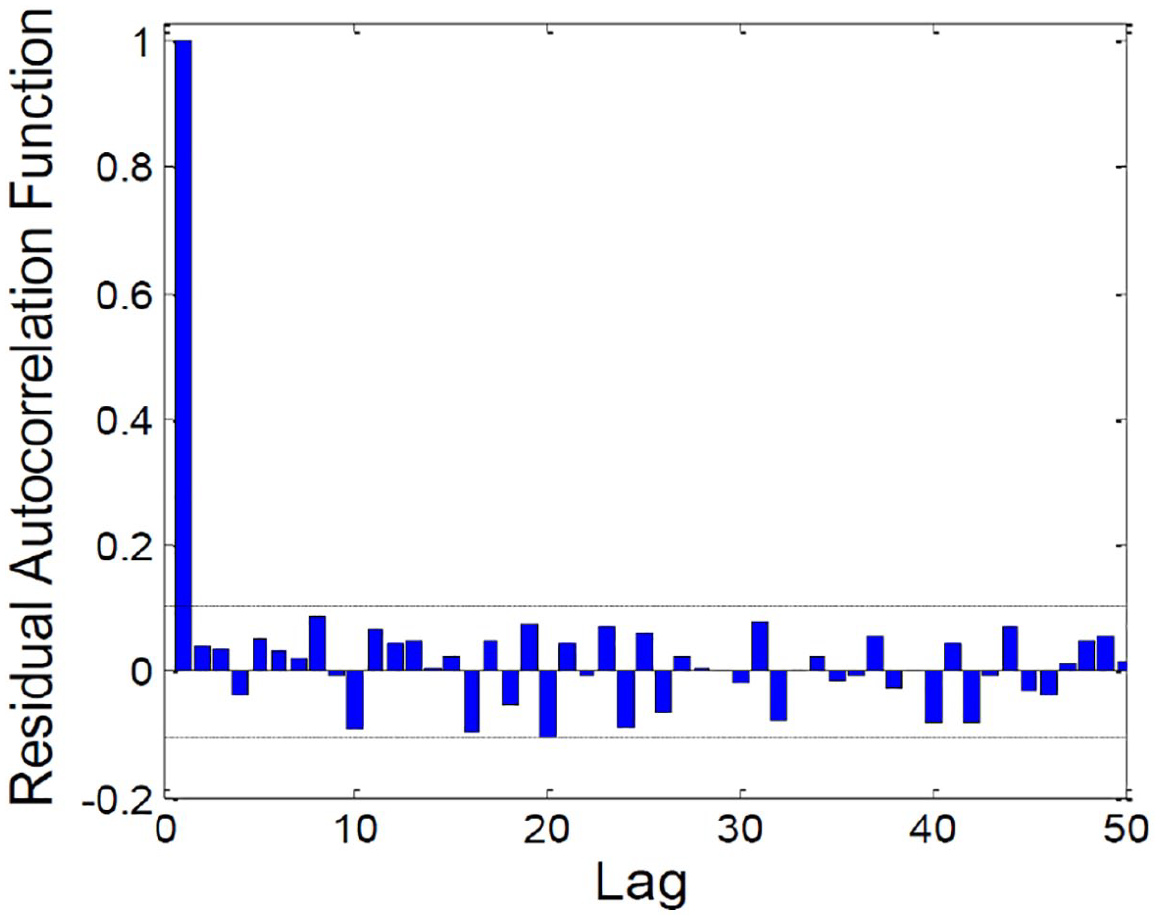
ACF of residual errors.
Figure 11 shows the p-values for the Ljung-Box statistics for lags till 20. The Ljung-Box statistics test if the residuals are uncorrelated or not. 34 It can be seen that all p-values surpass the dashed blue line at 0.05, which means that the model has a reasonable quality of prediction. These results are consistent with the model assumption that the residuals are independent and identically distributed.
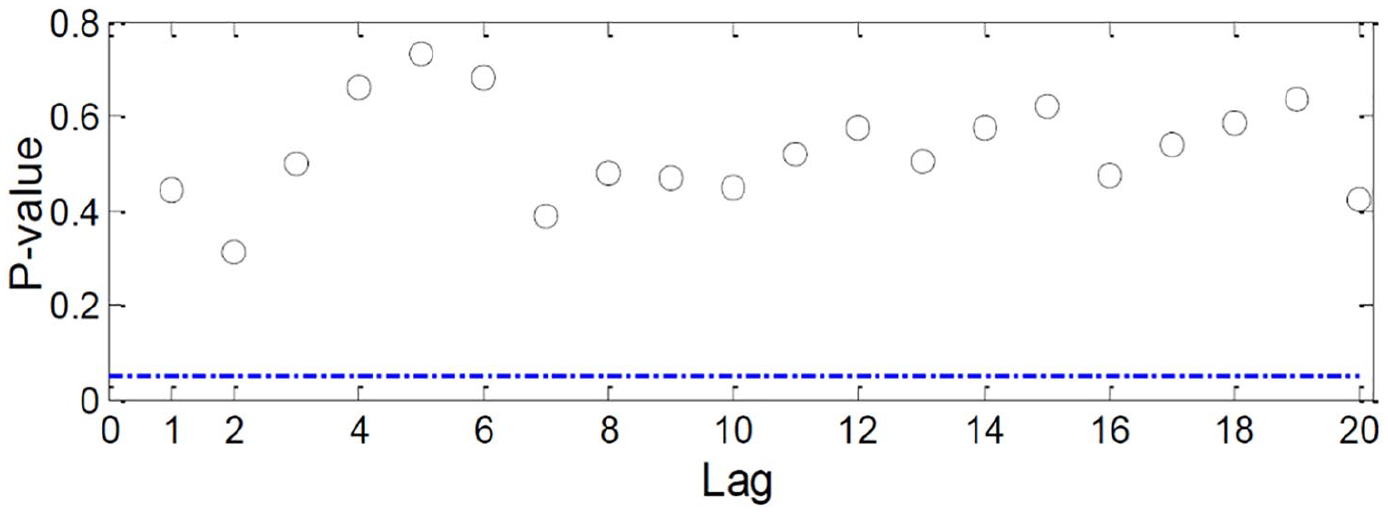
p-Values for the Ljung-Box statistics.
Detection results
This section investigates and evaluates the performance of three residual-based monitoring charts for identifying abrupt or gradual increases in visits at the PED. The three charts are the GLR chart, a Shewhart individuals chart, and the EWMA chart applied to the residuals obtained from the ARMA model. The GLR chart was discussed in detail in Section 3. The details about the basic idea of the Shewhart and EWMA charts can be found.13,14,18,51,52 Two statistical metrics are used to judge the detection efficiency of the three ARMA-based charts: the false detection rate (FAR) and the miss detection rate (MDR). 53 The best approach is characterized by small values of FAR and MDR.
Here, we assess the ARMA-GLR monitoring chart’s detection capability using the time-series data of daily attendance recorded in the PED from January 2012 to December 2012. After building the ARMA model, two scenarios are investigated; one with an abrupt increase of patient flow (case A) and the second with a gradual increase in patient flow (case B). For comparison, we conducted the same tests using Shewhart and EWMA charts.
Case A: Abrupt abnormal situation
Herein, the abilities of the ARMA-GLR monitoring approach for detecting abrupt abnormal situation are demonstrated. Two examples (
(1) In the case study A1, we simulate an abrupt increase of ED visits by adding a small bias to the test data,
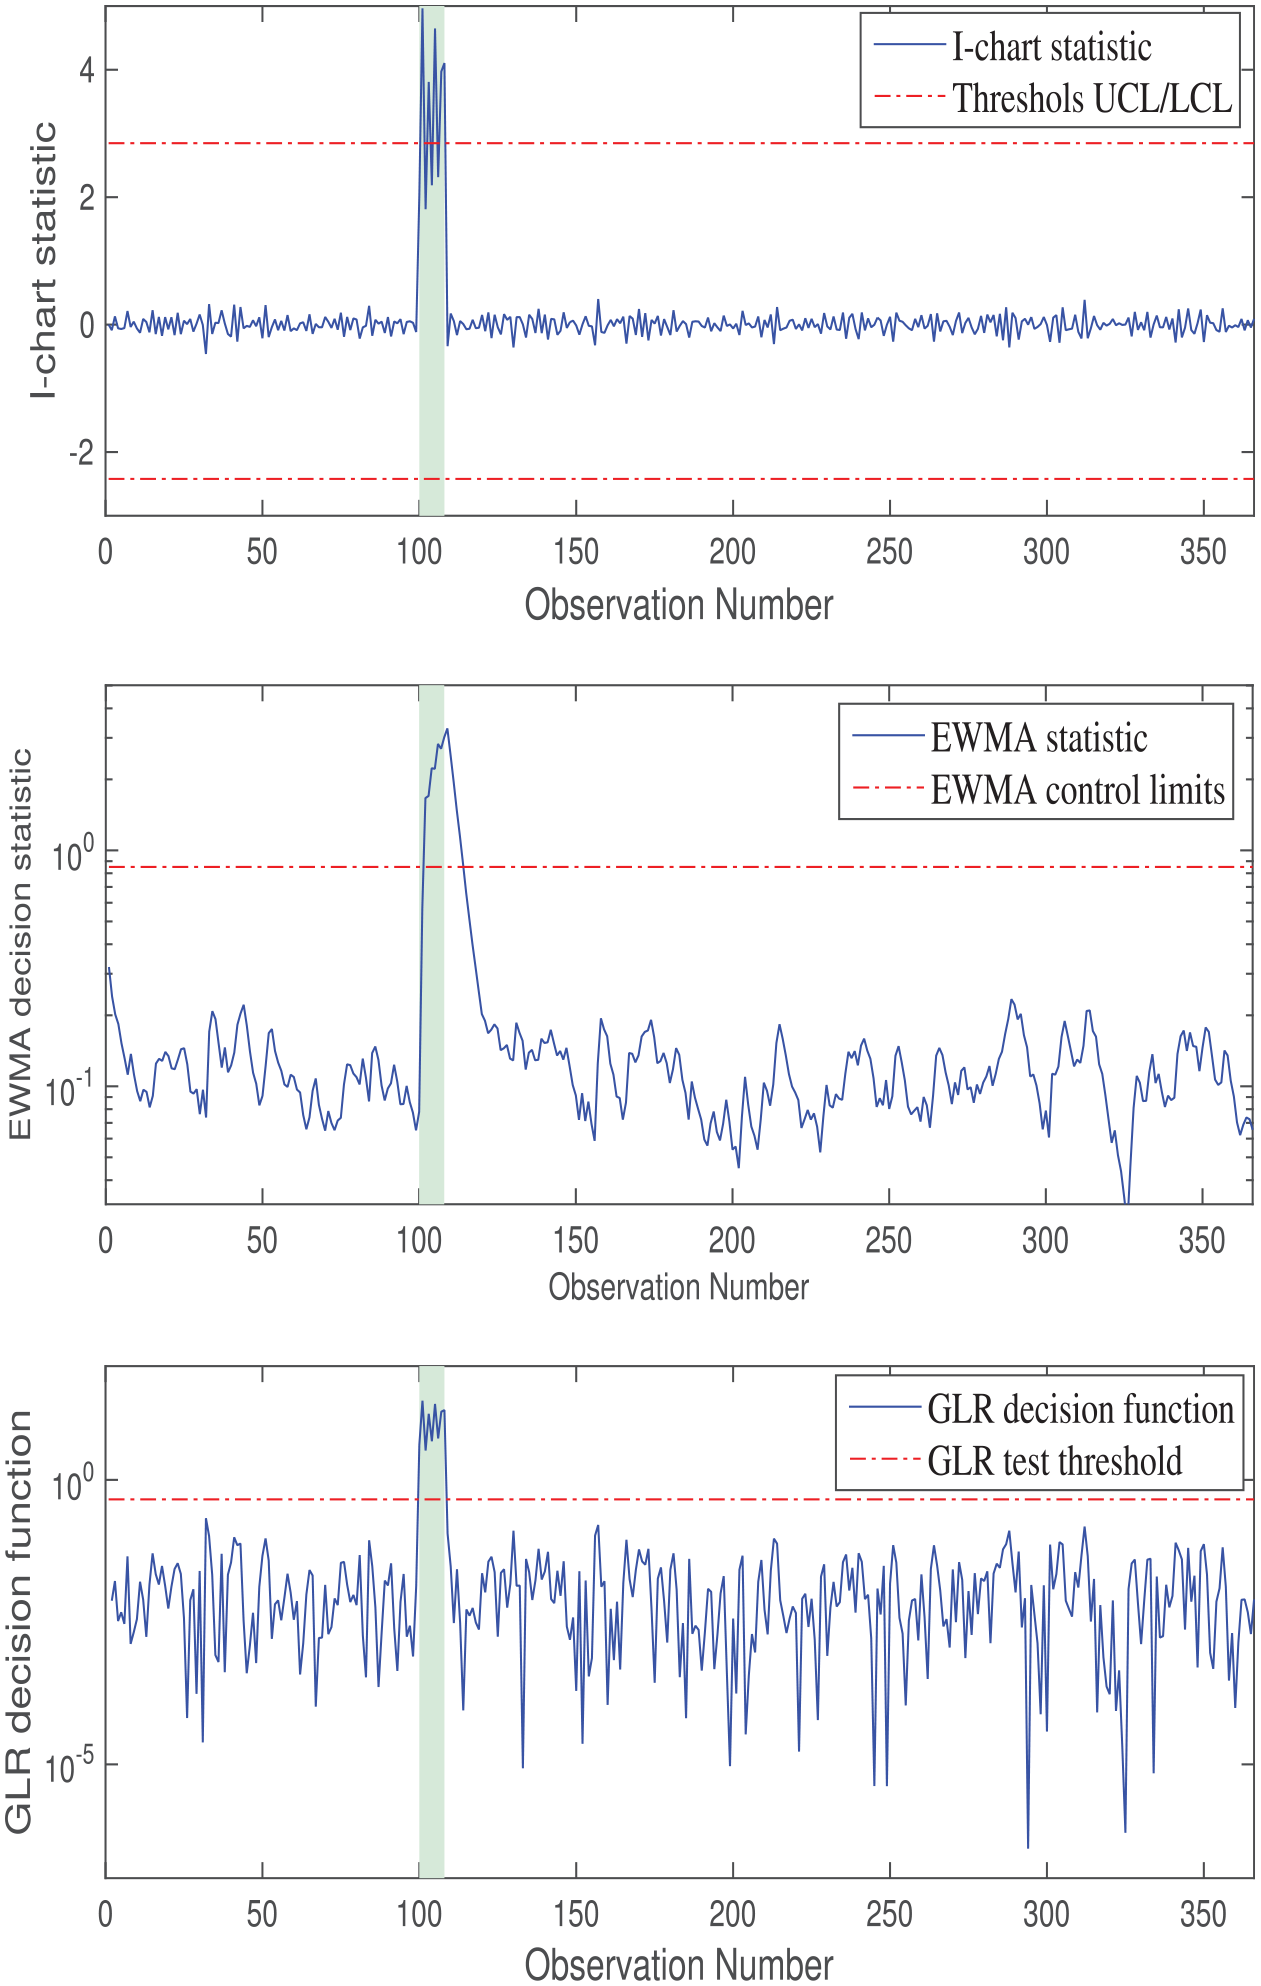
Monitoring results of the ShewhartI-chart statistic (top), EWMA with (
This is because the Shewhart individual chart takes a decision using the actual observation alone, while the EWMA charting incorporates all observations from past samples in addition to the present observation in the decision process. The parameters of the EWMA were chosen as the following: smoothing parameter,
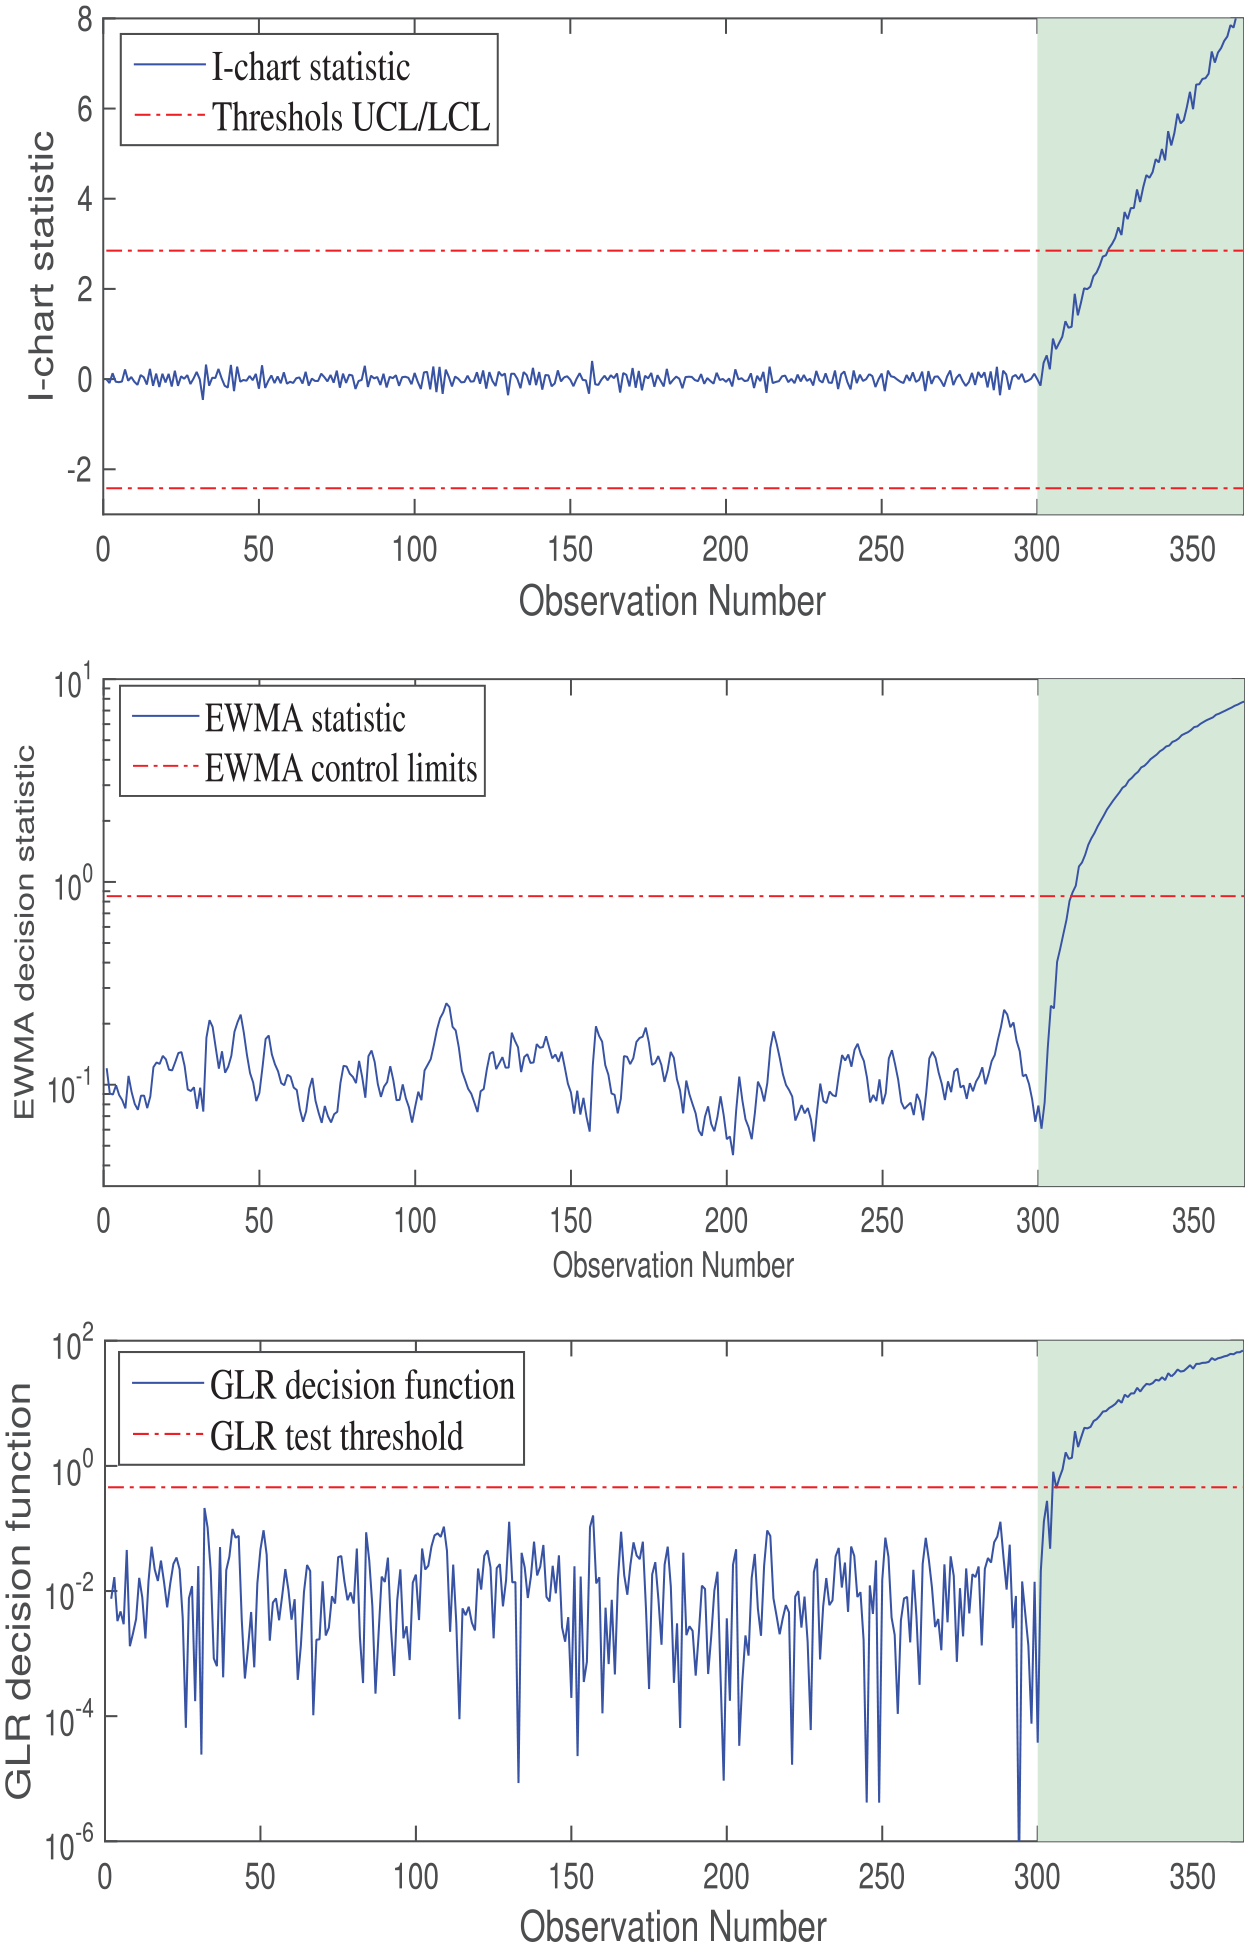
(2) In the case study (
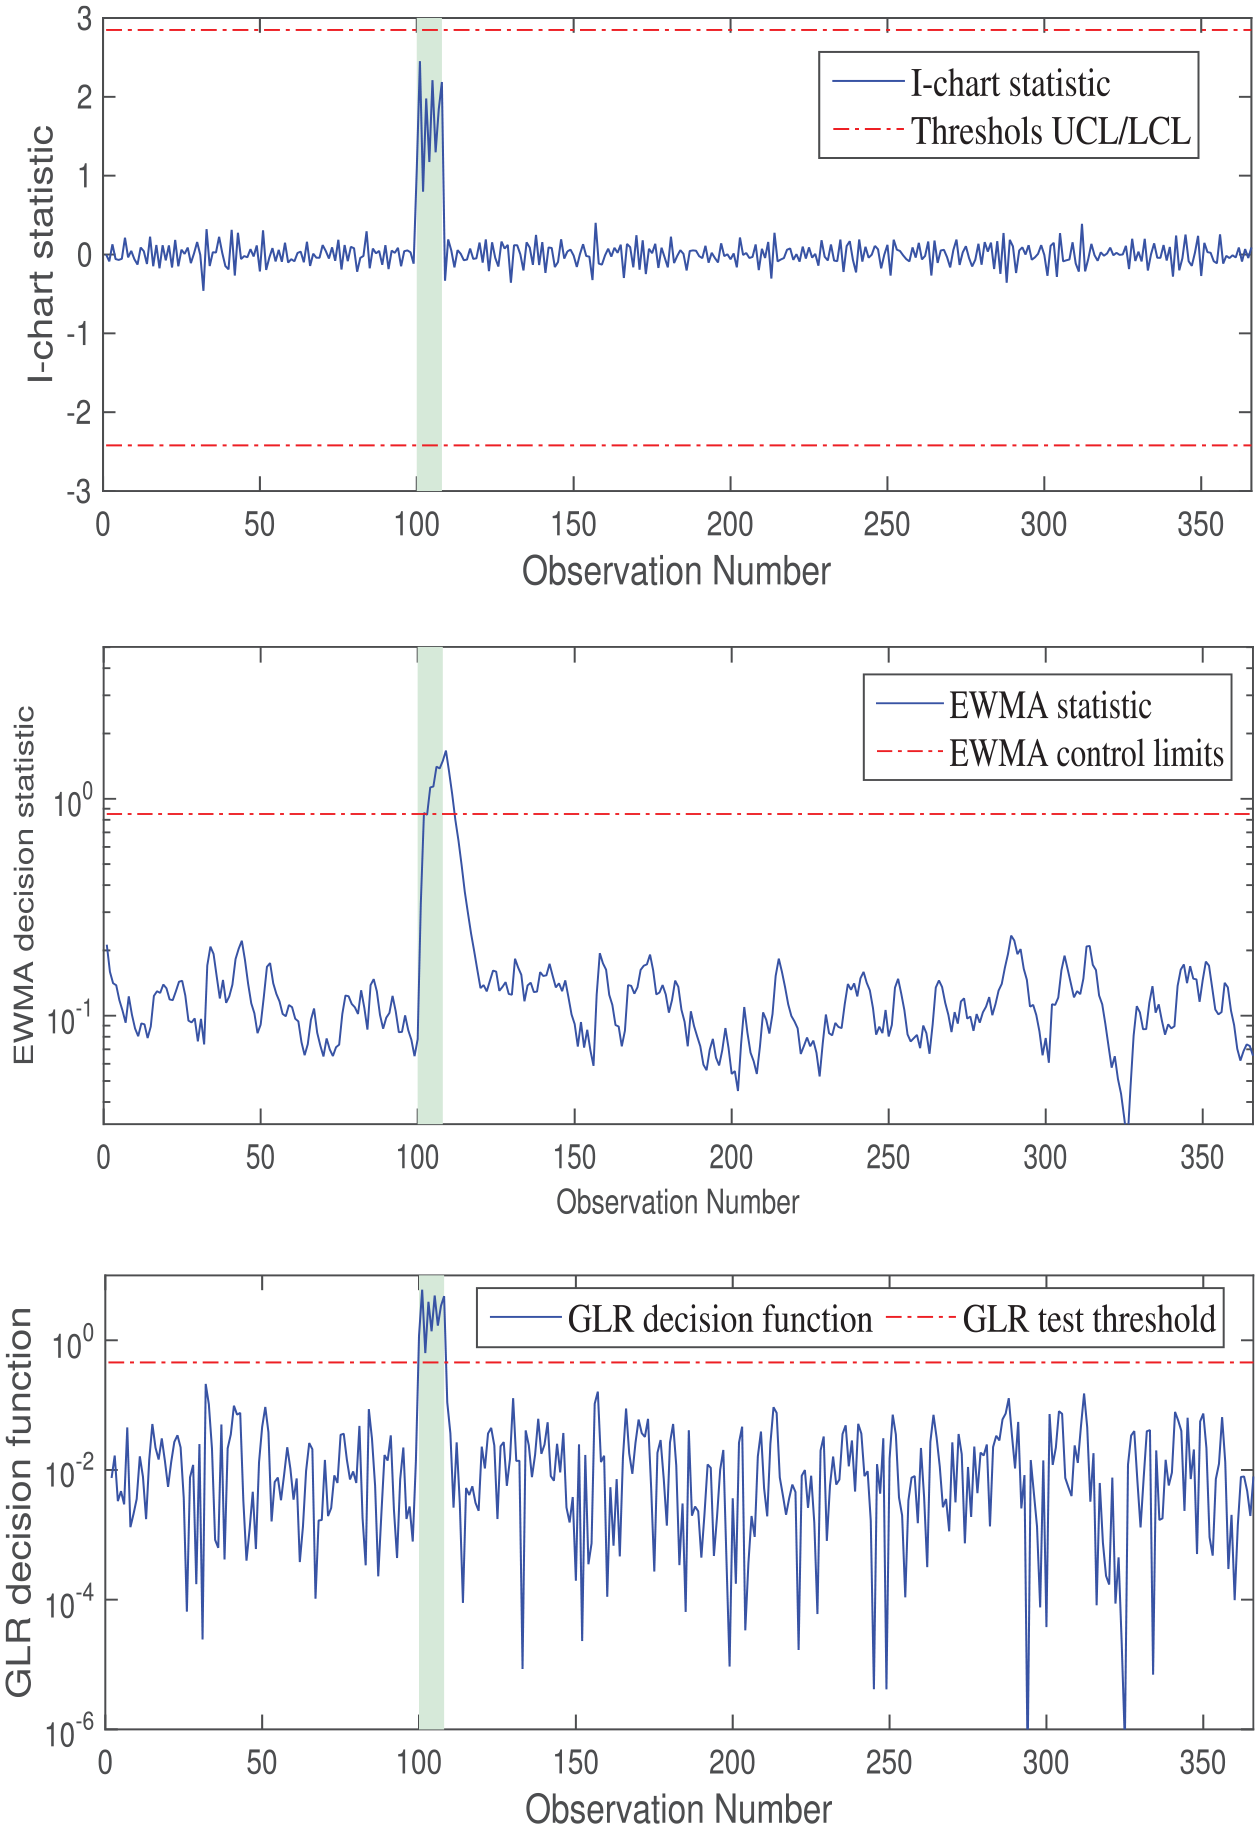
Monitoring results of the Shewhart I-chart statistic (top), EWMA with (
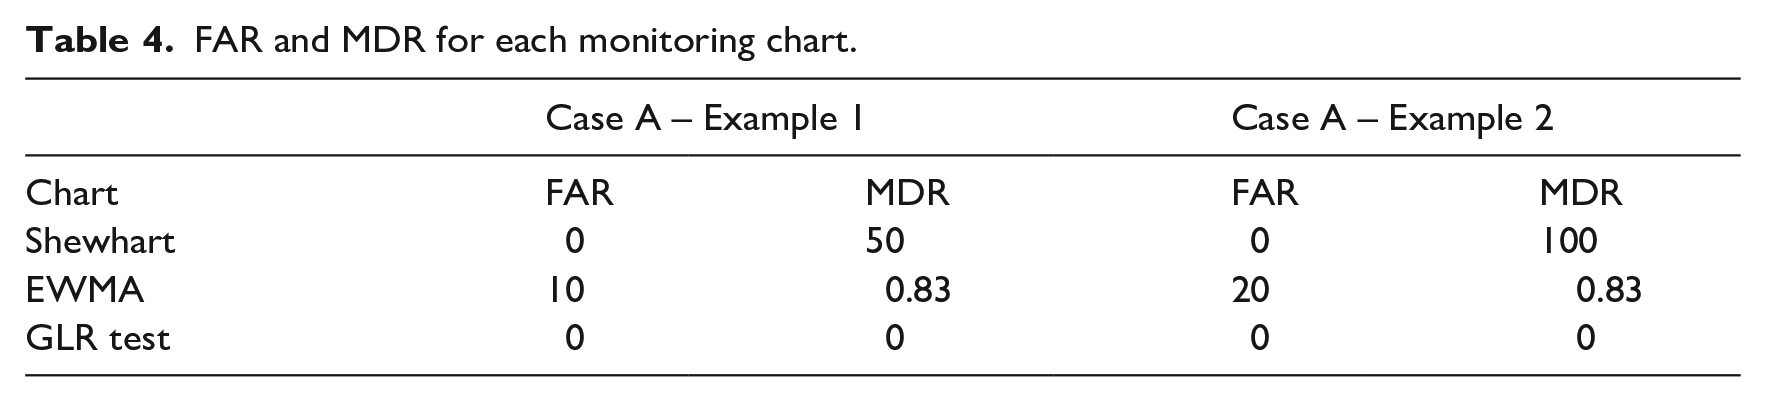
Table 4 confirms that the ARMA-GLR chart outperforms the ARMA-based Shewhart and EWMA schemes by achieving the best performance in terms of low FAR and MDR values.
FAR and MDR for each monitoring chart.
Case B: Gradual abnormal situation
In this case study, a gradual abnormal patient arrivals is simulated by adding a ramp change with a slope of 0.1 to testing data between 300 and 365 sample intervals. Monitoring results of Shewhart and EWMA statistics are plotted in the top and middle panels of the Figure 14, respectively. They increase linearly from the 300th sample, exceeding the control limits at the 328th sample (Shewhart) and 320th sample (EWMA). Thus, although the EWMA method detects the anomaly earlier than the Shewhart statistic, without regions of missed detection, it does produce some missed detections. However, the EWMA chart may detect slow drifts of mean faster than the Shewhart chart. The bottom panel of Figure 14 shows that the GLR statistic exceeds the violation threshold at the 307th sample, therefore, missing fewer detection that either of other charts, testifying to its superior performance. Here, the GLR approach begins to flag the abnormal increase of patient flow earlier than the other charts (EWMA and Shewhart). Detecting abnormal situations at an early stage is crucial to managing patient flow, avoiding strain situations, and optimizing ED resources. The speed of detection provided by the GLR approach helps foster reactive control and gives ED managers time to decision making. The number of days after detection and before reaching strain situation. Note that as the magnitude of the strain situation is not theoretically defined, it is not easy to compute the exact time for early detection. However, the GLR approach can sense the small gradual increase after few observations from the introduction of the gradual anomaly.
Monitoring of the Shewhart I-chart statistic (top), EWMA with (
In summary, these results show that the GLR chart, with a nonparametric detection threshold, outperforms the others by adequately detecting anomalies. We have shown that the GLR control chart is preferable for detecting a wide range of shift sizes, because control charts require specification of several chart design parameters by the user, making their design more complicated. Compared to other solutions, it presents the highest detection rate and reduces considerably the false alarms.
Conclusion
This study reports the development of an anomaly detection approach for monitoring abnormal daily demands at PED of Lille Hospital, France. This methodology combines an ARMA model with GLR test. The selected time series model was an ARMA (1,1) model, this latter was used as the model framework of the developed model. To monitor abnormal patient demands at the PED, we applied the GLR test to the residuals obtained from the selected ARMA model. Two case studies has been used to validate the proposed approach. Results demonstrated that the proposed methodology (ARMA-based GLR) shows a good performance compared to the other tested methods (Shewhart and EWMA monitoring charts).
The detection of strain situations in hospital emergency departments allows improving the care activity control and avoiding stressful conditions such that patient need and internal resources can be best managed. The early detection of these abnormal situations will also help the ED staff to prepare for absorbing the unusual rise in daily patient attendances at the ED without reducing the quality care of these latter. Therefore, the information provided by the presented anomaly-detection methodology can be used to optimize the performance of EDs.
To further improve patient flow management at hospital EDs, we plan to develop an approach to forecast daily ED visits by incorporating explanatory variables, such as meteorological measurements (e.g. temperature) and epidemic events. Toward this end, the ARMA models with external inputs could be used. Indeed, an accurate forecast of patient flow provides relevant information about the future trends of ED demands, facilitating the planning of nursing rosters and staff allocation within the ED and assisting in bed occupancy prediction. Further, it will be interesting to combine forecasting and anomaly detection and investigate whether improved forecasting can enhance anomaly detection. This is a topic for future research.
Footnotes
Declaration of conflicting interests
The author(s) declared no potential conflicts of interest with respect to the research, authorship, and/or publication of this article.
Funding
The author(s) received no financial support for the research, authorship, and/or publication of this article.
Ethical approval
The authors declare that this study does not involve human subjects, human materials, and human data. The authors confirm here that all datasets used in this work do not need any bio-ethical approval since they have already been anonymized by the PDE before making them available to the authors.