
Abstract
Introduction
Overcrowding in emergency departments (ED) is a significant problem affecting patient outcomes, hospital length of stay, and staff job satisfaction. This issue often stems from unpredictable patient flow and suboptimal resource allocation.
Objectives
This study aims to develop two machine learning (ML) models to assist in early and accurate resource allocation in EDs. The first model predicts patient admission at the time of triage, while the second predicts the specialty of care needed indicated by the initial ward transfer.
Methods
The study leverages the Medical Information Mart for Intensive Care (MIMIC-IV) database with 425,000 ED visits including basic vital signs, medications, presentation information, diagnoses, and demographic information about the patients. Ensemble tree classifiers are employed for model development, and model's explainability is assessed by investigating feature importance. The best model is selected based on the balance between performance and explainability. Features’ importances are calculated and presented using SHapley Additive exPlanations and models’ intrinsic feature importance.
Results
The best-balanced admission prediction model in terms of classification performance and explainability achieved an accuracy of 0.775 and an area under the receiver operating curve (AUROC) of 0.779 by using eXtreme Gradient Boosting (XGBoost). The resource allocation prediction model, using a one-vs-rest approach, attained an AUROC of 0.783 again by using XGBoost. The models shared acuity and age in the three most important features, whereas admission ratio and gender were the additional features for admission prediction and resource prediction, respectively.
Conclusion
The study successfully demonstrates the potential of ML models in predicting patient admission and required specialty care at the ED triage stage. While the admission prediction model shows moderate performance compared to existing studies, the resource prediction model exhibits superior performance compared to related works. The research highlights the importance of explainability in ML models, suggesting the need for further practical implementation to refine and validate these models in real-world settings.
Keywords
Introduction
The emergency department (ED) is the first point of contact for persons needing acute care without an appointment, thus making it a vital element of the hospital system and overall patient flow. In 2020, there were 405 visits to the ED per thousand inhabitants in the US, with 14.2% of the visits resulting into an admission to the hospital. 1 The low ratio of patient admission indicates that a big portion of the visits to the ED might be unnecessary, thus leading to unnecessary crowding in the ED. When a person arrives at the ED, their need of care and urgency are assessed at a triage point, and after registration and treatment, medical staff decides whether the person will be admitted to the hospital or not. 2 Nowadays, there exist multiple classification tools that can help in the triage process, most notably Emergency Severity Index (ESI), Manchester Triage Scale, Australian Triage Scale and Canadian Emergency Department Triage and Acuity Scale. 3 Although these tools are revised constantly, they have shown poor performance in predicting admission; for instance, ESI shows poor sensitivity (0.28–0.68) when predicting admission. 4 A prediction model could be used with other decision support tools to improve the accuracy and robustness of triage decisions.
Patient flow, described as the movement of patients from the point of arrival to discharge, 5 is difficult to predict, especially in the ED, since the conditions’ acuity vary substantially and the inflow of patients is volatile due to exogenous factors such as weather, local events, and referrals from smaller medical centres without EDs. Thus, the importance of patient flow in the ED is unarguably critical since it is reflected in the patient flow of the whole hospital (half of the patients present in inpatient wards are originally from the ED 6 ). In addition, ED overcrowding is also a well-known issue occurring by numerous causes such as complexity and urgency of patients, increase in elderly and low-acuity patients, inability to access other healthcare services, staff shortages and incompetence, and access block.7–10. This situation translates into worse patient outcomes, patient dissatisfaction, delayed and poorer quality of care, job dissatisfaction and burnout of medical staff, and increased lengths of stay.10,11 Therefore, earlier and more accurate prediction of admission could help hospital staff to start preparing for admissions, thus giving them more time and information to make resource allocation decisions. 12 However, the prediction of resource utilization needs for admitted patients has not been studied thoroughly as admission prediction. In the sense of helping hospital staff in making earlier and more correct resource allocation decisions, this would be even more beneficial. 13 To make the resource allocation decision as easy as possible, this study predicts the disposition ward after the admission decision in ED.
Earlier prediction of admission could shorten the length of stay in the ED, 14 ease bed management, 15 decrease morbidity and mortality rates, as well as decrease readmission risk. 16 In addition, the prediction of resource utilization needs could shorten boarding times in the ED, and knowing disposition wards beforehand allows medical staff to start preparing for the transfer of patients earlier. In recent years, there has been a rise in the number of different implementations of artificial intelligence (AI) systems into practical use and research. Admission prediction is no exception, and machine learning (ML) models have been concluded to perform better than more traditional methods of prediction 17 unveiling features that affect patient presentation such as degree of available secondary care facilities and public events. 18
However, the integration of AI/ML systems into clinical practice, especially when their decisions impact patient outcomes, is complex due to the necessity for transparency and comprehensible explanations of the AI models’ results. In addition, the implementation of new technologies such as large language models (LLMs) and AI may be challenging due to high expectations, limited experience with the devices, and the lack of guidelines and laws. 19 These are crucial for assisting clinicians in diagnosis and treatment. Therefore, eXplainable Artificial Intelligence (XAI), a category of systems that offer insights into the decision-making and predictive processes of AI by providing understandable explanations, enables healthcare professionals to make informed, data-driven decisions. This clarity fosters clinical adoption and acceptance of AI models. 20 Nevertheless, XAI does not represent a ‘one-size-fits-all’ solution, as a trade-off between accuracy and explainability often emerges, contingent on the ML models used. Generally, high-performing models tend to be more complex and less interpretable, such as ensemble trees or neural networks, and simpler models are more interpretable but less accurate. Moreover, despite XAI's potential to facilitate clinical adoption, ML models in healthcare frequently encounter various challenges related to ethics (including fairness, non-discrimination, and accessibility) and regulatory concerns (like accountability, privacy and data governance) 21 which have become requirements to be met in order to achieve trustworthiness in AI systems. These issues can impede their acceptance and use by doctors and healthcare professionals. In addition, the regulation of AI lacks harmonized standards that foster and ensure these aspects, which has been acknowledged by the European Union through the AI Act where Trustworthy AI is targeted as one of the main goals 22 2.3 Defined by the European Commission, Trustworthy AI refers to AI systems that are lawful (must comply with all applicable laws and regulations), ethical (must adhere to ethical principles and values, ensuring respect for human rights and democratic values) and robust (must be secure and reliable, functioning correctly while minimizing unintended harm or errors). 23
The main motivation behind this study is to try to ease resource allocation and improve patient flow in the ED through an explainable AI prediction model, thus eventually reducing overcrowding in EDs. Thus, apart from the predictions given by the two ML models for hospital admission and disposition ward (resource allocation) after the admission decision in the ED, we pursue to support the decision-making of healthcare professionals by unveiling the importance and different relationships between the features fitted in both prediction models. The main contribution of this study is, to the best of our knowledge, a novel XAI approach that offers two prediction models for hospital admission and resource allocation that consider a balance between classification performance and interpretability of the models’ output.
The subsequent sections of this article are organized as follows: First, we provide an overview of various related works focused on developing prediction models for hospital admission and resource utilization. Second, we describe the dataset used, the optimization framework implemented for model development, the ML algorithms, evaluation metrics and the explainability techniques applied in this study. Third, we present the evaluation results, focusing on both classification performance and explainability, followed by an in-depth analysis of explainability. Finally, we discuss the outcomes and draw conclusions from the study.
Related works
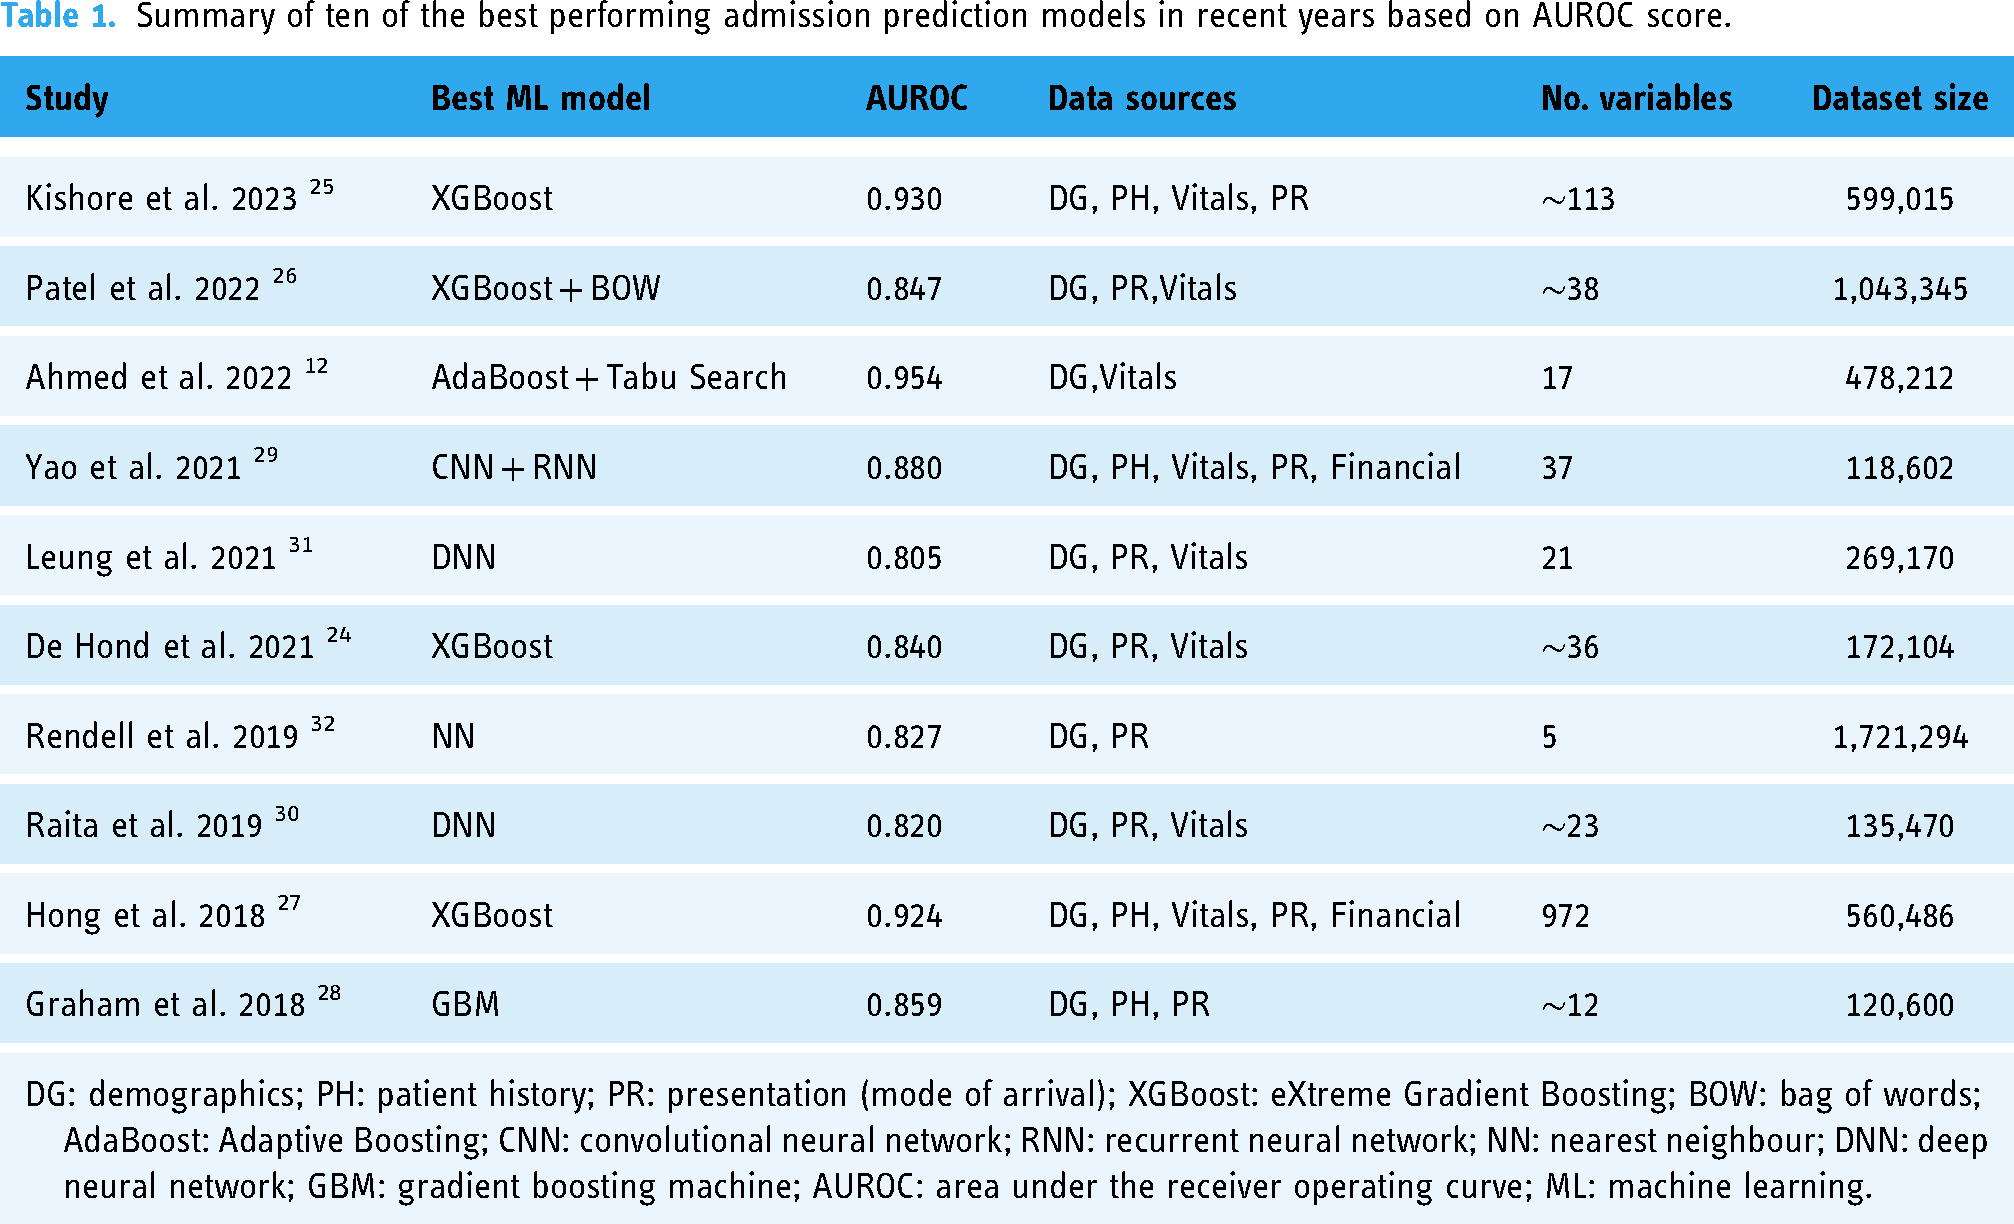
Prior to this research, numerous studies have been carried out with the goal of predicting admissions in the ED. One of the biggest differences in the development of models was the algorithm selection: the majority employed high-performing ensemble tree models,12,24–28 but different types of neural networks were also present29–32. The dataset size does not appear to significantly impact model performance; similar performance was shown with datasets of over a million rows of data26,32 and others with fewer than 150,000 rows28–30. Table 1 provides a summary of the top ten best-performing ML models for predicting admissions in the ED in recent years, highlighting the diversity of approaches in terms of algorithms, data sources, number of variables and size of the dataset.
Summary of ten of the best performing admission prediction models in recent years based on AUROC score.
However, studies focusing on predicting resource allocation are significantly fewer, largely due to the complexity of this issue and the different approaches conducted, which in our case, is through disposition ward prediction. El-Bouri et al. created a deep neural network to forecast patient location after ED by incorporating demographic data, environmental factors, patient history, and requested resources. The predicted classes, with an area under the receiver operating curve (AUROC) ranging from 0.60 to 0.78 for each, were similar to this study: general medicine, cardiology, neurology, trauma unit, intensive care unit (ICU), surgical, obstetrics and gynaecology. 13 Fenn et al. developed two models for predicting on an hourly basis the probability of a patient being admitted to either an inpatient unit or ICU from ED with an AUROC of 0.873 and 0.951, respectively. 33 Predicting the triage outcomes among discharge, hospitalization, Covid-19 services, ICU, and death, Elhaj et al. achieved an accuracy of 0.891 and F1-score of 0.89 using a random forest model. 34 Lee et al. predicted patient disposition, with an accuracy of 0.816) to five distinct units (general practice unit, telemetry unit, ICU, observation unit and discharge) at the time of first laboratory test results arriving and two and half hours before the actual disposition. 35
The main limitations found in the admission prediction studies were the lack of open datasets and limited or non-existent explainability analysis. Feature importance was calculated in many admission prediction studies but further investigation into the feature relationships and visual presentation was lacking. For resource allocation prediction, the main limitation was that the classes were not specific enough. Only the study carried out by El-Bouri et al. 13 had similar target classes to this study, but it had very different features. Similarly for resource prediction, the most important features were often calculated but they lacked visual presentation and further analysis.
Material and methods
Dataset
The database employed in this research study for both admission prediction and resource allocation prediction is part of the fourth version of Medical Information Mart for Intensive Care (MIMIC-IV), available from PhysioNet36–38. The dataset contains 425,087 ED stays of deidentified patient data from the Beth Israel Deaconess Medical Centers between years 2008 and 2019. 39
To construct the prediction models, we undertook a comprehensive data curation process. This involved extracting information from two distinct modules of the database: hospitalization and ED. We consolidated the data by merging tables with multiple entries for a single stay into a single row. In the case of multiclass variables, only the ten most frequent categories were retained as individual columns, with the remaining categories combined into a single column. An exception to this approach was made for chief complaints and ICD diagnoses; any categories representing a frequency of 0.5% or higher were kept as an individual column. Additionally, new variables were generated from the initial data, drawing on both domain expertise and effective variables identified in prior studies. For example, we introduced the ‘admission ratio’ variable, which represents the proportion of previous stays to admissions. We also calculated and included previous diagnoses by shifting and aggregating diagnosis codes to the most recent stay Furthermore, we created columns corresponding to the Charlson Comorbidity Index 40 (CCI) and the Elixhauser comorbidity index 41 (ECI) employing a methodology similar to the one used in the study by Xie et al. 42 that assigns a set of values depending on the combinations of the ICD codes annotated. In cases where the ICD codes do not establish a specific value for CCI and ECI, the value ‘Not present’ is set. The target feature related to the admission ward was based on the resources required by the respective ward or specialty. This allowed for a refined categorization of the original areas into the following classes: surgical, cardiology, observation, oncology, obstetrics, ICU, general and neurology (see Supplemental material-Appendix C). The summary description of the variables considered in the study is shown in Table 2. In addition, the Supplemental material contains a more detailed view of the categorical variables as well as an exploratory data analysis of the variables used in this study.
Description of statistical information of the features included in the dataset.

ED: emergency department; ESI: Emergency Severity Index.
The target class for predicting resource allocation was applicable only to individuals who were admitted, representing 52.24% of the entire dataset. However, in developing the prediction model, we focused solely on the cohort of admitted individuals, making the relevant proportion 100% within this specific group.
The 54.71% of ECI variable is distinct from the value ‘Non present’.
The 15.72% of ECI variable is distinct from the value ‘Non present’.
Automated framework for model selection optimization
In our study, the automated framework named SCI-XAI (feature Selection and Classification for Improving eXplainable AI) 43 is employed to develop explainable prediction models for hospital admission and resource allocation. SCI-XAI is implemented with the Python scikit-learn package. 44 It facilitates the creation of balanced prediction models in terms of classification performance (accuracy) and explainability (number of features selected) by considering different kinds of parameters. SCI-XAI employs a brute force optimization algorithm, utilizing the GridSearchCV method from scikit-learn, to identify the optimal combination of ensemble tree classifiers, the number of features to select, and the feature selection method that yields the most accurate classification. The process begins with stratifying the dataset based on the target feature, dividing the instances into training and held-out test sets in a 70/30 ratio. This approach ensures that the model's performance is assessed on new, unseen data from the holdout test set by applying the optimal parameters determined by the framework. The data preprocessing stage in our study is carried out in distinct threads for numerical, nominal, and ordinal features. This stage includes steps for imputing missing data, scaling or encoding features, and selecting relevant features. Following this, the data from these separate preprocessing threads are combined for a 5-fold cross-validation training phase. In the classifier training step, class weights are applied to address class imbalance in the dataset, ensuring that the resource prediction models adequately reflect this imbalance. The weights are used in the classifier training step, to make the resource prediction models consider the class imbalance in the dataset. The final step involves evaluating the selected optimal model in terms of its explainability, using metrics like interpretability, Accuracy-Interpretability Index (AccII) or AUROC-Interpretability Index. Detailed descriptions of the methods used in each phase of the framework are presented in the subsequent subsections.
Data preprocessing
The data preprocessing in our study was conducted using the SCI-XAI framework and involved several distinct phases. For outlier detection, those instances that were outside the extreme lower and upper boundaries, respectively, Quartile 1–3*IQR(inter quartile range), and Quartile 3 + 3*IQR were excluded. For handling missing data, the strategy of imputation varied according to the feature's data type. We used mean value imputation for numerical features, and for ordinal and nominal features, we employed mode imputation (the most frequent value). During the encoding phase, numerical features underwent a min-max scaling process, while for categorical variables, we adopted the one-hot encoding method. These steps of outlier detection, missing data handling and encoding are not considered parameters for the optimization algorithm.
Beyond explainability techniques, it is important to recognize the role of feature selection in enhancing model explainability by removing non-relevant information from the classification process. 45 In this study, we address feature selection through filter methods. These methods evaluate the intrinsic relationships between the dataset's features and the target class using approaches like ANOVA, chi-squared, or mutual information. These techniques assess the univariate statistical dependencies or significance, guiding the inclusion or exclusion of certain feature subsets. Additionally, we employ wrapper feature selection methods, such as Recursive Feature Elimination (RFE), where a classification algorithm (e.g., logistic regression and XGBoost) is used to identify the most significant features by determining a high correlation between the target feature and the remaining features in the dataset. 46
Machine learning classifiers
Ensemble tree techniques, which enhance accuracy by aggregating and weighting multiple models derived from a base decision tree, are widely recognized for their effectiveness in classification tasks. Ensemble methods often surpass the performance of their base classifiers and help address challenges such as class imbalance and the curse of dimensionality. 47 However, their limited inherent explainability often leads professionals, who require interpretative insights, to avoid them. As a result, post hoc explainability techniques become necessary to decipher the ‘black-box’ nature of ensemble trees. In this work, we describe the various ensemble tree algorithms utilized as follows:
Decision Trees (DT), apart from ensemble trees, we also consider the fully transparent algorithms of DT which is a predictive modelling tool that splits data into branches at decision nodes based on feature values, leading to final outcomes or classifications at the leaves. This intuitive, tree-like structure enables straightforward interpretation and visualization of decision-making processes. Decision trees are widely used thanks to their simplicity and ability to handle both numerical and categorical data.
Random Forest (RF) stands out as a highly popular ensemble tree method, favoured for its strong predictive performance and ability to manage datasets of various sizes. It trains its base classifiers using the bagging method. This method involves selecting a random subset of features for each split in the decision tree nodes. 47
Extreme Randomized Trees (ET) enhance the accuracy of tree-based bagging classifiers by randomly selecting cut-points during the node splitting process and utilizing the full training dataset for all its base classifier trees. While similar to RF, ET introduces more randomness in the node splitting, leading to a more varied collection of trees. This increased level of randomness is beneficial in reducing overfitting and enhancing the model's ability to generalize. 48
Adaptive Boosting (AB) is a boosting ensemble technique that prioritizes training on instances that were previously misclassified, which receive modified weights over successive iterations. Additionally, the base classifiers are weighted according to their performance, influencing the classification of new instances. As a result, AB creates a robust classifier by amalgamating the outputs of several weaker classifiers. 47
Gradient Boosting (GB) improves classification accuracy by training each base classifier on the residual errors of preceding classifiers, thereby progressively reducing the overall classification error. The final classification outcome is derived from a weighted average of the results of all base classifiers. 49
eXtreme Gradient Boosting (XGBoost) enhances the gradient boosting algorithm by incorporating various optimizations and regularization techniques. These modifications aim to boost the algorithm's speed and performance, while also simplifying its structure and enhancing its generative capabilities. 50
Ensemble voting aggregates predictions from multiple classifiers improving their individual performance. In the majority-vote classifiers, only the sample class with the highest votes is included in the final predictive class.
XAI techniques
Methods for achieving post-hoc explainability for a black-box model try to mimic the functioning of the model, without explaining what actually happens inside of it. As a result, these methods give approximations instead of definitive facts about the model's behaviour. 51
First, the intrinsic feature importance of ensemble tree is considered. This technique provides the features’ relevance associated with the mean decrease impurity, as measured by the Gini impurity index, observed in the base classifier's nodes of the different decision tree estimators.
Next, SHapley Additive exPlanations also known as SHAP is a unified and model-agnostic framework for model interpretation. First proposed by Lundberg and Lee in 2017, 52 SHAP has become one of the most used interpretability frameworks in ML. Authors propose SHAP values as the standard for representing feature importance. SHAP leverages cooperative game theory, the original Shapley values introduced by Shapley in 1953, 53 and additive feature attribution. These are used to construct the model for calculating feature importance. Feature importance estimation is done by calculating the difference between predicted values when a single feature is missing or present, for each feature. At each iteration a feature is selected and then all combinations for it are calculated and, in the end, averaged. This value expresses the effect that a feature has on the prediction, thus feature importance. SHAP has an excellent python library developed by the authors, 54 which can be used to calculate SHAP values and plot figures that display the SHAP values in a clear way.
Classification performance and explainability evaluation metrics
Performance of the developed models was evaluated using well-accepted methods: accuracy, sensitivity, specificity, precision, recall, F1-Score and AUROC. The multiclass prediction uses AUROC as the primary metric for finding the best classifier, while in binary classification the primary metric is accuracy. The multiclass AUROC is calculated with a one-vs-rest strategy (AUROC is calculated for each class compared to all the other classes), and afterwards the results are averaged across all classes. F1 macro average is used as another metric for multiclass performance evaluation. It is calculated by averaging F1 for each individual class. This method is recommended for imbalanced datasets since it considers the performance of individual classes instead of only the general performance on the whole dataset. Additionally for multiclass performance evaluation, a confusion matrix is calculated. This illustrates where the algorithm made the most mistakes, thus which classes were the hardest to predict. The balance between explainability and performance was assessed using a metric called interpretability, 55 which measures the explainability gained by dropping features that do only minimally affect the model's performance. To find a balanced model that has high interpretability and high performance, this study proposes the use of metric AccII 56 for admission prediction. Similarly, and as a novel contribution of this work, we propose the AUROC-Interpretability Index (AUROCII) to measure the trade-off of multiclass classification performance and explainability, which in our case is applied for resource allocation prediction. These metrics’ formulations are presented in Table 3.
Summary of ten of the best performing admission prediction models in recent years based on AUROC score.

Results
Classification and explainability performance of prediction models
Hospital admission prediction
Through the application of the framework SCI-XAI, multiple combinations of each classifier with different numbers of features are obtained. The best performing classifier was selected based on the accuracy that was achieved during the 5-fold cross-validation approach. Table 4 presents the best performance result for each classifier. XGBoost achieved an accuracy of 0.785 and AUROC of 0.786, when predicting using the test dataset with unseen data. The classifier used 138 of the 155 available features to make the predictions.
Results from the admission prediction pipeline, based on the best accuracy for each classifier with the training set in the cross-validation approach.

The bold values represent the best performance on that specific metric.
AUROC: area under the receiver operating curve; XGBoost: eXtreme Gradient Boosting.
Concerning the explainability performance, the comparison between the three most balanced models, in terms of AccII, and their best performing counterparts are presented in Table 5. The AccII is close between the three most balanced models; however, for the most balanced model, that is, XGBoost, a substantial increase is observed from the corresponding model with the highest accuracy (0.785). Thus, the most balanced model yields an accuracy with the training set and the cross-validation approach of 0.779 (0.001). This is caused by the best performing model only decreasing the number of used features by 17 compared to the 47 that were reduced in the most balanced model.
The three most balanced admission prediction models based on Accuracy-Interpretability Index and the best performing model using the same classifier.
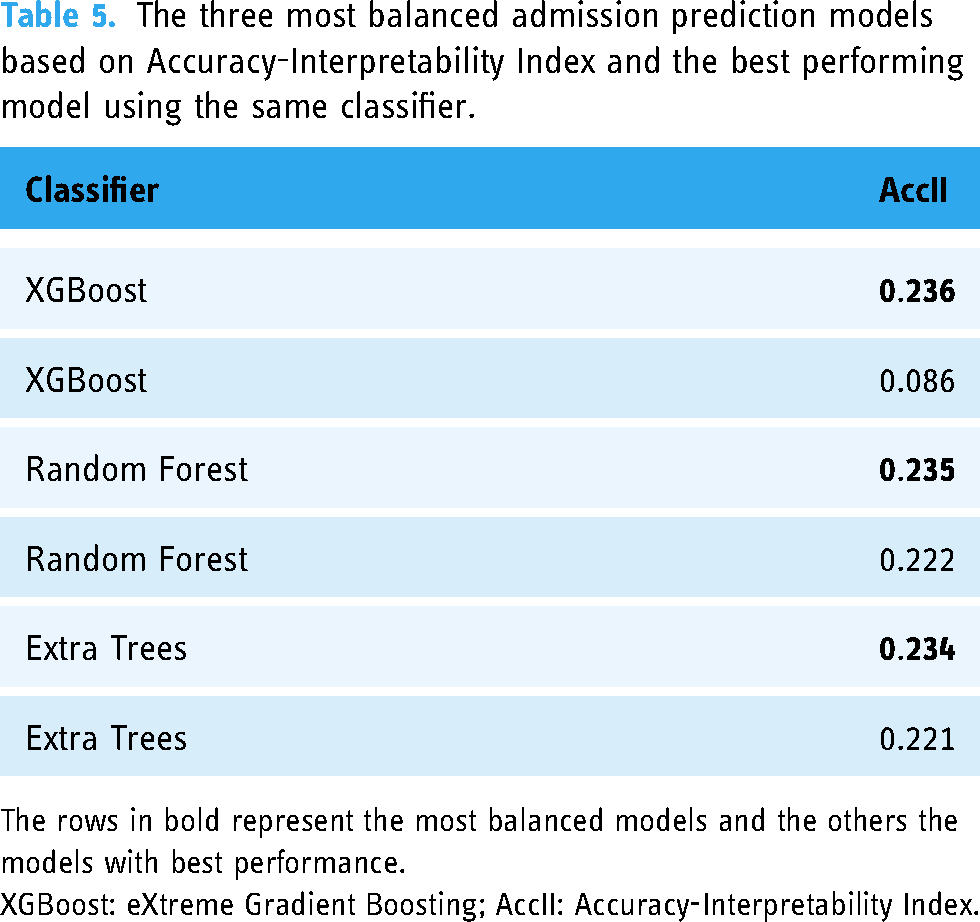
The rows in bold represent the most balanced models and the others the models with best performance.
XGBoost: eXtreme Gradient Boosting; AccII: Accuracy-Interpretability Index.
Resource allocation prediction
For choosing the optimal classifier in resource allocation and considering we handled a multiclass classification, the primary criterion was achieving the highest AUROC during the cross-validation process. Table 6 presents the best score for each classifier. XGBoost was again the best classifier with the training set and achieved an AUROC of 0.797 with the testing dataset using 109 of the 155 available features to make the predictions.
Results from the resource prediction pipeline, based on the best AUROC for each classifier with the training set in the cross-validation approach.

The bolded values represent the best performance on that specific metric.
AUROC: area under the receiver operating curve; XGBoost: eXtreme Gradient Boosting.
Similar to admission prediction, we made an inspection of the classification performance and explainability trade-off existing in the ensemble trees algorithms. Thus, the comparison between the three best balanced models and their best performing counterparts are presented in Table 7. The difference in the AUROCII for the most balanced models is close but not as close as in the AccII used in admission prediction. There is one value 0 present, which in this case means that the best voting classifier used the whole set of features, thus the Interpretability metric was 0. XGBoost again shows the most balanced behaviour with an AUROCII value of 0.318 due to the AUROC value of 0.783 and the feature reduction is of 63 from the initial set with 155 features.
The three most balanced resource allocation prediction models based on AUROC-Interpretability Index and the best performing model using the same classifier.

The rows in bold represent the most balanced models and the others the models with best performance.
AUROC: area under the receiver operating curve; XGBoost: eXtreme Gradient Boosting-Interpretability Index.
Figure 1 shows the confusion matrices for the XGBoost best performing classifier and for the XGBoost most balanced classifier based on explainability. The predictions in the confusion matrix are calculated using the testing dataset. In the most balanced model, considering only 40% of the total features (63 out of 155) results in a slight decrease in performance for the correct classification of different units (as shown by diagonal values), with more pronounced effects observed in the ICU and neurology units. This decrease in correct classification corresponds to a slightly higher rate of misclassification across other units, with a significant impact noted between ICU and neurology. Conversely, the obstetric unit alone shows an improvement in classification with the feature reduction approach. This improvement may be attributed to the fact that features related to medication are more prevalent in the relevant features than in the best-performing model, highlighting the importance of medication-related features in the obstetric class.

Trade-off between explainability and performance. On the left is the most balanced model and on the right is the best performing model. The diagonal squares represent the correct predictions. The values are the proportion predictions to the number of all true instances for that specific class.
Explainability analysis
Considering the explainability metrics, XGBoost emerged as the most balanced classifier for both prediction types. For admission prediction, it attained an AccII of 0.236, and for resource prediction, an AUROCII of 0.318. The feature count was reduced to 47 for the admission prediction model and to 63 for the resource prediction model, down from an initial total of 155 features. The accuracy for the most balanced admission prediction model was 0.779, and for the resource prediction model, the best AUROC was 0.783. It is important to acknowledge that while these performance metrics are marginally lower than the optimal results, the significant reduction in features means that these models still perform effectively. The data shown in this section reflects the performance of these most balanced models.
Admission prediction
As the XGBoost emerges as the most balanced classifier for admission prediction, the intrinsic importance of its features is presented in Figure 2(a). Meanwhile, Figure 2(b) shows the most important features in admission prediction based on the mean absolute SHAP values. These plots only consider the absolute effect of the feature on the prediction and not its direction, that is, whether the feature influences a positive or negative prediction of admission. The top 10 features are the same in both figures, but in a different order.

(a-left) Ten most important features based on the improvement in the model's loss function summed up for every tree in the ensemble. (b-right) Top features based on mean absolute SHAP value.
Figure 3 illustrates the SHAP values, which correspond to log-odds of being hospitalized, concerning the effect on each feature, where a higher SHAP value indicates a more probable admission and vice versa. In addition, the thickness of the line for a feature represents the number of values present in that position; hence, it is possible to assess the quality of the features as predictors, being a good predictor having a clear distinction between the colours. If the feature is categorical, the colours should be clearly differentiated by having the value 0 and 1 for blue and red respectively. The five most important features are all relatively good predictors due to their width correlated to the importance and the clear distinction among coloured feature values.

Ten most important features based on SHAP values. Positive SHAP value drives the prediction towards admission, whereas negative value drives it towards discharge.
SHAP was also used to calculate relationships between the four most important features in the admission prediction model depicted in Figure 4. The analysis revealed the following relationships: Older individuals typically have a higher admission ratio, which positively influences hospitalization predictions, (majority of red dots on the relative age range from 0.6 to1 in the upper left plot). Similarly, older patients often arrive by ambulance, a factor that also contributes positively to hospitalization predictions (predominantly positive SHAP values from 0.6 relative age values in the upper right plot). Higher acuity levels add a positive contribution to the admission ratio values for the hospitalization prediction (red dots in the lower left plot). However, for individuals with high admission ratios who arrived by ambulance, this did not positively influence hospitalization predictions, as detailed in the lower right plot where ambulance arrival does not correspond with positive SHAP values (red dots from 0.6 relative admission rate in lower right plot), and admission ratio and arrival by ambulance, that is, for those with high relative values of admission rate having arrived in ambulance did not influence positively in the hospitalization prediction.

Relationships found between the 4 most important features in admission prediction. The top figure presents age's relationships and the bottom figure presents admission ratio's relationships.
For individual predictions, SHAP can be used to calculate the effect of different features on the prediction output of a single instance. Figure 5(a) and (b) present a negative and a positive prediction, respectively, where if f(x) is negative, the patient will be predicted to not be admitted, and if it is positive, the patient is predicted to be admitted. Thus, in the case of a negative hospitalization prediction (Figure 5(a)), we observe that the first four most relevant features identified by the global explainable model (Figure 3) significantly affect the hospitalization prediction. Specifically, an admission ratio of 0 and an acuity level of 3 have a negative influence, while arrival by ambulance and being 66 years old contribute to a positive prediction. Similarly, for a positive prediction of hospitalization (Figure 5(b)), age, acuity and admission ratio alongside heart rate are the most influencing features. Among these, an admission ratio of 0 is the only factor that tends toward a non-hospitalization outcome.

Examples of SHAP explanation of individual prediction: the patient is predicted to not be admitted (a-left), and the patient is predicted to be admitted (b-right). The number on the left side of the feature name presents the value of the feature.
Resource allocation prediction
In this case, XGBoost demonstrates again the best balanced performance for resource allocation prediction; thus, the feature importance can be derived from its intrinsic explainability technique. Figure 6(a) shows the aggregated feature importance across all the resource allocation categories, with age, female gender and acuity identified as the most influential features in the prediction. Other factors, such as medication base codes (etc codes) and conditions (e.g., cc_chest pain) alongside pain denote a smaller contribution. Additionally, the mean absolute importance of each feature across all categories, based on SHAP values, was calculated manually and is presented in Figure 6(b), finding female gender, age and acuity as the most relevant. These results align with the feature importance indicated by the intrinsic explainable technique of XGBoost, although the relative importance of female gender and age are reversed.

(a-left)Ten most important features in resource allocation prediction based on the improvement in the XGBoost model's loss function (summed up for every tree in the ensemble and for every class).(b-right) Mean absolute importance of SHAP values aggregated for all resource prediction classes. .
For resource allocation prediction, the most important features and effects, based on SHAP, had to be calculated for each class separately due to the multiclass classification scenario. Figure 7 shows the most important features and their effects on the prediction output for one of the four major classes of admission units – General, Observational, Surgical, and Cardiology – which contain the majority of instances in the dataset. Conversely, Figure 8 displays the important features for predicting those admission units with fewer instances in the dataset, such as ICU, Obstetrics, Neurology, and Oncology. As a general observation, and aligned with the main reported emergency aspects to consider, 57 age consistently emerges as one of the most significant features in every class shown in both figures. Acuity also presents significant importance in most classes, especially those with the majority in the dataset. Additionally, pain-related variables (pain, cc_chest pain, abdominal pain) indicate a substantial influence on the predictions for all classes depicted in the figures, except for Oncology.

The most important features and their effect on the prediction output for the four biggest classes.

The most important features and their effect on the prediction output for the four smallest classes.
From a particular perspective about the majority classes, age, acuity, and pain related-variables emerge as the most influential, as depicted in the top part of Figure 7’s SHAP plots. In the case of cardiology, the observation of various drug variables among the most important features is a notable contrast to the rest of the classes, although oncology also experiences such phenomena. The smaller number of instances in the classes shown in Figure 8 appears to influence the significance of these three variables, as other variables related to other conditions (such as female gender, dyspnoea, or transfer from other health centres) and modes of transport arrival denote a higher influence in the classes’ predictions.
Discussion
Prediction of admission and resource utilization is a quite complex problem with many factors affecting the prediction output. The purpose of this study was to develop a pair of prediction models to ease the resource allocation and improve patient flow in the ED, thus, with the aim for these models to be beneficial when applied to practice, especially, when considering the use of a very limited amount of data. The models explainability was assessed and the different factors affecting the prediction output were illustrated using SHAP and intrinsic feature importance.
The performance achieved with the admission prediction models is comparable to the benchmarking study, where related works achieved a better AUROC for a random forest model, while we achieved better sensitivity and specificity. 42 Their AUROC was 0.819, while our best random forest model achieved 0.780. Moreover, when compared to the best related works, our best classifier for admission prediction performed worse based on the AUROC. The difference could be due to the use of other datasets with other variables considered. The employment of different pre-processing steps might also have influenced the generalizability of the models. The main contribution of this paper is the novel approach based on the explainability analysis as well as the consideration of balancing the performance and the interpretability of the models. The decrease in model performance between the best admission prediction model and the most balanced model was very small, only 0.5% in accuracy. This means that the 30 features that were left out in the most balanced model only account for the before-mentioned increase in model performance.
In the case of admission prediction, the most relevant features seem to be quite intuitive and similar to what related works show. The admission ratio seems to be a very good predictor for admission, and its accuracy increases as long as the patient has all the stays registered; however, this finding should be validated with other datasets as comprehensive as possible to ratify the observed relevance. There is a distinction between males and females, with results indicating that males have a slightly higher probability of admission. Regarding chief the complaints variable, its most important category is transfer, so the patient was transferred from another hospital, which is probably a big medical centre providing specialized care that smaller medical centres could be lacking. For diagnoses, hypertension was the most important feature toward the prediction of admission, which could be explained by hypertension being the most frequent diagnosis in the dataset and it can be related to many different minor diseases. When studying the feature relationships between the most important variables, one interesting relationship was found between age and admission ratio since when older patients have a high admission ratio, it lowers the probability of admission. This could be reasoned so that younger patients who have not been to the ED in a long term and do not have any admissions, are more probable to be admitted because they might come to the ED only when there is a very acute problem.
Concerning resource allocation prediction, we observe a more significant trade-off between performance and explainability. The most balanced model, that is, XGBoost, had visibly a worse confusion matrix than the best performing, which might imply that the extra features helped the model to make more correct predictions. However, the most balanced model yielded better performance for the obstetrics class. This happened because features regarding medication were more present in the relevant features than in the best performing model, indicating the relevance of medication in the obstetric class.
In addition, the study found that the most important features for resource allocation prediction are age, gender, acuity, pain, opioid medication, beta blockers and statins. Age and acuity are present in related works. The reason for gender being so important is probably because gender has a very high importance in the obstetrics class which then reflects on the overall importance. Opioid medication is the second most important feature in oncology, probably because cancer patients require a lot of pain relief. Statins and beta blockers are present in obstetrics and cardiology as important features. Moreover, age seems to be a good predictor for resource categories such as cardiology, observational, general, obstetrics and oncology, while in other classes its importance decreases slightly. Looking at the overall importance, intrinsic feature importance and SHAP consider age as the first and second highest important feature. Concerning acuity, it is considered relevant in all of the largest classes, being the most important for general, observational, surgical and ICU. Conversely, due to its imbalance, pain does not seem to be a good predictor although it is one of the most frequent variables in the importance plot. In the case of neurology, the feature transfer is the most important, reflecting that many patients of the hospital's dataset were transferred to neurology, which sounds reasonable since neurology is one of the services requiring advanced resources.
This study provides significant insights that could impact the management strategies of EDs, in several ways: (i) improving resource allocation by optimizing the allocation of critical resources such as beds and staff, thereby reducing bottlenecks caused by unexpected surges in patient volume; (ii) enhanced patient flow management, which allows managers to implement dynamic scheduling and balanced workloads for both medical staff and support services which improves patient care quality and staff satisfaction; (iii) strategic staff training that is more aligned with the predictive demands of patient care and focused on key features that influence admission and resource allocation decisions; (iv) integrating AI tools into health care practices, where professionals are often hesitant to adopt new technologies without clear, understandable information about the decision-making process; (v) guiding policymakers in developing guidelines that support the ethical and responsible implementation of AI in healthcare settings.
Several limitations that warrant consideration have been identified. First, the dataset exhibited numerous missing values, particularly in medication data. The incompleteness of these data could have detrimentally affected the performance of resource allocation prediction models since medication was found among the most important features. Furthermore, the MIMIC database primarily focuses on intensive care, which may limit the generalizability of the models to other healthcare settings. This specialization towards intensive care could skew the model outcomes, restricting their applicability in less critical environments. Another limitation is that resource utilization was assessed solely based on transfer ward and specialty of care associated with that ward. This approach may oversimplify the complexity of resource allocation decisions, which can involve multiple factors not captured solely by ward type and specialty. The mapping into the target classes in resource prediction could have been approached in several ways, if the perspective or aim of the study is different. Additionally, the mapping into target classes for resource prediction was contingent on the specific perspective or aim of the study, suggesting that different configurations could yield varied outcomes. This subjectivity in class definition highlights the need for a standardized approach to ensure consistency across studies.
One of this study’s goals was to show that exploring explainability and feature importance in our study has provided a clearer understanding of the models’ inner workings and their interdependencies. This insight has enhanced our current research and sparked innovative ideas for future projects. Such information is invaluable in guiding the model design phase for researchers conducting similar studies. For example, investigating whether the relevant features in models trained on data from different countries vary could provide insights into country-specific patient flow patterns in EDs. Additionally, this could help assess the feasibility of developing a universal model for resource prediction that can be tailored to specific countries or states. Furthermore, addressing hyperparameter tuning in the various ML algorithms used in this study could improve classification performance while maintaining a balance with explainability. Looking ahead, an essential avenue for future work involves the practical implementation of these models into clinical routines. This crucial step is necessary to evaluate the real-world applicability, effectiveness, and explainability of the models. Implementing these models in everyday clinical settings would not only test their robustness but also refine their predictive capabilities across diverse healthcare environments. Such endeavors could lead to significant improvements in patient care and resource management, ultimately enhancing the overall efficiency of healthcare delivery systems.
Conclusions
This research study developed two ML models to predict admission and resource allocation in EDs using data obtainable at triage. The primary objective of these models is to anticipate resource allocation requirements at an early stage, thereby addressing the challenge of ED overcrowding. These models were designed with explainability in mind, offering caregivers and researchers greater insight into their internal mechanisms. The study utilized the MIMIC-IV database, a publicly accessible and extensive dataset encompassing 425,087 patient visits. The admission prediction model attained an AUROC of 0.785, while the resource allocation prediction model achieved an AUROC of 0.797, both employing XGBoost as the classifier. Given the complexities of predicting the disposition ward post-ED visit and the constraints of data volume, the performance of the resource prediction model was notably effective. The analysis of explainability and feature importance allows for enriching the understanding of the models’ internal dynamics and overall functionality. Future research should focus on applying these models in real-world settings to evaluate the practicality and effectiveness of their predictions and explainability features.
Supplemental Material
sj-docx-1-dhj-10.1177_20552076241264194 - Supplemental material for Prediction of patient flow in the emergency department using explainable artificial intelligence
Supplemental material, sj-docx-1-dhj-10.1177_20552076241264194 for Prediction of patient flow in the emergency department using explainable artificial intelligence by Pedro A Moreno-Sánchez, Matti Aalto and Mark van Gils in DIGITAL HEALTH
Footnotes
Contributorship
Pedro A. Moreno-Sánchez participated in the conceptualization, methodology, validation, formal analysis, writing – original draft, review and edition, and supervision. Matti Aalto participated in data curation, software development, formal analysis, validation and writing – original draft. Mark van Gils participated in formal analysis, writing – review & editing, and supervision.
Declaration of conflicting interests
The authors declared no potential conflicts of interest with respect to the research, authorship, and/or publication of this article.
Ethical approval
This study did not require ethical approval as it exclusively utilized the MIMIC-IV database, which is a publicly available and de-identified dataset.
Funding
The authors received no financial support for the research, authorship, and/or publication of this article.
Guarantor
Pedro A. Moreno-Sánchez (P.A.M.S)
Supplemental material
Supplemental material for this article is available online.
References
Supplementary Material
Please find the following supplemental material available below.
For Open Access articles published under a Creative Commons License, all supplemental material carries the same license as the article it is associated with.
For non-Open Access articles published, all supplemental material carries a non-exclusive license, and permission requests for re-use of supplemental material or any part of supplemental material shall be sent directly to the copyright owner as specified in the copyright notice associated with the article.