
Abstract
Rapid ethnography and data mining approaches have been used individually to study clinical workflows, but have seldom been used together to overcome the limitations inherent in either type of method. For rapid ethnography, how reliable are the findings drawn from small samples? For data mining, how accurate are the discoveries drawn from automatic analysis of big data, when compared with observable data? This paper explores the combined use of rapid ethnography and process mining, aka ethno-mining, to study and compare metrics of a typical clinical documentation task, vital signs charting. The task was performed with different electronic health records (EHRs) used in three different hospital sites. The individual methods revealed substantial discrepancies in task duration between sites. Specifically, means of 159.6(78.55), 38.2(34.9), and 431.3(283.04) seconds were captured with rapid ethnography. When process mining was used, means of 518.6(3,808), 345.5(660.6), and 119.74(210.3) seconds were found. When ethno-mining was applied instead, outliers could be identified, explained and removed. Without outliers, mean task duration was similar between sites (78.1(66.7), 72.5(78.5), and 71.7(75) seconds). Results from this work suggest that integrating rapid ethnography and data mining into a single process may provide more meaningful results than a siloed approach when studying of workflow.
Introduction
Rapid ethnography in health care is based on the observation of events and actions of everyday life as they unfold naturally and in all their complexity. One of the main characteristics of rapid ethnography is that observations focus on events that happen over a relatively short period.1,2 The approach involves detailed data collection through field notes and interviews, in-situ computer screen video capture and extensive review of data from multiple perspectives. A goal of rapid ethnographic research is to describe and interpret actions from the point of view of those being studied. Rapid ethnography has been extensively used for the study of clinical workflow3–8 in part because it provides high-quality descriptions of workflows mediated by electronic health records (EHRs). However, these studies are usually resource intensive and the time required to collect rapid ethnographic data greatly limits the sample size. An additional challenge is that it is difficult to generalize results of a study to other populations. 9
Data mining focuses on the analysis of large volumes of data to automatically discover regularities or relationships to better understand underlying processes. Collected data has limited contextual information, and data preprocessing and analysis can be time consuming. Interpretation and validation of outcomes are often required and rely on domain experts (e.g. health care providers). Process mining in health care is an emergent approach which combines data mining and business-process management techniques to analyze EHR data collected as time-stamped computer logs.10–13
An event in a computer log can be viewed as a clinical activity, executed for a particular process instance. For each event, computer logs can indicate who is performing what activity, when and for which patient. Process mining consists of a set of techniques able to analyze computer logs generated by EHRs and other information systems to discover clinical workflows. During process mining, analysts apply specialized data-mining algorithms to computer logs to surface workflows. 14 Automatic workflow discovery allows workflow models to be extracted from computer logs, conformance checking allows for monitoring of deviations by comparing a given model with the computer log, and enhancement allows for extending or improving an existing workflow model using information about the actual workflow recorded in the computer log. 15 In terms of clinical applications, Rojas et al. 11 identified 58 process mining studies in 22 different medical fields. Oncology and surgery were the medical fields with the greatest number of case studies, nine and eight cases, respectively. More recently, a higher diversity of clinical applications have emerged, including hospital flow, hospital-at-home admissions, emergency care, cancer care and radiology.16–19 Recent process mining studies have stressed the need to validate results through the use of qualitative methods.11,13,20
Aipperspach et al. 21 first proposed ethno-mining as a mixed-method approach (e.g. employing observations and sensor data) to inspire system design or identify and quantify patterns of social behavior. They pilot tested the approach in the context of a study of mobility and laptop use in the home. The authors found stable patterns of laptop use, based on the users’ preferences. Ethno-mining was proposed as iterative cycles that integrate ethnography and data mining to combine the strengths of the two approaches and to minimize their weaknesses.
Rapid ethnography and data mining have rarely been combined and applied for the study of clinical workflow to overcome the limitations inherent in either type of method alone. In the case of rapid ethnography, there is the question of the reliability of findings drawn from small samples. For data mining analysis, there is the problem of determining the accuracy of the discoveries drawn from automatic analysis of big (but decontextualized) data, relative to observations. Ethno-mining iteratively generates possible interpretations of the data and empirically validates those interpretations. While qualitative data can give meaning to quantitative findings, mining big data can help to validate findings derived from smaller ethnographic samples, for example, characterizing the frequency, or distribution of specific workflow patterns.
The Mayo Clinic, a large academic health system, has undergone an enterprise-wide conversion to a common EHR and standardized workflows. 22 In advance of that conversion, an important aim was to capture and document at a granular level EHR-mediated workflow and health information technology (HIT) interactions. The adopted data collection method consisted of a multi-faceted approach that integrated rapid ethnography and process mining.
A hospital’s perioperative (PeriOp) workflow is complex, involving multiple interconnected sub-workflows that provide surgical care for inpatients and outpatients during pre-assessment, pre-operative (PreOp), intra-operative (IntraOp) and post-operative activities (PostOp). Inefficiencies occur when PeriOp workflows are fragmented, disjointed or ineffective, leading to delays, interruptions, lack of communication, staff member workarounds, and medical error.5,23–25 Before a patient can enter IntraOp for a surgical procedure, a PreOp nursing assessment must be completed. In the PreOp nursing assessment, one of the first tasks is to collect and chart a patient’s vital signs to provide a baseline for comparison during and after surgery. Because of their importance, it is critical that point-of-care vital signs documentation is understood at a fine level of granularity.
The Mayo Clinic has used rapid ethnographic techniques to understand EHR-mediated workflows.5,22–28 Video-analytic observational techniques were used to compare and evaluate vital sign documentation interfaces in PreOp nursing assessments at three different hospital locations in Setting 1, Setting 2, and Setting 3. 5 The interfaces differed in their modes of interaction, organization of patient information and cognitive support. Analyses revealed that accessing displays and organization of interface elements were often unintuitive and inefficient, creating unnecessary complexities when interacting with the system.
Objectives
This paper explores the combined use of rapid ethnography and process mining, aka ethno-mining, for the study and comparison of EHR-mediated workflows. The value of the method was demonstrated by extending the Mayo Clinic study and analyzing time metrics, including outliers (significantly longer instances) of the vital signs charting task, documented with different EHRs used in the PreOp settings at three different hospital sites within the same health care organization.
Methods
Clinical settings
The study was reviewed by the Mayo Clinic IRB and deemed exempt. This research involved PreOp settings at three different hospitals: Setting 1, Setting 2, and Setting 3. Setting 1 and Setting 2 used EHR system 1 and Setting 3 used EHR system 2 for vital sign charting. All the hospital sites are tertiary care centers and all have active transplantation programs. Setting 1 has 21 operating rooms and close to 225 beds. Setting 2 has 23 operating rooms and approximately 225 beds. Setting 3 has 91 operating rooms and approximately 1500 beds. All three settings have cardiac surgery, neurosurgery, transplant, advanced medical oncology and stem cell transplant programs. All sites have a full complement of medical students, residents, and fellows.
Data collection
Vital signs are measurements of the body’s most basic functions, including blood pressure, pulse, temperature, respiration, height and weight. In this study, we interpreted vital sign charting in the EHR as the task of adding, deleting or modifying a vital sign electronic record. Instances where the vital signs were reviewed but not modified were not included.
As part of a large data collection and curation process that happened in advance of the enterprise-wide conversion of Mayo Clinic to a common EHR, three informatics analysts collected observational data at the three settings over the course of 17 days. 22 Data collection and curation were based on the clinical workflow capture and analysis methodology adopted by the Applied Clinical Informatics program at Mayo Clinic. 28 Rapid ethnography included interviewing, shadowing, video capturing, artifact collection, and contextual inquiring. In the interviews, front line staff were asked to “walkthrough” key workflows and the clinical activities involved. Interviews were recorded and transcribed. When shadowing, the analysts followed participants and captured audio using handheld audio recorders and artifacts using a digital camera. HIT interactions were captured with a handheld video camera and with the Morae™ software. 29 Via the use of a webcam, Morae™ captured a video record of participants’ hands, desk space and paper-based artifacts used during interactions with the EHR, as well as an audio record of participants verbalizing their thoughts and conversations in the immediate vicinity. Both the video and audio recordings captured by the webcam are available for further analysis.
One computer scientist specialized in workflow analysis and a computer science graduate student retrospectively collected the computer logs generated at the settings during the same days when the ethnographic study took place.
Data analysis
Video ethnography, shadowing, and contextual inquiry were used to identify, segment and interpret vital sign charting tasks from other clinical tasks documented in the EHR. The beginning and then end of clinical tasks, including vital sign charting task occurrences, were manually coded using Morae™. 30 The code scheme used for clinical tasks is described in detail in previous research. 31 Finally, Morae™ was used to automatically compute relevant time metrics.
Rapid ethnographic data was also analyzed to identify which providers were responsible for completing the vital signs charting task, validate process mining outcomes, identify outliers (e.g. task instances considerably longer than the mean duration) and trigger hypotheses to explain outliers.
Computer log dictionaries were provided, to help interpret computer logs. Java programs were written to analyze computer logs generated by the EHR systems 1 and 2. The computer programs were written to discover vital sign charting instances that resulted in the deletion, modification or addition of one or more vital signs, and concluded when saving those changes using the EHR. The discovered computer logs corresponding to vital sign charting tasks were imported to Disco™ for analysis of time metrics. 32 To remove outliers, histograms were created to plot the distribution of duration of vital sign charting instances created from computer logs. Median and standard deviation (SD) were computed and the performance filter of Disco™ was used to automatically filter outliers. After removing outliers, time metrics resulting from rapid ethnography and process mining were compared and t-test was used to assess if there were statistically significant differences in time metrics between sites.
Ethno-mining
As proposed in Aipperspach et al. 21 and illustrated in Figure 1, the application of ethno-mining required four cycles consisting of the following steps:
Ask study question: the study questions that started each of the four cycles were:
Q1) How much time is spent charting vital signs at the different sites based on ethnography data?
Q2) How do the time metrics discovered from observational data compare with findings from computer logs in terms of total, mean and SD times?
Q3) Based on both ethnographic and computer log analysis, what are the reasons for the discovered differences in vital sign charting between locations?
Q4) When integrating ethnographic data, how accurate are the time metrics discovered from computer logs?
Collect data: data were collected using ethnographic or data mining methods, either separately or combined. The qualitative and/or quantitative data complemented each other, to answer the study question from co-informing perspectives. Practically, this meant that we synchronized data collection so that the different data sources were drawn from the same settings, scenarios/situations, people, days and time of the day, etc. were considered for the collection of ethnographic data. In other words, we could draw on both kinds of data to examine workflow for nurses, clinical teams or patients and refer to the same events. Data was shared between cycles, and not all the cycles required collecting new data.
Analyze data: the collected data were analyzed and interpreted using rapid ethnography or data mining methods alone or combined.
Answer study questions: the study questions were answered. The cycle completion led to new questions that required further exploration or resulted in explanations that needed further validation through a new cycle.
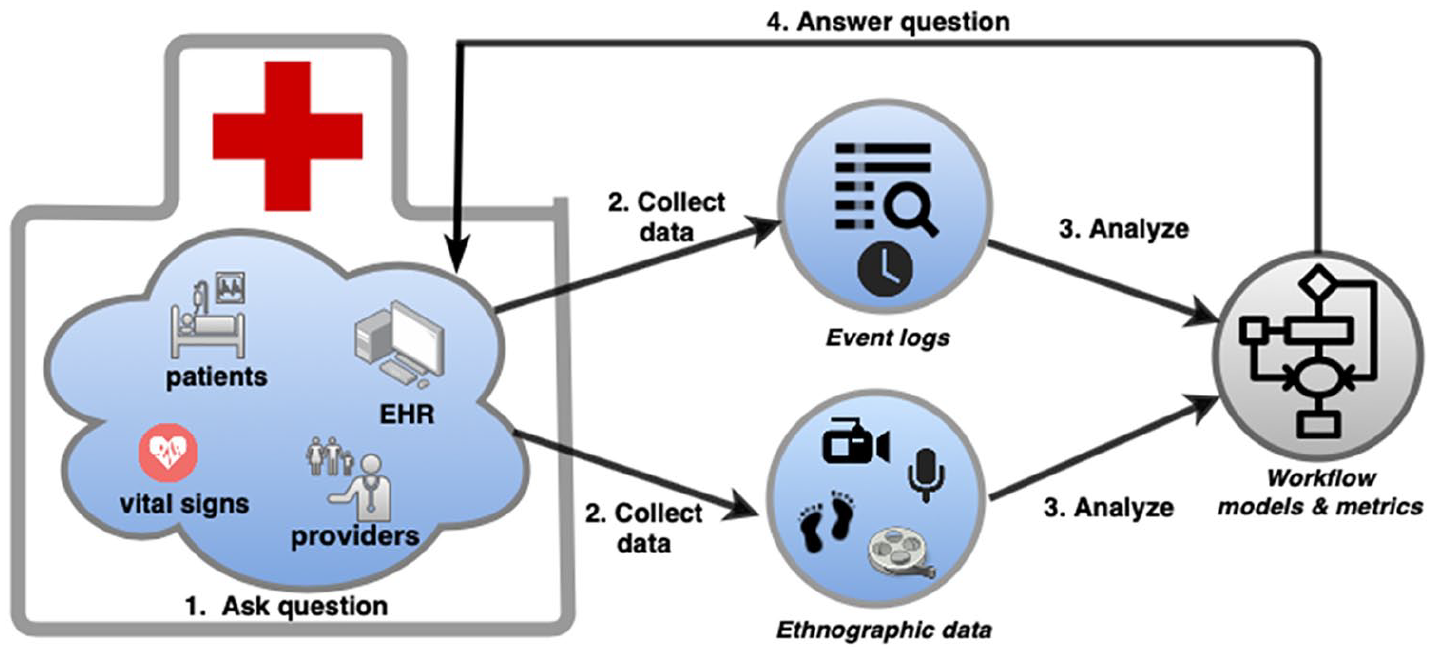
The iterative steps involved in our approach to ethno-mining method are: (1) ask study questions, (2) collect rapid ethnography data and/or big data collected by EHRs or other information systems, (3) analyze data using qualitative and quantitative methods, and (4) answer study questions.
Results
Cycle 1
Ask study questions
We sought to answer (Q1) How much time is spent charting vital signs at the different sites based on ethnography data?
Collect data
A total of 4400 min of Morae™ video recordings were collected. These recordings spanned over 81 providers across PreOp for the three sites.
Analyze data
Table 1 summarizes time metrics calculated from sixteen instances of vital sign charting observed at the three sites. Those video recordings corresponded to ten different providers who performed vital sign charting activities during 59.61 min.
Summary of ethnographic analytics for the vital signs charting task.

Answer questions
In response to Q1, there were differences in time spent charting vital signs between locations. RNs in Setting 2 spent a mean of 38.2 s charting vital signs. RNs in Setting 1 spent close to four times more than the Setting 2 RNs. Finally, RNs in Setting 3 spent close to eleven times more than the Setting 2 RNs spent on vital sign charting.
Cycle 2
Ask questions
A new cycle starts, because the observational findings from Table 1 triggered a new question: Q2) How do the time metrics discovered from observational data compare with findings from computer logs in terms of total, mean and SD times?
Collect data
For one of the sites we only had access to computer logs from 20 providers. Therefore, for the data collection, 20 PeriOp providers who saw patients at the PreOp setting were randomly selected from each site. From Setting 1, 20 providers consisted of three types of providers: Registered nurse (RN), Personal Care Attendant (PCA), and Health Unit Coordinator (HUC). At Setting 2 a total of 20 providers were included and consisted of five types of providers: RN, Certified Registered Nurse Anesthetist (CRNA), Registered Nurse in the Operating Room (RN OR), Nurse Supervisor (NURSE SPV) and Lead Registered Nurse (LRN). In Setting 3, a total of 20 providers participated consisting of three types of providers: RN, Medical Doctor (MD) and CRNA. The 20 providers generated 225,841 computer logs across 5 days in Setting 1, 156,758 computer logs during 4 days in Setting 2, and 89,922 computer logs during 8 days in Setting 3.
Analyze data
Computer log dictionaries were used to identify vital sign charting tasks. Further analysis of computer logs was achieved through review of video ethnography. Time metrics from 997 instances of vital sign charting tasks were discovered at the three sites (Table 2).
Summary of process mining analytics for the vital signs charting task, including and excluding outliers.

Answer questions
The discovery of vital sign charting tasks through process mining (Table 2, including outliers) revealed the presence of vital sign charting instances that were unusually long, (e.g. several times the mean duration), in particular in Setting 1 and Setting 2.
Cycle 3
Ask questions
The findings from Table 2 triggered a new question: (Q3) Based on both ethnographic and computer log analysis, what are the reasons for the discovered differences in vital sign charting between locations?
Collect data
No additional data was collected, instead previously collected ethnographic and computer log data was reused.
Analyze data
To answer Q3, we analyzed rapid ethnography data. Potential reasons for detected outliers were:
a. Interruptions: the provider interacts with the patient, providers, takes phone calls, etc. during vital sign charting.
b. Use of paper artifacts: the provider writes down certain information regarding the patient during vital sign charting.
c. Multi-tasking: the provider accesses other applications, such as medication administration, while charting vital signs.
d. Not saving charted vital signs: the provider does not save after performing vital sign charting tasks for some extended period of time, a necessary step to complete the documentation process.
To remove outliers, a histogram was created from computer logs (Figure 2). The histogram contained all of the 997 vital sign charting instances discovered. For each site, 120 instances longer than 600 s were removed. Then, median and standard deviation (SD) were computed from the remaining 877 instances. Median + 2 SD = 60 + 330 = 390 s. In total, 137 outliers were found and removed by the performance filter of Disco™. Finally, time metrics from the remaining 860 instances of vital sign charting were calculated (see Table 2, without outliers).
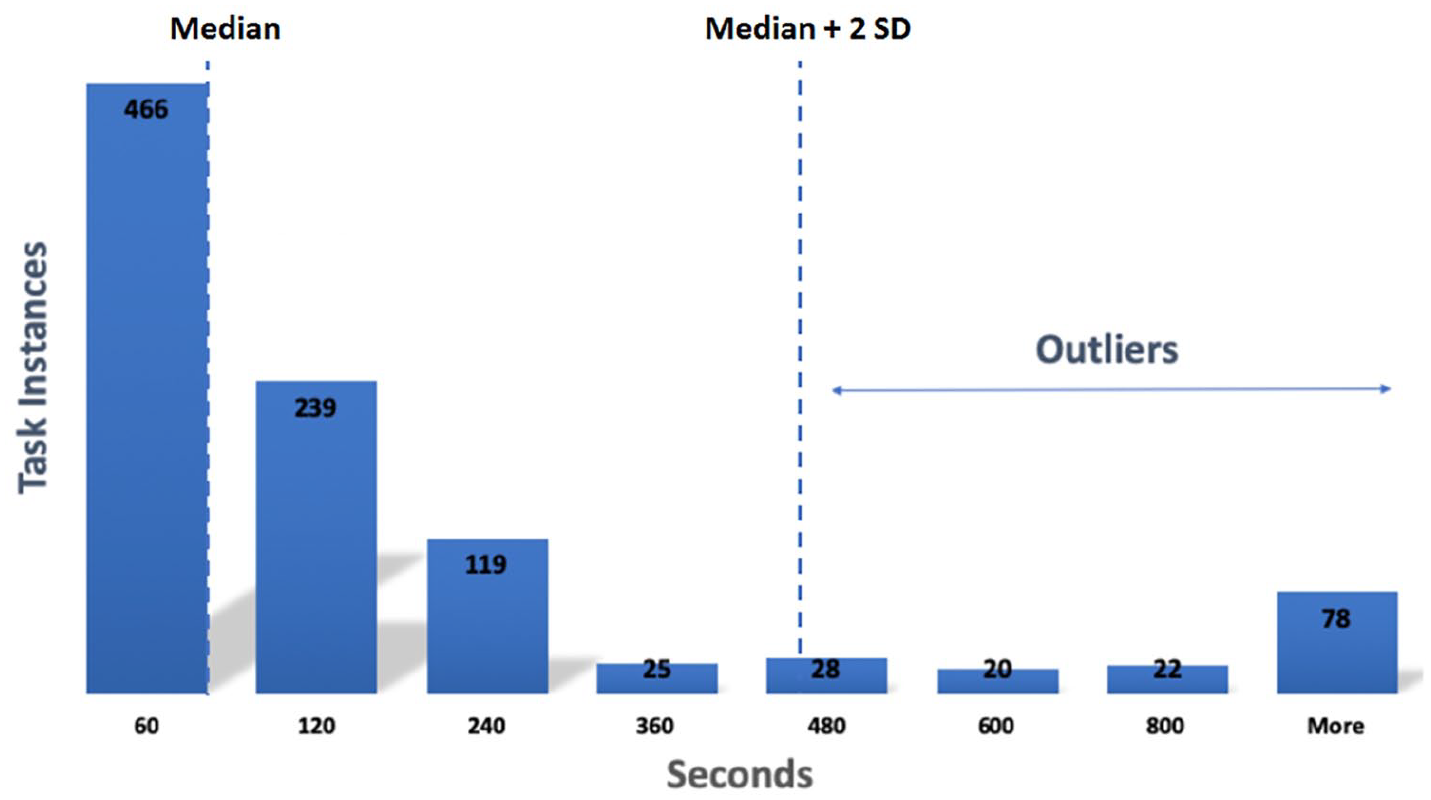
Histogram showing frequency of duration of vital sign charting tasks at three clinical settings.
Answer questions
When outliers were removed, there were small differences in time spent charting vital signs between settings. When conducting t-tests, the differences in time metrics between sites were not statistically significant. From all the providers involved in PeriOp activities, only RNs charted vital signs.
Cycle 4
Ask questions
The findings from Table 2 triggered a new question: Q4) When integrating ethnographic data, how accurate are the time metrics discovered from computer logs?
Collect data
No additional data was collected, instead we reused previously collected ethnographic and computer log data.
Analyze data
Ethnographic and process mining findings were used to:
• Compare time metrics discovered through process mining with ethnographic data
To answer Q4, outcomes from qualitative and quantitative analyses were compared (Tables 1 and 2). For Setting 1 and Setting 2, a perfect match between total time in seconds was found. For Setting 3, three of six task instances had the same total time in seconds. For the other three instances, there was a mismatch between total time in seconds. During the manual analysis of video recordings of EHR interactions, the time the provider was interrupted while charting vital signs (for instance, when interacting with another provider) was disregarded. But, it was not possible to automatically detect those interruptions using process-mining techniques. Therefore, for the three mismatching vital sign charting tasks there was a difference in mean and SD times of 648.3 and 52.72 s, respectively.
• Compare role-based involvement in vital sign charting with ethnographic data
Outcomes from the activity interview data, observations and shadowing were used to identify which providers were responsible for completing the vital signs charting task. In general, RNs were responsible for documenting patients’ vital signs in the EHR. As it was stated by a RN during the interviews: “[. . .] it is the nurse checking in the patient that gets those vital signs”. Those findings were consistent with the finding from the application of process mining methods, as depicted in Table 2.
Answer questions
When ethnographic and process mining methods were used, the outliers were removed and the data was validated. Small differences in time spent charting vital signs between settings were found (Table 2).
These findings could lead to new questions, starting a new cycle. For instance, is the duration of the vital sign charting task affected by the order of execution of other tasks?
Discussion
Rapid ethnography and data mining methods were combined to build on intrinsic strengths of both methods while mitigating their weaknesses. Ethno-mining, an integrative approach of incorporating rapid ethnography and data mining into a single process, has the potential to be synergistic, producing more meaningful and validated results than either a siloed approach to workflow or a dual approach that merely combines both methods albeit less systematically. The study of the vital sign charting task provides a proof of concept for the usefulness of this approach.
Ethno-mining supports blending perspectives of rapid ethnography and data mining by iteratively generating possible interpretations of the data and empirically validating those interpretations. In the first iterative cycle of our analysis, we identified a phenomenon using rapid ethnographic data (e.g. how much time is spent charting vital signs at the different sites based on ethnographic data?). In the second iteration, we interpreted the data using computer log analysis (e.g. how do the time metrics discovered only from observational data compare with findings from computer logs?). In the third iteration, we identified and removed outliers by applying data mining on a large data set of time metrics; rapid ethnography was employed to elucidate the causes for identified outliers (e.g. based on both ethnographic and computer log analysis, what are the reasons for the discovered differences in vital sign charting between locations?). Finally, in the fourth iteration we used rapid ethnographic data to overcome the limitations inherent in computing log analysis alone (e.g. when integrating ethnographic data, how accurate are the time metrics discovered from computer logs?).
The individual methods revealed substantial discrepancies in task duration between sites. Specifically, means of 159.6(78.55), 38.2(34.9), and 431.3(283.04) seconds were captured with rapid ethnography. When process mining was used instead, means of 518.6(3,808), 345.5(660.6), and 119.74(210.3) seconds were found. When ethno-mining was applied, outliers could be identified, explained and removed. Without outliers, similar means (78.1(66.7), 72.5(78.5), and 71.7(75) seconds) were found between sites when performing vital sign charting. Results from this work suggest that integrating rapid ethnography and data mining into a single process may provide more meaningful results than a siloed approach when studying of workflow.
The study of the vital sign charting task helped to identify limitations and strengths on the use of rapid ethnography and process mining to study of EHR-mediated workflows:
Computer logs were created for performance analysis and not for workflow analysis: the computer logs recorded by the EHR aimed to track system performance (e.g. system response time). The computer logs were not granular enough to encode information on the specific vital sign (e.g. body temperature) that was charted. This information could have helped to further validate the findings from the ethno-mining analysis. What we have learned will help to better identify the type of computer logs that we wish to collect in the new EHR ecosystem to better understand and discover clinical workflows and to guide workflow improvements.
Time stamps of the computer logs encoding vital sign charting task were highly accurate: the validation of time metrics through comparison with rapid ethnographic data revealed that the computer logs that encoded the vital sign charting task were precise to the second. In examining, EHR-mediated workflow tasks, differences measured in seconds may be important, especially in a high velocity setting like PeriOp care.
Research questions were limited by the quantity and quality of event logs: as we reported in preliminary research, the EHRs used by Settings 1 to 3 did not always encode in the computer logs the information needed to accurately determine the start and end of relevant PeriOp clinical tasks (e.g. medication reconciliation task).24,25 Lack of precision to automatically determine the occurrence of relevant clinical tasks limited the types of workflow-related questions to be answered. For instance, we could not use computer logs to answer the question triggered by the fourth iterative cycle of the ethno-mining analysis: “Is the duration of the vital sign charting task affected by the order of execution of other tasks?” Instead, we answered workflow-related questions using rapid ethnographic data. 31 At Settings 1 and 2, we compared the distribution of work for EHR tasks and off-screen tasks through quantitative analysis. Suboptimal patterns and reasons for variation were explored through qualitative analysis. Although both settings used the same EHR system, the distribution and patterns of task duration for EHR tasks and off-screen tasks were notably different across settings. Nurses at Setting 1 spent a longer time completing PreOp assessment. EHR tasks occupied a higher proportion of time in Setting 1; while off-screen tasks occupied a higher proportion in Setting 2. The contextual analysis helped to identify the variation associated with the documentation workload, preparation of the patient and regional hospital differences. These findings are being used to inform optimization efforts and research supportive of standardization and harmonization of workflow across settings, post EHR conversion.
Computer log dictionaries and video ethnography were required to interpret computer logs: computer logs were not easy to interpret; dictionaries were needed for initial interpretation of computer logs. Further interpretation was achieved through matching computer logs with video ethnography that recorded providers’ interactions with the EHR.
Computer log and rapid ethnographic data analysis provided complementary insights for the clinical workflow analysis: during the fourth iteration, access to a large sample of computer logs allowed us to automatically identify and remove outliers. On the other hand, rapid ethnographic methods were needed to elucidate hypotheses that could explain the outliers.
The four-cycle ethno-mining approach that we applied in this paper was reused to study time metrics of other task, medication reconciliation, at the same settings. 25 Reusability of the proposed task-based analytic method allowed for rapid study of EHR-based workflow and tasks. Other use cases were explored using ethno-mining.23–27
While we were able to retrospectively contrast findings from the automatic analysis of computer logs against 16 video recording instances of the vital sign charting task, further prospective validation through new data collection was not possible after the adoption of a new EHR in all the locations. We are in the process of repeating this study with the new EHR at all the locations. The goal will be to compare the outcomes of the ethno-mining approach with findings from in-depth rapid ethnographic approaches. A study of this kind will enable the further evaluation of the accuracy of the ethno-mining approach and better understand its limitations and strengths. The ethno-mining approach presented in this paper will help to guide future analysis.
Although outliers were in effect treated as noise in this study, they may also be treated as the focal subject for a separate inquiry. 23 For example, it is possible to use outliers to document and diagnose lags in EHR-mediated workflow using ethno-mining methods.
Ethno-mining can be time and resource intensive. It requires access to health care environments to support in situ collection of rapid ethnographic data and collaboration of an interdisciplinary research team with expertise in both computational and ethnographic methods to analyze, triangulate and validate collected data.
The types of research questions that can be answered with the ethno-mining approach and the degree of confidence in the validated outcomes depend on the quantity and quality of the ethnographic data and computer logs used. The limitations of researching events ethnographically have been discussed before. 33 Factors that affect the quality of computer logs include trustworthiness, completeness, semantic accuracy, time accuracy and others.34,35 Given these limitations, the ethno-mining appears relevant for the task of improving and automating the analysis of workflow related to EHR use.
EHR data can be retrospectively accessed and analyzed using data mining techniques. Similar to computer logs, EHR patient data is already collected by health care facilities. Compared with ethnographic data, access to EHR data tends to be less resource intensive and intrusive, and more scalable. There have been attempts to extend process mining methods to include into the analysis relevant process-related attributes extracted from the patients’ EHR. 36 Incorporating EHR data could help to explain workflow differences based on the surgical procedure, patient condition, clinical complexity, etc. The findings from such research can be used to optimize workflow, eliminate inefficiencies, mitigate disruptions, and improve patient safety.
Conclusions
The combined use of rapid ethnography and process mining analysis was applied to the study EHR-mediated clinical workflows. Time metrics related to vital signs charting at three different PreOp settings were measured and studied.
Ethno-mining is currently being used by our research team to study and draw comparisons between PeriOp and emergency settings at the different regional hospital locations, before and after the implementation of a new EHR. The goal is to inform efforts on workflow improvement and standardization.
The applicability of ethno-mining is broad. We envision that the future application of ethno-mining will incorporate the use of EHR patient data to the study of patient-specific clinical pathways. EHR data could be used to explain further workflow differences based on relevant factors, such as surgical procedure, patient condition and demographics and clinical complexity.
Footnotes
Acknowledgements
We also thank the clinicians for allowing us to observe and record their activity.
Declaration of conflicting interests
The author(s) declared the following potential conflicts of interest with respect to the research, authorship, and/or publication of this article: Karl A. Poterack, Timothy Miksch and Richard A. Helmers are employed by the Mayo Clinic.
Funding
The author(s) disclosed receipt of the following financial support for the research, authorship, and/or publication of this article: the Mayo Clinic, for the financial support provided to the authors.
Human subjects protections
This study was performed in compliance with human subject protections and ethical principles of medical research, and was reviewed by the Mayo Clinic Institutional Review Board.