
Abstract
Hospital-acquired pressure injuries (HAPIs) are a major source of unintended patient harm and unnecessary costs. The Braden Scale is widely used for risk assessment, yet it lacks specificity and clinical applications. This study used the electronic health record to examine associations between patient-specific factors and pressure injury. Adult patients (age >18) with 3-day length of stay from April 2011 to December 2016 were included. Pressure injuries were identified by ICD-9/ICD-10 codes. Longitudinal multivariate logistic regression was used to evaluate the association between patient-specific factors and HAPIs. This included 57,227 hospital encounters and 241 HAPIs. We observed 2–3 times increased likelihood of acquiring a pressure injury among patients who were malnourished or who had increased intraoperative time. The Braden subscales of nutrition, mobility, and friction showed significant predictive value. Future work is needed to assess the clinical applicability of this work.
Keywords
Introduction
Hospital-acquired pressure injuries (HAPIs) cause significant harm to patients and require additional management. Pressure injuries are wounds that develop as result of immobility and prolonged pressure over bony prominences or under medical devices. Exactly how these injuries occur remains to be elucidated. Several factors have been hypothesized to increase the likelihood of tissue necrosis, including poor nutrition and decreased perfusion. These injuries are costly, with an estimated $11 billion in costs annually. 1 Recent cost analysis of Medicare patients, who constitute approximately 40%–45% of our patient population, suggests an increased cost of $3,242 for severe pressure injuries. 2 Patients with HAPIs are more likely to be readmitted within 90 days, have days uncovered by Medicare during the admission, and are more likely to require post-acute care. 2 These injuries also significantly impact patients’ quality of life, causing a range of issues from pain and prolonged hospitalization to severe disfigurement. Data on prevalence and incidence rates are variable due to historical differences in definitions of injury and measurement, making comparisons across institutions difficult. 3 Few peer-reviewed reports with incidence and prevalence data have been published.3–5 Prevalence differs significantly between critical care units and non-critical care units, as indicated by critical care areas having 3.8 times the prevalence rate of pressure injuries at one institution. 4 A recent literature review reported a range of prevalence from 6% to 22% in the acute care setting, due to different interpretations of the classification system and different data collection tools. 3 Prevalence data are performed at quarterly intervals and are not sufficient to provide characterization of patterns or the effect of interventions performed at the system level. 6 The prevalence rate in 2015 in our 400-bed institution ranged from 2% to 4%; however, full-thickness HAPIs were occurring at a rate of 1–2 per month during this same time 7 . This not only incurred a significant cost to the institution but also resulted in decreased quality of life for patients. Review of internal events revealed pressure injuries were occurring on different units and had a similar root cause of injury, suggesting that the Braden Scale and our understanding of what predicted risk for pressure injury development were not sufficient for our patient population.
The Braden Scale is a pressure injury risk assessment tool designed to allow bedside nurses to determine the level of risk for each of their patients. The tool consists of six subscales, sensation, activity, mobility, moisture, nutrition, and friction/shear, and their summed total score. Each subscale is designed to measure a specific factor that will likely increase risk for pressure injury development. Sensation measures the ability of the patient to respond meaningfully to discomfort. Activity measures the amount of physical activity the patient is able to perform, and mobility assesses the ability of the patient to change and control body position. Moisture measures the degree of skin exposure to moisture. Nutrition assesses adequacy of caloric intake. Friction/shear is based on the ability of the patient to move or control their position. Those with poor control are likely to be exposed to high levels of friction and shear during mobilization. Higher scores in each subscale and in total indicate reduced risk. The total scale focuses on the two major proposed forces in pressure injury development: pressure (sensation, activity, and mobility) and tissue tolerance (moisture, nutrition, and friction/shear). 8 Literature suggests that the Braden Scale is not the most predictive of risk in the acute care setting and that the score has negligible impact on the patient’s plan of care.9–10 Reviews of the utility of the Braden scale in the acute care setting by Cox and Alderden highlight that the Braden scale is highly sensitive but lacks specificity and often overpredicts risk.9–10 Current practice dictates a total Braden score of less than 18 as at risk; however, ICU patients generally score well below this value, which highlights the fact that a critical score is likely not applicable to all care settings. 10 Several publications have explored the idea that individual subscales more accurately predict risk than the total score and that associated risk is not linear, meaning that intermediate risk scores have a higher predictive value. 9 Noting these gaps, we examined the possibility of the use of electronic health records (EHRs) to identify patient-specific factors that are associated with increased risk of pressure injury based on a retrospective analysis of our patient population. Work by Padula et al. has demonstrated that retrospective analyses of EHRs can identify meaningful risk factors based on statistical models.11–14
The purpose of our study was to perform statistical analyses of factors that are part of the inpatient care experience and patient comorbidities that contribute to increased pressure or decreased tissue tolerance using data from the EHR. While previous studies focused on full-thickness pressure injuries,11–12 our analyses considered all levels of injury to consider a broad spectrum of areas of intervention unique to our patient population. This is key for our institution as we have been able to reduce the number of full-thickness injuries, but additional opportunities remain to decrease the incidence of deep tissue and stage 2 injuries.
Deep tissue injuries (DTIs) are purple or maroon non-blanchable discoloration to intact skin. These injuries are suspected to extend past the dermal layer; however, it is not possible to know the true extent of the injury based on the visible changes. Based on our clinical experience, DTIs are our highest risk category of injury due to the greatest potential to evolve into full-thickness injuries (injuries extending to subcutaneous tissue and/or muscle or bone), without timely recognition and treatment. Stage 2 injuries are partial-thickness skin loss, which would decrease tissue tolerance and increase risk of further injury if pressure is not adequately relieved. Understanding factors that contribute to risk of pressure injury development will help to tailor prevention efforts and minimize harm to our patient population.
Methods
Study design and sample selection
We conducted a retrospective cohort study of inpatient discharges at a tertiary academic medical center in New Hampshire. The institution is a level 1 trauma center located in a rural setting with a patient population primarily of Caucasian older adults. The institution is a transfer center and receives a wide range of medically complex cases. Case mix index ranges from 1.86 to 2.04. Adult patients aged 18 or older with a length of stay greater than or equal to 3 days were included in the analysis similar to the study performed by Padula in 2016. Patients also had to have at least three Braden assessments during the admission to be included. We used a data set of 57,227 hospital encounters from April 2011 to December 2016 (Table 1).
Population Demographics Across Hospital Encounters (n = 57,227) With or Without Hospital-Acquired Pressure Injury.
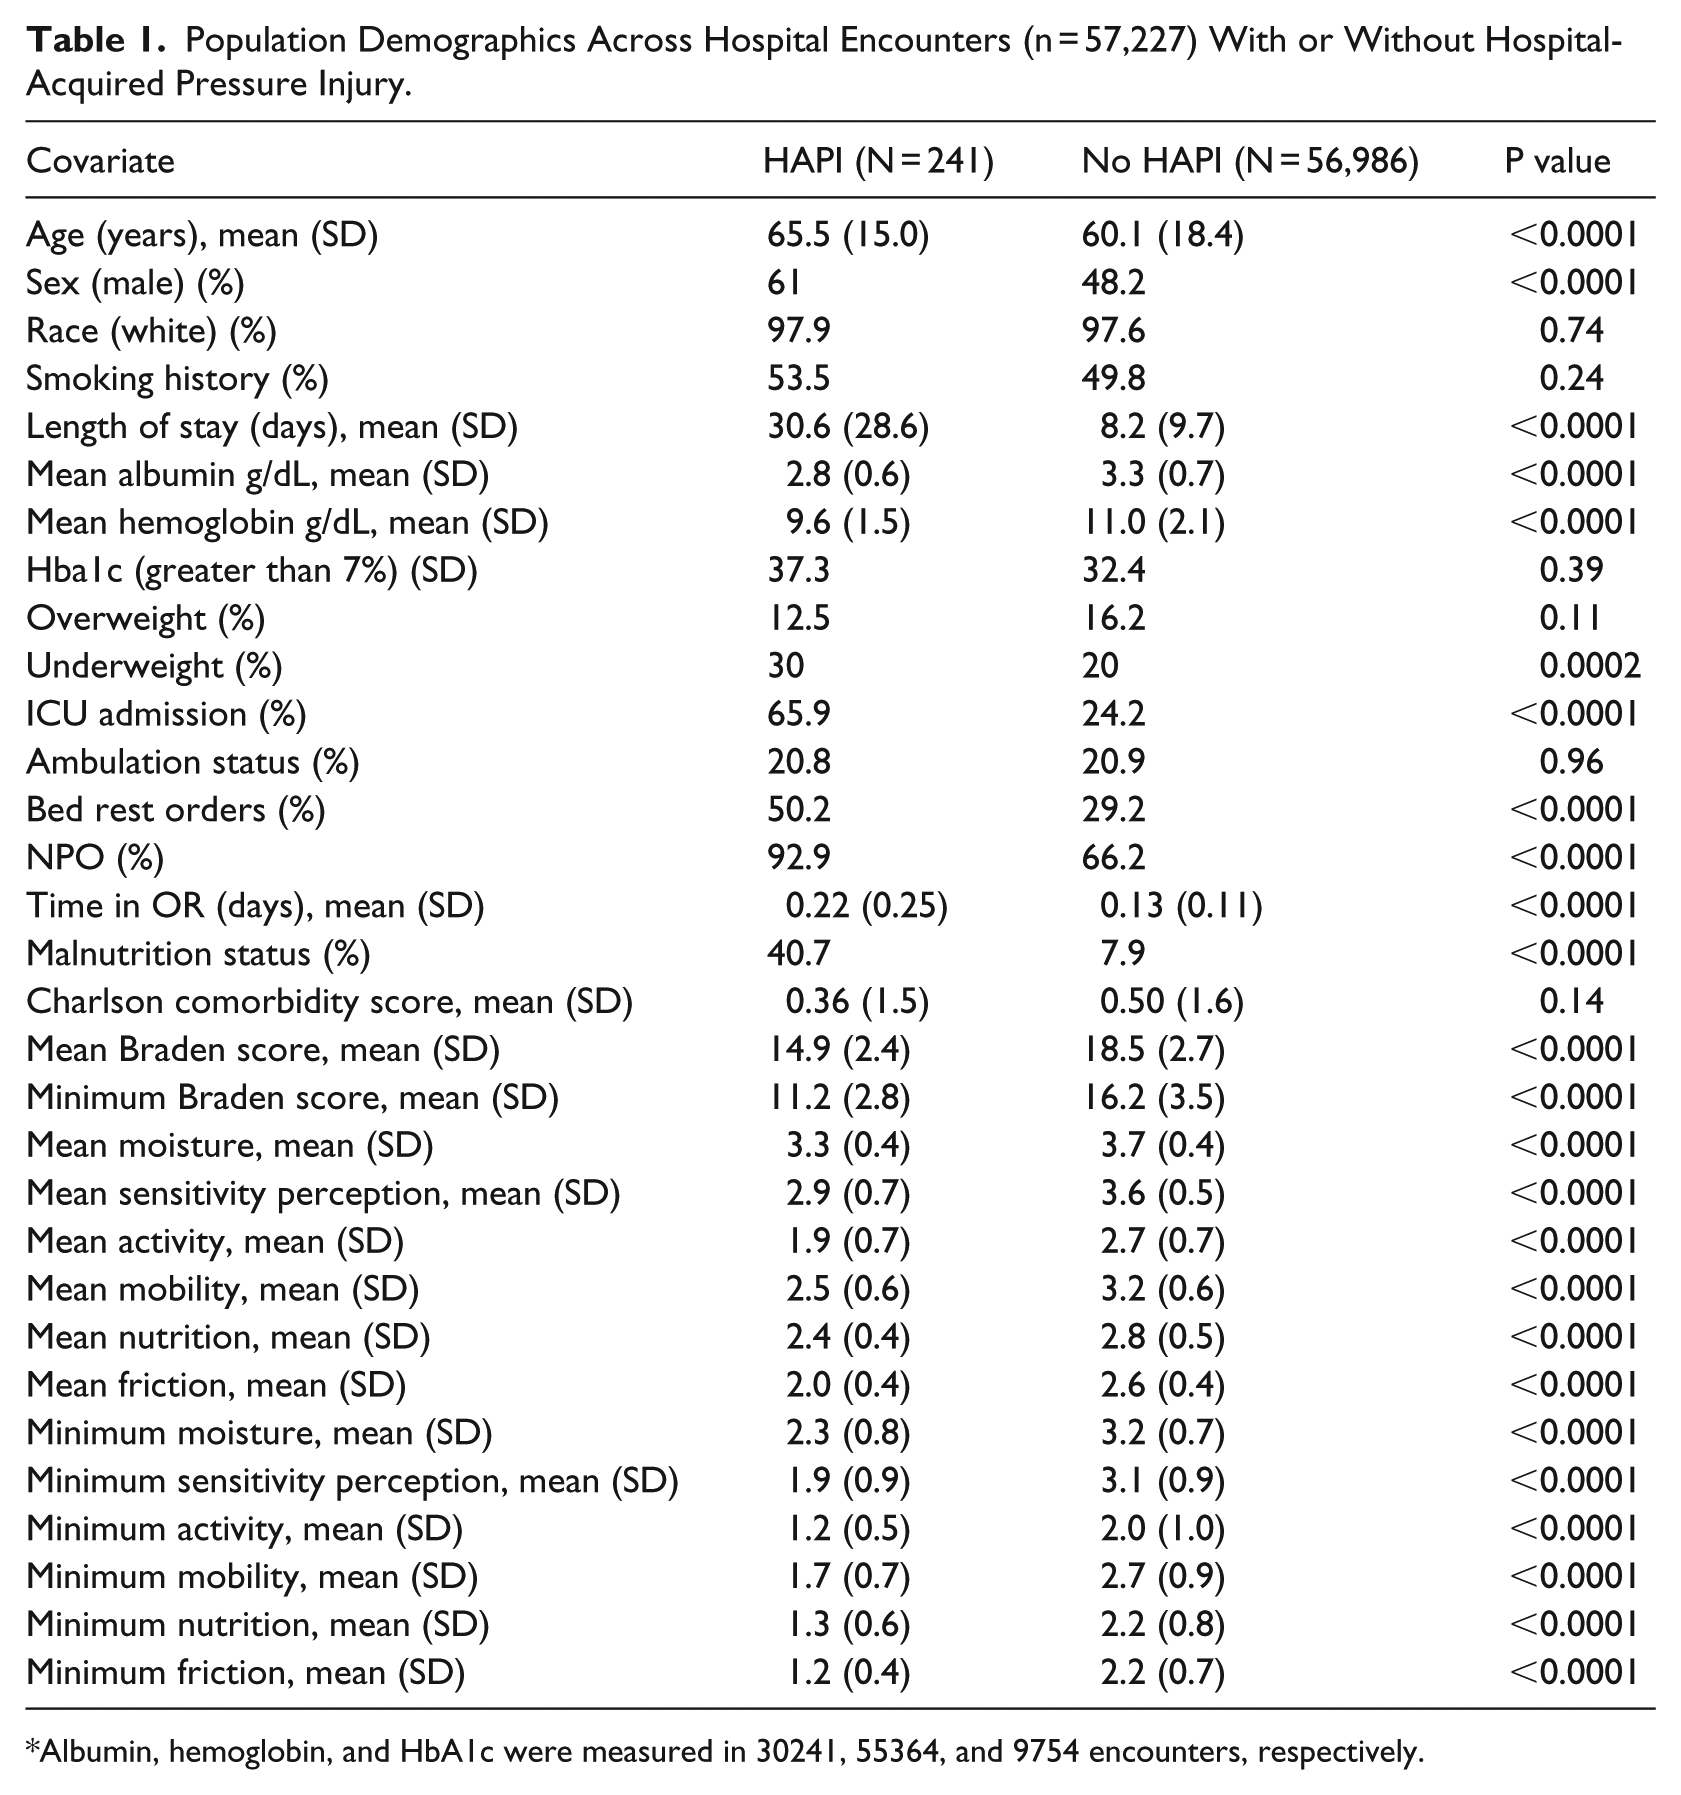
Albumin, hemoglobin, and HbA1c were measured in 30241, 55364, and 9754 encounters, respectively.
Outcome
Pressure injuries were identified by the presence of ICD-9 or ICD-10 codes. Only HAPIs were included. All stages and locations of pressure injury were included. Our data set included any ICD-9 code in the 707 range (707.0–707.09 and 707.2–707.25), which is defined as a chronic ulcer of the skin caused by pressure. The ICD-10 codes included were in the L89 range (89.00–89.95), which is defined as a pressure injury. ICD codes are unique to each condition present and treatment provided. These codes are the basis for determining cost. Data were cross-referenced with supporting clinical documentation such as a documented injury in charting by nurses and the presence of a wound care team consult to reduce the number of false positives. Events that met the criteria of an ICD code, documented flowsheet row, and a wound care consult were considered a true HAPI. Two hundred forty-one of these cases did not have a present on admission ICD code. Previous work had used ICD codes alone; however, on review of the initial data, we identified that a number of patients had ICD codes for pressure injuries with no corresponding clinical documentation. Therefore, we chose to add the additional inclusion criteria of nursing documentation and a wound care consult.
Exposure and covariates
The exposures were chosen in this study based on the literature and factors hypothesized to play a role in pressure injury development.10–14 The Braden Scale was considered a primary exposure to determine if risk based on the scale would correlate to actual risk for injury development. Both the minimum and mean of at least three Braden scale assessments were used for a total Braden Scale variable as well as for the six subscales, which were considered as individual exposures. All factors chosen were thought to decrease tissue tolerance by decreasing either perfusion or sensation or by affecting nutritional status. Each subscale has a 4-point Likert-type scale with 1 identifying the highest level of risk, except for the friction subscale which is a scale of 1–3.
Additional covariates thought to have potential to increase risk were age, length of stay, body mass index (BMI), ICU admission, NPO status (nothing by mouth), ambulation status/presence of activity orders, malnutrition diagnosis, and time spent in the operating room taken directly from the medical records. Additional patient characteristics examined from the electronic record included race, gender, weight, and smoking history (Table 1). Hemoglobin, hemoglobin A1c (HbA1c), and albumin were used as covariates in the subsample of the patients for which these tests were performed.
Statistical analysis
Univariate analyses were conducted to determine the relationship between the exposure variables and the development of HAPI. Categorical variables were assessed with the chi 2 test and parametric continuous variables by analysis of variance (ANOVA). Categorical variables were expressed as frequencies (n, %) and continuous variables as means with 95% confidence intervals (CI).
Longitudinal multivariate logistic regression was employed to assess the association between clinical parameters (exposure, independent variable) and the development of a pressure injury (outcome/dependent variable) using generalized linear models with a binomial probability distribution (PROC GENMOD procedure in SAS). Maximum likelihood parameter estimates and 95% CI were calculated. Results are presented as risk ratios (RR) indicating the risk associated with developing a pressure injury per one unit change in the exposure variable.
Associations between the mean and minimum Braden score with the development of a pressure injury were assessed in model 1, adjusted for the following covariates that a priori could influence the outcome; length of stay (days), age, race, gender, BMI on admission (over (GE 35 kg/m2), under (LT 18.5 kg/m2), and normal (GE 18.5, LT 35 kg/m2, ref)), smoking history (ever, never), ICU stay (yes/no), ambulation status (yes/no), bed rest orders (yes/no), NPO status (yes/no), time spent in OR (hours), malnutrition status (yes/no), surgeries during the admission (yes/no), and Charlson comorbidity score. Model 2 added each minimum and average subscale score to model 1, and model 3 assessed all subscale measures along with covariates listed in model 1, without the minimum or mean total Braden scores.
A subsample analysis included hospital encounters that included averaged measurements of albumin and hemoglobin and whether the patient had an HbA1c value over 7 during their admission. Missing values for HbA1c were considered no.
Statistical analyses were performed using the software SAS (SAS Institute Inc., Cary, North Carolina; USA, Version 9.4). Two-tailed tests were applied, and P values smaller than 0.05 were considered statistically discernable differences. The institutional review board granted exempt status to conduct the study.
Results
Each encounter met our inclusion criteria of age greater than 18 years, length of stay greater than or equal to 3 days, and at least three Braden scale scores (Table 1). Two hundred forty-one of these encounters over a 5.6-year time span included a HAPI as determined by coding at time of discharge. The average age of patients with a HAPI was 65 years and 60 years for patients without a HAPI. Length of stay differed significantly between the two groups: HAPI patients averaged a 30-day stay and patients without injury averaged 8 days. Average albumin and hemoglobin levels were lower among patients with HAPIs. Bed rest orders were present in 50% of the patients with HAPIs and were found in 29% of the patients without HAPI. Patients with HAPIs were more likely to have had NPO orders and were malnourished 41% of the time compared with 8% of patients without injury. Patients with hospital-acquired injuries spent more time in the operating room and had lower averaged and minimum Braden scores.
Multivariate analysis that controlled for confounding variables demonstrated a protective effect of higher Braden scores, indicating that each point increase on the averaged or lowest Braden score conferred a 15% or 17% reduced risk, respectively, of obtaining a pressure ulcer during the hospitalization (Figure 1 and Table 2, Model 1: RR (95% CI): 0.85 (0.78, 0.93) or 0.83 (0.76, 0.89)). The individual subscores demonstrated that a higher minimum nutrition score was associated with a reduced risk of almost 50% for higher averaged scores (Figure 1 and Table 2, Model 3: RR = 0.53, 95% CI = 0.38, 0.74). A higher average nutrition score was not protective (RR = 1.63, 95% CI = 1.08, 2.47). Higher average mobility and friction scores were also significantly associated with a protective effect (RR = 0.55, 95% CI 0.32, 0.96, and RR = 0.35, 95% CI = 0.21, 0.58), respectively. The higher average minimum friction score, the more protected patients were from experiencing a HAPI (RR = 0.16, 95% CI = 0.11, 0.25). The mean moisture score showed borderline significance as a risk with RR = 1.69, 95% CI = 1–2.88.
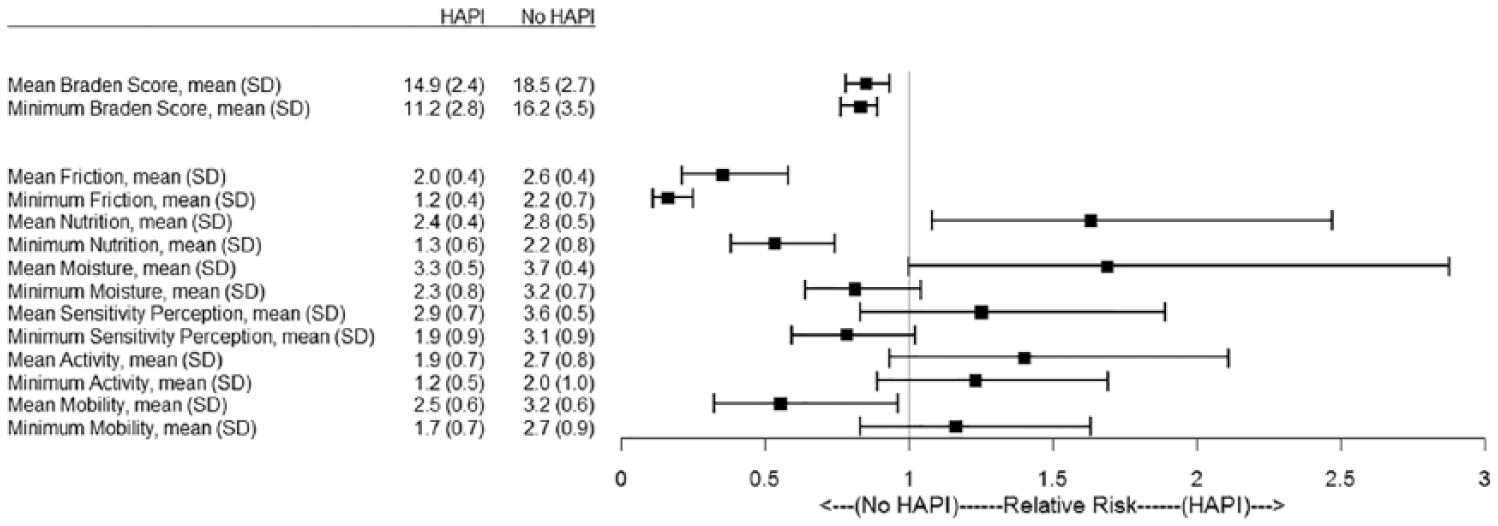
Braden Scale and subscale values in hospital encounters that results in pressure injuries (hospital-acquired pressure injury (HAPI)) or not (no HAPI). The means and standard deviations (SD) for the mean and minimum values of the Braden Scale and all subscales are listed in the table to the left of the forest plot illustrating the relative risk and 95% confidence intervals of each measure.
Multiple Logistic Regression Analysis; Risk of Pressure Injury in Hospitalizations ⩾5 days With At Least Three Braden Scores (n = 57,227).
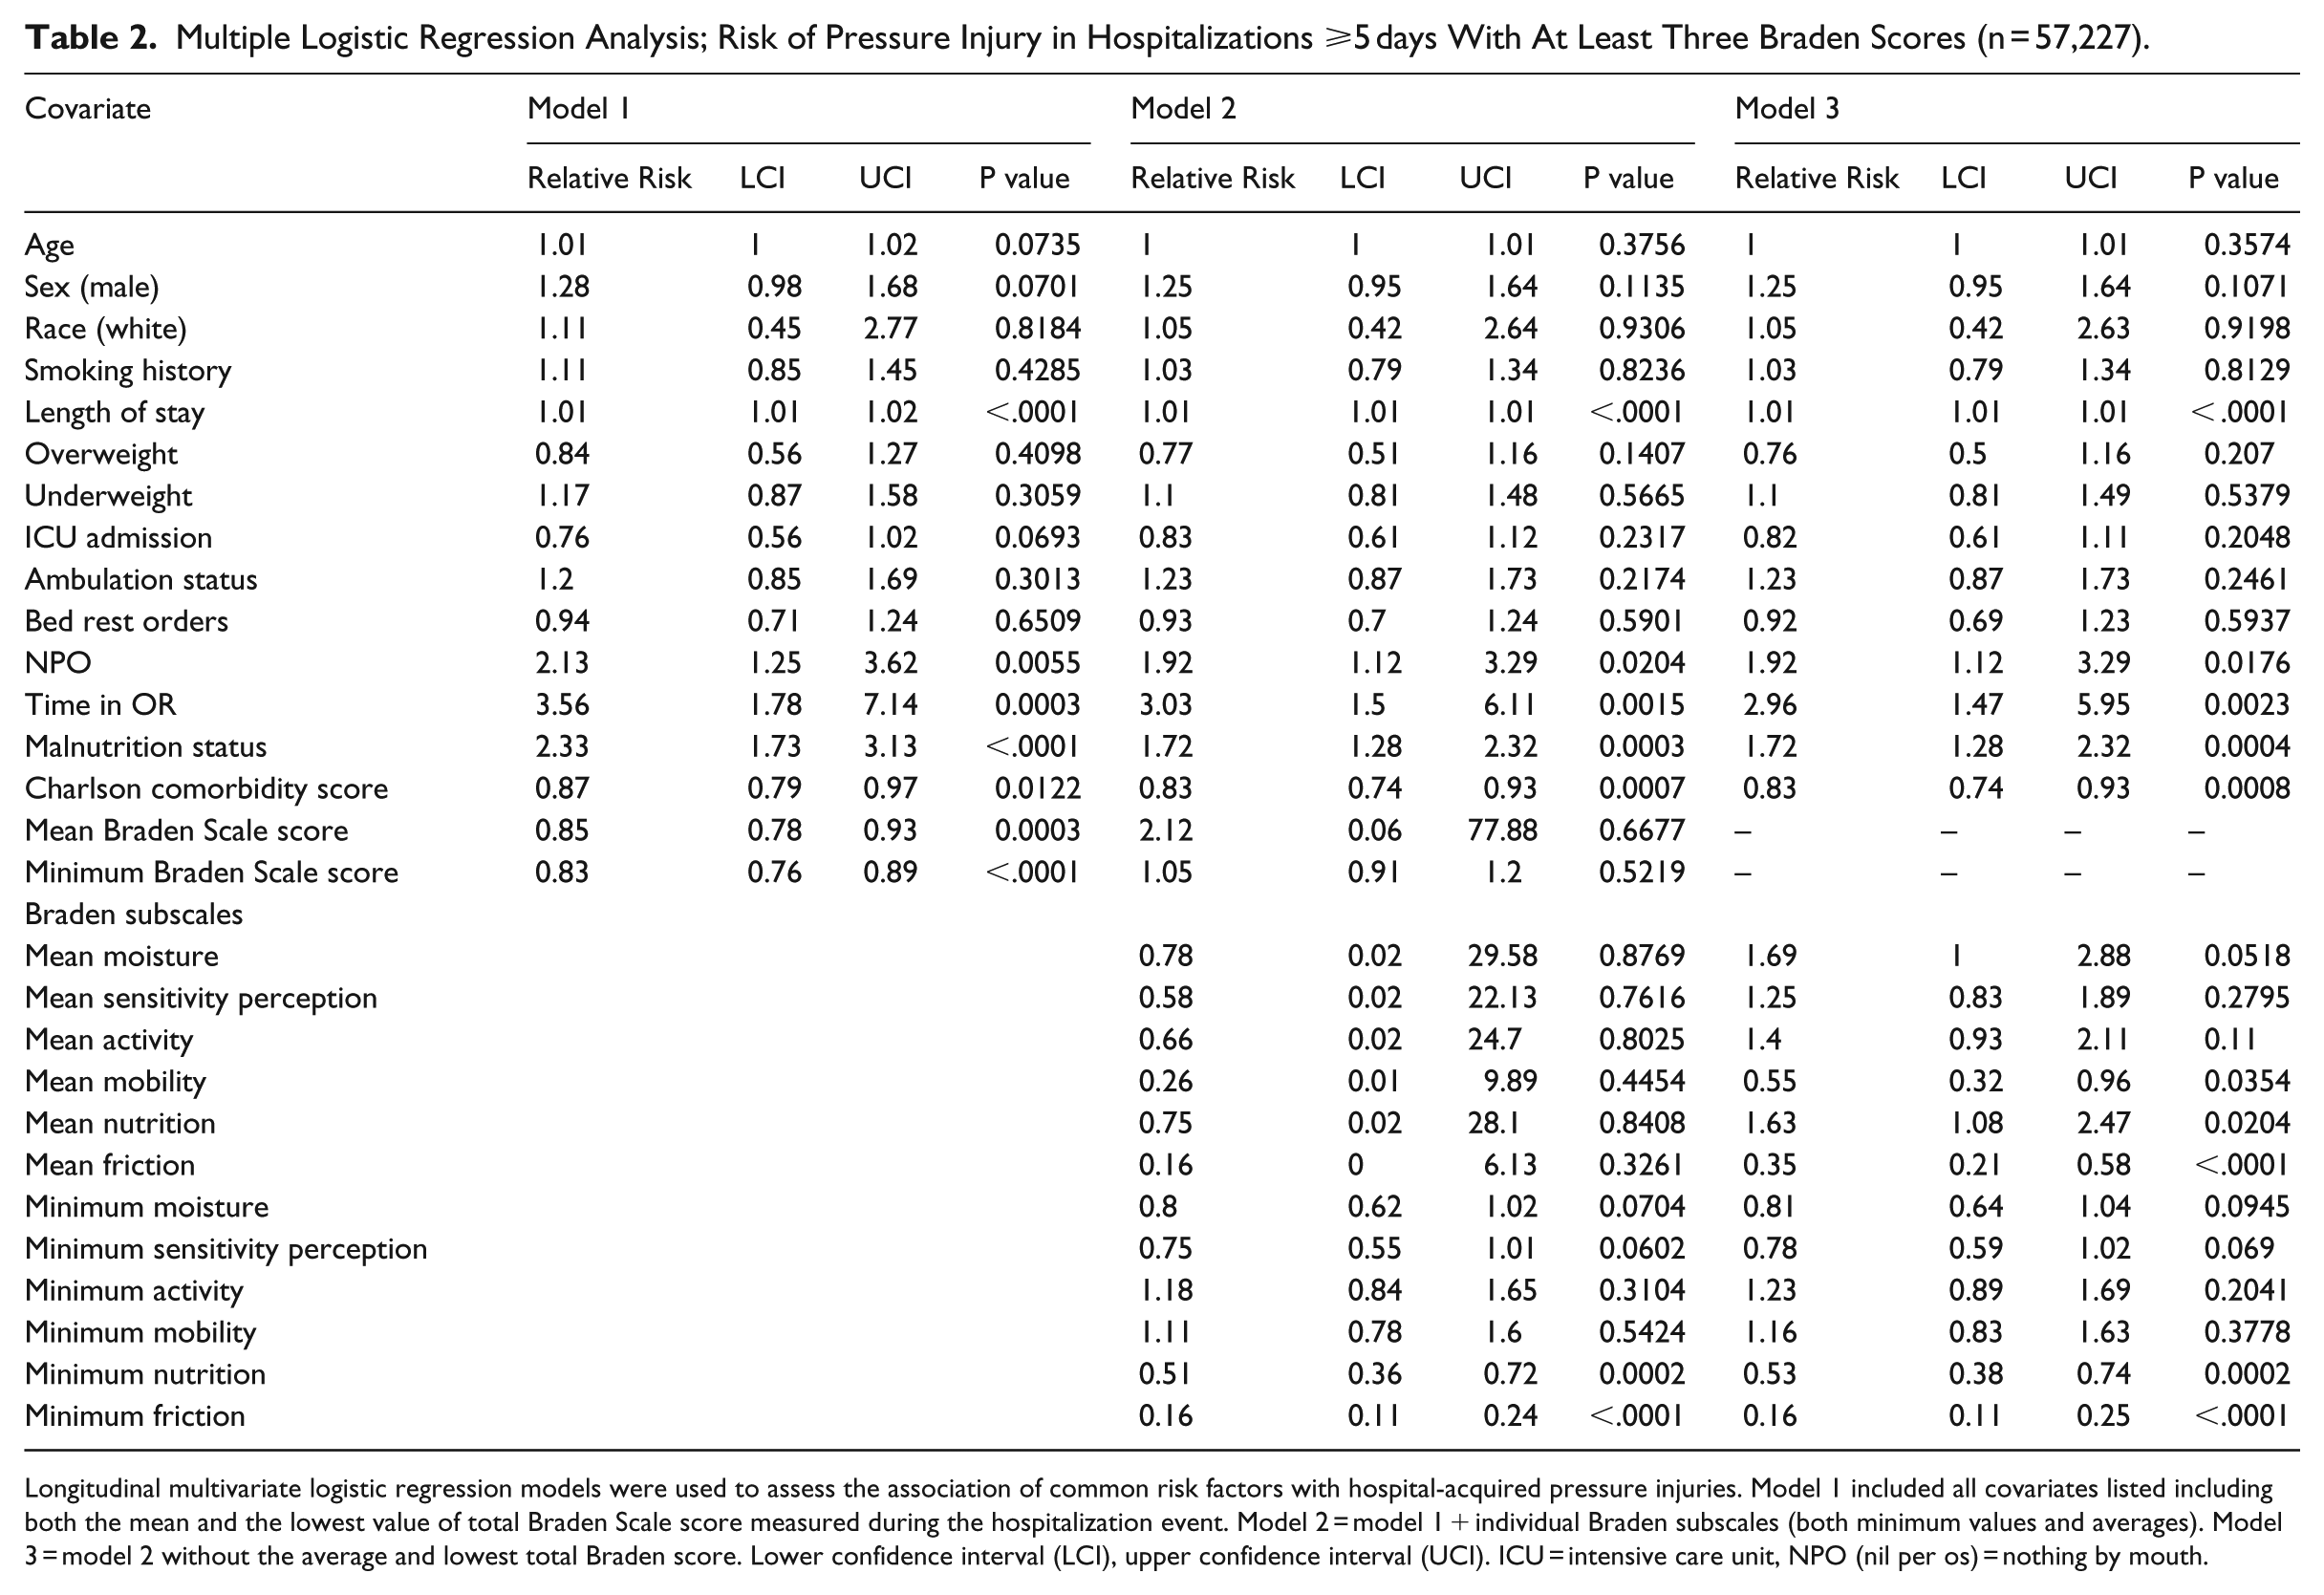
Longitudinal multivariate logistic regression models were used to assess the association of common risk factors with hospital-acquired pressure injuries. Model 1 included all covariates listed including both the mean and the lowest value of total Braden Scale score measured during the hospitalization event. Model 2 = model 1 + individual Braden subscales (both minimum values and averages). Model 3 = model 2 without the average and lowest total Braden score. Lower confidence interval (LCI), upper confidence interval (UCI). ICU = intensive care unit, NPO (nil per os) = nothing by mouth.
Age, gender, smoking, BMI, ICU admission, and activity or bedrest orders had no significant increase in the odds ratio across all three models. NPO status and a diagnosis of malnutrition were twice as likely to increase relative risk of pressure injury (RR = 2.13, 95% CI = 1.25, 3.62) and (RR = 2.33, 95% CI = 1.73, 3.13), respectively, (Table 2, Model 1). The inclusion of Braden subscales reduced the significance and size of these effects slightly (Table 2, Models 2 and 3). Time spent in the operating room showed a threefold increased risk for pressure injury development (RR = 2.96, 95% CI = 1.47, 5.95) when models accounted for all Braden subscales (Table 2, Model 3).
Analysis of a subsample of hospital encounters from which hemoglobin and albumin levels were available indicated similar associations with the total Braden scale measurements; however, the subscale analysis was impacted by inclusion of these metabolic biomarkers (Table 3). The average moisture subscale became a significant predictor of increased risk for pressure injury development in this model, with higher average moisture scores (indicating less moisture) being 2 times more likely to have an injury develop (RR = 2.09, 95% CI = 1.17, 3.74), which is contradictory to expectations (Table 3). All other subscales showed similar trends as observed in the main analysis. The subanalysis that included relevant biomarkers also showed increased risk of pressure injury in patients with an HbA1c measure over 7 (RR = 1.72, 95% CI = 1.08, 2.73). Malnutrition, NPO orders, and intraoperative time demonstrated similar increased risk as seen in the main analysis. Being overweight (BMI greater than 35) demonstrated a protective effect in this model (RR = 0.62, 95% CI = 0.39, 0.99). (Table 3).
Multiple Logistic Regression Analysis; Risk of Pressure Injury in a Subsample of Hospitalizations With Measures of Hemoglobin and Albumin (n = 30,005).
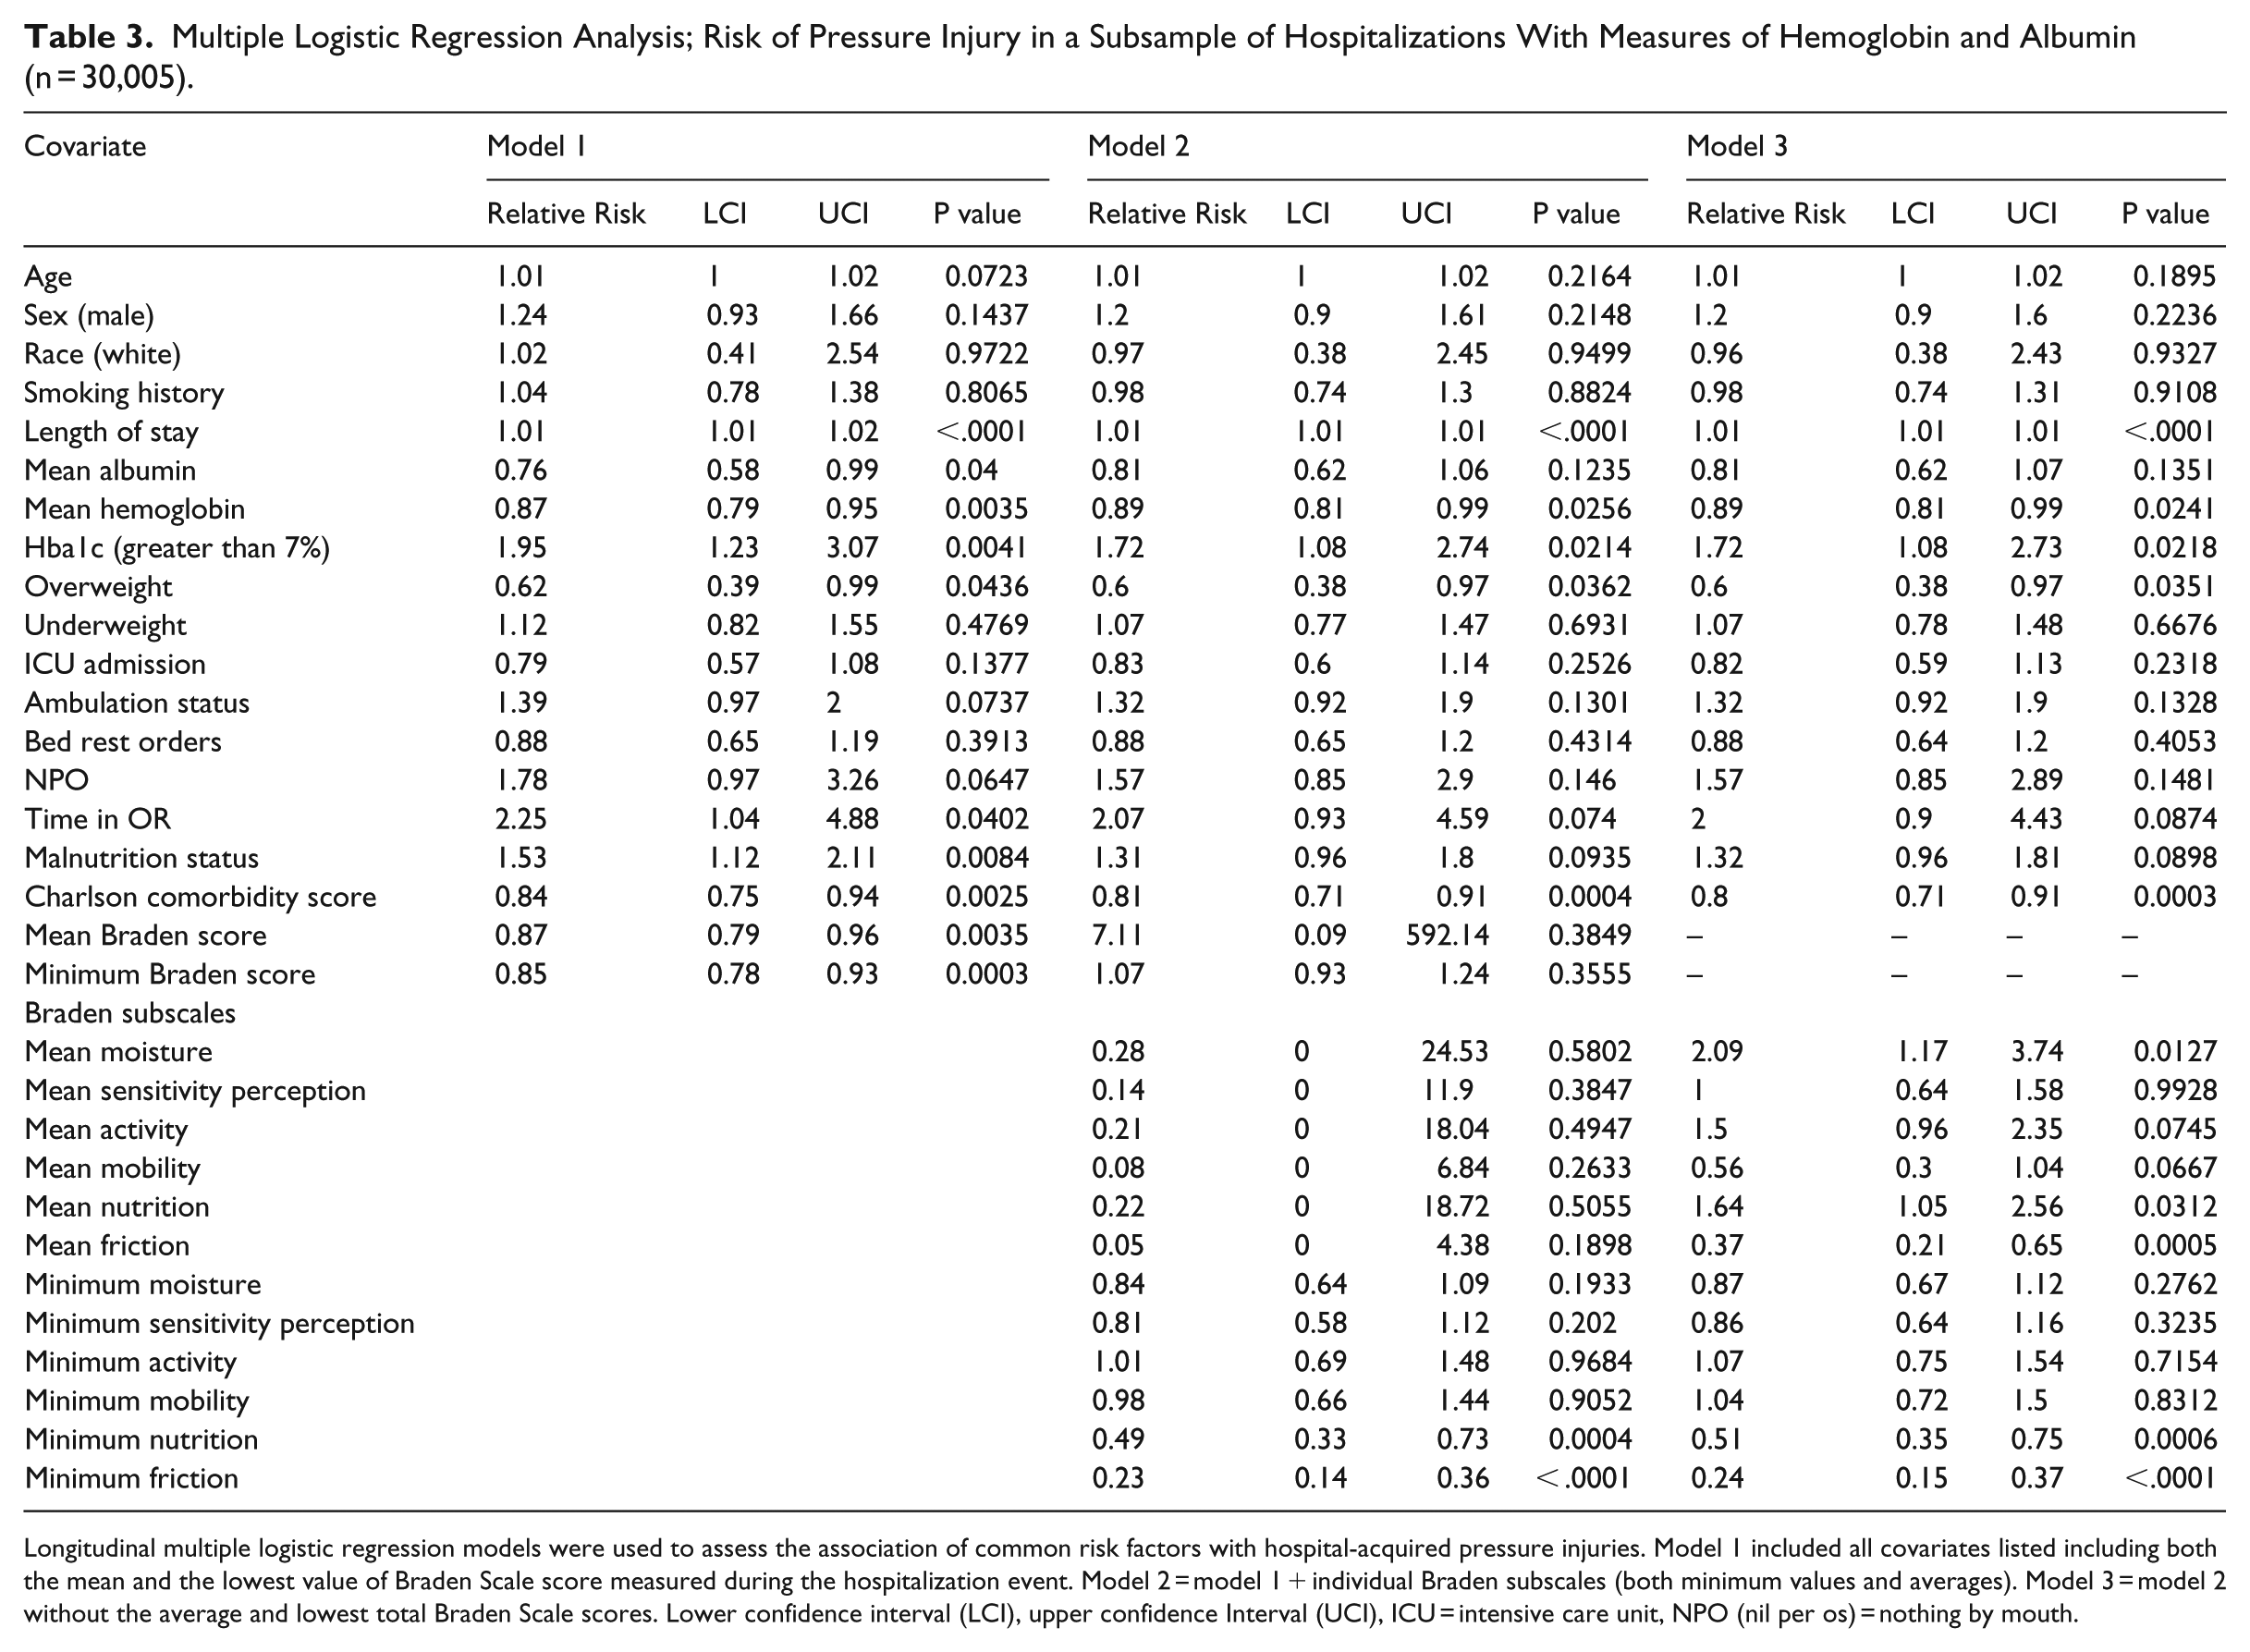
Longitudinal multiple logistic regression models were used to assess the association of common risk factors with hospital-acquired pressure injuries. Model 1 included all covariates listed including both the mean and the lowest value of Braden Scale score measured during the hospitalization event. Model 2 = model 1 + individual Braden subscales (both minimum values and averages). Model 3 = model 2 without the average and lowest total Braden Scale scores. Lower confidence interval (LCI), upper confidence Interval (UCI), ICU = intensive care unit, NPO (nil per os) = nothing by mouth.
Discussion
This work utilized patient-specific information to look for correlation among the Braden scale as well as known and hypothesized risk factors with pressure injury development. Based on our findings, potentially modifiable risk factors for pressure injury development are present for patients entering an acute hospital care setting. On the surface, little seems to differentiate these patients. Factors correlating with increased risk for pressure injury in our patient population include NPO status, malnutrition, and longer time in the operating room, bedrest orders, and the Braden subscales of nutrition, friction, and mobility. A review by Papanikolaou in 2015 presented 15 studies, of which 6 showed nutritional factors correlated with increased risk and 2 showed surgical procedures contributing to risk. As an institution, we have suspected nutrition to be a contributing factor in many of our events, but limited published evidence exists to support our conclusion. A review by Alderden 2017 of risk factors for critical care patients states that the total Braden score correlated with increased risk in some studies, but interestingly no information is discussed on risk related to the individual subscales. Nutrition findings were also mixed, with one low-quality study showing that days without nutrition correlated with increased risk but this interpretation was disputed by the reviewers. 15 Nutrition did not emerge as an independent risk factor in four other studies. 15 The Braden subscales of nutrition, friction, mobility, and moisture have correlated with increased risk in other studies, similar to our findings.9,16 The variability in the data among the Braden subscales, particularly for averaged values of nutrition and moisture, could be related to the subjective nature of the scale and highlight the fact that consistent scoring is difficult even among experienced clinicians. In addition, we hypothesize that patients who develop HAPIs may do so in part because of unrecognized risk. Higher Braden scores may lead the clinician to be less proactive with pressure injury interventions and subsequently lead to injury. Future efforts should further examine the subscales that correlate with increased risk and determine whether focus on these areas of care decreases pressure injury incidence. Little is known about the rate of perioperative pressure injuries, and one high-quality study demonstrated increased risk with non-cardiac surgery. 15 We had noted a trend among our patient population of increased intraoperative time internally during event review. These data will help us support ongoing work in the perioperative area.
As an institution, we have been able to reduce our incidence of pressure-related injuries significantly over the past few years 7 . Prevalence rates have decreased across all levels of injury and range from 0.4% to 2.8% and the incidence of full-thickness injuries is near zero 7 . Efforts have focused on increasing engagement and awareness, which we believe has been key to the reduction of full-thickness injuries. Other institutions have found that similar intense regular monitoring, review, establishing goals, standardizing practice throughout the system, and focused education have decreased the numbers of severe injuries while increasing the number of early-stage injuries despite increasing risk as noted by the Braden scale. 6,17 Our data reflect these findings, we had 28 full-thickness pressure injuries in FY15, 14 in FY16, and 2 in FY17, while our rates of deep tissue and stage 2 pressure injuries have made smaller improvements. We would like to be able to prevent these and believe that the risk factors identified by this study will aid us in further reducing these avoidable outcomes. Using the variables identified in this study to escalate care on patients with increased risks is a low-cost intervention and allows for a level of specificity not possible with the Braden scale. More accurate identification of risk would lead to focused and meaningful interventions. These findings suggest additional research is warranted to address the significance of Braden subscale scores and to determine if additional education to nursing and providers affects pressure injury rates. Given that NPO status and malnutrition increase risk for injury development, education for nursing staff should provide identification of risk factors such as unplanned weight loss, poor oral intake, and the details of placing a nutrition consult. Care of intraoperative patients has already gained increased focus on injury prevention including new support surfaces, alerts to remind staff for repositioning of the head, and post-operatively turning the patients once out of the operating room. Education for providers should focus on enhanced awareness and include a discussion of skin condition with daily rounding. Furthermore, we believe the findings warrant the development of interventions based on these identified risks to prospectively determine if they have an impact on pressure injury rates.
Limitations
The findings are limited by the retrospective nature of the study and because pressure injuries are a multivariate problem. Specifically, limitations in patient data capture and unrecognized variables contributing to pressure injury may have been missed in this analysis. Use of the electronic record depends on accuracy in coding and injuries may have been missed or misclassified. Literature supports poor correlation between ICD codes and clinical documentation with a low positive predictive value. 18 Often injuries are not correctly classified as present on admission and this can lead to an inflated number of injuries due to lack of discrimination in coding. 18 We attempted to mitigate this risk by comparing the cases with ICD codes with those that also had nursing documentation and a wound care consult. If a case met all three criteria, it was assumed accurate. Twenty seven percent of cases identified by these criteria did not have a present on admission code and were defined as HAPIs in this study. Braden scale scoring is difficult and variable due to its subjective nature, and patients may have been inappropriately scored, which would influence the results. We did not specifically look at whether having a previous pressure injury would increase the risk of new injury in our patient population due to difficulty with accurate data capture due to documented discrepancies in coding. 16 Previous work by Padula 2016 has found a significant increase in risk associated with a prior HAPI; therefore, this may be a variable to consider as a risk factor in a prospective intervention-based study. 12
Conclusion
Patients at our institution had a higher risk of pressure injury development when their nutrition was poor, and/or they underwent a prolonged surgical procedure. It will be important to evaluate if changing the care systems around protection of patients in the intraoperative area and in the accurate identification of nutritional compromise reduces pressure injury incidence. Further work is needed to develop a practical, working clinical system to identify individual patients at risk for HAPIs.
Implications
It is unclear how best to generalize this work. Literature demonstrates that it is hard to define like hospitals and suggests size (smaller vs larger) may not be the best descriptor. 19 Hospitals with average daily census of less than 120 beds had low rates of HAPIs stage 2 or higher. 19 Results may be better generalized to a similar institution, rather than to smaller affiliates within our health system. We do feel that other health systems can and should replicate our study to determine what risks are specific to their patient populations as well as for factors that may correlate with our research. Most work to date has focused on large data repositories and not on individual systems and is based on prevalence data, which make our study unique. It also demonstrates the possibility of the work being done on a small scale to allow for direct translation of results into clinical practice. Quantitative prediction models using data mining approaches may enhance the information accessible from the EHR. 14 Future models could examine if any difference exists between stages of injury and rate of relative risk for individual exposures. This work could lead to a future risk assessment tool that includes the Braden nutrition, moisture, and mobility scores, NPO status, diagnosis of malnutrition, and intraoperative time. Much opportunity remains around understanding risk for pressure injury development and how to predict risk in a meaningful way that influences clinical practice.
Footnotes
Declaration of conflicting interests
The author(s) declared no potential conflicts of interest with respect to the research, authorship, and/or publication of this article.
Funding
The author(s) disclosed receipt of the following financial support for the research, authorship, and/or publication of this article: RTE was supported by The Dartmouth Clinical and Translational Science Institute, under award number UL1TR001086 from the National Center for Advancing Translational Sciences (NCATS) of the National Institutes of Health (NIH).