
Abstract
Although data protection is compulsory when personal data is shared, there is no systematic method available to evaluate to what extent each individual is at risk of a privacy breach. We use a collection of measures that quantify how much information is needed to uncover sensitive information. Combined with visualization techniques, our approach can be used to perform a detailed privacy analysis of medical data. Because privacy is evaluated per variable, these adjustments can be made while incorporating how likely it is that these variables will be exploited to uncover sensitive information in practice, as is mandatory in the European Union. Additionally, the analysis of privacy can be used to evaluate to what extent knowledge on specific variables in the data can contribute to privacy breaches, which can subsequently guide the use of anonymization techniques, such as generalization.
Introduction
To be able to conduct research in the medical field, researchers often need to acquire and combine data collected by different institutions. For data to be published or exchanged, however, it is essential that the privacy of individuals can be guaranteed. Particularly medical data can contain very sensitive information that patients have supplied primarily for health care purposes and these patients may not even be aware that their records are used for medical research. 1
The data controller has multiple responsibilities toward these patients, pertaining to the stage of data collection, storage and processing, according to the General Data Protection Regulation. 2 The principles of data protection specifically apply to data in which individuals could be identified or to data that could be used to identify individuals. To assess whether individuals are identifiable, it needs to be assessed which information can be exploited to uncover sensitive information and how accessible this information is. 2 For example, when a medical diagnosis can be uncovered using only a patient’s age and gender, the patient may be more vulnerable to a privacy breach than when specific medical information is needed to uncover the diagnosis.
Such individualized analyses of privacy have been performed in the literature, but primarily with case studies and no standardized procedure has been proposed.3,4 A systematic and automatic approach is required, because studying the amount of background information needed to uncover an individual can be difficult to execute by hand. Many different combinations of background information have to be considered and without a systematic approach, some sensitivities may be overlooked or overestimated. For example, we will show that variables that can take on many values are generally less sensitive to privacy breaches than binary variables, though the contrary is often expected to be the case.
In the field of anonymization methodology, a number of measures have been proposed that could be used to analyse individual privacy risks.
5
Particularly, l-diversity, the
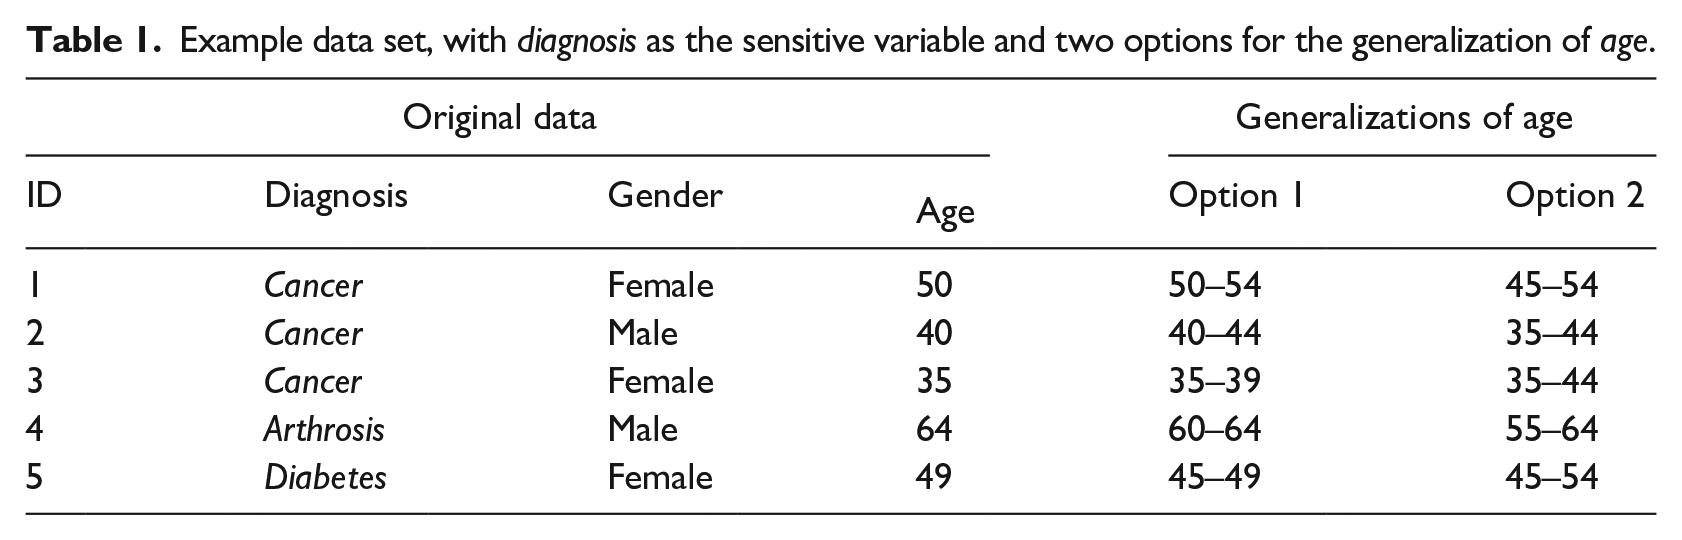
Example data set, with diagnosis as the sensitive variable and two options for the generalization of age.
In this work, we will show how existing definitions of privacy by Wong et al. 7 and by Wang and Fung 8 can be used by medical researchers who are required to evaluate the level of privacy of individuals in their data. We make multiple adjustments to the measures and combine them with visualization techniques, resulting in a detailed representation of privacy. This enables researchers to evaluate privacy such that they can carry out the responsibility that has been imposed by the General Data Protection Regulation in the European Union. 2
Methods
In the following three subsections, we first introduce relevant definitions and notation of the setting that we consider. Next, we describe the measures that we will use to evaluate privacy, including examples. In the third and final subsection, we explain the materials and methods that will be used to demonstrate our approach in the Results section.
Setting, definitions and notation
We assume there is a data owner, for example, a medical institution, that owns (original) data that they would like to share or publish. The data, denoted D, are presumed to be in matrix form, where each row represents one of n individuals and each column represents a variable v. We denote the domain of a variable v, that is, the set of values the variable can take on, by dom(v), and its size by
An adversary is someone who is interested in revealing sensitive information from the data as shared by its owner. For this, we assume that an adversary (1) knows that an individual of interest is present in the data, and (2) may have auxiliary information to help uncover sensitive information. In its most general form, auxiliary information on an individual i, denoted
Our approach requires three additional assumptions on auxiliary information:
The first assumption is necessary because it is impossible to reason about what an adversary might conclude based on wrong information. The second assumption implies that we will need to consider all possible instances of auxiliary information. The third assumption may seem strong, but is necessary to keep the evaluation of privacy on the level of individuals feasible; others have also implicitly made this assumption, in the sense that it is assumed that adversaries cannot combine information on different individuals to rule out sensitive values.6–8,10
We now define upward and downward privacy, which have both been previously proposed in the l-diversity framework. 6
Note that upward privacy is a prerequisite for downward privacy: when data allow to deduce that an individual has a particular sensitive value, this also implies that this individual does not have any other sensitive value. Consequently, downward privacy is a stronger notion of privacy than upward privacy. For binary sensitive variables, however, the two notions concur.
When a variable of an original data set is generalized, a generalization algorithm is used to merge different values of the variable. For example, an age variable could be represented by intervals of 5 or 10 years instead of 1 year; see Table 1 for an example.
Privacy measures
In this subsection we introduce the measures we use for upward and downward privacy. The measures bear similarities to those proposed by Wong et al. 7 and by Wang and Fung. 8 At the end of the next two subsections we will discuss the changes we made for our approach.
Quantifying upward privacy
We start with the introduction of an example.
In the example, Alice’s upward privacy is breached because only a single row corresponds to the information that Bob has on her. If we replace the age variable by a generalized version with intervals of 5 years (Option 1 in the table), there is still only one row that corresponds to a 50-year-old woman; that is, the privacy breach remains. If, however, we generalize age to 10-year intervals (Option 2), we obtain a data set in which two rows correspond to a 50-year-old woman. Moreover, these rows have different sensitive values. As a consequence, Bob cannot be certain about Alice’s diagnosis given the information that he has and Alice is protected from an upward privacy breach.
The example shows that individuals can be protected from upward privacy breaches by the presence of other individuals with similar auxiliary variable characteristics. That is, privacy is strongly related to uniqueness, as has been observed previously.6,10 It is this “uniqueness” that we should measure and quantify. We quantify uniqueness as a measure of privacy by modeling a scenario where an adversary will search the data for all individuals corresponding to the adversary’s auxiliary information. We call these individuals peers. (Groups of peers are often referred to as an equivalence class in the literature.) Following, for an individual i and auxiliary information
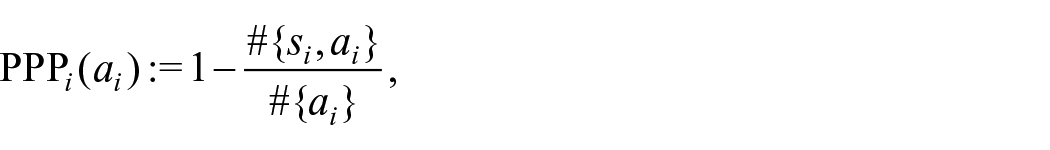
where
In the example above, Bob has maximum auxiliary information, as he knows the values of all auxiliary variables, that is, age and gender. We denote the maximum auxiliary information for individual i by

NPP denotes the number of peers with different sensitive information (again, for given i and
When PPP is larger than p, the data owner finds that the individual is sufficiently protected from upward privacy breaches by the presence of peers with different sensitive values.
The measures
Due to the fact that a PPP of 0 would already be difficult to attain for every individual in a typical medical data set, we expect that this threshold will be most frequently used and our formulation is therefore a much more practical implementation. Quantifying downward privacy We continue the example with downward privacy.
We use a measure strongly related to PPP to model downward privacy. Let
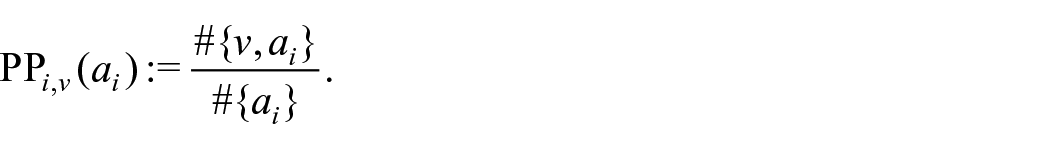
When
Similar to upward privacy, we need a threshold to decide when a possible value occurs frequently enough in peers to provide protection. Given a threshold
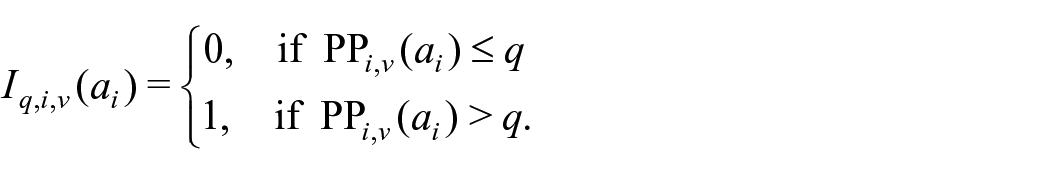
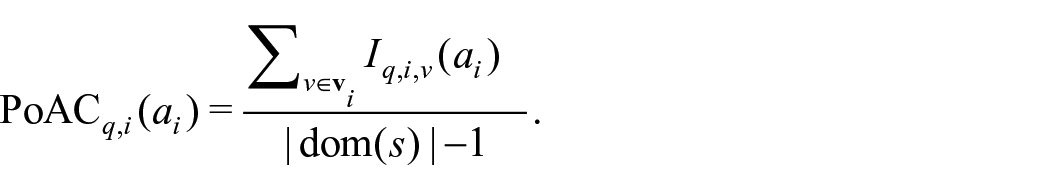
Based on this, we can quantify how many false sensitive values would be considered by an adversary (and thus provide protection against downward privacy breaches). For this we define the Proportion of Alternatives Considered (PoAC) for an individual i, threshold q, and auxiliary information
Finally, downward privacy is defined as follows:
This means an individual is considered safe from downward privacy breaches if they are protected by sufficient peers for every possible false sensitive value, that is,
Although we could choose q independently from p, in practice it makes sense to choose them jointly, so that downward privacy remains a stronger notion of privacy than upward privacy. For example, when all false sensitive values are expected to be equally likely, we could first choose p based on the domain size and then set
With respect to downward privacy, PoAC bears some similarities to α-rarity and
When age is generalized by ten year intervals (Option 2), half of the women between 45 and 54 have cancer and Alice would have a PPP of 0.5 and
Scalability of the measures
In a naive approach, the number of times the number of peers has to be counted increases linearly with the number of sensitive variables (
Materials and methods for demonstration
In the next section we will demonstrate the use of the measures for the systematic evaluation of privacy of individuals. Here, we describe the three publicly available data sets that will be used. We also explain how we use the measures to quantify and subsequently visualize privacy.
Data sets
To demonstrate our approach, we use three data sets from the University of California Irvine (UCI) Machine Learning Repository 11 : the Adult data set, a data set on diabetes from US hospitals, 12 and a cervical cancer risk factor data set. 13 Details on the selected variables can be found in Table 2. We have included the variables of the adult data set that are most frequently used in articles on generalization algorithms.6,14,15 Individuals with missing values on one of the selected variables were excluded from the data set, which concerned less than 10% of all rows in each of the data sets. We excluded individuals with missing values to avoid having to make additional decisions that potentially influence the results.
Properties of data used.
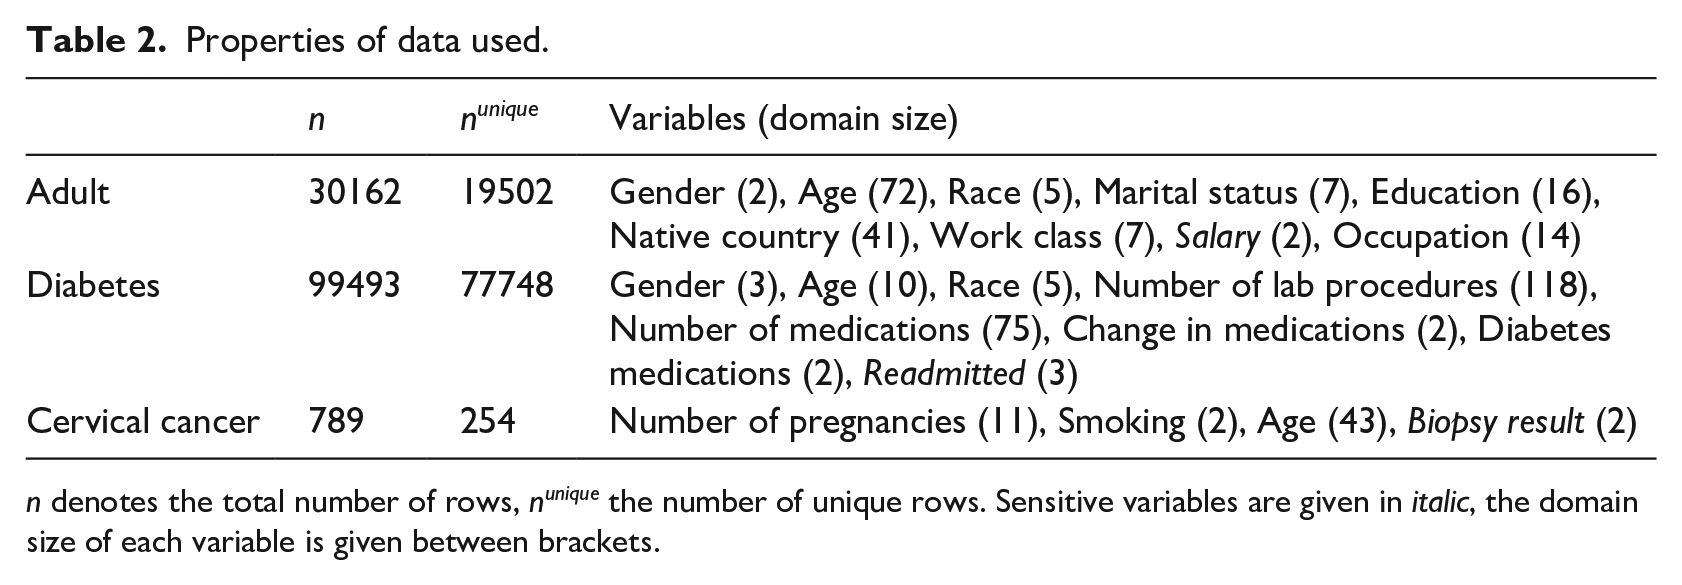
n denotes the total number of rows, nunique the number of unique rows. Sensitive variables are given in italic, the domain size of each variable is given between brackets.
Using the measures for privacy evaluation
To evaluate privacy, we use the previously detailed measures to assess whether auxiliary information can reveal sensitive information. First, we use the PPP on each variable to gain insight into which variables are vulnerable to being uncovered. Second, to investigate which variable is most likely to provide a privacy increase when generalized, we assess whether there is an increase in the PoAC when each variable is left out of the auxiliary information, that is, how much of an increase in privacy is to be expected if information on this variable were unknown to the adversary.
Implementation and visualization
We performed all analyses and subsequent visualization in R Studio version 1.0.136. We used the heatmap.2 function from the gplots package to create heatmaps for visualization of the privacy measurements, and used the function’s feature that allows columns to be ordered such that the plot is easiest to interpret. We set the colors, such that all values below or equal to the chosen threshold (such as p) are dark red. Because two data sets contain an excessive number of individuals relative to the amount of pixels, we used subsampling to smooth the plots. We developed a basic online tool that implements our approach: https://skskroes.shinyapps.io/Evaluating_and_visualizing_privacy/. Additionally, our code is made available on the Github repository https://github.com/ShannonKroes/Evaluating_and_visualizing_privacy. If users want to apply the code to their (potentially sensitive) data, we recommend downloading the R code and running it on their own device.
We present a small example of our visualization in Figure 1 that depicts downward privacy (q=0) for Table 1, with the second generalization option. (For the example we left the columns in the same order as in Table 1.) Each row represents a variable and each column represents an individual. We depict the corresponding variable names and for this example we also show the ID numbers from Table 1 for the columns. The color in a cell represents the level of downward privacy given that the other variables in that column are known. For example, for the third individual, the diagnosis can be uncovered if age and gender are known, because all women in this age category have the diagnosis cancer. Therefore, the first cell in the third column is red, indicating the worst level of privacy. Gender is more difficult to uncover, since both a male and a female have cancer and fall in the age category 35–44 and thus the value on gender is protected for both of these individuals, shown by a green second cell in the third column. On the other hand, only two out of three of the age categories (35–44 and 45–54) are associated with a woman with cancer, thus resulting in a PoAC of
Visualization of downward privacy of Table 1 with the second generalization (q = 0). Variables are represented by rows and individuals by columns. Dark red cells indicate PoAC equals 0.
Results
In the following, we will visualize the previously detailed measures with heatmaps to provide an intuitive representation of the risks of privacy breaches. First, we will use our approach to evaluate the privacy of the three data sets in Table 2. Next, we highlight how this can reveal where vulnerabilities to privacy breaches occur, and where these may originate from. Finally, we demonstrate how the approach can be used as an asset for generalization.
Evaluating upward privacy in the data sets
Figure 2 visualizes upward privacy for each variable for each data set. The level of privacy is visualized in a heatmap, such that a row closer to red indicates that that variable is more vulnerable to privacy breaches. The heatmaps illustrate that the level of privacy is generally low in all three data sets, despite the fact that two of the data sets are comprised of a relatively large number of individuals. This relates to the large number of unique rows in the data, as shown in Table 2. Using the PPP, we can also make between-variable comparisons. One important observation is that variables with larger domains tend to be more difficult to uncover, and are thus associated with lower privacy risks. This is due to the fact that these variables are also most informative when part of the auxiliary information. That is, when labeling such a variable as sensitive, it follows that the values for this variable are unknown to the adversary, which means that the adversary loses valuable information. A noteworthy example is the variable occupation in the adult data set, which is difficult to uncover, despite the fact that this variable is very frequently selected as a target to be protected by generalization algorithms.6,10,15 In fact, researchers tend to explicitly choose to generalize data such that variables with a larger domain are protected, whereas Figure 2 shows that binary variables can be much more vulnerable to privacy breaches. 15 For example, the variables change in medication and diabetes medications in the diabetes data set are easy to uncover. This shows the importance of assessing the distribution of privacy before using or testing a generalization algorithm on the data.

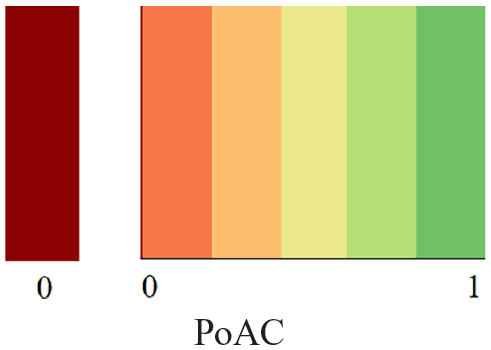
Upward privacy in the three data sets: (a) adult, (b) diabetes, and (c) cervical cancer. Variables are represented by rows and individuals by columns. Each value depicts the minimum PPP over all possible combinations of auxiliary information for that particular individual (column), under the assumption that that variable (row) is labeled as sensitive. Colors more toward green indicate high privacy and dark red colors indicate privacy insufficient according to the chosen threshold.
Detecting the origin of vulnerabilities
In Figure 3, we depict the contribution of each auxiliary variable to the level of privacy on the sensitive variable, as specified in Table 2. We show the PoAC for the sensitive variables selected for the adult and diabetes data set (Figure 3(a) and (b)), and the PPP for the sensitive variable in the cervical cancer data set (Figure 3(c)). Each row represents what the level of privacy would be if the variable corresponding to that row were unknown to the adversary. In this scenario, the values of all other auxiliary variables would be known to the adversary. Rows with colors closer to green colors correspond to variables that provide valuable information to uncover the sensitive value. Conform our expectations, particularly variables with larger domains provide information that has the potential to result in privacy breaches, because knowing the values on these variables will most likely enable the adversary to rule out a large number of individuals.
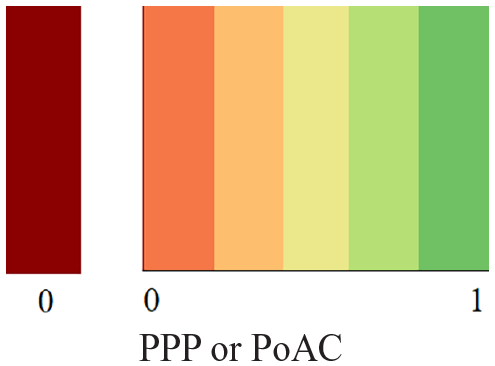
Privacy increase when an auxiliary variable is unknown to the adversary for the three data sets: (a) adult, PPP for the sensitive variable salary, (b) diabetes, PoAC for the sensitive variable readmission (q = 0), and (c) cervical cancer, PPP for the sensitive variable biopsy result. Every row represents an auxiliary variable and every column represents an individual. The auxiliary information that can be used to uncover the specified sensitive variable contains the true values on every auxiliary variable in the data, except for the variable corresponding to that row. Colors closer to green represent higher PPP or PoAC, indicating that knowing the value for that individual on that variable is more informative to the adversary. Dark red colors indicate that the privacy measure equals zero.
After analysing which variables contribute to privacy breaches, the user can make choices regarding which variables should be generalized. In doing so, the accessibility of variable information needs to be taken into account. For example, in the diabetes data set, age, number of medications and number of lab procedures are all valuable pieces of information in uncovering readmission, but the difficulty with which information on these variables can be acquired may differ significantly. Incorporating how likely it is that certain information will be used to identify individuals is a compulsory part of privacy evaluation in the European Union, which is possible with our approach. 2
Assessing the potential for privacy increase resulting from generalization
In this subsection we show how Figure 3 can be used to assess the potential increase in privacy that can be gained from generalizing each variable. We discuss upward privacy of the biopsy result in the cervical cancer data, with p=0. Figure 3(c) shows that the variable with the largest domain, age, is most frequently associated with a vulnerability to privacy breaches, compared to the other two auxiliary variables. Therefore, we would expect that generalizing age would be more effective than generalizing number of pregnancies. (Generalizing smoking would result in everyone having the same value; this has been shown to be an ineffective generalization as depicted in the row corresponding to smoking in Figure 3.) To illustrate this difference, we show the effect of generalizing these variables in Figure 4. We generalize both variables separately, choosing multiple category sizes, with the constraint that each category must contain an equal number of values, except for the lowest and/or highest category. Figure 4 indeed shows that age has more potential to decrease uniqueness. With a threshold p of 0 the proportion of individuals with upward privacy can increase to up to 97%, whereas the maximum proportion of protected individuals due to generalizing the number of pregnancies is only 59%. Another important observation is that further generalization does not necessarily result in an increase in privacy and generalizations with the same category size can have very different effects. This can also be seen in the example data set in Table 1, where Alice is still unique when she falls into the age category 50–54, whereas she would have had increased protection if the age category had been 46–50.
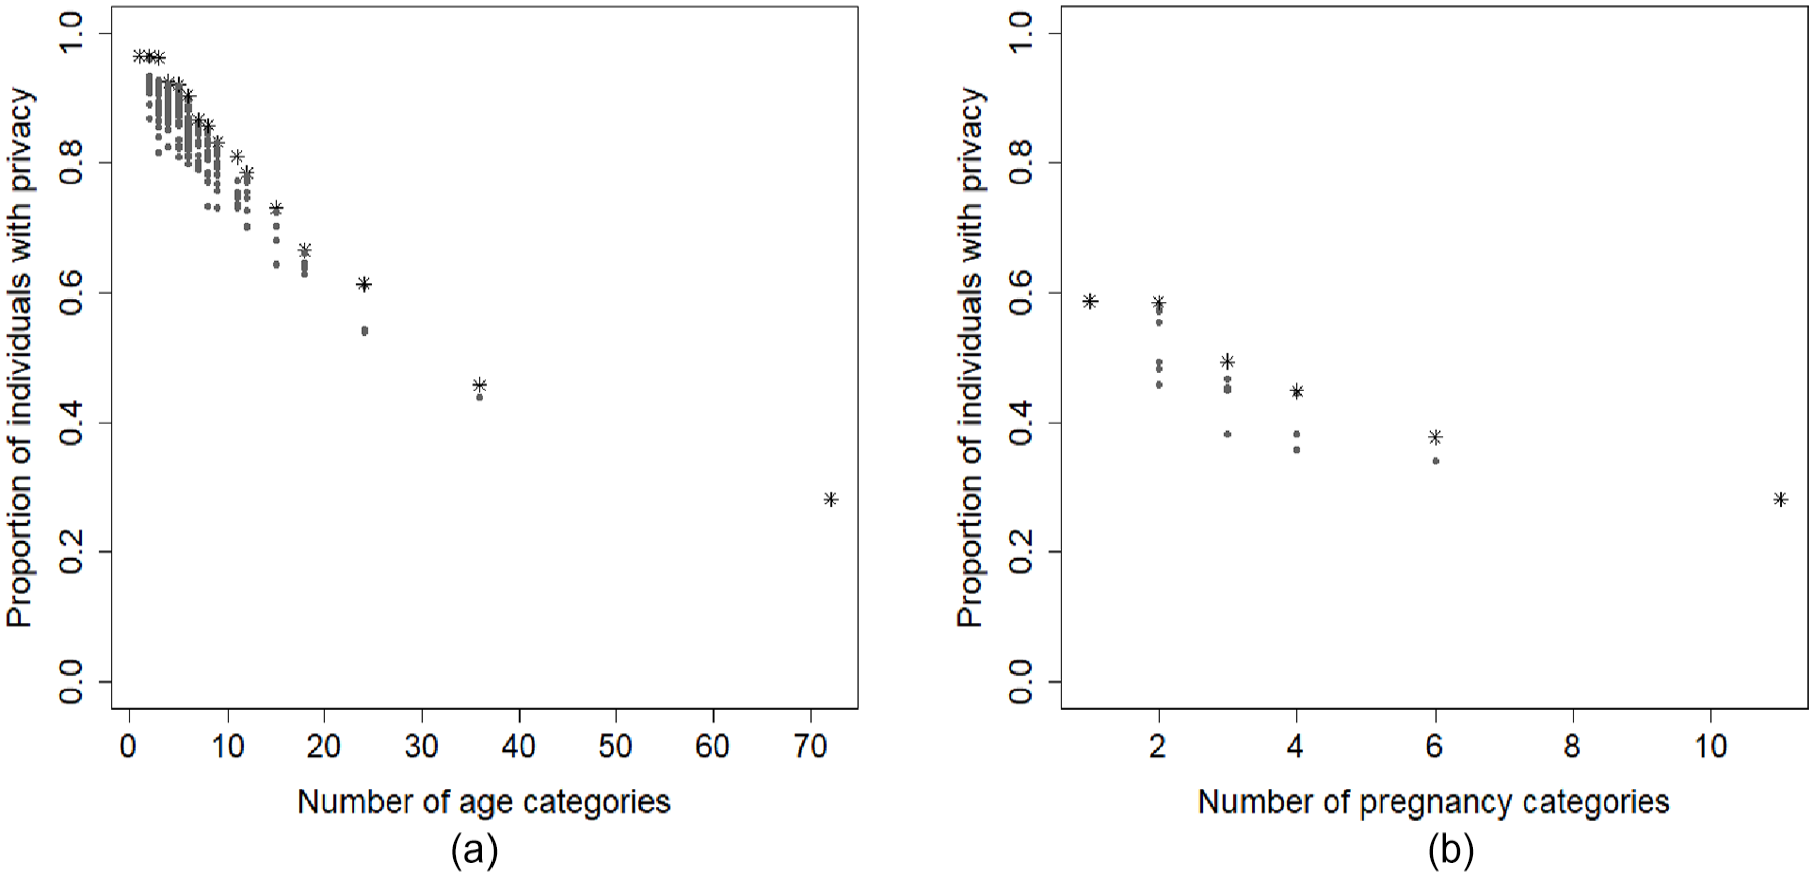
Privacy of the sensitive variable biopsy result as a function of generalization of (a) age (p = 0) and (b) number of pregnancies (p = 0). The x-axes depict the number of categories the variables are partitioned into, as an indication of the extent of generalization. The y-axes show the number of individuals who are deemed protected with
Discussion
Summary
Evaluating privacy risks has become a compulsory part of sharing individual patient data for scientific purposes. Researchers need to evaluate how much background information is needed to uncover sensitive information and how easily this background information can be accessed. 2 In this work, we have presented an approach to privacy analysis that is detailed enough to perform this task, by evaluating privacy per variable and per individual. As detailed in our Methods section, we make critical modifications to measures presented by Wong et al. 7 and by Wang and Fung, 8 which have so far primarily been used on an aggregated level to optimize generalization algorithms. Combined with visualization techniques, this reparameterization results in an intuitive representation of privacy risks in the data on an individualized level. This can provide insight into which variables cause these risks. In turn, these variables can be adjusted to minimize opportunities to misuse background information, for example, by using the anonymization technique generalization.
Related work
To our knowledge, this work is the first to present a method that enables data owners to study the level of privacy of individuals in their data that can also show the contribution of specific variables to privacy breaches. Though software is available to measure privacy, most of them use definitions that do not specifically assess whether sensitive information can be extracted, but only whether entire records of individuals are unique in the data. This disregards groups of peers with similar sensitive characteristics that are at risk of a privacy breach. This includes both the k-anonymity framework and the body of literature dedicated to measuring re-identification risk, as well as the corresponding software that implements these approaches (such as sdcMicro, 16 the ARX data anonymization tool, 17 Amnesia 18 and µ-argus 19 ), some of which have been applied to medical data.10,20–22
Another popular approach is to summarize the level of privacy with an integer l using l-diversity, which has been implemented in the UTD Anonymization toolbox.6,23 This is very similar to the PoAC with a threshold
The UTD Anonymization toolbox also implements t-closeness, which compares the distribution of a sensitive attribute over the entire data set to the distribution of the same sensitive attribute within a group of peers. 14 Other approaches with a similar aim include β-likeness 24 and δ-disclosure privacy. 25 These thresholds and measures are on the scale of a chosen distance measure, such as the Kullback-Leibler divergence, but they are difficult to interpret, as they are often on a logarithmic scale. Additionally, they cannot be directly related to real-life situations where an adversary will try to uncover a sensitive value using certain background information.
All of the mentioned measures and corresponding software evaluate privacy on an aggregate level. One approach that does measure personalized privacy is that by Xiao and Tao, 26 but in this work assumptions are made about how an external data set will be used to extract sensitive information and about what this data set looks like. Specifically, when measuring privacy for a certain group of peers, it is assumed that the external data set contains all of these peers and the level of privacy increases factorially with the size of the external data set. For an extensive overview of technical privacy metrics, see Wagner and Eckhoff. 5
Strengths, limitations and future work
As publishing data is becoming more common in scientific literature, our approach can be used to evaluate the privacy risks for the individuals included. Additionally, privacy can be evaluated when a hospital is considering supplying their data for the purpose of multi-center clinical research. Another possible application is in the process of developing or testing anonymization techniques, when the privacy of the input data needs to be evaluated in order to be able to interpret the performance of the methodology.
In our approach, upward and downward privacy are investigated by reviewing the corresponding measures for all combinations of auxiliary variable information. This is a very time-consuming task with our naive implementation and a more efficient implementation should be developed. Because many of the needed computations are independent, the code could be run in parallel to speed up the computation.
Another limitation of our current implementation is that continuous variables are treated as discrete. Continuous variables could be modeled more accurately by evaluating the proximity to auxiliary or sensitive values. 27 This entails that one can specify a range of values for the auxiliary information and that the threshold for a privacy breach could include a range of values that lie close to the true value.
Conclusion
We have proposed an approach that enables medical researchers to evaluate the level of privacy of individuals in their data. Specifically, our approach quantifies and visualizes which variable information can be exploited to breach privacy and thus which variables should be targeted with anonymization techniques. Considering that evaluating privacy and using anonymization methods is likely to be a responsibility that comes with the exchange of patient information, our approach can be a valuable asset in the process of sharing individual patient data.
Footnotes
Acknowledgements
We acknowledge contributions made by R. A. Middelburg during the early stages of conceptualization.
Declaration of conflicting interests
The author(s) declared no potential conflicts of interest with respect to the research, authorship, and/or publication of this article.
Funding
The author(s) disclosed receipt of the following financial support for the research, authorship, and/or publication of this article: This project is funded by the Sanquin Blood Supply Foundation (PPOC-16-27).