
Abstract
This paper investigates the possibility of the implementation of Genetic Programming (GP) algorithm on a publicly available COVID-19 data set, in order to obtain mathematical models which could be used for estimation of confirmed, deceased, and recovered cases and the estimation of epidemiology curve for specific countries, with a high number of cases, such as China, Italy, Spain, and USA and as well as on the global scale. The conducted investigation shows that the best mathematical models produced for estimating confirmed and deceased cases achieved R2 scores of 0.999, while the models developed for estimation of recovered cases achieved the R2 score of 0.998. The equations generated for confirmed, deceased, and recovered cases were combined in order to estimate the epidemiology curve of specific countries and on the global scale. The estimated epidemiology curve for each country obtained from these equations is almost identical to the real data contained within the data set.
Introduction
COVID-19, a novel coronavirus disease represents one of the greatest challenges in modern human history, both from the health and, consequently, from a socio-economic standpoint. COVID-19 is caused by the virus SARS-CoV-2, a member of Betacoronavirus family. 1 Research shows that the worldwide spread of the virus has started in the Chinese province of Wuhan, where the first cases of infection were observed in late 2019.2,3 It can be observed that the rapid spread of COVID-19 caused a considerable strain on public institutions and private companies. Such an impact is particularly noticeable in the healthcare system, especially in places where health professionals are overburdened and there is a lack of needed medical equipment. 4 Such characteristics are particularly emphasized in Europe, especially in Italy 5 and Spain. 6 The spread of viral infections can be described with the epidemic curve, the time-series data of the number of active cases per unit of time, 7 which is also a common practice with COVID-19. Such approach is necessary in order to define the ratio between maximal number of infection cases and the maximal capacity of the country’s healthcare system. 8 In order to reduce this ratio, it is necessary to define the strategy which includes social and health measures against the spread of the infection. Each different applied strategy will result in a specific epidemic curve. 9 In order to determine the optimal strategy for handling the COVID-19 crisis, it is necessary to estimate the potential epidemic curves, according to the chosen strategy and to compare their maximal values with the healthcare capacity. For these reasons, modeling of infectious diseases can be of significant importance. 10
Methods for estimation of COVID-19 spread are intensively investigated in order to define the optimal method for epidemic curve estimation. Proposed estimations are obtained by using statistical modeling, and did not provide accurate estimations of the epidemic curve.
11
As another approach, artificial intelligence (AI) modeling is proposed. Such approach has been proven as a powerful tool in various branches of science and technology, including clinical practice.
12
There have been attempts to implement AI methods for handling the COVID-19 crisis. McCall
13
offers a view into AI and its use in combating the COVID-19, concluding that it can either be used to actively combat the current and future infections or be used in the spread analyses after the infection has subdued. One of the articles she cites is by Richardson et al.
14
in which the authors demonstrate the successful use of BenevolentAI in determining the potential treatments for COVID-19, determining Baricitinib to be one such medicine. Hu et al.
15
show the use of a modified stacked auto-encoder in prediction of disease spread, with their models achieving good results with prediction of confirmed cases in China. Gozes et al.
16
show the rapid AI development cycle for the use in coronavirus disease pandemic. Through its use, they achieve a relatively high (97.2%) accuracy using CT scans of infected and non-infected patients. Ye et al.
17
demonstrate
One of the approaches based on artificial intelligence is Genetic Programming (GP). Such approach offers a possibility for determination of unique mathematical expression that describes the epidemic curve. The aforementioned expression can be utilized in order to estimate pandemic curves, according to selected COVID-19 strategy. GP has a history of implementation in medicine-based tasks. Tan et al. 20 show a GP approach to oral cancer prognosis. Authors use a small data set of 31 cases. With feature selection of smoking, drinking, tobacco chewing, histological differentiation of SCC and oncogene p63, authors manage to achieve average scores of 83.87 % accuracy and AUC score of 0.8341 for the classification task. Ain et al. 21 show the use of Genetic Programming for feature selection and construction for skin cancer image classification. Authors conclude that GP as classification algorithm provides a good solution for distinguishing between benign and malignant cancer images. Ain et al. 22 demonstrate the use of Genetic Programming on the same problem, but through the use of local and global image extracted features. Authors compare six classification algorithms, along with GP and conclude that GP provides better results. D’Angelo et al. 23 propose a solution for distinguishing between bacterial and viral meningitis techniques using genetic programming algorithm in comparison with decision tree algorithm. Authors observe two cases: one in which algorithms are trained using blood and cerebrospinal parameters, and second in which only cerebrospinal parameters are observed. GP shows good results in both cases, with only a few false positives provided, which given the case can be considered as not dangerous. Senatore et al. 24 show the use of cartesian Genetic Programming in handwriting analysis. They use this for classification of patients with Parkinson disease and their approach is evaluated using publicly available PaHaW data set. Results show that models obtained with GP can be applied on this task, with high accuracy.
From above-presented facts, following questions can be raised:
Is it possible to utilize the GP algorithm to obtain mathematical models that could estimate the number of confirmed, deceased, and recovered cases of countries such as China, Italy, Spain, or the USA?
Based on the obtained mathematical models for confirmed, deceased, and recovered cases, is it possible to define the symbolic expression of the epidemiology trend for China, Italy, Spain, and the USA?
Is it possible to utilize the GP algorithm to generate mathematical model that could estimate global epidemiological trend, through the combination of the global mathematical models of deceased, confirmed and recovered cases?
In this paper, the GP algorithm will be utilized in order to develop mathematical models that could estimate the number of confirmed, deceased, and recovered cases, as well as the number of currently active cases—the epidemiology trend of specific countries (China, Italy, Spain, and USA). These countries were selected based on the large number of confirmed, deceased, and recovered cases. The number of confirmed, deceased, and recovered cases will be combined using equation (1) for each date in order to achieve the number of active cases for each date in the data set.
Background and literature review
In this section, a brief overview of literature from the connected previous research will be presented. Overview of modelling infective diseases will be presented first, followed by the description of GP, and finally the comparison of GP with similar AI algorithms.
Modelling the spread of infective diseases
Modelling the spread of infective diseases has been a hot topic of research for many years. It can be easily understood why—as predicting the spread of an infective disease can be crucial in making decisions on how to approach the curbing of its negative effects. 25 The increase of the use of data-based disease spread models in health decision making has been growing more apparent lately. 26 Traditionally these models were developed using various statistical techniques in an attempt to create a data-based model predicting the spread of disease.27 –29 Still, shortcomings of such methods are apparent in that the models are fitted manually to the existing data, and many of the seemingly unimportant variables can be ignored, due to researchers failing to note their importance. 30 To avoid this issue, AI based modelling can be implemented in the attempt to predict the infectious disease spread. 31 Certain issues do arise with this approach; main of which are the needs for a large amount of data, 32 extensive training times, 33 and the fact that AI provided models can be hard to understand 34 and complex to implement. 35 Still, the ability of AI to fit to the existing data, without the need for the researcher to take into account all the possible variables, can provide incredibly precise models.36,37 The need for large amount of data is getting to be less of the problem, with the tendency to collect and store large amounts of data being more and more prevalent in the medicine of today,38,39 with training times being addressed with the growing performance of computing machines. 40 The models being hard to implement, mostly caused due to not being programming language agnostic, and hard to understand can be addressed using novel methods such as Genetic Programming.
Brief overview of Genetic Programming
Genetic Programming (GP) is a machine learning algorithm originally used to evolve computer programs using evolutionary computing principles. 41 When used for regression, GP algorithm is sometimes referred to as Symbolic Regressor, due to the symbolic format of solution it uses and provides. 42 As this method can also be applied to the mathematical expressions, GP can be used to evolve mathematical expressions. 43 As mentioned, GP is a machine learning algorithm, which means it uses existing data in order to train and create models. GP randomly creates a number of candidate solutions which make up the population. Then, these solutions are evaluated and best of them recombined in an attempt to find a better solution. This process will be briefly described in this section.
The principle of Genetic Programming is the creation of equations in the form of trees,
44
which are tested to determine their solution quality. The equations when applied to a data set provide predicted values, which, in comparison to the real values, have a certain error. Those solutions which have a smaller error are considered to be better. The GP algorithm generates the set of initial solutions using fills the trees using “grow” and “full” techniques. “Grow” technique allows for trees with less then maximal depth, while “full” guarantees that the generated trees will reach the specified maximal depth.
45
The generated trees describe the equation which creates the relation between inputs
The question of the need to format the equations as trees within the algorithm can arise. This is done in order to simplify the evolutionary computing (EC) operations—reproduction, crossover, and mutation; which are performed during the process of training the GP models. 41 The training consists of the following steps 46 :
determine the fitness of each individual solution in the solution set,
apply the EC operations on solutions selected randomly using fitness proportional selection, and
generate the next population using the results of the EC operations.
It is important to note that the GP algorithm uses fitness proportional selection when selecting candidates for EC operations. Solutions with higher fitness are those solutions which provide a lower error on the training data when applied as the relation between the inputs and the outputs. The idea of GP is that through the recombination and mutation of those particular solutions, which have better fitness compared to others in the current population, the optimal solution can be found. 47 The brief explanation of EC operations is as follows47,48:
Another setting of importance are hyperparameters, which are described, along with their values in Section 3.2.2.
Comparison of Genetic Programming to other algorithms
Main difference between the GP and similar algorithms is that GP is an algorithm which combines two AI fields—machine learning (ML) and evolutionary computing (EC). EC is commonly used in the fields of solution space search and optimization.49,50 ML techniques consist of algorithms which tune their internal parameters based on the existing training data. 51 Combinations of these two branches of AI are common, such as using EC algorithms to optimize the hyperparameters of an ANN 52 or to directly optimize the neuron connection weights. 53 GP differs from such methods by, in its simplest form, being directly based on a genetic algorithm. 46 In a sense, GP is a genetic algorithm with a specific shape of the candidate solutions and a fitness function calculated based on the pre-existing data set. A crucial difference between the two is that since the algorithm is applied on the dataset it cannot be directly used for optimization tasks, such as the ones for which EC algorithms are commonly applied, and is instead used for regression and classification tasks. 46
Main benefit of the GP algorithm is the earlier mentioned symbolic shape of the models it develops. Models trained with GP are returned as symbolic expressions representing computer programs or mathematical expressions. 45 Most models trained using other ML methods, such as ANNs, return models which are hard to understand. 54 In addition to this, models created by ANNs are usually specific to the programming language or module used for their creation, 55 while the models created by GP are language agnostic. These create a barrier in the wide use of models created with other ML algorithms, as problems can arise due to other researcher’s unfamiliarity with the framework used to create them, along with other issues such as version incompatibilities of modules used. Using models generated in this manner within other existing software packages can be extremely hard, and might require specific gateway software to be created for intercommunication. This is a very apparent issue when ANN models are used for interdisciplinary research, as non-engineering team members can have issues properly utilizing the models created. GP addresses this issue by generating models which can, with minor modifications—in most cases just a simple textual replacement of operation names, be used in a wide range of software packages and programming languages. 56
Still, GP has its shortcomings in comparison to ML algorithms. Due to the training process being EC based it can take a significantly higher time compared to algorithms such as ANNs, even further addled by the fact that GP model training cannot be further accelerated using graphical processing units (GPUs) due to the fact that GP does not store information as tensors during the execution.57,58 Additionally, issues such as the aforementioned bloat can cause extremely high memory usage, and stop the models from converging to a quality solution. These issues mean that GP requires significantly more fine tuning when compared to algorithms like ANNs.59,60
Methodology
Methodology used within this research will be presented in this section. The description of the used data set is initially given, followed by a brief description of research-specific GP settings and the description of candidate solution quality evaluation.
Data set description
Data set used in this research is publicly available and obtained from the repository by the Johns Hopkins University Center for Systems Science and Engineering (JHU CSSE) which is supported by ESRI Living Atlas Team and the Johns Hopkins University Applied Physics Lab (JHU APL). The data set in question is structured as a time series data set. Data contained shows daily number of confirmed, deceased, and recovered COVID-19 cases in 401 locations, over 78 days, from January 22nd 2020 to April 8th 2020. The date of January 22nd 2020 will be referred to as “start date” in the paper, signifying the starting date in the dataset. This date was used in previous research regarding the modelling of COVID-19 spread and effects.36,61
To use the data for GP training the data set needs to be reformatted to a regression data set. To achieve this, first each location’s latitude and longitude are written in a row, while the date of the data collection is transformed into an integer representing the number of days elapsed since the first entry in the dataset—22nd January 2020. Finally, the number of confirmed, deceased, and recovered cases is written. This is repeated for each date and location combination yielding three data sets, one for each patient group (confirmed, deceased, and recovered). The data sets are then shuffled to prevent any influence of non-existing patterns on learning, 54 and to give a more randomized learning data to algorithm which should result in higher quality models. 51 For generating mathematical expressions for confirmed, deceased, and recovered cases in China only the Hubei province was used which means that latitude and longitude are constant and the number of days since the data collection of the cases began is a variable value. For Italy (Milan) and Spain (Madrid) the latitude and longitude are also fixed. For the USA and global model for confirmed, deceased, and recovered cases at each date all data are summed up across localities. In case of USA for each date all localities with reported cases are summed up. The same procedure was used for the development of the global model.
Genetic Programming methodology
This subsection will briefly describe the process of adjusting and tuning the GP algorithm within the presented research.
Genetic Programming implementation
First step in GP use is setting the appropriate values as input and output variables.
54
In the presented research the input
The inputs
The second thing of note is the fact that three separate outputs exist. GP can only regress a single variable at a time, so three separate models need to be created.
51
While it would be possible to create a combined output—in the sense of regressing the epidemiology curve value, that is the number of active cases

This approach would simplify the training process, as only a single value would need to be regressed—but it would not allow the individual models to be presented, which would mean the loss of potentially important information. The individual numbers of confirmed, deceased, and recovered patients can provide important strategical information in planning the strategy of dealing with the infection.
Hyperparameters of the Genetic Programming algorithm
Determining the exact values of hyperparameters is a complex task, because slight changes of hyperparameters can cause significantly different algorithm behaviors. 62 In this research, instead of a manual selection of the hyperparameters the upper and lower bounds of the hyperparameter value are defined and randomly uniformly selected from within this range. If the obtained model is not precise enough, the new random set of hyperparameters is selected. This process is repeated until a high quality model is generated. The list of hyperparameters used and their ranges selected by authors are given in Table 1 in order that will be used during result presentation, with brief explanation of hyperparameters following below.
Hyperparameter ranges.
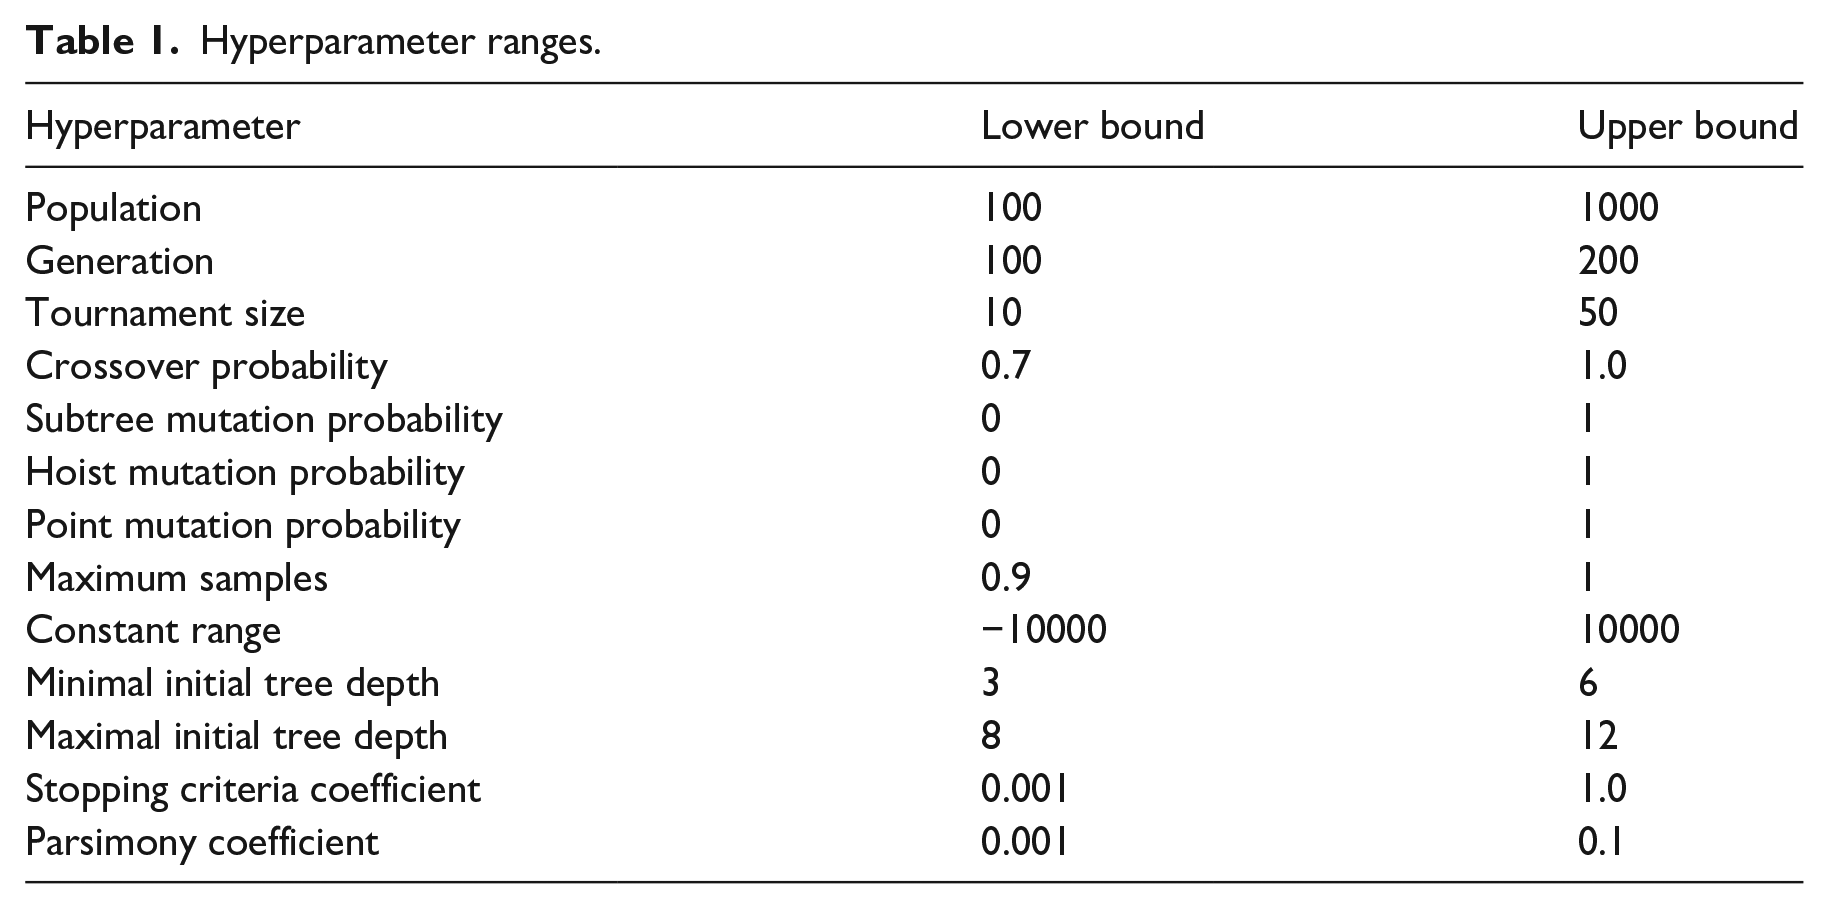
“Population” describes the amount of candidate solutions to be generated in each iteration of the algorithm 63 —the so-called generation, number of which is defined with the “generation” hyperparameter. 64 “Tournament Size” describes the amount of candidate solutions to be used within the fitness proportionate selection methods. 65 Crossover and mutation probabilities are the probabilities of EC operations briefly described in section 2 occurring, 62 with the probability of reproduction equaling the difference between 1.0 and the sum of listed probabilities. “Maximum Samples” describes the percentage of candidate solutions which are used for the crossover and mutation operations, with the remainder being reproduced in the following generation. 66 “Constant Range” describes the range of constants GP algorithm can pick to use as operands for operations within the solutions. 67 “Initial Tree Depth” defines the minimum and maximum depth of trees in the initial population, 68 while “Stopping Criteria Coefficient” defines the value of error that needs to be achieved in order to stop the execution. 69 If this value is not reached, the execution stops after the number of generations defined via the hyperparameter “generations” is reached. 56 Finally, “Parsimony Coefficient” is a coefficient which is introduced to prevent bloat, 70 which refers to the phenomenon of increase in equation size without the appropriate model quality benefits.56,71
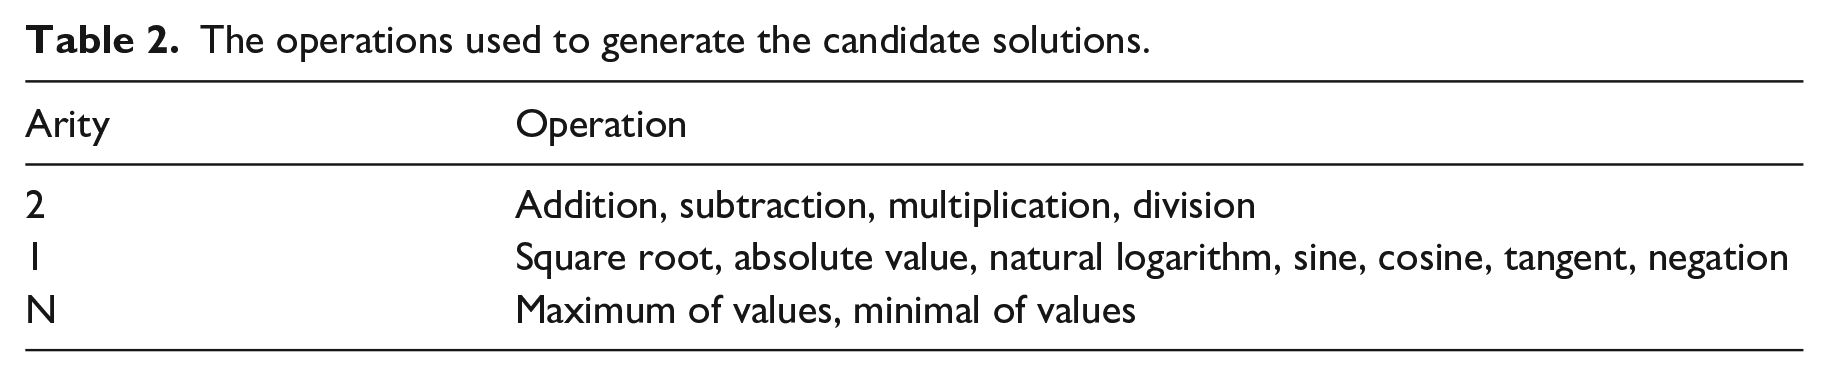
In addition to the previously defined hyperparameters the gene set, namely the operation vector—the set of operations to be used within the algorithm, needs to be defined. The operations in this paper are given in Table 2.
The operations used to generate the candidate solutions.
With these values defined, the training of models using GP algorithm can start. The next step is deciding on the way of evaluating the candidate solutions, which is described below.
Candidate solution evaluation
After the initial training, quality of the obtained solutions need to be evaluated. Mean Absolute Error

While
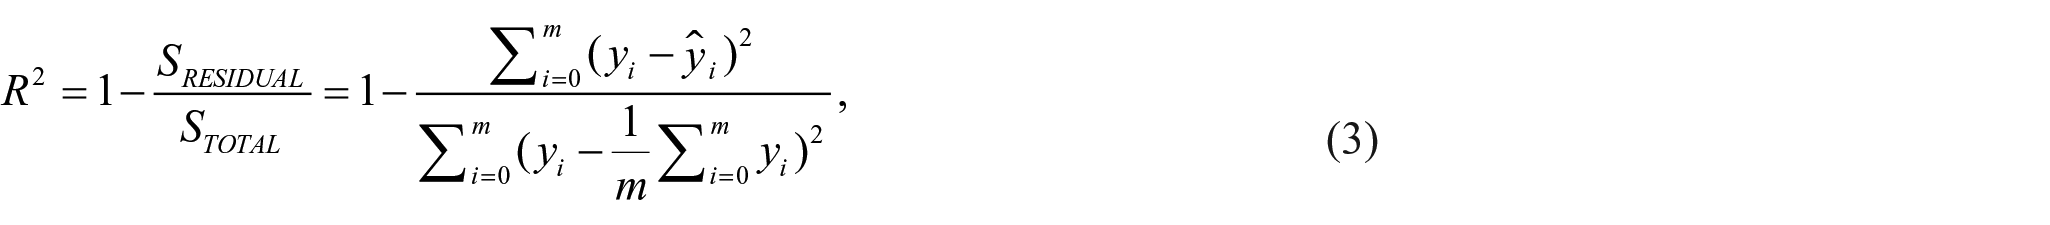
with
Results and discussion
Since the COVID-19 pandemic began; each country responded with different measures at different time periods so it was impossible to develop the equation which could globally predict the COVID-19 epidemiology trend using latitude, longitude and outbreak period as an input variable. Instead the global model is made with the number of days since the start of the data collection as an input variable and number of patients in each group as the output variable. In order to develop such model, the data set was modified in terms of summing the number of cases, across locations, for each day. In addition to the global model total of four different models were created and these are China model, Italian model, Spanish model and USA model. These four models are interesting and should be studied further since each of these countries reacted to the outbreak differently. Among them the China model is the most reliable since the number of confirmed and deceased patients is decreasing while the number of recovered patients is growing. However, the Italian, Spanish and USA models are still unpredictable since each day many new instances of confirmed and deceased cases appear while the number of recovered patients remains small when compared to the previous two groups. In each case the produced mathematical equation for prediction of epidemiology trend consists of three equations which were obtained for recorded confirmed, deceased, and recovered cases. The mathematical equation in general form for prediction of epidemiology trend is given in equation (1).
China model
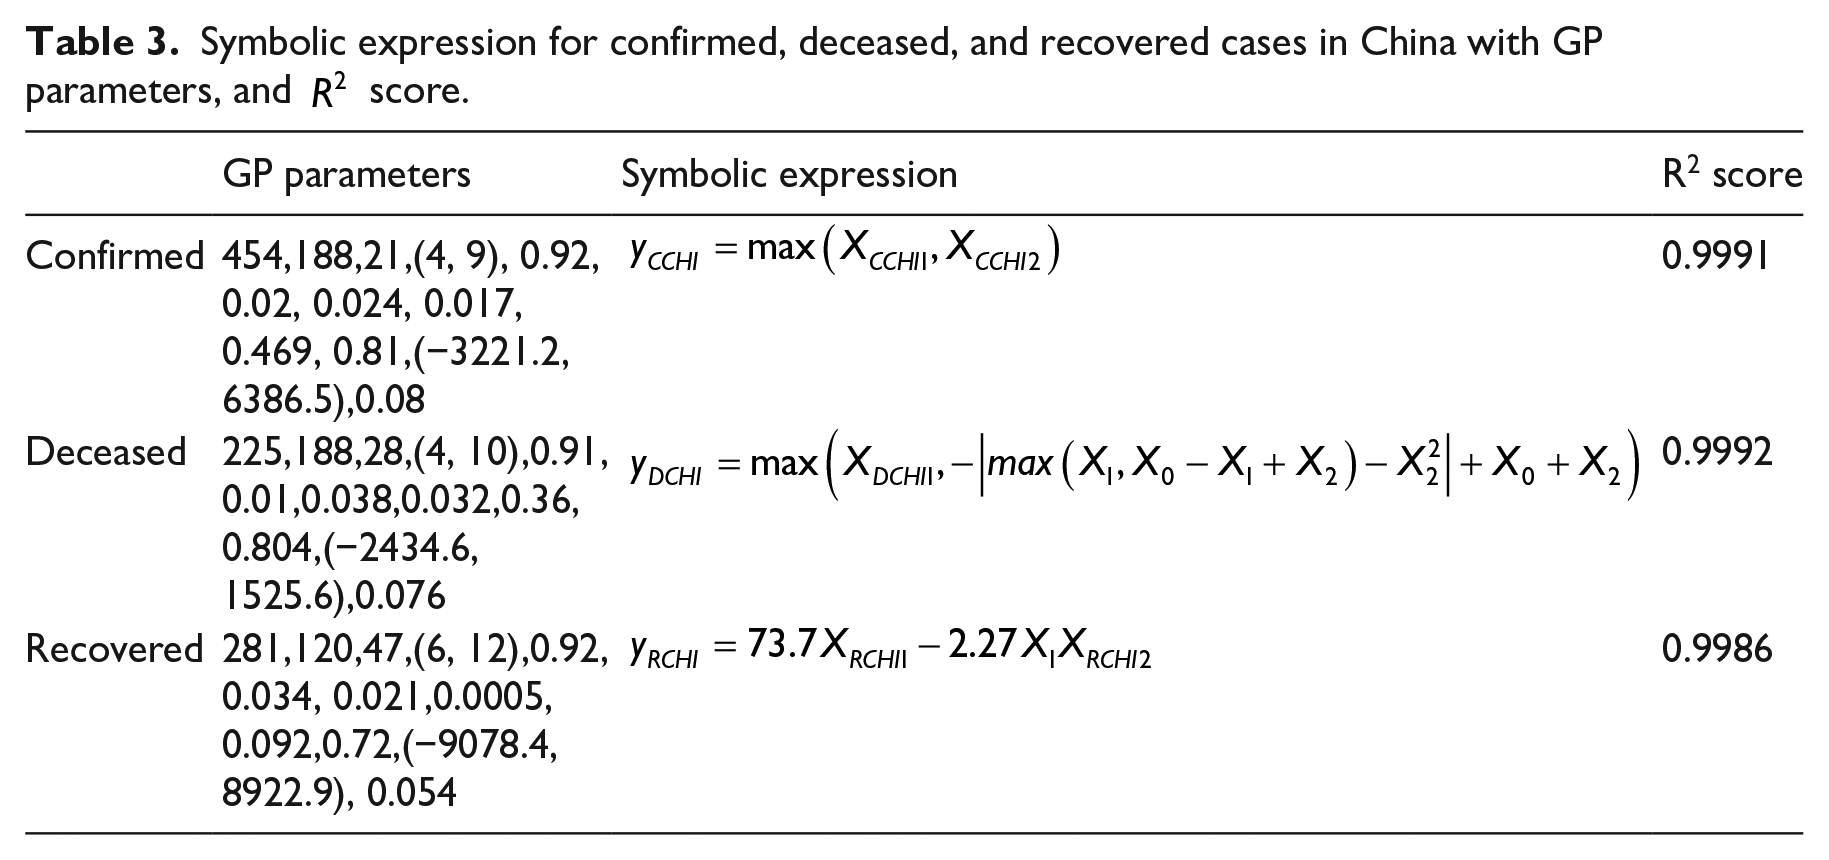
For China model the province of Hubei was chosen as a training/testing model based on the number of confirmed cases, as well as the number of deceased and recovered cases. The equations for confirmed, deceased, and recovered patients are shown in Table 3 with
Symbolic expression for confirmed, deceased, and recovered cases in China with GP parameters, and
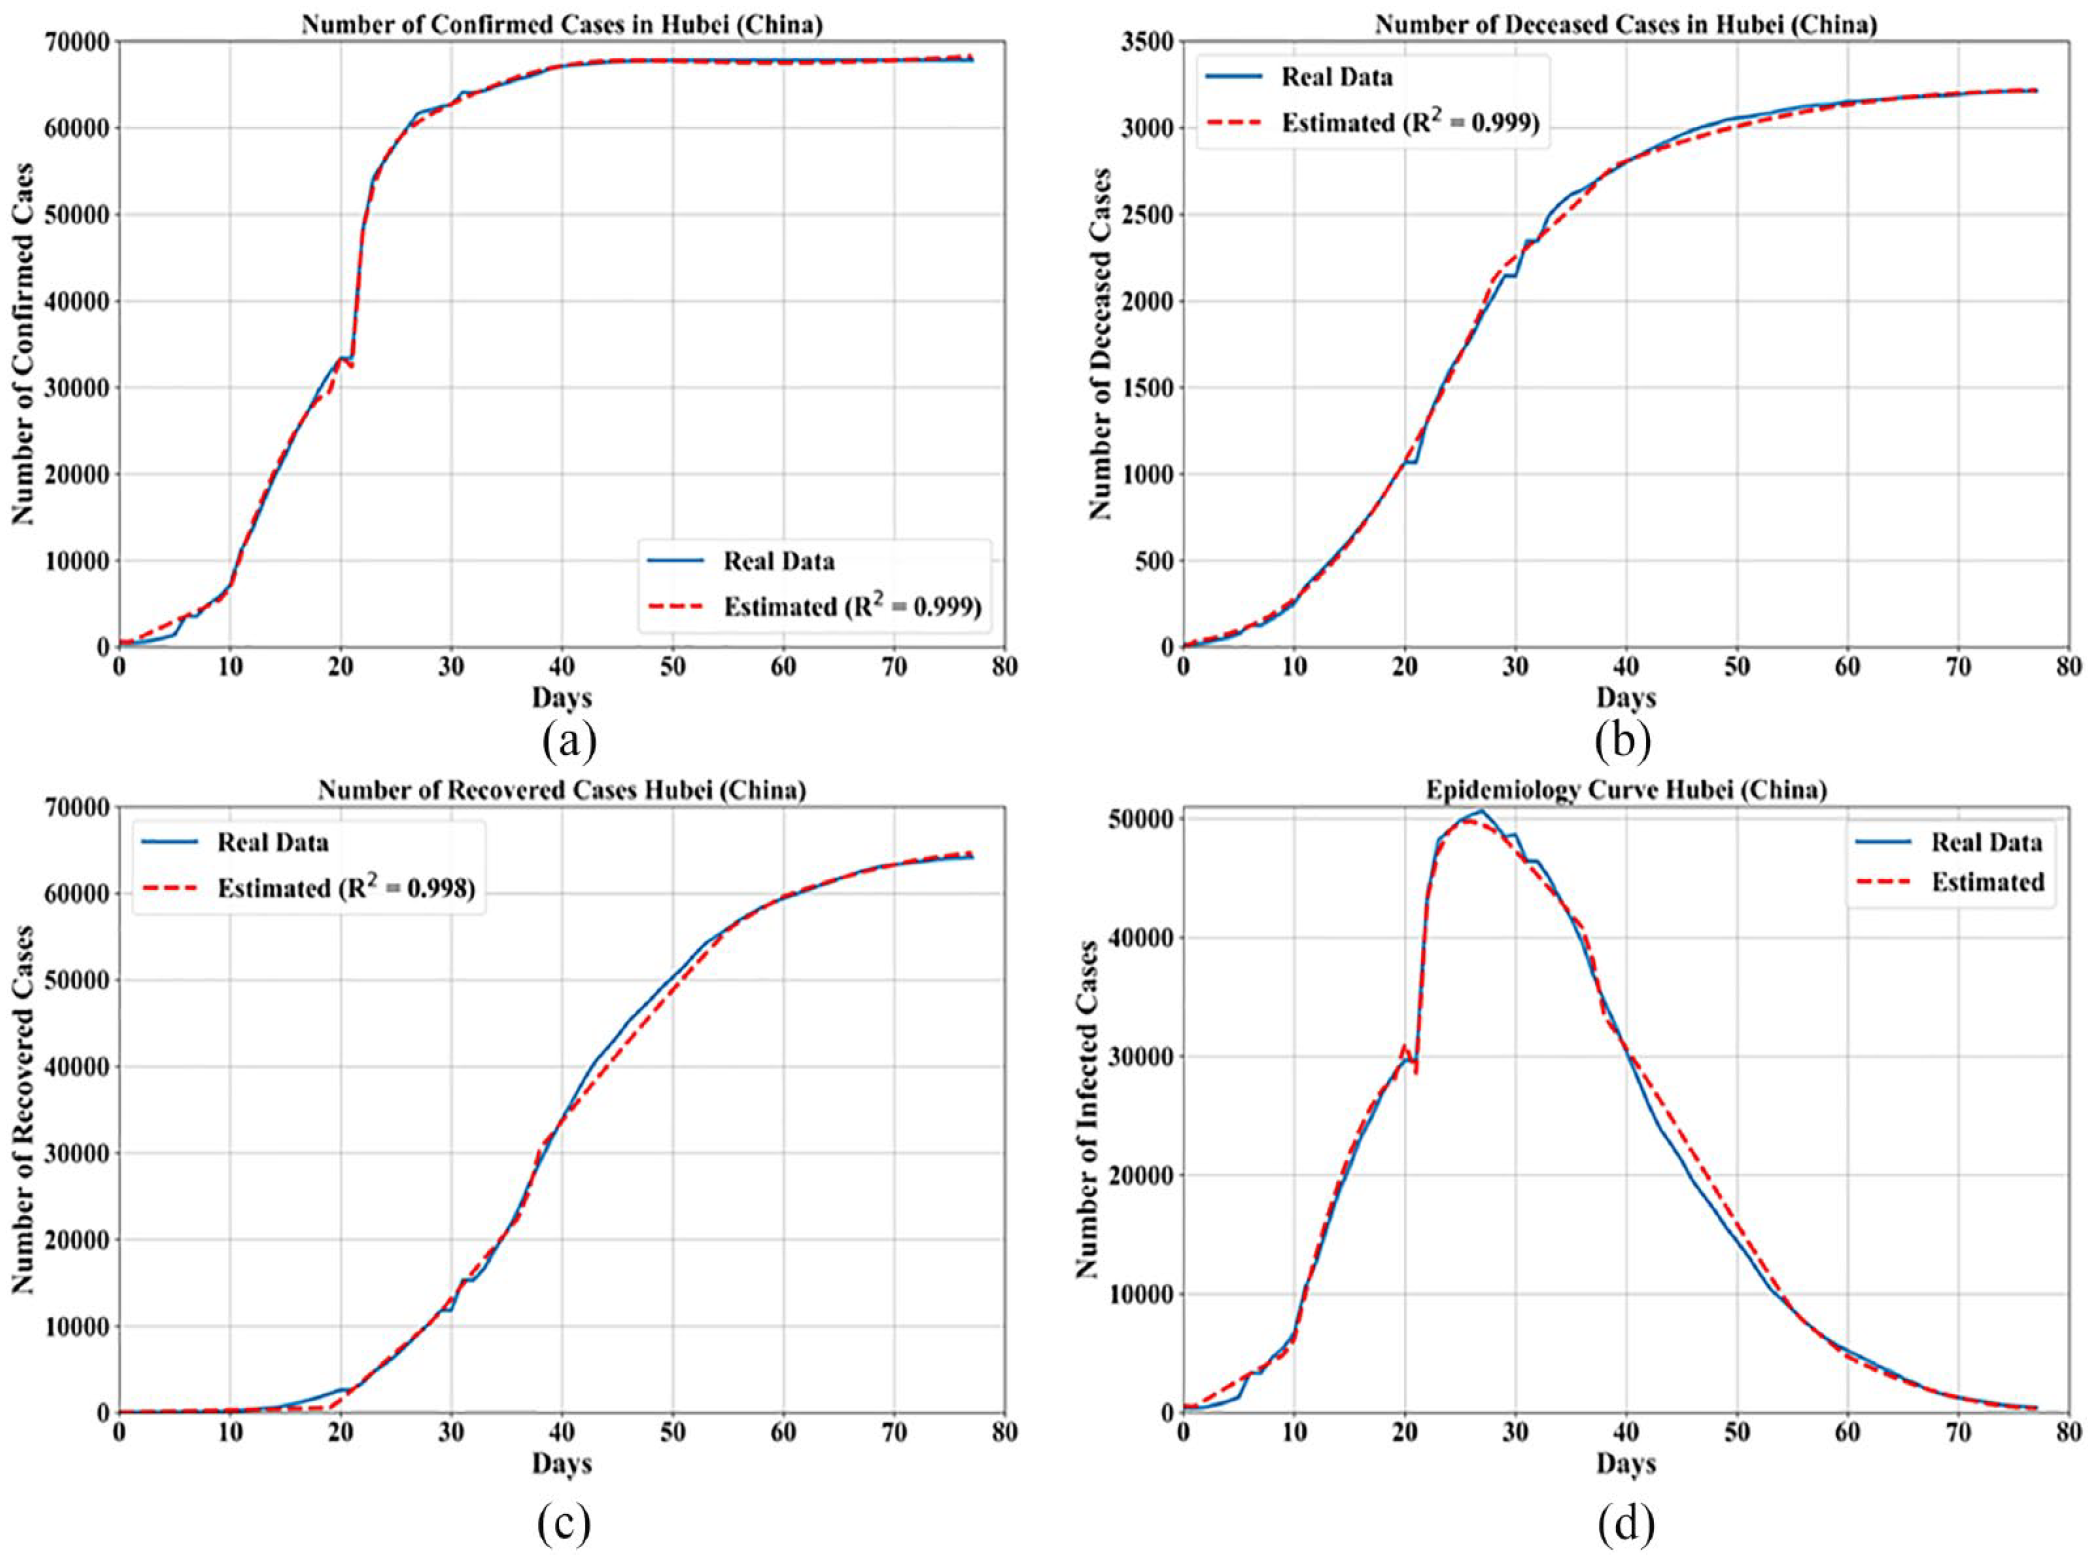
Comparison of mathematical models with (a) confirmed cases, (b) deceased cases, (c) recovered cases, and (d) epidemiology curve for China.
Since the equations are too long to fit into Table 3, the coefficients
Italian model
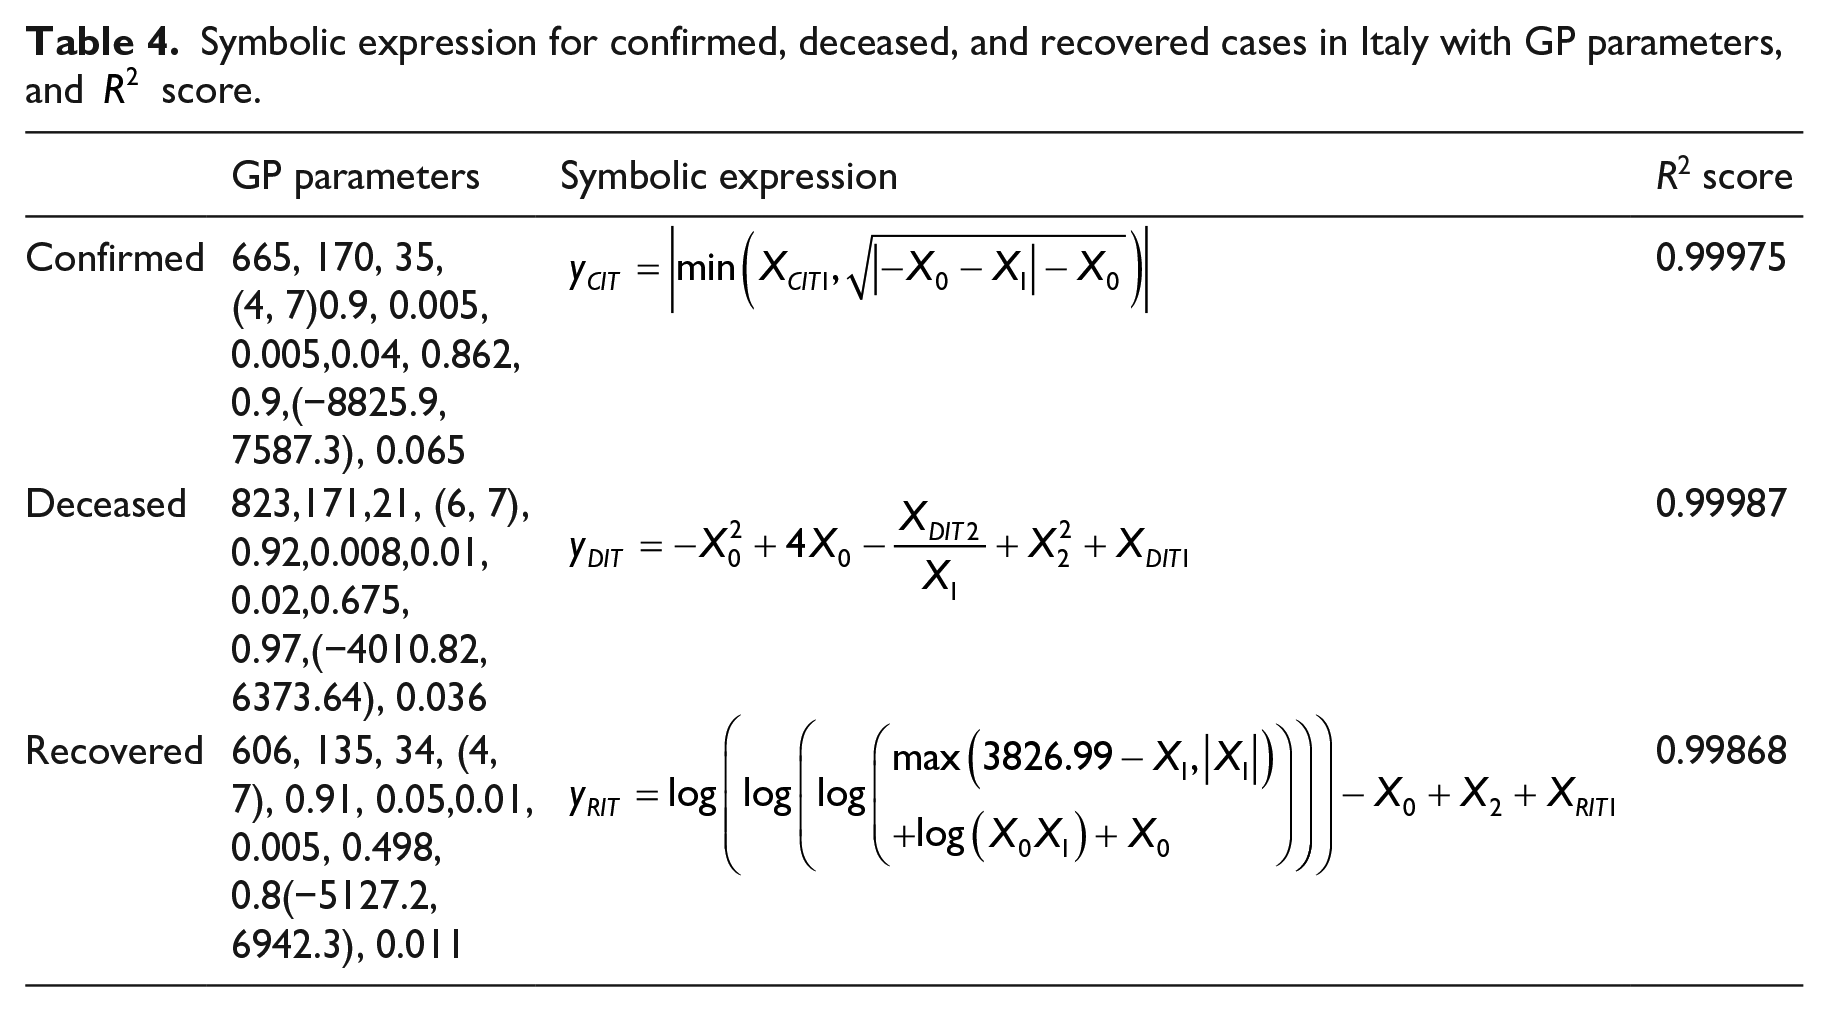
In this subsection, results for the obtained Italian model are presented. The best equations obtained for each case are given in Table 4 alongside GP parameters that were used to obtain each equation and
Symbolic expression for confirmed, deceased, and recovered cases in Italy with GP parameters, and
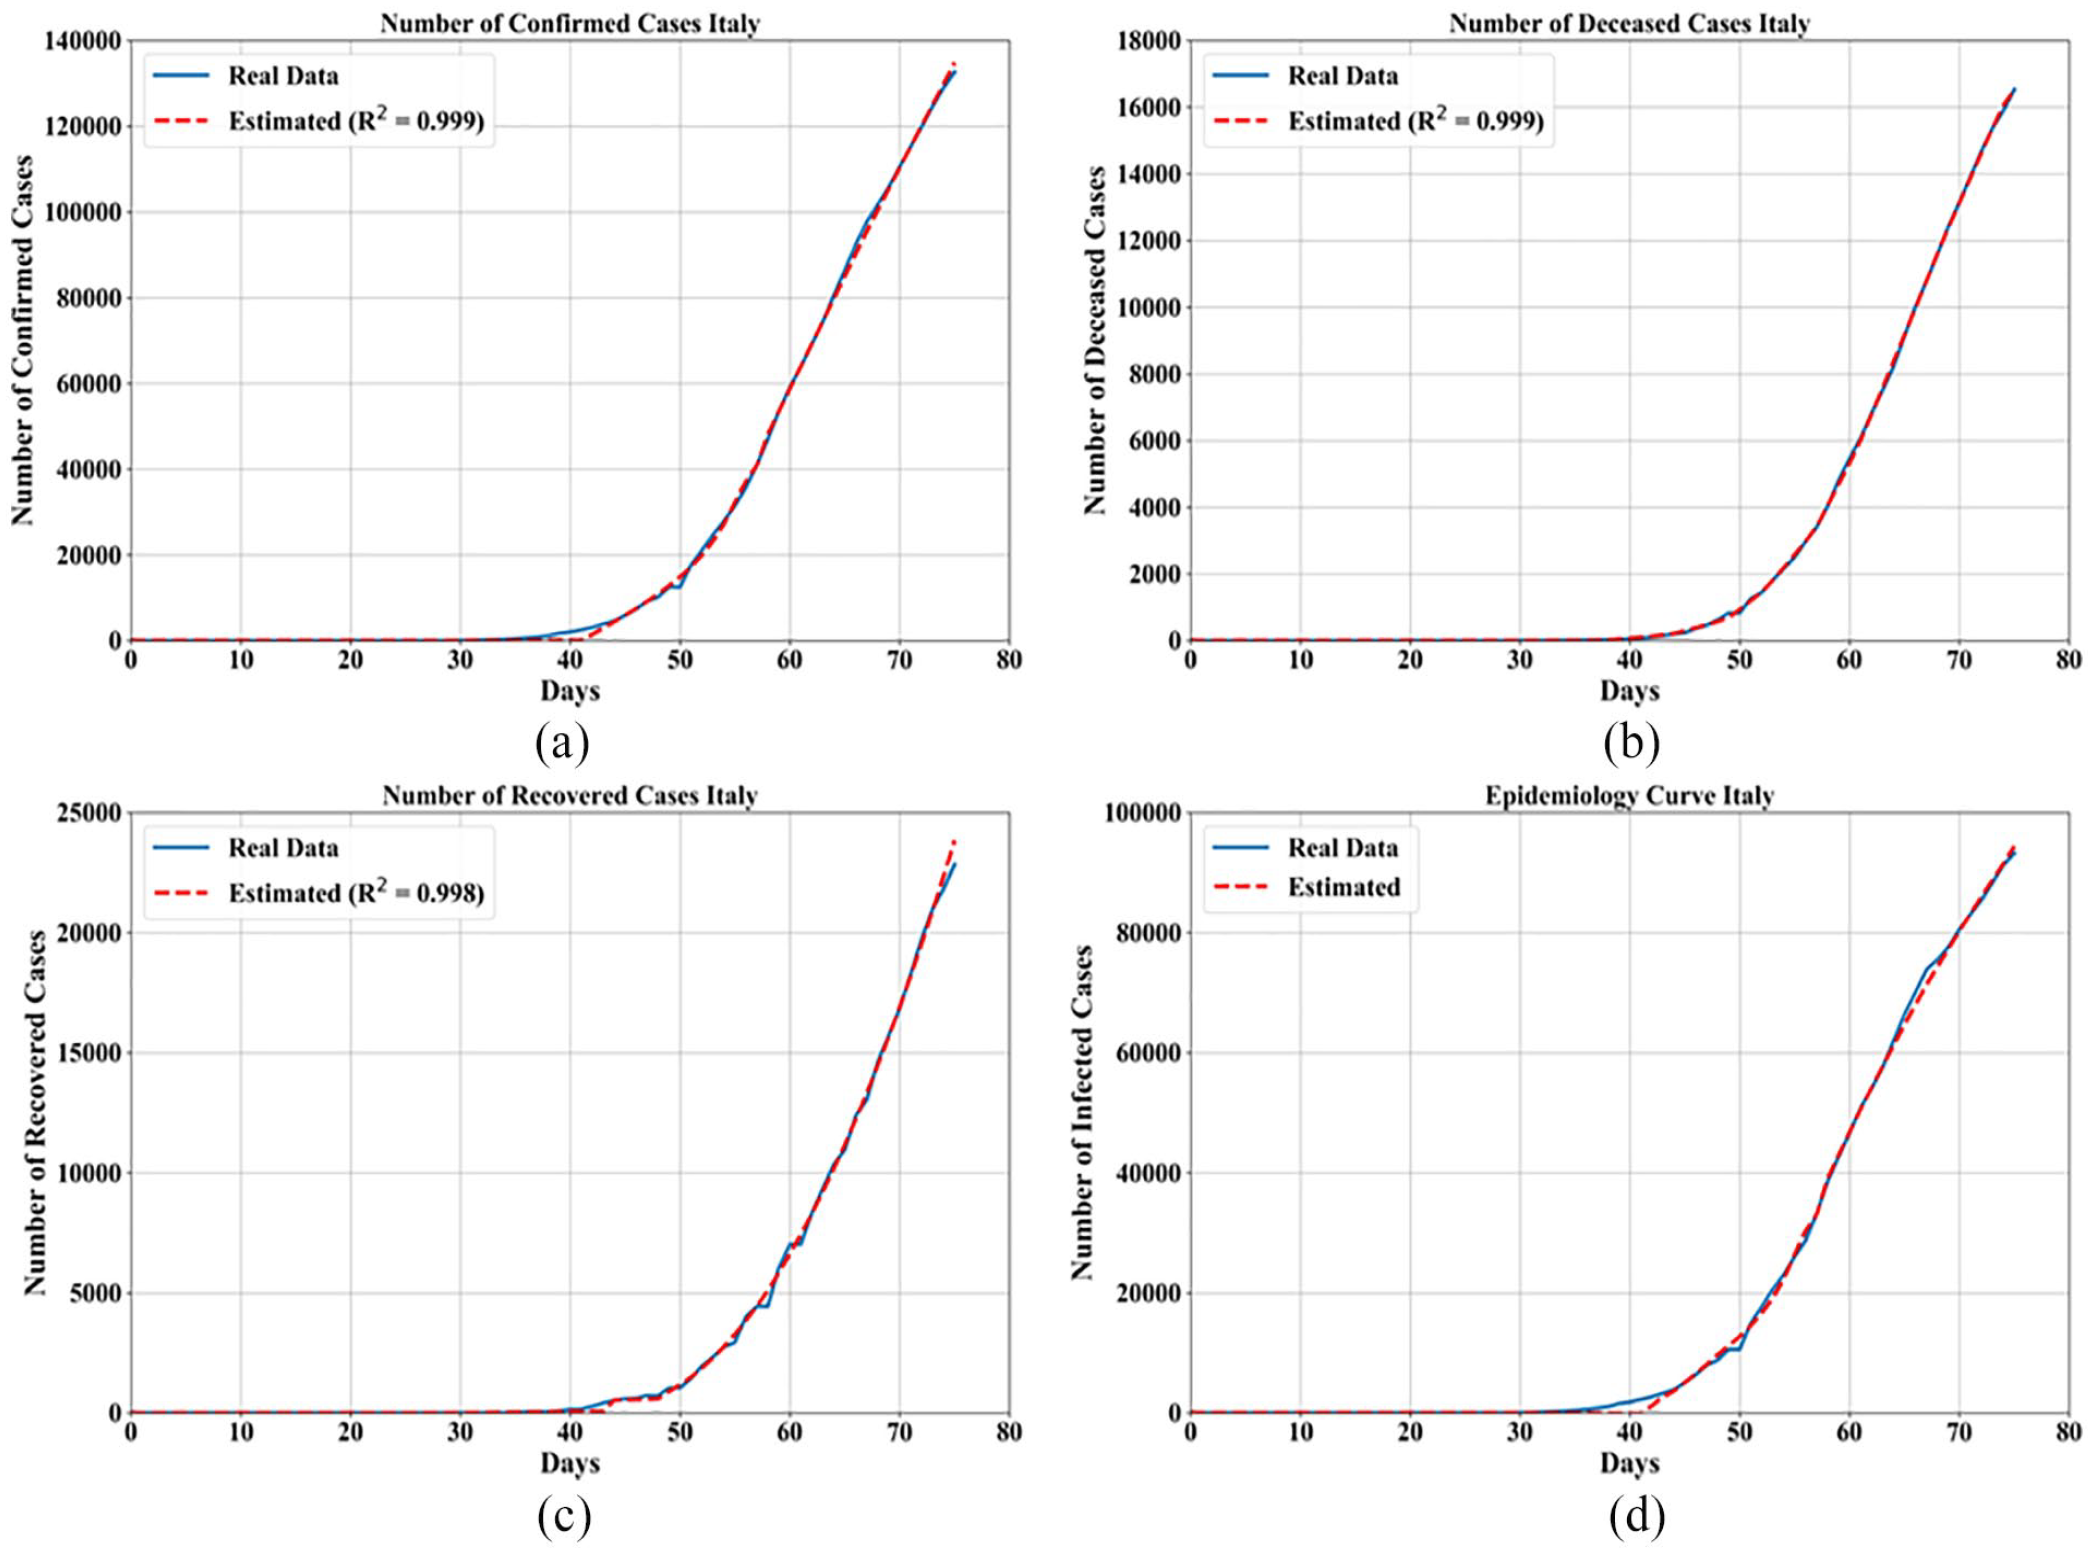
Comparison of mathematical models with (a) confirmed cases, (b) deceased cases, (c) recovered cases, and (d) epidemiology curve for Italy.
The coefficients
From Figure 2 it can be seen that mathematical expressions have good approximation on Confirmed, Deceased, and Recovered Cases as well as estimation of epidemiology trend.
Spain model
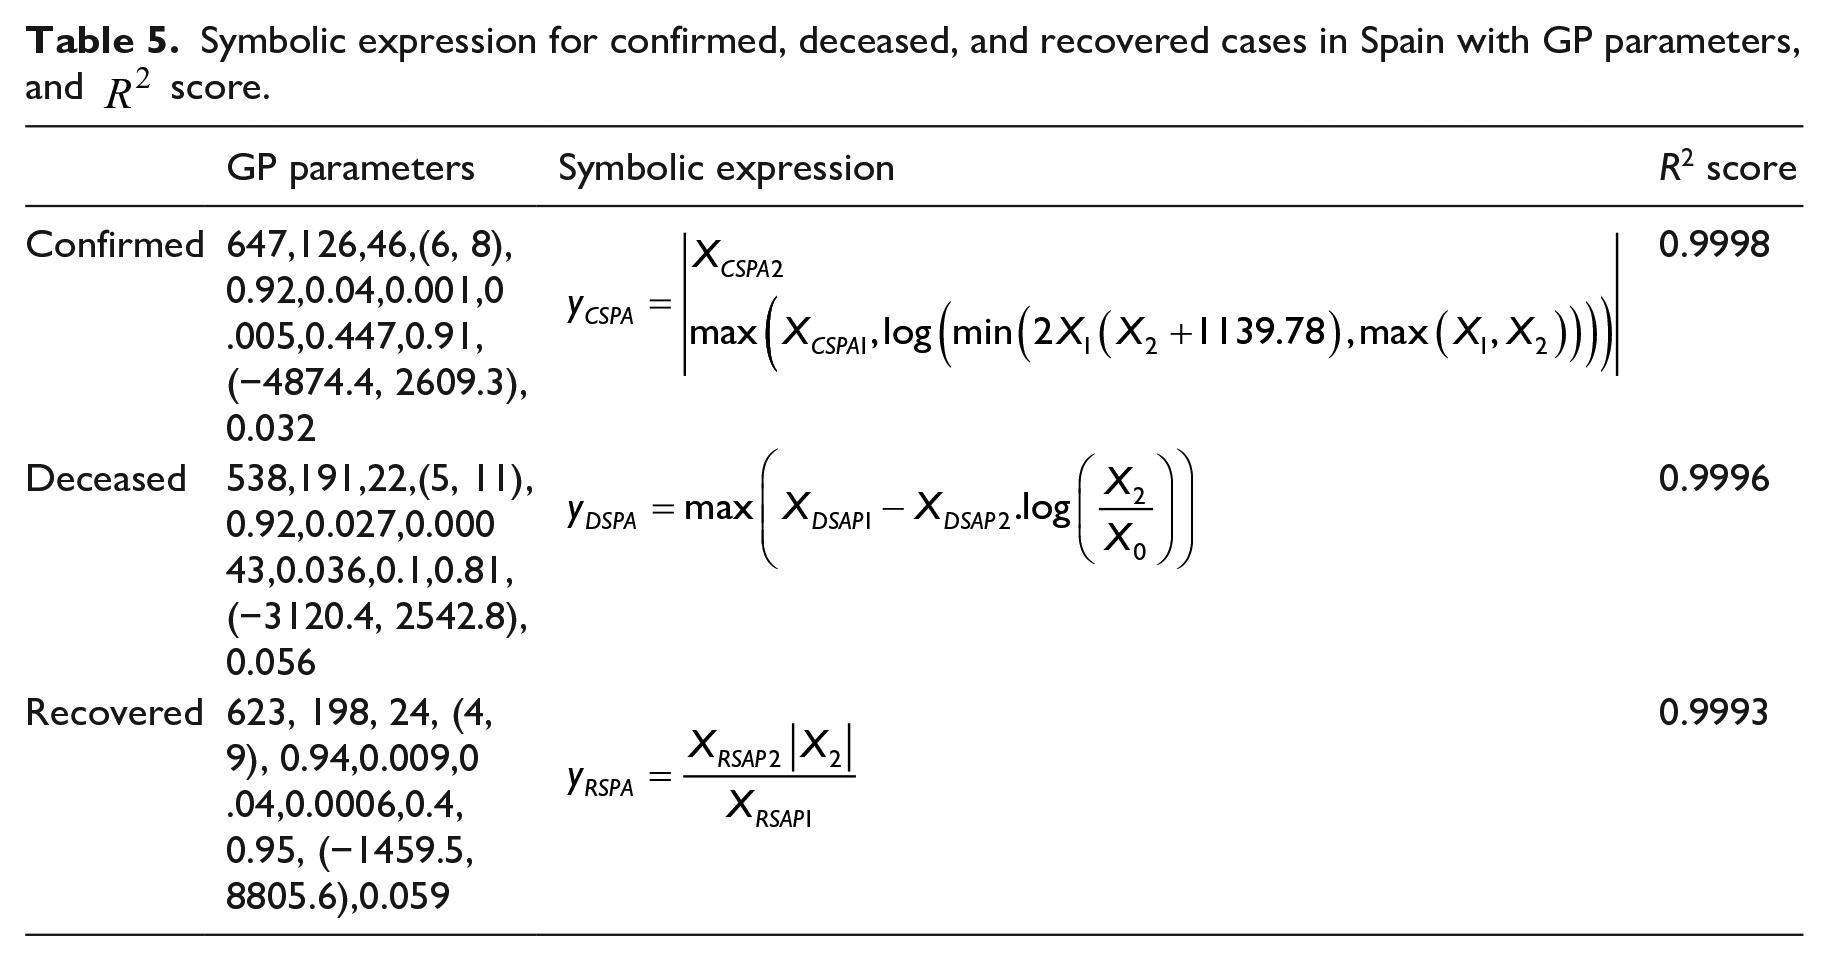
Spanish epidemiology trend is somewhat similar to the Italian epidemiology trend. Although the number of confirmed cases each day is shown to be rapidly growing and the number of deceased cases is smaller than in Italian epidemiology model while the number of recovered case is much larger. The equations used for estimation in each case with GP parameters and
Symbolic expression for confirmed, deceased, and recovered cases in Spain with GP parameters, and
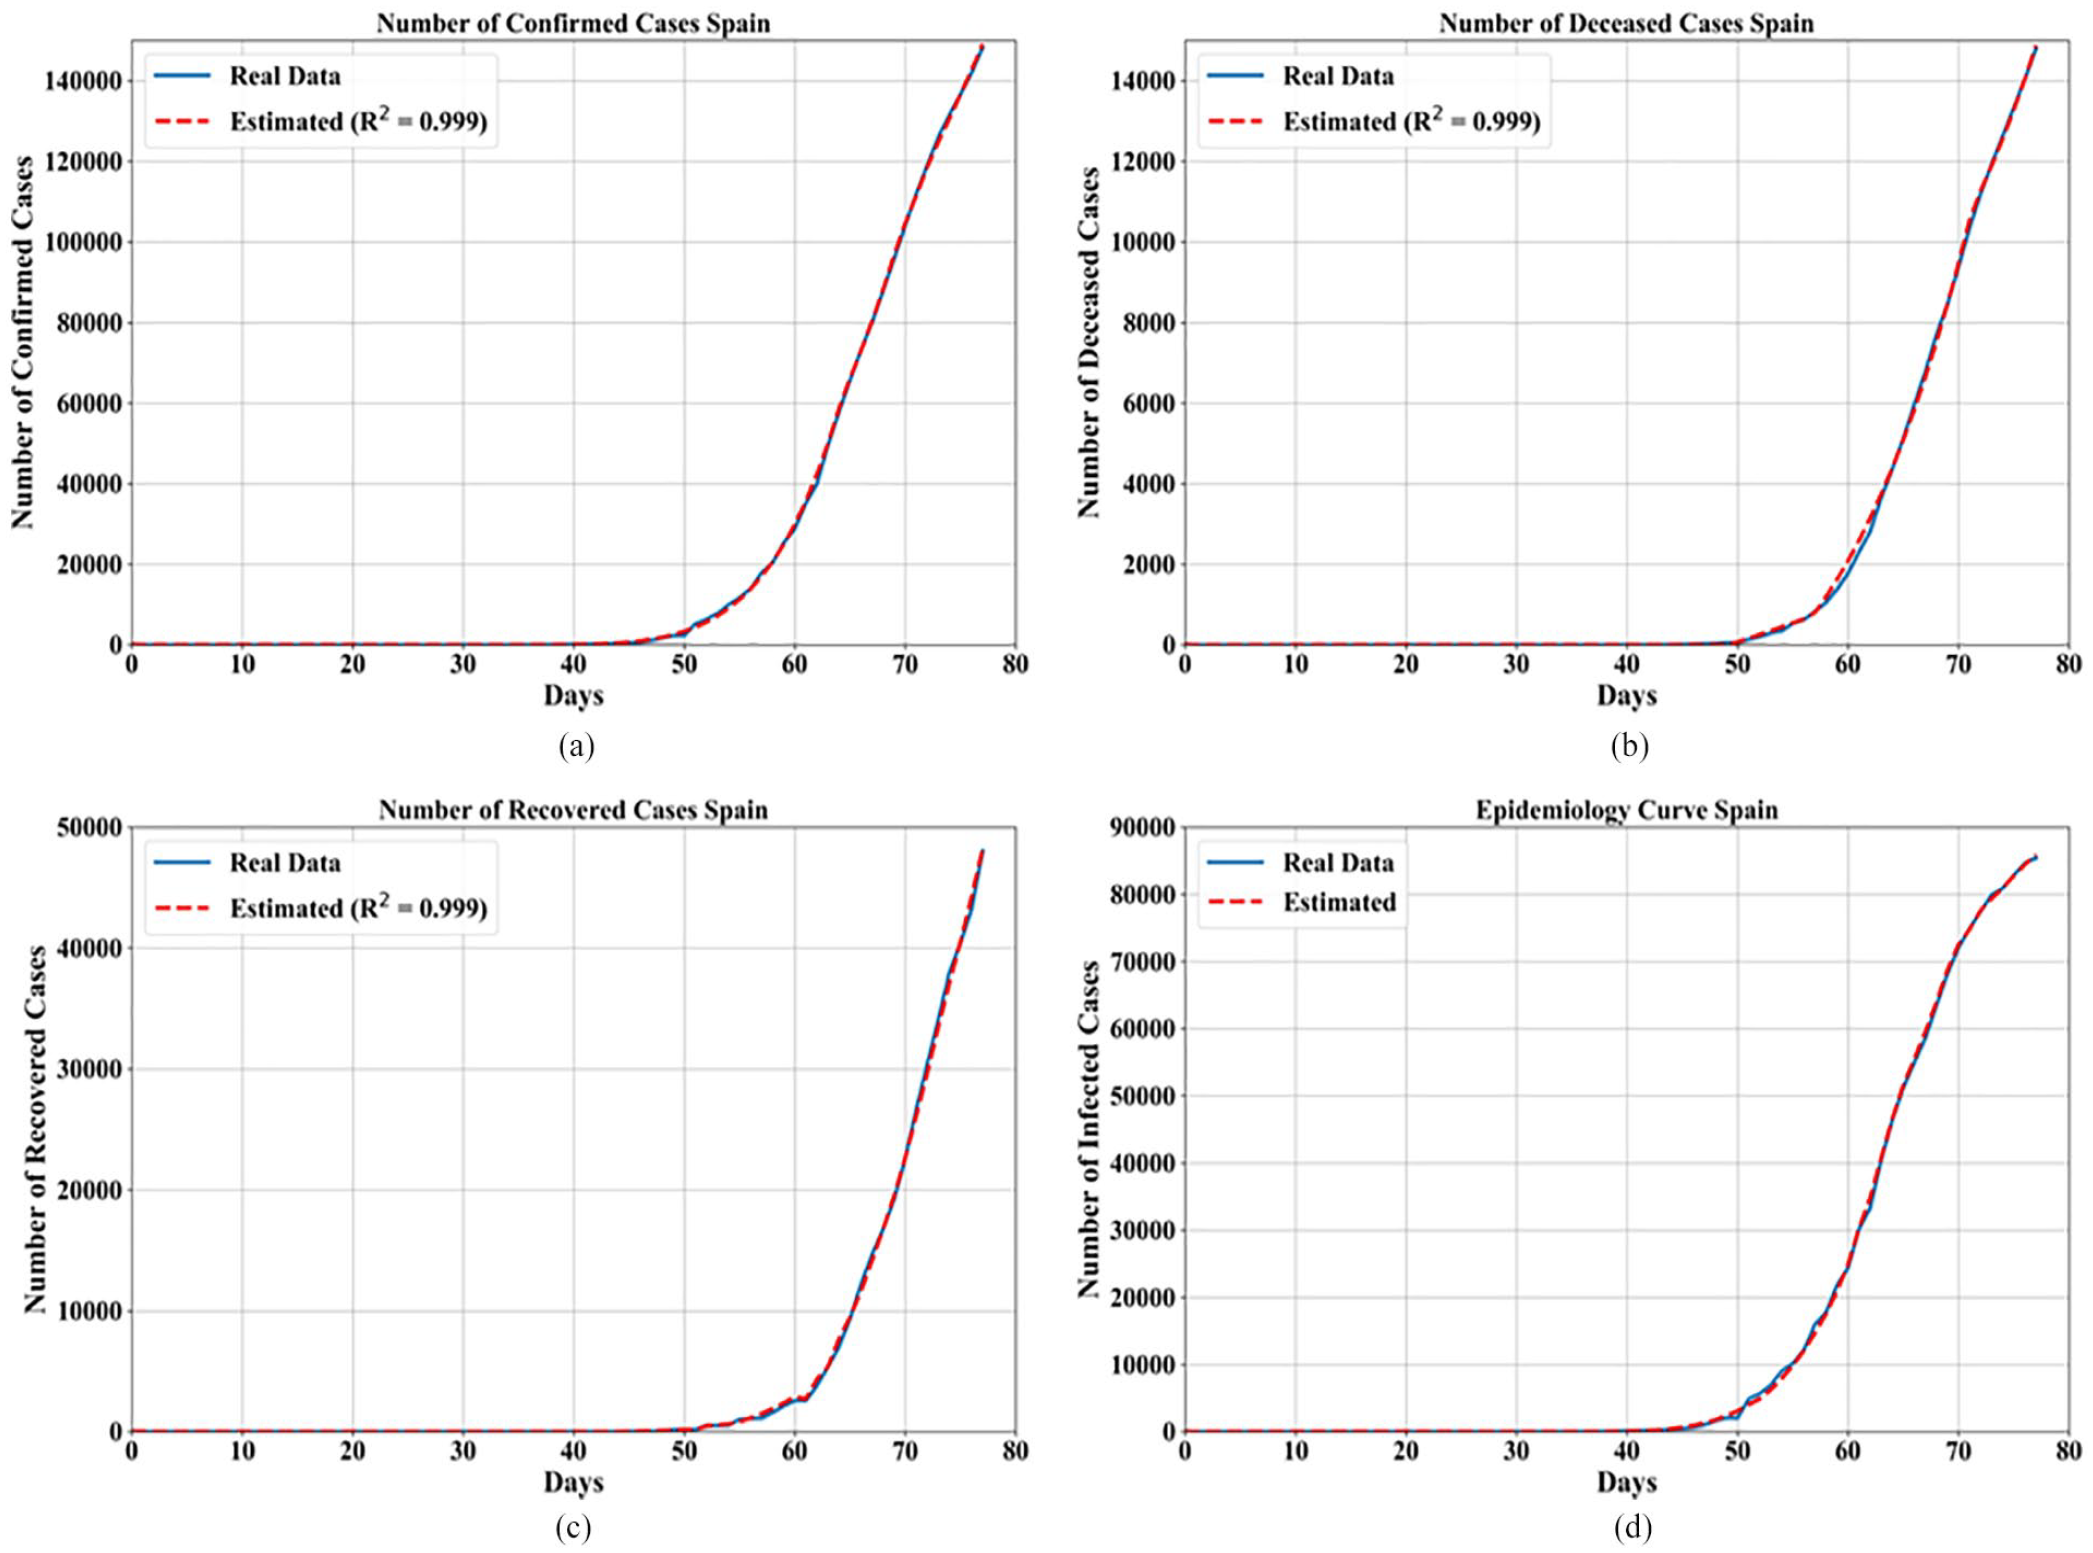
Comparison of mathematical models with (a) confirmed cases, (b) deceased cases, (c) recovered cases, and (d) epidemiology curve for Spain.
In Table 5 the coefficients
As seen from Figure 3 this model is similar to the Italian model which means that the number of confirmed and deceased cases is increasing rapidly while the number of recovered cases is slowly increasing. The mathematical expressions from Table 5 that are shown in Figure 3(a)–(c) it can be seen that these mathematical expressions follow the trend confirmed, deceased, and recovered cases really well. In Figure 4(d) all three mathematical expressions were combined as shown in equation (1). The daily number of recovered and deceased cases were subtracted from the daily number of confirmed cases in order to determine the number of active cases. This procedure is done for real data and for the obtained mathematical expressions. From Figure 3 it can be seen that the mathematical expression almost perfectly estimates the real data with only a small deviation.
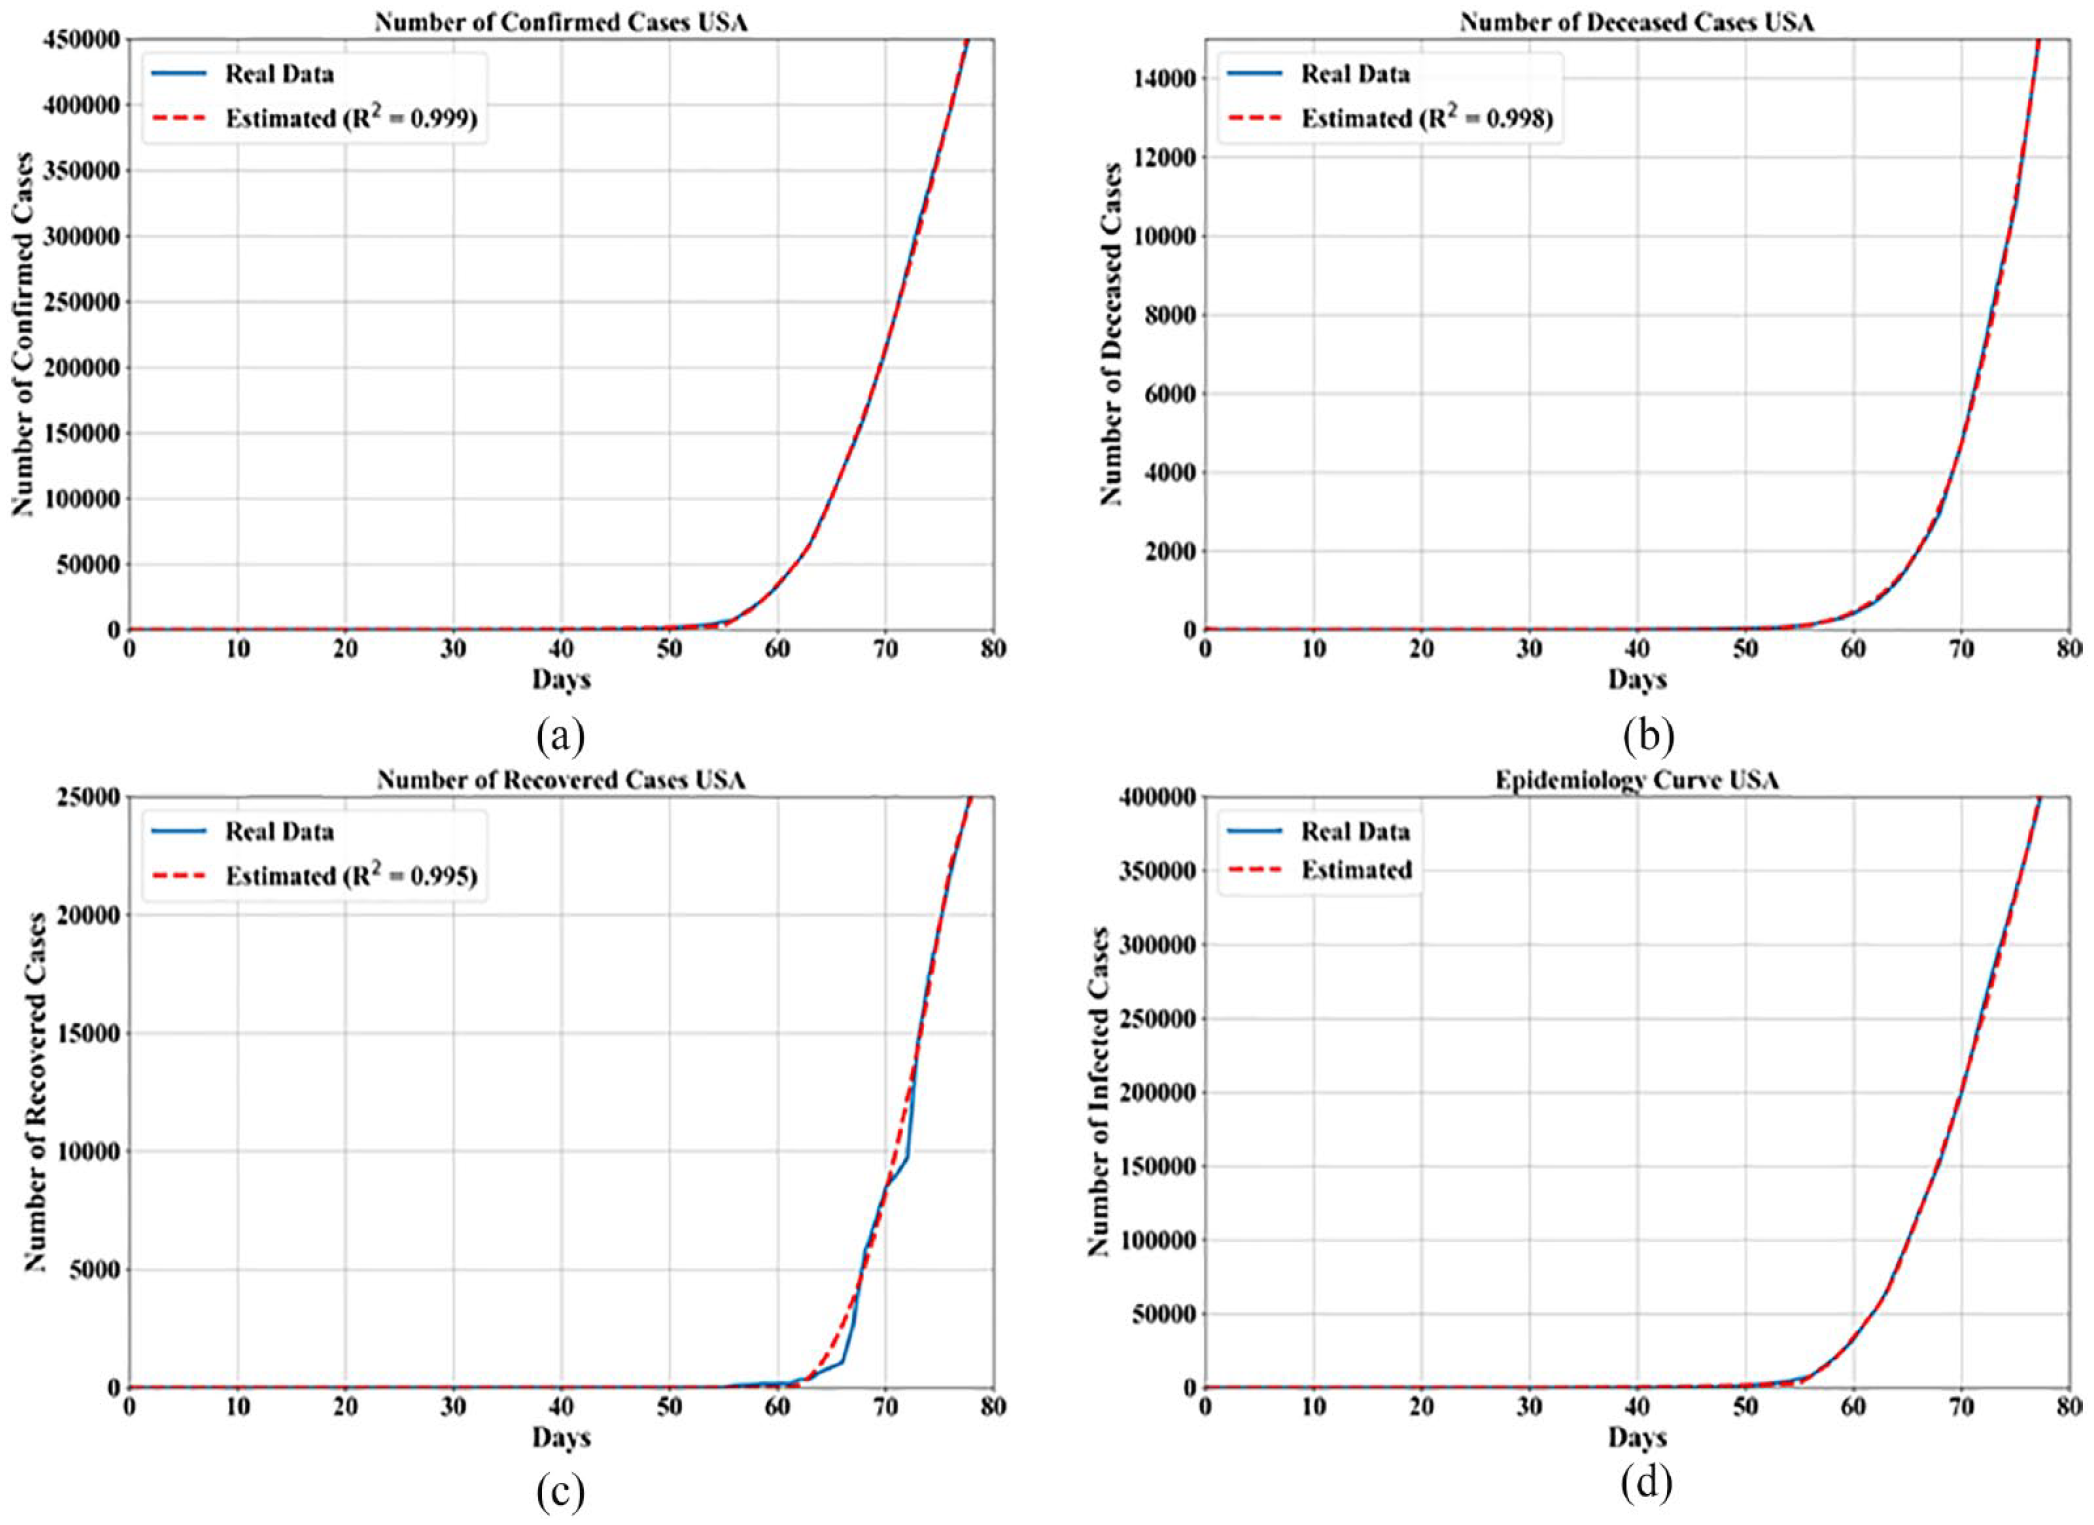
Comparison of mathematical models with (a) confirmed cases, (b) deceased cases, (c) recovered cases, and (d) epidemiology curve for USA.
USA model
The USA is one of the last countries in which COVID-19 epidemic began and it is almost impossible to make predictions since the number of confirmed cases and deceased cases is rapidly growing. However, the data collected so far is enough to obtain mathematical expressions for confirmed, deceased, and recovered cases and possibly make the estimation of epidemiology curve using aforementioned expressions. The mathematical expressions for each case with GP parameters that were used to obtain these mathematical expressions and their performance measured in terms of
Symbolic expression for confirmed, deceased, and recovered cases in USA with GP parameters, and
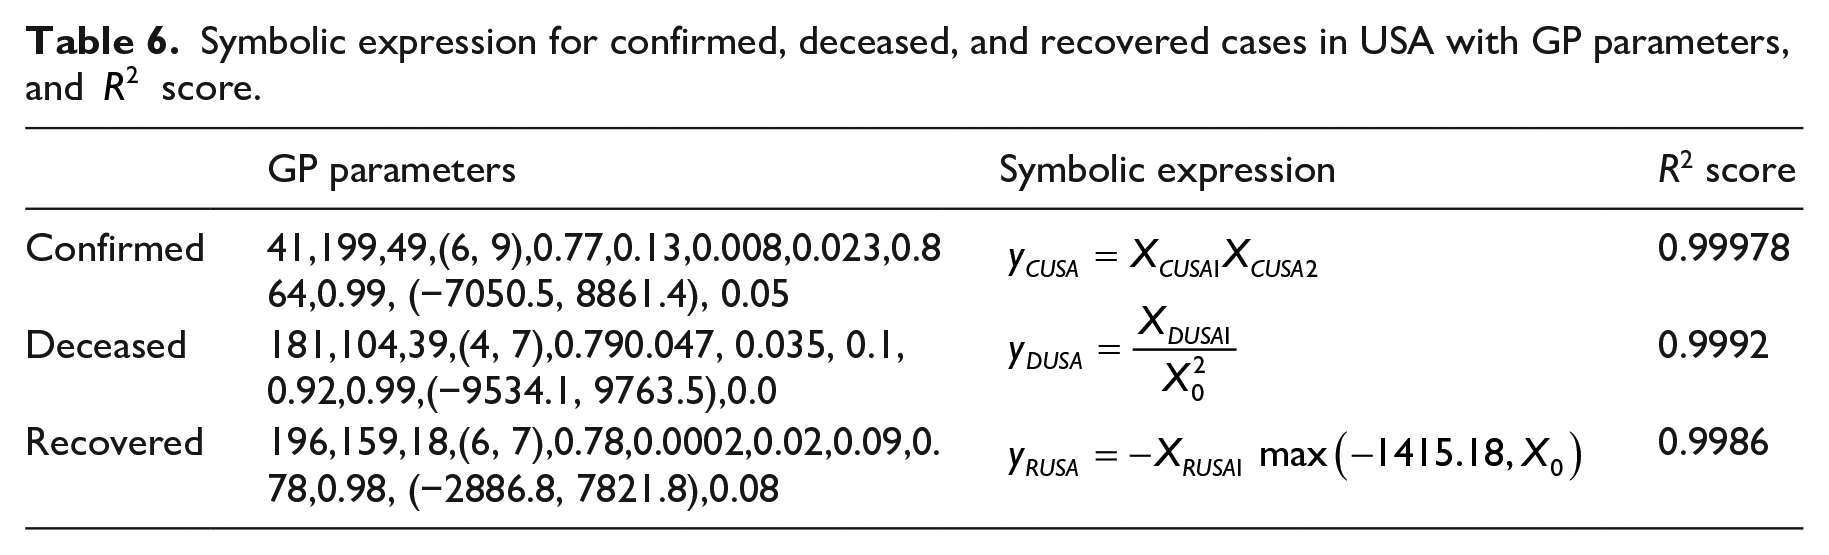
As seen from the Table 6 in order to write mathematical expressions in shorter form the coefficients
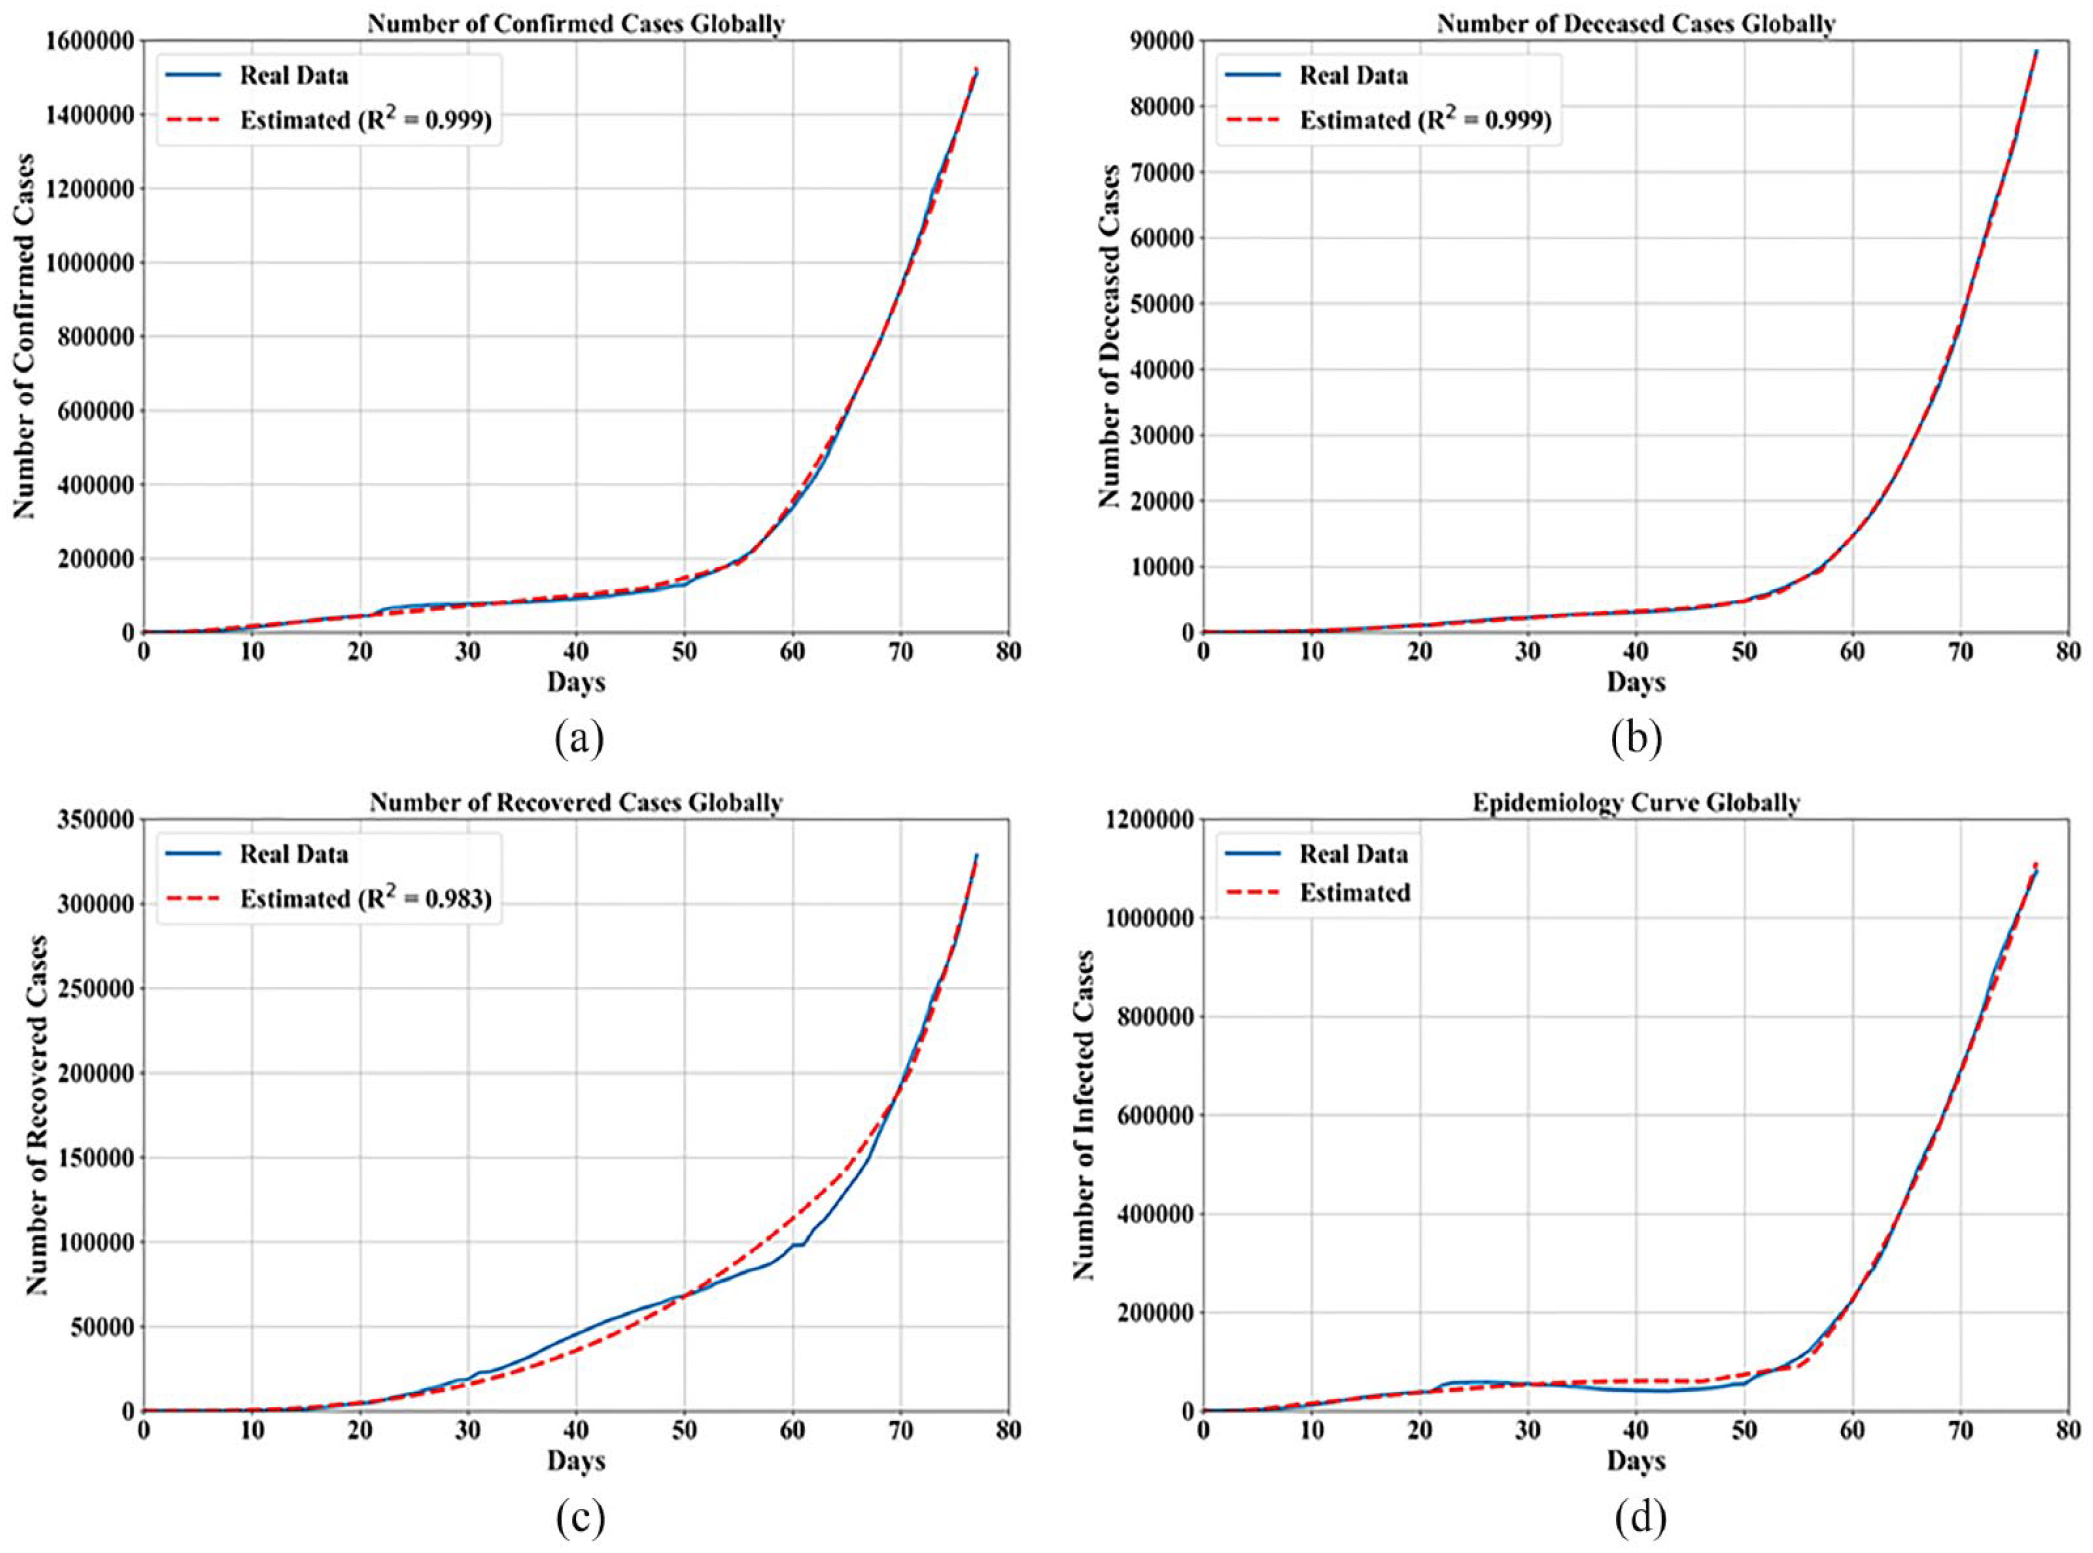
Comparison of mathematical models with (a) confirmed cases, (b) deceased cases, (c) recovered cases, and (d) epidemiology curve on global scale.
Global model
In order to find the global mathematical model that could be utilized for estimation on real data, the data set used for training and testing on confirmed, deceased, and recovered cases must be adjusted. In each data set, the sum of all cases for each day must be calculated in order to determine the total number of confirmed, deceased, and recovered cases. The latitude and longitude as input variable in this model are set to zero since the inclusion of these parameters into the model failed to generate accurate mathematical models. The mathematical models obtained on confirmed, deceased, and recovered cases have one input variable which is number of days since the first data entry. In Table 7 the mathematical equations obtained using GP for each case are shown with the GP parameter used to obtain these equations and
Symbolic expression for confirmed, deceased, and recovered cases globally with GP parameters, and
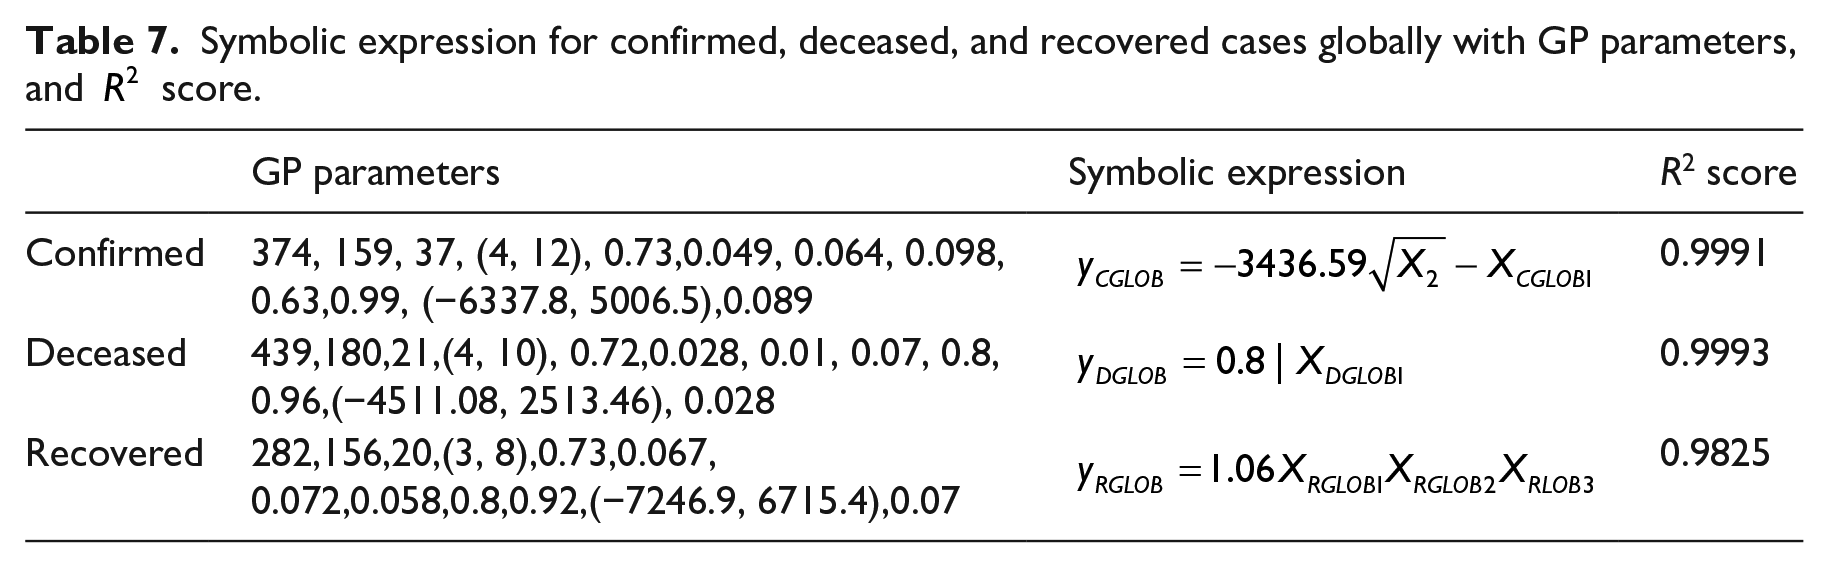
In Table 7 the coefficients
In Figure 5(a)–(c) the performance of mathematical expressions for confirmed, deceased, and recovered case are compared to real data. The comparison showed that mathematical expressions provide good approximations to the real data for confirmed and deceased models, with the mathematical equation for recovered case showing some deviations from the real data. In Figure 5 using equation (1) the epidemiology trend estimation is made. The real data from confirmed, deceased, and recovered cases models was used to determine the number of active cases using equation (1). Then the data generated by three equations from Table 7 was used in equation (1) in order to obtain the number of infected cases. The comparison of these two curves in Figure 5(d) shows that the epidemiology curve based on these three equations shows a good approximation of real epidemiology data.
Discussion
In Table 1 the possible ranges of hyperparameters used in GP algorithm are shown. The crossover probabilities for all models tended to higher values, with all mutation probabilities tending to lower values. Because of this, crossover probability had a bigger influence on population of symbolic expressions in each generation than the mutation coefficient probabilities. Stopping criteria coefficient was never achieved, because of a very low upper bound of values from which it could be selected. Due to this, the secondary stopping criteria, number of generations, was used to stop the training process in all models. The number of generations shows tendency towards the upper bound (200) across models. The maximum number of samples used in training shows the tendency to the upper bound of possible values. The resulting range of parsimony coefficients which were used to generate the best symbolic expressions is very low. This happened due to weak correlation between input and output variables, in order to enable growth of symbolic expressions in terms of achieving lower
Today a vast number of AI algorithms exist which can be used to solve specific problems. The most popular AI algorithms are ANNs which are trained in a similar manner to GP in order to solve specific problem. The result of training the ANN to solve a specific problem is the architecture which is capable of solving the problem. The transformation of ANN architecture into mathematical expression is almost impossible due to the large number of neurons and their interconnections. On the other hand the benefit of using GP algorithm is it will, after training, produce the mathematical expression that correlates inputs and the desired output.
In order to obtain epidemiology trend equation for the Chinese, Italian, Spanish and USA models GP was utilized to obtain symbolic expressions for the number of confirmed, deceased, and recovered cases. For each symbolic expression obtained using GP the dataset consisted of latitude, longitude, and a number of confirmed/deceased/recovered cases for each day since the dataset start. Due to a small dataset at the moment of the research the latitude and longitude were fixed for each specific location in each model. The Chinese model is the most unique model when compared to other modes since the outbreak of COVID-19 started earlier than in other models and the number of confirmed and deceased cases is stagnating while the number of recovered cases is slowly growing. The latitude and longitude for the Chinese model was fixed at Hubei province (latitude: 31, longitude: 112) due to a small numbers of other locations for reported confirmed/deceased/recovered cases. The best symbolic expressions for confirmed, deceased, and recovered cases obtained using GP generated
For the Italian model, the symbolic expressions for confirmed/deceased/recovered cases were obtained using the same procedure as described in case of the Chinese model. Since at the time the symbolic expressions were obtained there were small numbers of locations in which COVID-19 was confirmed and they were mostly concentrated at hospitals the location in terms of latitude and longitude values was fixed at the city of Milan (latitude: 45.27, longitude: 9.11). When compared to the Chinese model the Italian model had exponential growth of the number of confirmed/deceased/recovered cases. This growing trend can be attributed to the fact that extreme quarantine measures, social distancing and high sanitation standards were not implemented as they should have been. The best symbolic expressions for confirmed/deceased/recovered cases obtained using GP generated
The epidemiology trend in Spanish model shows the same behavior as the Italian model, with exception of the number of confirmed cases, the growth of which was slowly decreasing. The procedure for obtaining the symbolic expressions for confirmed, deceased, and recovered cases is the same as in previous models. Due to the small number of reported locations the latitude and longitude values were fixed to the city of Madrid (latitude:
When compared to the other countries in the USA the outbreak has recently started. However, due to high number of violations of extreme quarantine measures as well as social distancing, hygiene, and sanitation measures the number of confirmed and deceased cases exponentially increased while the number of recovered cases showed only a slow increase. Again, the procedure for obtaining symbolic expressions for confirmed, deceased, and recovered cases using GP is the same as in previous models and due to a small number of reported locations the latitude and longitude values were fixed at the city of New York (latitude: 40.716, longitude: −74). The best symbolic expressions obtained for confirmed, deceased, and recovered cases were obtained using GP that achieved
The epidemiology trend equation on global scale was obtained following the same procedure as in the case of Chinese, Italian, Spanish, and USA model. However, the latitude and longitude were omitted due to small number of outbreak locations, at the time the analysis was conducted. So the only input variable was the number of confirmed/deceased/recovered cases for each day since the start date. The best symbolic expressions obtained for three cases using GP achieved
Conclusion
In this paper, the GP algorithm was utilized in order to obtain mathematical expressions for confirmed, deceased, and recovered cases for China, Italy, Spain, USA, and for the entire globe. In each model, the best three equations for confirmed, deceased, and recovered cases are combined together to obtain mathematical expression which could estimate the epidemiology trend. From presented results the following conclusions can be drawn.
GP algorithm can be utilized to obtain mathematical expressions for estimation of confirmed, deceased, and recovered cases of a specific country with high accuracy.
For each country model the obtained mathematical expressions could be combined together in order to estimate the epidemiology trend with high accuracy.
The obtained symbolic expressions for confirmed, recovered and deceased cases, as well as mathematical equations, for estimation of epidemiology trend in Hubei province (China model) is estimating the number of confirmed, deceased, and recovered cases as well as epidemiology curve with high accuracy. From China epidemiology trend it can be seen that the number of infected cases is decreasing which means that the extreme epidemiological measures defined by WHO were implemented and helped with lowering the number of active COVID-19 cases.
The symbolic expressions obtained using GP algorithm for confirmed, deceased, and recovered cases as well as epidemiology equation in Italian model estimate the number of confirmed, deceased, recovered, and infected cases with high accuracy. The epidemiology curve of Italy is still increasing which means that from the day the outbreak has started the epidemiological measures defined by WHO such as quarantine, social distancing and hygiene are violated by general population.
The Spanish epidemiology trend is similar to Italian with the exception that after 70 days since the start date the epidemiology curve is slow increasing trend. This change in epidemiology trend can be attributed to the fact that the general population is following the epidemiology measures defined WHO. The symbolic expressions obtained with GP algorithm as well as mathematical expression for epidemiology curve are estimating whit high accuracy when compared to the real data.
The symbolic expressions obtained using GP algorithm as well as mathematical expression for epidemiology trend for the USA are estimating the number of confirmed, deceased, recovered cases as well as the real epidemiology curve with high accuracy. The USA epidemiology trend is one of the most concerning trends when compared to the other epidemiology models. Since the outbreak has started the number of infected cases is exponentially increasing which means that general population is violating the epidemiology measures defined by WHO.
The symbolic expressions using GP algorithm as well as the mathematical expressions for epidemiology estimation on a global scale showed that these equations could estimate then number of confirmed, deceased, and recovered cases with high accuracy.
The presented research shows that by using the GP algorithm the accurate symbolic expressions can be obtained for estimation of the number of confirmed, deceased, and recovered cases. This points towards the future possible use of GP in this and similar future epidemics. This investigation also showed that the symbolic expressions for confirmed, deceased, and recovered cases could be used together in order to formulate the mathematical expression for epidemiology trend estimation which could estimate the epidemiology trend with higher accuracy. Authors hope that the hyperparameters of the obtained models along with presented methodology can lay further groundwork for re-fitting models using GP or similar methods with newly gathered data in the future, in both the ongoing pandemic, and similar future challenges. The findings that the models can be generated with the relatively low amount of data used at the time this research was performed points towards the capability of using GP algorithm in beginning stages of epidemics to generate initial spread models.
Footnotes
Appendix
Declaration of conflicting interests
The author(s) declared no potential conflicts of interest with respect to the research, authorship, and/or publication of this article.
Funding
The author(s) disclosed receipt of the following financial support for the research, authorship, and/or publication of this article: This research has been (partly) supported by the CEEPUS network CIII-HR-0108, European Regional Development Fund under the grant KK.01.1.1.01.0009(DATACROSS), project CEKOM under the grant KK.01.2.2.03.0004, CEI project “COVIDAi” (305.6019-20) and University of Rijeka scientific grant uniritehnic-18-275-1447.