
Abstract
This study sought to detect a potential safety signal of mirtazapine abuse by combining two different sources of surveillance, specifically Google Analytics (Google, Inc., Mountain View, CA, USA) and the FDA Adverse Event Reporting System database. Data from the first quarter of 2004 to the second quarter of 2017 were collected and analysed. The search interest over time, the frequencies of abuse-related terms in the search analytics domain, and the odds ratio of abuse events in FDA Adverse Event Reporting System were determined. Correlations between the two aforementioned domains using quarterly data from the timeline series were also assessed. Our results suggest a positive correlation between abuse-related searches in the Google domain and abuse-related events in FDA Adverse Event Reporting System database. These results indicate that these methods can be used in combination with each other as a pharmacovigilance supplementary tool to detect drug safety signals.
Introduction
Post-marketing drug safety surveillance mainly relies on data retrieved from spontaneous report systems and observational databases. However, due to some important limitations of these data sources, interest in exploring the use of new methods of surveillance to detect potential drug safety signals is growing. Prescription drug abuse is an emerging field in pharmacovigilance characterised already as an epidemic crisis in the United States, with Europe approaching a similar conclusion. The most commonly abused drugs include opioids, stimulants, benzodiazepines, 1 and, to a lesser extent, substances such as the gabapentinoids (pregabalin and gabapentin). 2 Antidepressants are considered to have a low abuse potential and their usage has been reported mostly in patients with comorbid substance use disorder seeking euphoric and/or stimulant-like effects.3,4 Mirtazapine is a noradrenergic and specific serotonergic antidepressant (NaSSA) marketed since 1996. 5 PsychonautWiki, a community-driven encyclopaedia covering psychoactive substances, has classified mirtazapine as a recreational substance whose hallucinogenic, sedative, and delirium-like effects make the users rapidly develop a tolerance to but without showing habit-forming actions. 6 Studies conducted among heroin users 7 or inpatients treated with mirtazapine for methamphetamine withdrawal similarly report these properties. 8 Recently, published studies have further validated this classification: mirtazapine was the most prevalent nonprescribed psychoactive drug found in the post-mortem toxicological analysis in drug poisoning deaths in Finland 4 and was also detected in urine samples from patients with suspected illicit drug ingestion in the United Kingdom. 9
Considering the abovementioned data and the World Health Organization definition that ‘a signal is essentially a hypothesis of a risk with a medicine with data and arguments that support it, derived from data from one or more of many possible sources’, 10 the aim of our study was to detect a potential safety signal of mirtazapine abuse by combining two different methods of surveillance. The first was a recently introduced technique in the pharmacovigilance domain that is based on finding patterns in big data search analytics results. 11 During the H1N1 pandemic, Google (Mountain View, CA, USA) developed a model that could track the spread of the influenza-like illness throughout the 2008–2009 influenza season in the United States. This model was based on the idea that people in areas infected by the flu virus were conducting online searches for related information before consulting a physician. As a result, Google detected the spread of the disease in near-real-time, while the Centers for Disease Control and Prevention predicted it with a 2-week lag – a long delay for a pandemic disease. 12 Our second method was the disproportionality analysis of the US Food and Drug Administration (FDA) Adverse Event Reporting System (FAERS) using OpenVigil2.1-MedDRA, a freely accessible pharmacovigilance data extraction, mining, and analysis tool of the FAERS database. 13 Disproportionality analysis is a data mining algorithm of pharmacovigilance that is able to detect the disproportionality of a specific group of reports among the total gathered reports. Both methods were used to detect mirtazapine’s abuse potential in comparison with two controls, clonazepam and escitalopram, and, further, to investigate the correlation between search analytics and the FAERS domain. To our knowledge, this is the first study conducted using these two methodological approaches to detect a previously nonreported signal (i.e. mirtazapine’s abuse potential).
Methods
Data sources
The aim of employing both methods was to spot evidence of mirtazapine’s abuse liability by collecting and analysing data from the United States between 2004 and the second quarter of 2017 (2017Q2). Clonazepam, a benzodiazepine with a well-known abuse potential, served as the positive control, 14 while escitalopram, considered an selective serotonin reuptake inhibitor (SSRI) with a low abuse potential, served as the negative control. 3 Google Analytics was used to measure the frequency of abuse-related searches conducted in the Google search engine linked to each drug. Disproportionality analysis was designed to detect the disproportionality of abuse-related events in the FAERS database linked to each drug. Data extraction from both domains required terms assigned to the examined drugs and terms related to drug abuse.
Google Analytics
The Google search engine receives billions of queries per day and some large datasets are publicly accessible, providing valuable data. Users search Google for information related to drugs using both generic and brand names, combined together in most cases with some additional terms. Both the generic name and a common brand name of each drug were considered separately for data extraction, with the resulting data subsequently combined (Table 1). For each term, Google offered us two options to search: the first employed search semantics (from Google’s internal search machine) and recognised the term as a prescription drug, while the second performed the search for the drug as a general search term. The prescription drug category generally provides accurate results, but, depending on the popularity of the term, it is not always possible to secure a large enough search data volume. As a result, the extraction of data was done using both the ‘prescription drug’ category and the ‘general search terms’ category.
Drug names and drug-abuse-related terms.
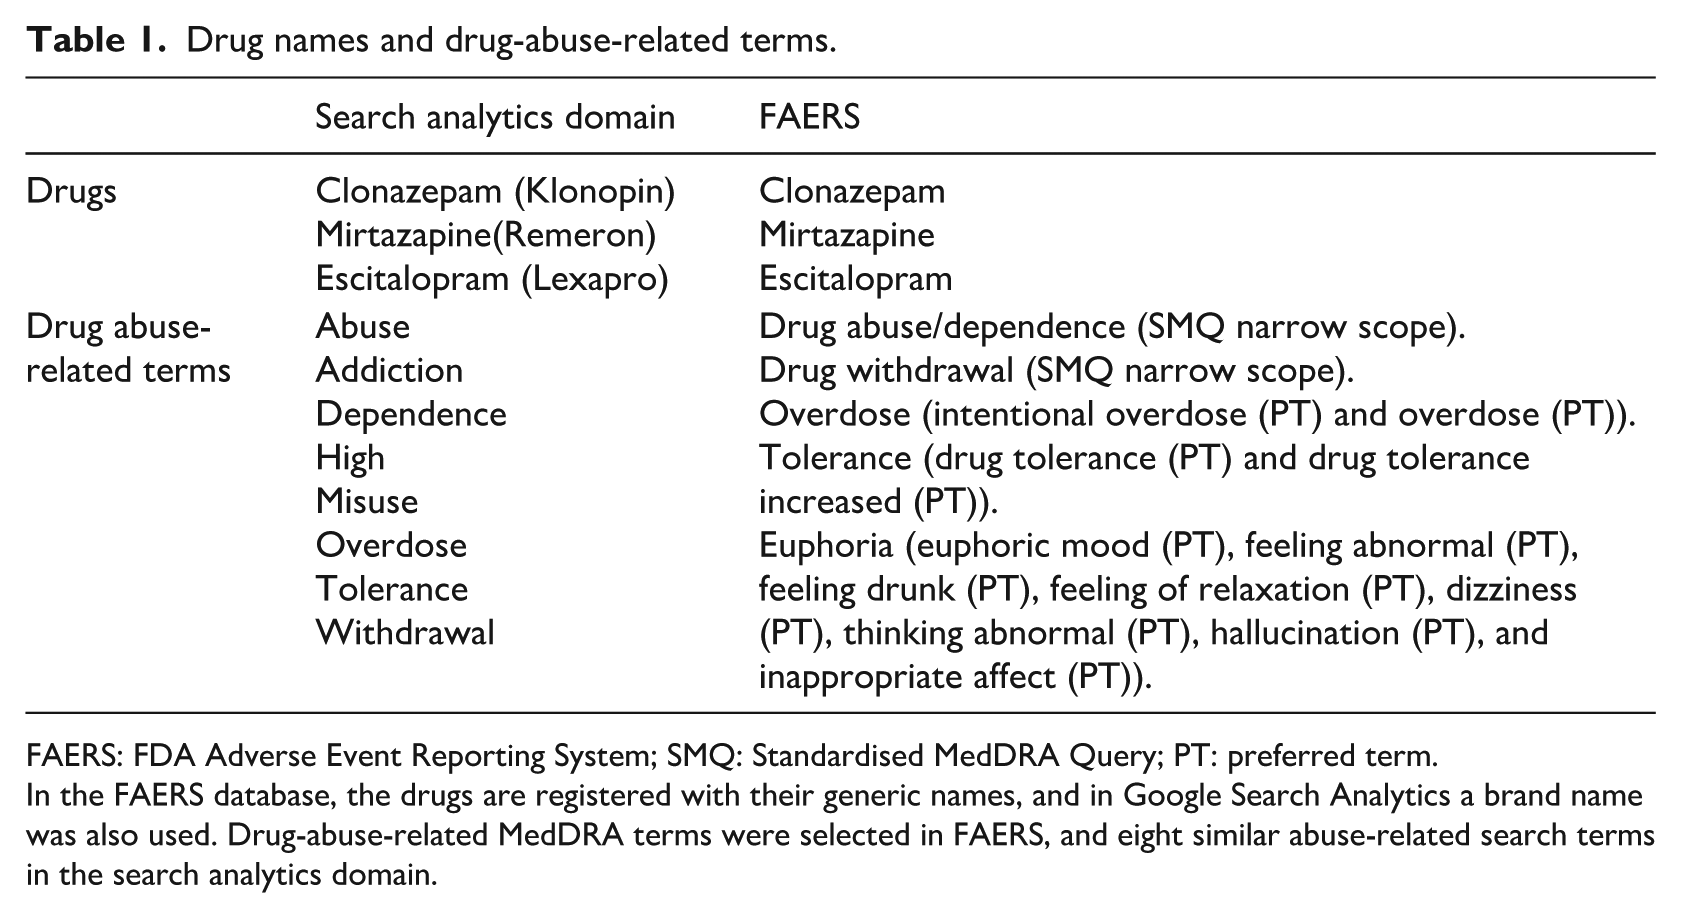
FAERS: FDA Adverse Event Reporting System; SMQ: Standardised MedDRA Query; PT: preferred term.
In the FAERS database, the drugs are registered with their generic names, and in Google Search Analytics a brand name was also used. Drug-abuse-related MedDRA terms were selected in FAERS, and eight similar abuse-related search terms in the search analytics domain.
Abuse-related search terms were utilised to trigger abuse-related search queries in Google. Eight terms similar to the MedDRA abuse-related terms were used in Google Analytics, as follows: ‘abuse’, ‘overdose’, ‘misuse’, ‘withdrawal’, ‘addiction’, ‘dependence’, ‘tolerance’, and ‘high’ (Table 1). Search terms with low results volumes, duplicate searches, and searches with special characters (i.e. queries with apostrophes and other special characters) were excluded. 15 Among the billions of search queries, only those containing combinations of the selected drugs’ names and abuse-related terms were identified. However, not all queries that contained a combination of the above terms were associated with abuse. For example, the search query ‘can you get high off clonazepam’ is related to abuse, while the query ‘clonazepam and high blood pressure’ is not. In consideration of this, the isolation of the queries’ data was performed manually.
FAERS
FAERS is a spontaneous adverse events database that relies on individual safety reports collected by the pharmaceutical industry, health professionals, and patients hailing predominantly from the United States.
16
OpenVigil2.1-MedDRA, a freely available pharmacovigilance tool, operates only on cleaned FAERS data – that is, results where duplicates or reports with missing data are removed.
13
It requires only the generic drug name for data extraction, as drug entries are normalised to the format of generic name (US adopted name) based on external databases (e.g. DrugBank and
Statistical analysis
In order to provide quantitative metrics linked to abuse liability, the following indicators were used: search interest over time, measured by the search popularity score (SPS); search frequencies of abuse-related terms in the Google Analytics domain; and the reporting odds ratio (ROR) for abuse-related adverse events in the FAERS domain.
Search interest over time
For each search term, Google returns the top related queries, suggesting that users looking for the term have also searched for these queries. The most popular search queries are sorted by a metric, the SPS, with a value that varies from 0 to 100 points. The SPS represents the total number of searches for each term divided by the total number of related searches of the geography and time range in order to compare relative popularity between topics. The most-searched-for query takes a score of 100 points, while a score of 50 points is assigned to queries that are searched half as often. A score of 0 points is assigned to those queries searched for at a rate of less than 1 per cent of that of the activity focused on the top query. In other words, terms with a popularity of less than 1 per cent in comparison with the peak have a score of 0 points. 15
The monthly SPS of overall abuse-related terms was also obtained for each drug. Thus, timelines for each drug were created, which represent the average search interest over time for abuse-related terms between the start of 2004 and 2017Q2. Search analytics of clonazepam, mirtazapine, and escitalopram were initially evaluated with regard to the normality assumption using a formal test (Kolmogorov–Smirnov test), histograms, boxplots, and normal Q–Q plots. Kurtosis and skewness parameters were also considered. Normality assumption findings were considered in order to calculate the appropriate descriptive statistics and choose the proper statistical test for comparing the search analytics between drugs. As search analytics were not approximately normally distributed, medians and interquartile ranges (IQRs) were calculated as measures of centrality and variability, respectively, and between-drug comparisons were performed using the Kruskal–Wallis H test. In the case of statistical significance with the Kruskal–Wallis H test, we performed post hoc tests using the Mann–Whitney U test for between-group comparisons.
Search frequencies of search queries linked to abuse-related terms
The exact search frequencies for abuse-related terms for each drug were gathered and analysed according to the following method. Using Google’s AdWords Keyword Planner, additional sets of search queries for each abuse-related term were created, containing not only exact matches but also phrases that users had typed in the search engine. For example, for the terms ‘clonazepam’ and ‘addiction’, we received a set of six related search queries linked with this abuse-related term (Table 2). The search volume of the query represents the average monthly searches made for each query. By summing the search volumes for abuse-related queries, as seen in Table 2, and dividing by the search volume of the queries related to clonazepam, we can obtain the search frequency for the pairing of this drug with a certain abuse-related search term. In the above example, the drug is clonazepam and its average search volume per month was 246,000. We repeated this procedure for all pairings. Our analyses ultimately contained more than 200 different search queries and their respective volume sizes, including abuse-related search terms.
Example of search queries for clonazepam and an abuse-related search term (addiction) with their search volume.
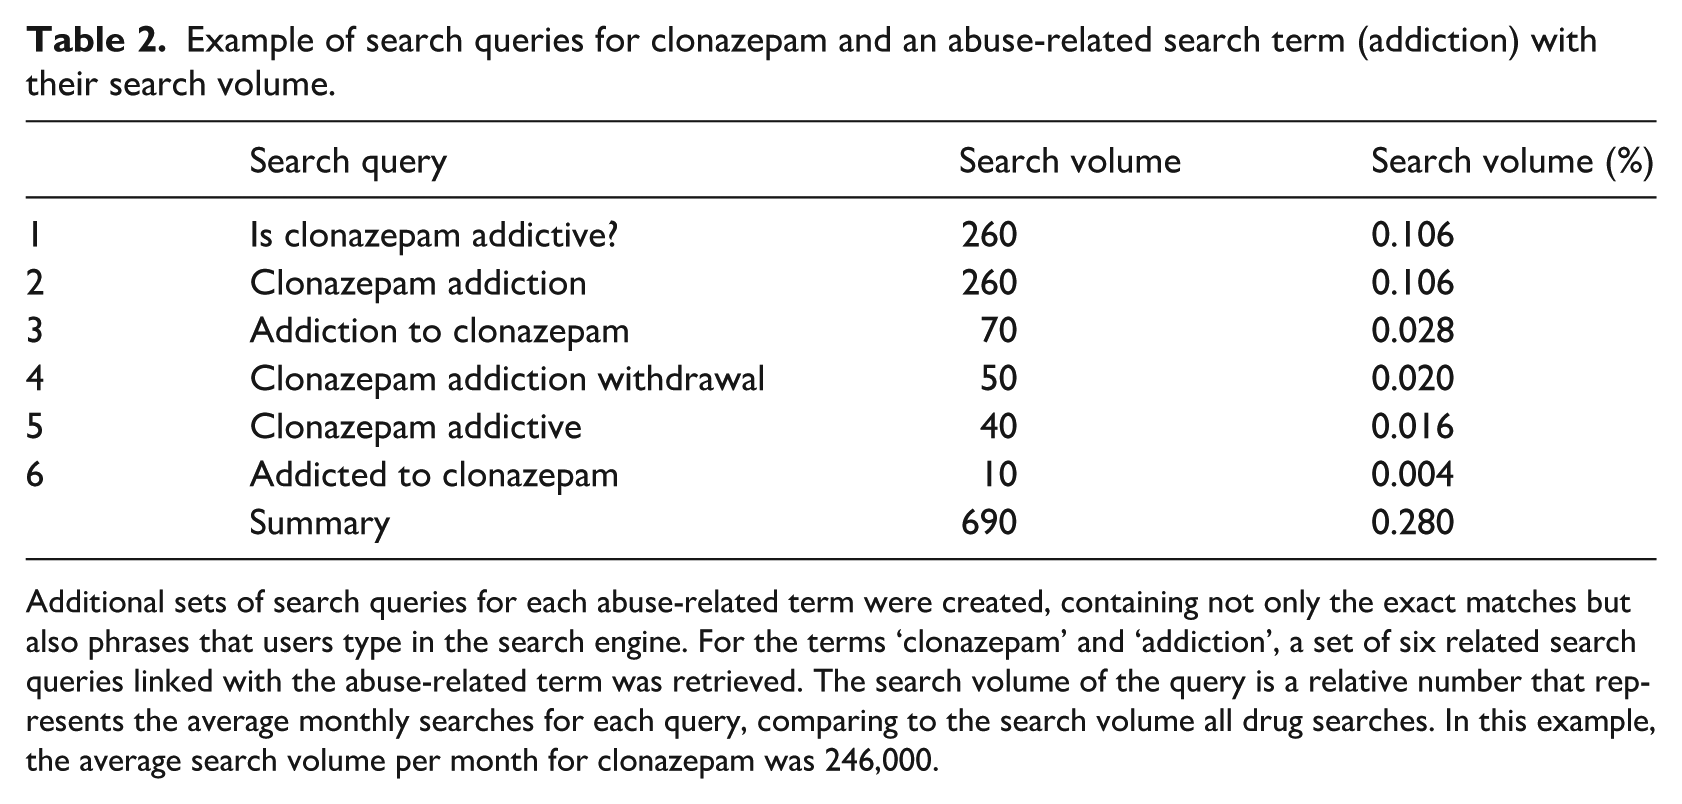
Additional sets of search queries for each abuse-related term were created, containing not only the exact matches but also phrases that users type in the search engine. For the terms ‘clonazepam’ and ‘addiction’, a set of six related search queries linked with the abuse-related term was retrieved. The search volume of the query is a relative number that represents the average monthly searches for each query, comparing to the search volume all drug searches. In this example, the average search volume per month for clonazepam was 246,000.
The frequentist method, ROR, was used to calculate signals in the FAERS database. ROR is a disproportionality measure that estimates the frequency of a selected adverse event in association with the tested drug in comparison with all other drugs in the database. A higher ROR result signifies a more frequent reporting of the selected combination of the event and drug in question and indicates stronger signals. Based on previous studies, safety signals were detected when the number of drug–event reports was greater than three and the lower boundary of the ROR was greater than one.16,21 RORs and 95 per cent confidence intervals (CIs) were calculated in OpenVigil2.1-MedDRA, which was validated by performing the above statistics. 13
Correlation between FAERS and search analytics domains
Search analytics (FAERS and Google Analytics) were computed for the three drugs considered in this research. Our purpose was to investigate whether a significant cross-correlation could be found between time series. The most straightforward measure of similarity between time series of the same length

In equation (1),
Subsequently, a resampling approach (random permutation) was used in time series and surrogates of the time series were produced (M = 1000). Following this approach, we formed the null hypothesis that we sought to test [H0: ρ(X, Y) = 0] by calculating it in randomised pairs of time series that preserve the marginal distribution of the original time series but were, by construction, uncorrelated. More precisely, random permutation destroyed any time-matching between time series and, as such, they were uncorrelated. The level of statistical significance was set at 5 per cent.
Results
Google Analytics
Analysis for the cumulative period revealed that overall abuse-related terms had an average SPS of 56.0 for clonazepam, 24.4 for mirtazapine, and 11.4 for escitalopram. Again, larger values of SPS indicate more queries were made. Considering that Google receives more than 3.5 billion queries per day, 21 even low values of SPS suggest that millions of search queries were posed about a topic.
Similar patterns were also found in the search interest over time (Figure 1(a)). The descriptive analyses showed that the median values of search analytics over time were 65.50, IQR = [34.17, 76.08] for clonazepam; 20.67, IQR = [14.50, 38.25] for mirtazapine; and 8.67, IQR = [5.92, 17.83] for escitalopram. Based on the Kruskal–Wallis H test, it was found that search analytics between the three drugs were significantly different (χ2(2) = 100.558; p < 0.001). By performing a post hoc test, we concluded that the search analytics results for clonazepam were significantly higher than those of mirtazapine (U = 386.00; p < 0.001) and escitalopram (U = 53.00; p < 0.001), respectively. Similarly, those for mirtazapine were significantly greater than those of escitalopram (U = 540.50; p < 0.001).
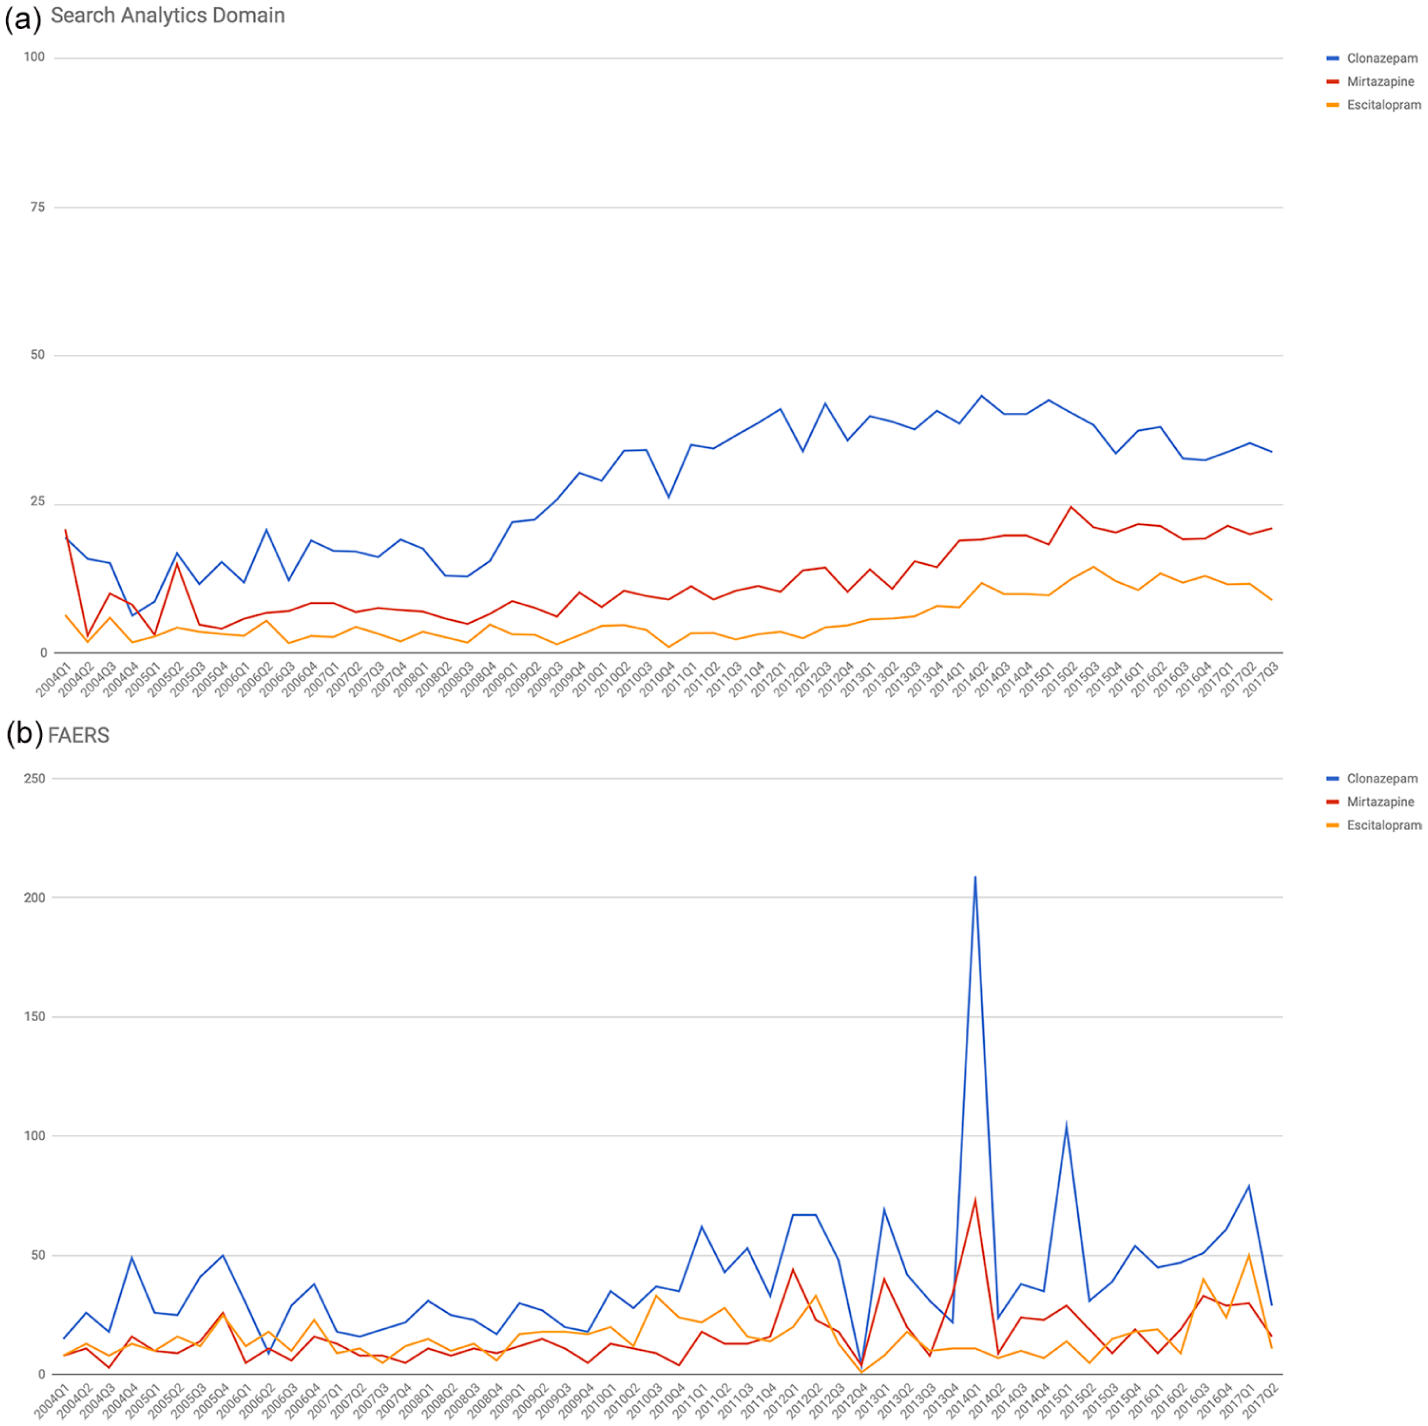
(a) Search interest over time for abuse-related terms in search analytics domain and (b) number of abuse-related events submitted in FAERS. In the search analytics domain, for the period 2004Q1–2017Q2, the search interest over time for overall abuse-related terms is represented in timelines for each drug and is expressed as quarterly relative search volume for overall abused-linked terms. During the same period, the quarterly number of drug-abuse-related events in FAERS for each drug is presented. The narrow scope of the SMQ ‘Drug abuse and dependence’ was used to identify abuse-related events.
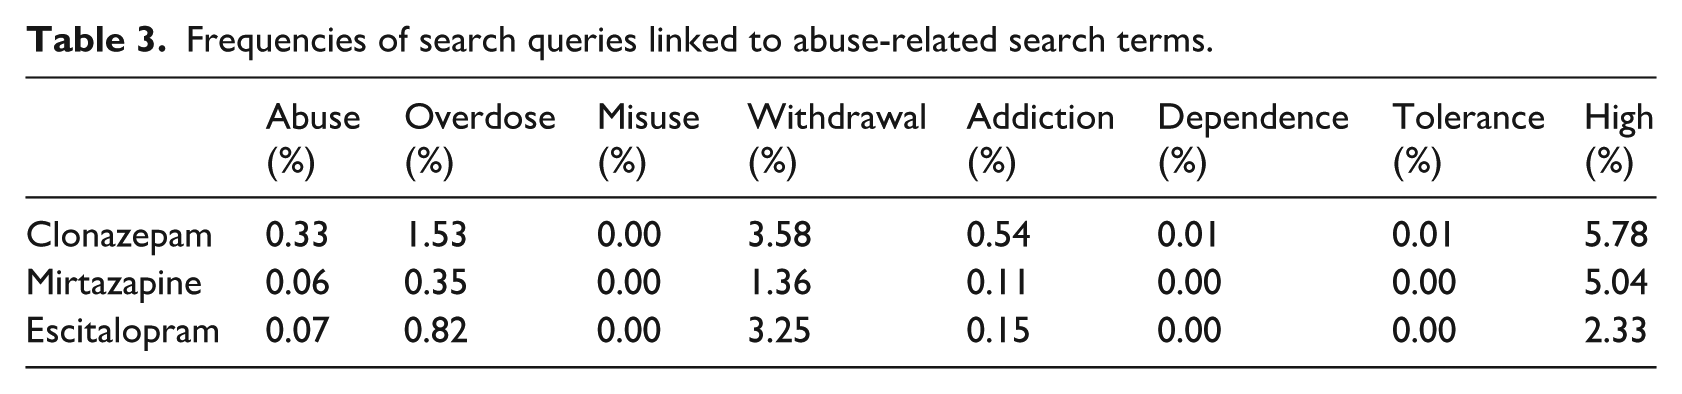
The frequencies of search queries linked to abuse-related terms are displayed in Figure 2 and Table 3. Queries linked to ‘high’ seem to be those that were most commonly posed for each drug, along with those related to ‘overdose’ and ‘withdrawal’. The frequency of search queries linked to ‘high’ was 5.78 per cent for clonazepam, 5.04 per cent for mirtazapine, and 2.33 per cent for escitalopram. Similar patterns appeared to be followed by the other search queries. Queries containing the terms ‘misuse’, ‘dependence’, and ‘tolerance’ were not as frequently used.
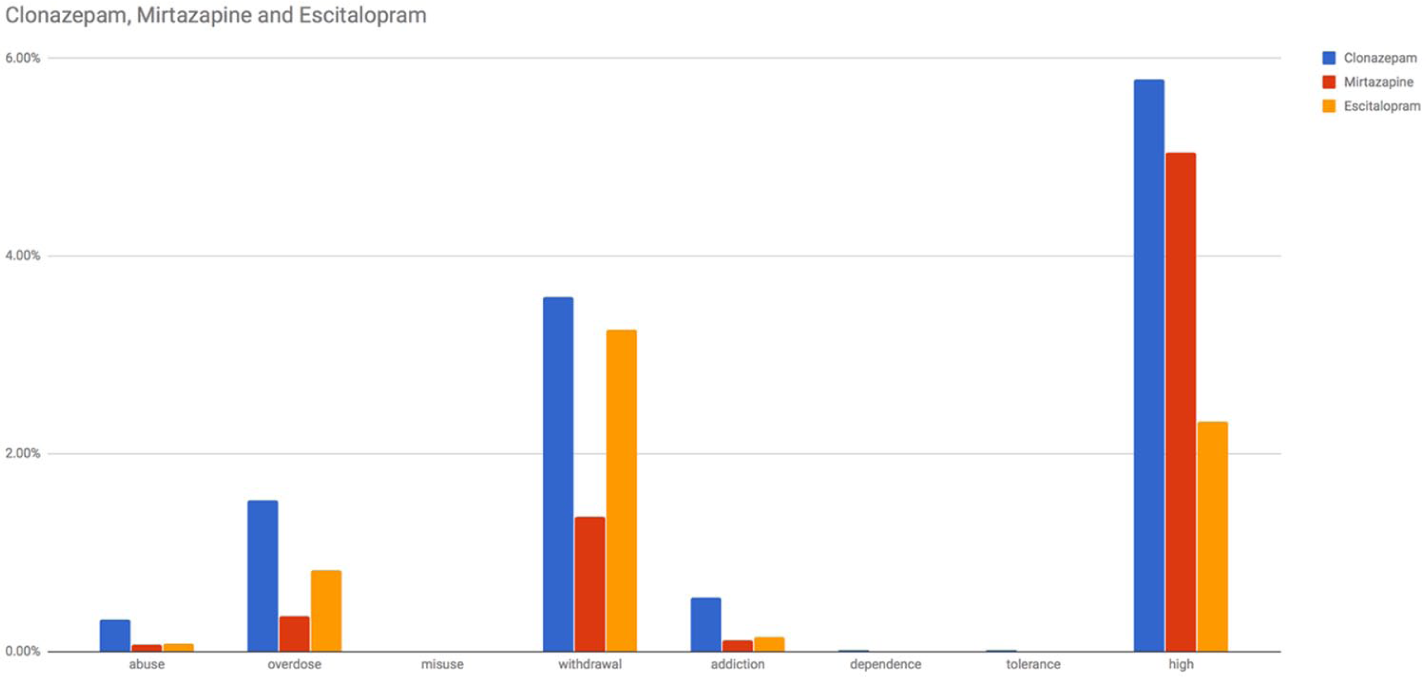
Frequencies of search queries linked to abuse-related search terms in the search analytics domain (average monthly searches from 2004Q1 to 2017Q2).
Frequencies of search queries linked to abuse-related search terms.
FAERS disproportionality analysis
After data cleaning including duplicate deletion, the study population consisted of 4,704,663 reports. Of these, 15,652 involved mirtazapine, 36,026 involved clonazepam, and 26,473 involved escitalopram. The percentage of co-occurring drug abuse/dependence with mirtazapine (5.62%) was comparable to that associated with clonazepam (5.95%) but greater than that associated with escitalopram (3.18%) (Table 4). Safety signals for events related to drug abuse could be detected for mirtazapine and both control drugs, though they differed in magnitude from one another. Drug abuse/dependence, withdrawal, and tolerance seem to be associated more with clonazepam and mirtazapine and to a lesser degree with escitalopram, respectively. A stronger signal for overdose was generated by mirtazapine, in contrast to clonazepam and escitalopram, while euphoria-related terms appeared to be associated more with clonazepam and escitalopram and to a lesser degree with mirtazapine (Table 4).
Number of reports and ROR (95% CI) related to drug-abuse per drug.
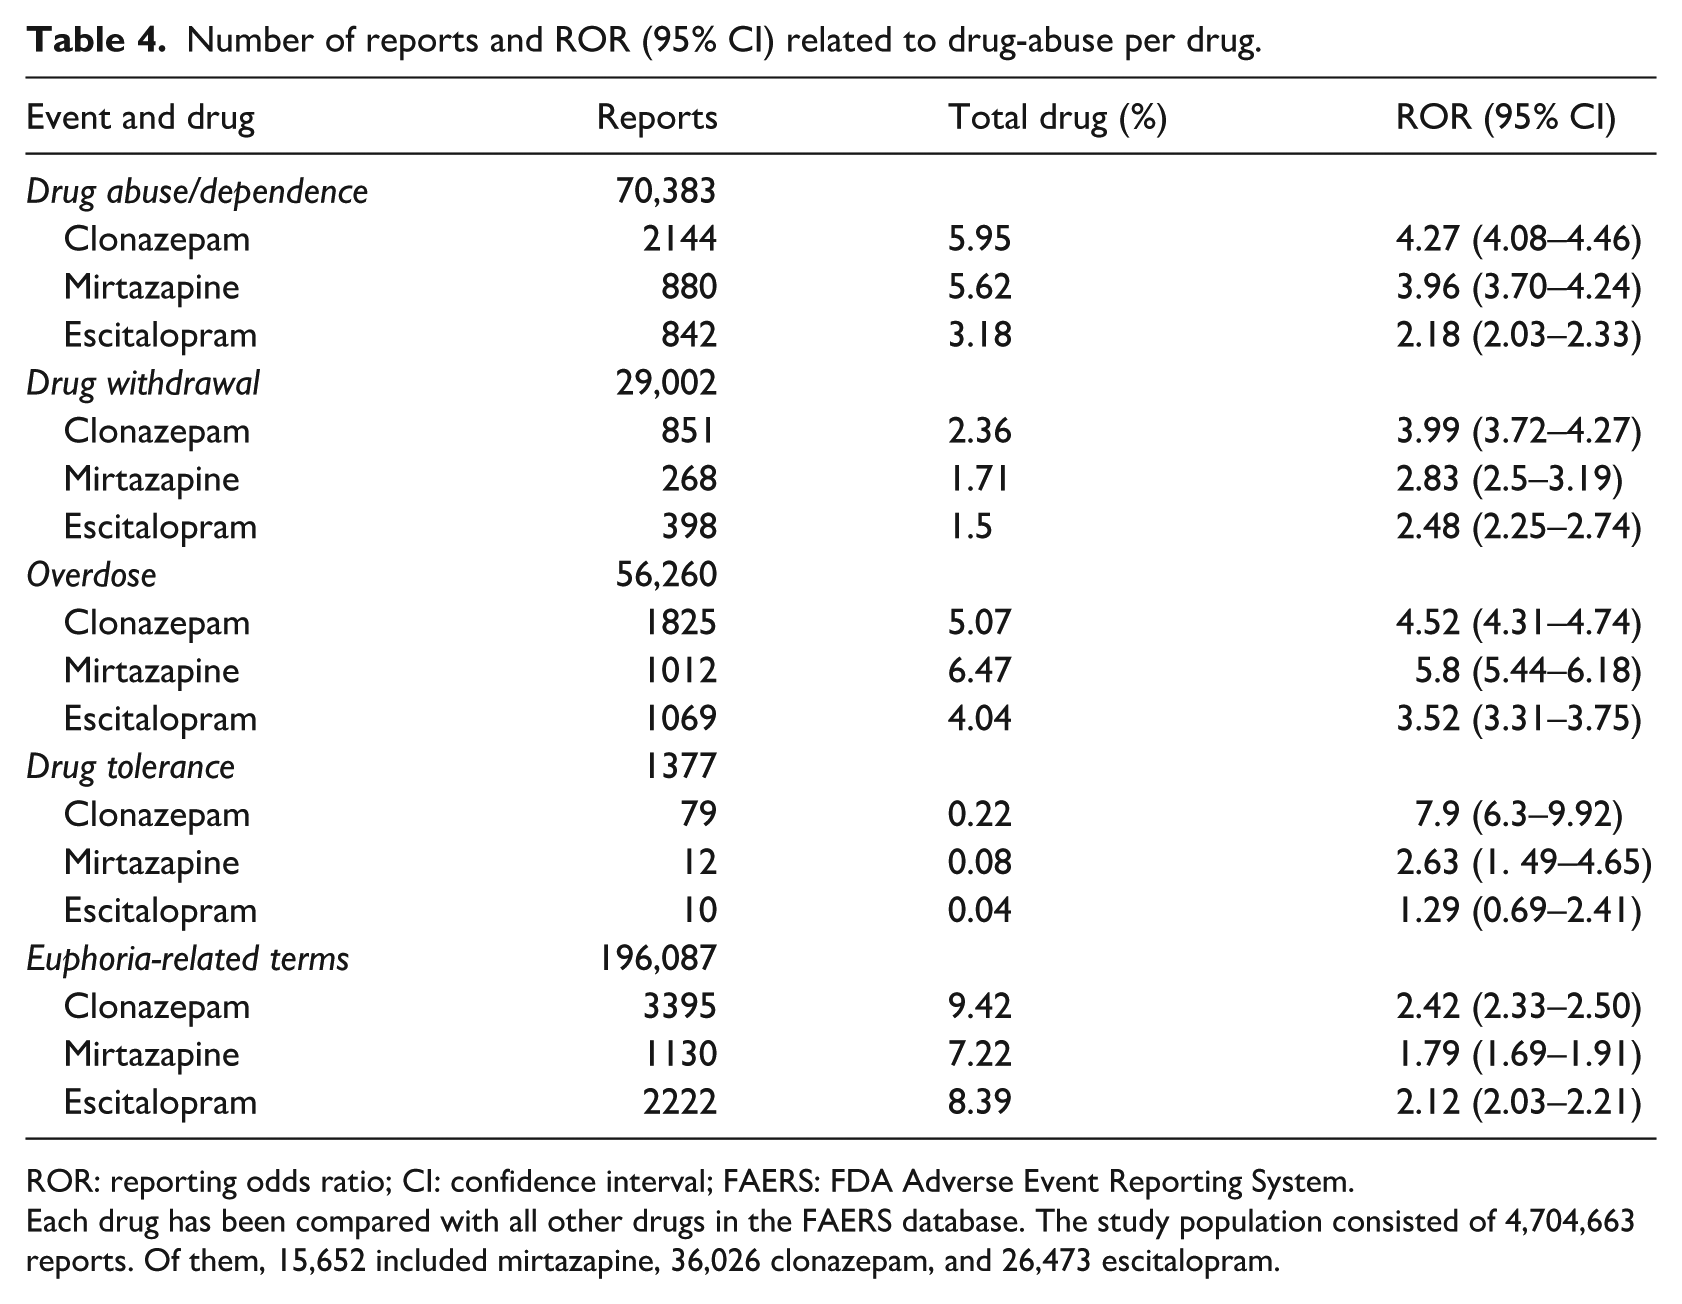
ROR: reporting odds ratio; CI: confidence interval; FAERS: FDA Adverse Event Reporting System.
Each drug has been compared with all other drugs in the FAERS database. The study population consisted of 4,704,663 reports. Of them, 15,652 included mirtazapine, 36,026 clonazepam, and 26,473 escitalopram.
Correlation between FAERS and search analytics domains
The cross-correlation of time series (Figure 1(a) and (b)) was calculated for a lag value equal to 5 as presented in Figure 3. A lag refers to a difference in time between two observations. As displayed in Figure 3, the search analytics of clonazepam were found to be uncorrelated for each of the lags, while the search analytics of escitalopram were uncorrelated for each lag, as the cross-correlation of time series was between the approximate upper and lower confidence bounds. Moreover, search analytics for most of the lags were uncorrelated, whereas the opposite was true for the lags equal to −3 and −5. From Figure 3, we can additionally export the zero-lag cross-correlation of time series in each drug. Thus, the zero-lag cross-correlation of search analytics outcomes were 0.37, 0.38, and 0.05 for clonazepam, mirtazapine, and escitalopram, respectively. Our hypothesis regarding the resampling method used was confirmed, as the cross-correlation between the randomised pairs of time series was between the approximate lower and upper bounds of zero correlation, respectively (Figure 4). Based on the results of significance testing for cross-correlation, search statistics for clonazepam (p = 0.0007) and mirtazapine (p = 0.004) were found to be significantly correlated between the search analytics and FAERS domains, while the corresponding data for escitalopram did not show such results (p = 0.34) (Figure 5).
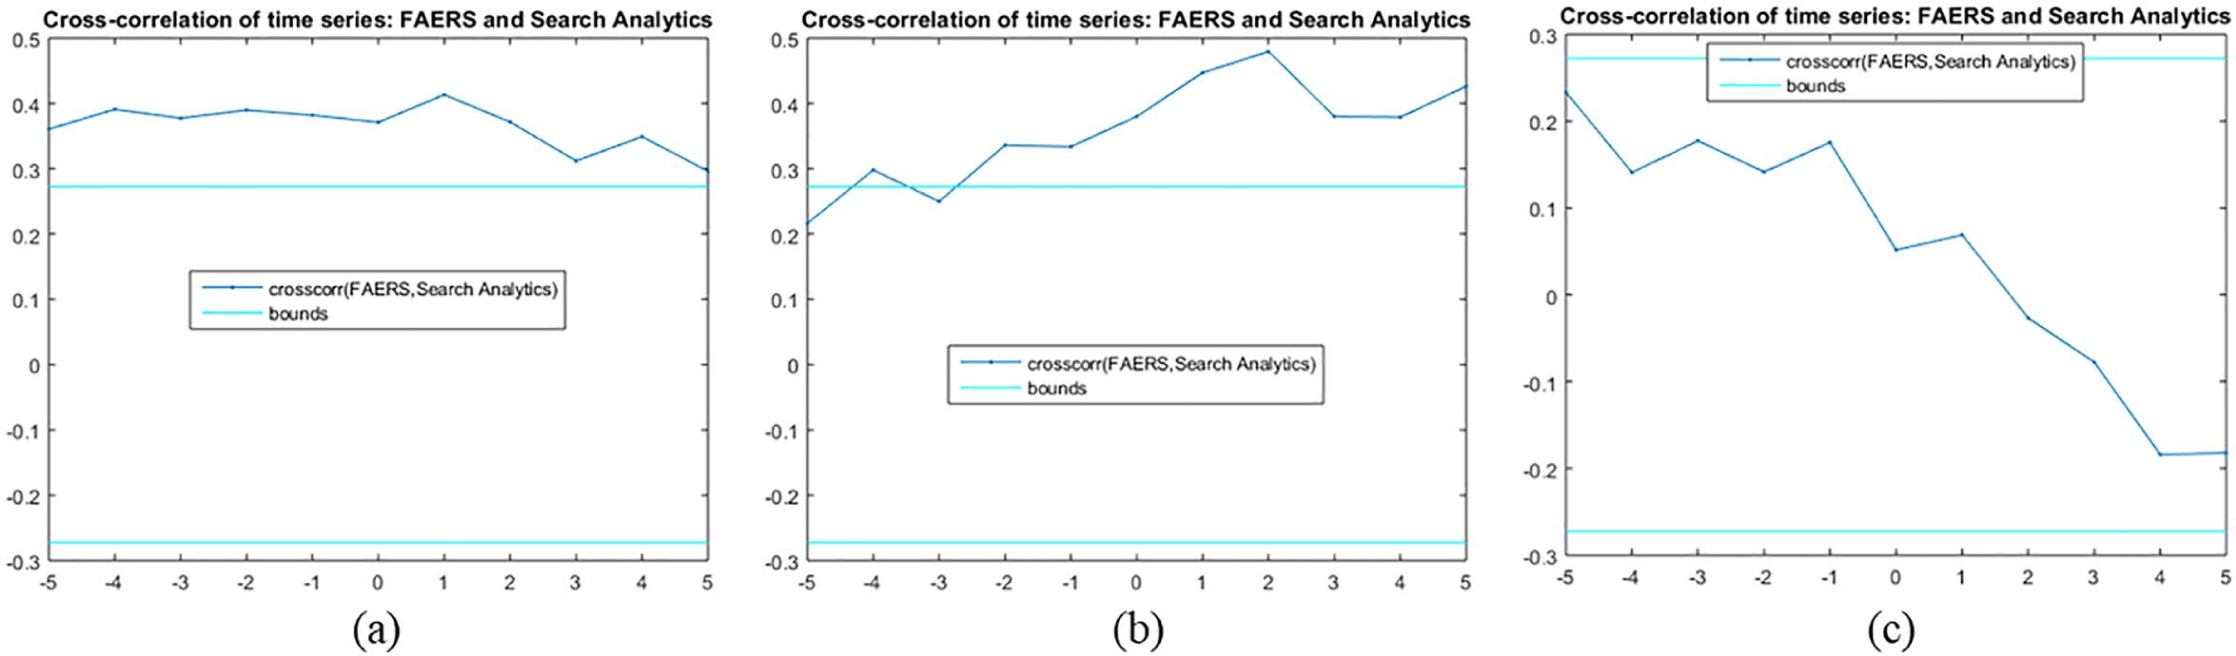
Cross-correlation of time series for (a) clonazepam, (b) mirtazapine, and (c) escitalopram, respectively. The two lines (cyan colour) indicate the approximate upper and lower confidence bounds assuming the input series are completely uncorrelated.
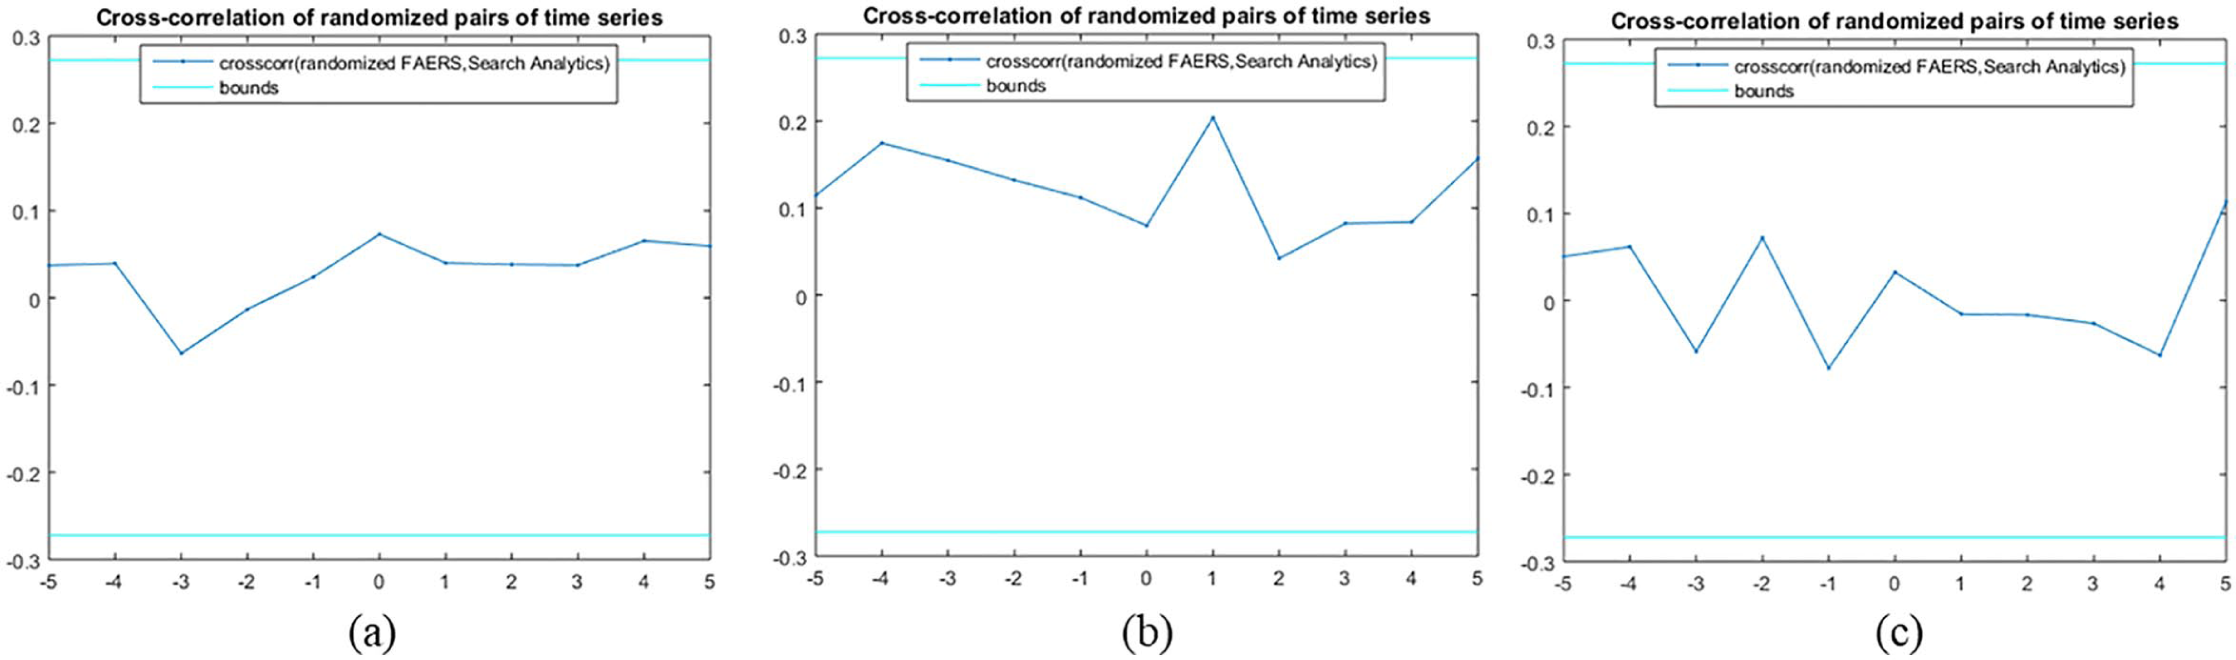
Cross-correlation of randomised pairs of time series for (a) clonazepam, (b) mirtazapine, and (c) escitalopram, respectively. Element vectors that are displayed as cyan lines are the approximate upper and lower confidence bounds of zero correlation.
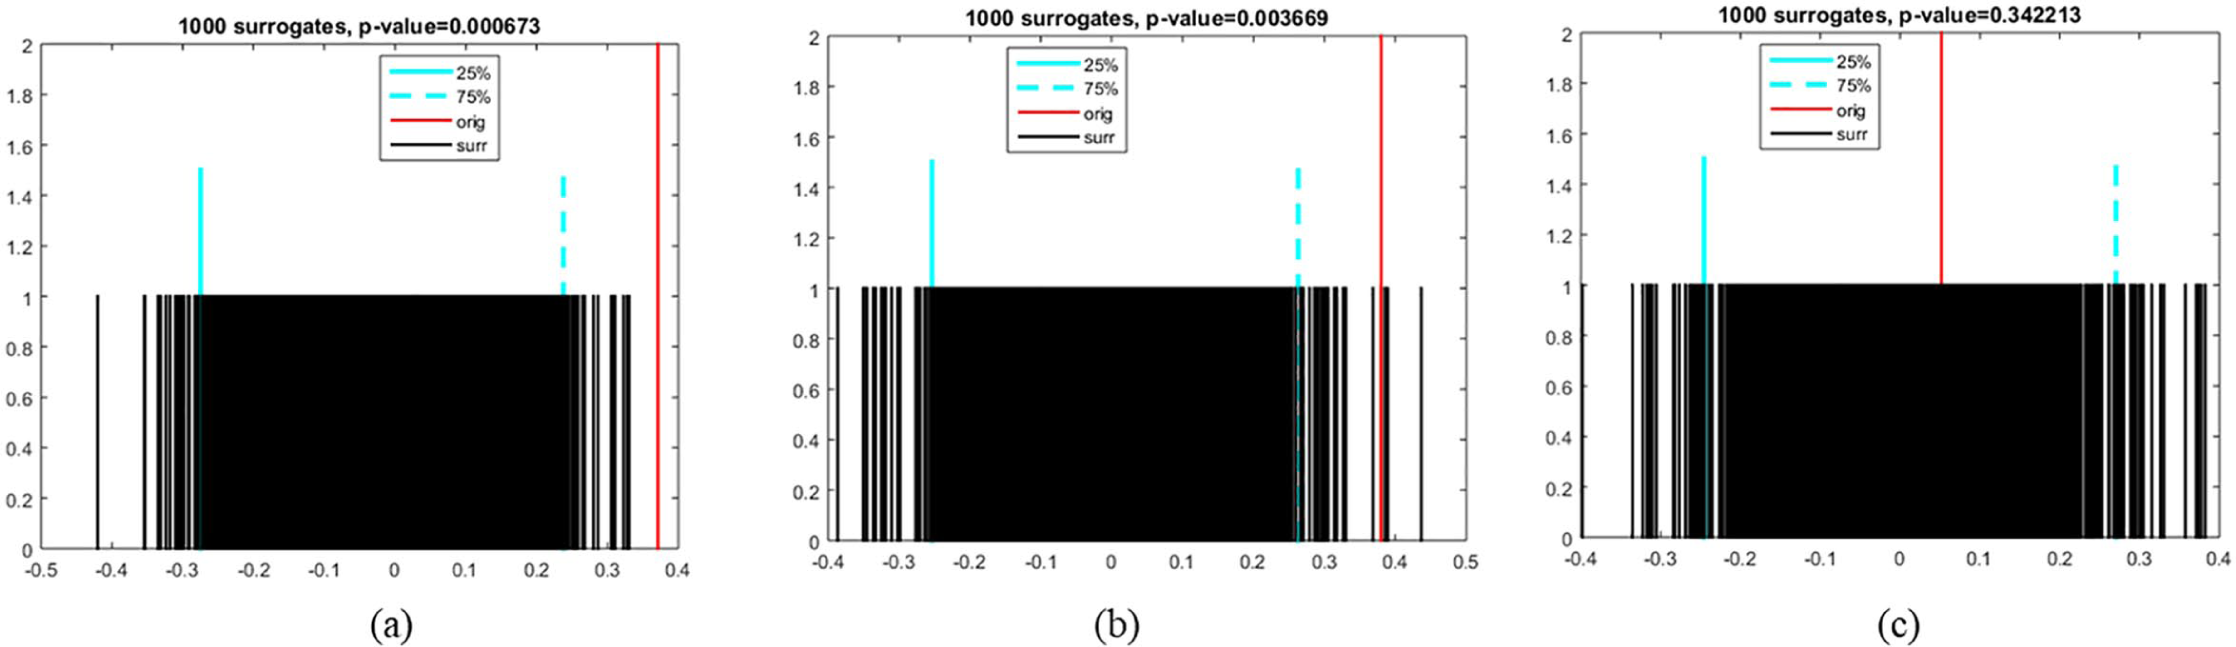
Results of randomisation significance test for cross-correlation of search analytics in (a) clonazepam, (b) mirtazapine, and (c) escitalopram, respectively.
Discussion
To our knowledge, this is the first study to investigate the abuse potential of mirtazapine using two different pharmacovigilance methods: disproportionality analysis in the FAERS and Google Analytics. A positive control (benzodiazepine clonazepam with a well-known abuse profile) and a negative control (SSRI escitalopram with a previously unreported abuse potential) were used for comparison purposes.
Due to their volume, velocity, and variety, Google Analytics data are considered to be big data and, while the recognition of the potential of big data analytics is rising, 24 its use in pharmacovigilance is still emerging. A recently published study of the French Addictovigilance Network combined Google Trends with the analysis of the global database of individual case safety reports (VigiBase). 25 In our study, Google’s big data analysis revealed that a significant number of US residents searched for terms related to the abuse liability of mirtazapine. In the time frame of our study, these are hundreds of million queries being posed worldwide, providing a potential signal of drug abuse. The identified signal of mirtazapine abuse was in agreement with the signals for the positive and negative control drugs (i.e. clonazepam and escitalopram, respectively). The generic pattern was signal indicator (clonazepam) ⩾ signal indicator (mirtazapine) ⩾ signal indicator (escitalopram), where ‘indicator’ refers to the SPS, search interest over time, and search frequency of abuse-related terms. A further finding of our study was that an analysis over time revealed the same patterns regarding the search interest, suggesting that this behaviour is not a temporary one; rather, it seems to have been consistent over the past 13 years.
Importantly, the signal patterns in the search analytics domain were similar to those found in the FAERS database domain, in which signals of drug abuse-related events have been detected for clonazepam, mirtazapine, and, surprisingly, escitalopram. Mirtazapine’s signals were in between clonazepam’s and escitalopram’s, except for in the context of ‘overdose’ and ‘euphoria’. However, this exception seems not to be critical since both an ALERTT Working Group (ACTTION) systematic review 19 and the FDA 20 have suggested that euphoria- and overdose-related terms are nonspecific and should not be interpreted alone in the assessment of abuse potential. Escitalopram showed the lowest abuse-related reporting rates in comparison with the other two drugs, both in the search analytics domain and the FAERS database; however, the rates were indicative of a signal of abuse. To confirm escitalopram’s signal of drug abuse-related events, further clinical assessment of the initially submitted reports is needed. In addition, factors typically not included in a disproportionality analysis such as concomitant medications, co-suspected drugs, and comorbidity should be evaluated for standardised case causality assessment.
To date, limited evidence supports the understanding of the abuse properties of mirtazapine. 3 Opioid users on antidepressant treatment seem to be aware of the possible use of mirtazapine for achieving intoxicating effects. 7 According to this, patients being for methamphetamine withdrawal using mirtazapine reported significantly greater (yet still limited) feelings of a ‘high’ or ‘rush’ in comparison with modafinil-treated patients. 8 In addition, a recent toxicological screening of urine samples from patients with suspected illicit drug ingestion showed that almost half of the patients used multiple drugs, with mirtazapine detected in 11.25 per cent of them. 9 Mirtazapine seems to increase the dopaminergic efflux selectively in the cortex rather than in the nucleus accumbens, 26 differentiating it from common drugs of abuse. 27 Pregabalin and gabapentin may also fail to increase the dopaminergic efflux in this region, yet the evidence of their abuse potential is growing. 28 Mirtazapine has a unique pharmacodynamic profile, with H1, 5-HT2A, 5-HT2C, 5-HT3, and alpha2 adrenergic antagonistic effects; lower affinities to muscarinic, alpha1, and dopaminergic receptors; and negligible effects on monoamine reuptake. 5 Adrenergic alpha2, H1, and muscarinic receptor antagonism could promote abuse-related behaviours.29,30 Despite mirtazapine’s low affinity to muscarinic receptors, muscarinic receptor antagonism could be achieved by high doses of mirtazapine, which could contribute to the suggested abuse properties.
Finally, there was a positive correlation between search interest in Google and incidents reported to the FAERS database, which presented a monotonic correlation for mirtazapine and clonazepam but not for escitalopram. At its core, a statistically significant correlation quantifies the relationship between two data domains. When one of the data values changes in one domain, the other is highly likely to change as well in response in the other domain. Thus, changes in abuse-related searches on Google for mirtazapine or clonazepam are expected to be accompanied by analogous changes of abuse-related events in FAERS. This outcome does not indicate causality but, rather, a similarity in the behaviours of two data domains. Interestingly, in opposition to clonazepam and mirtazapine, no significant correlation between the two domains was noticed for escitalopram. Concerns about the abuse liability of SSRI antidepressants might explain the significant number of Internet searches performed by users and, thus, the existence of a Google signal that is not reflected in a spontaneous report to the FDA given that SSRIs are rarely misused and seem to have a low abuse liability. On the contrary, abuse-related searches for mirtazapine or clonazepam might conceal a motivation to abuse, since searches and abuse-related events are correlated.
This study has some methodological considerations and limitations that should be highlighted. First, while disproportionality analysis may be a suitable tool to quantitate signals of abuse of known and novel psychoactive substances,14,31 it has a limited capacity to differentiate the type of abuse, for example, recreational use or pharmaceutical neuroenhancement. 18 In addition, confounding factors such as comorbidity and concomitant drugs cannot be assessed properly. Finally, the causal relationship between drugs and the adverse event (abuse) cannot be verified without a clinical causality assessment. 32 Regarding search analytics, Google only reports large datasets. In our study, terms like dependence, tolerance, and misuse did not provide substantial numbers for the analysis of the search frequency in contrast to other terms such as high or overdose. For this reason, the evaluation of the correlation between the two domains was conducted with overall abuse-related terms in Google Analytics but only using the more precise narrow scope of the SMQ ‘drug abuse and dependence’ category in FAERS. In addition, the algorithms and their updates utilised by Google to analyse data are not publicly available. 33 Finally, data before 2004 were excluded since both Google and OpenVigil2.1-MedDRA operate on data from 2004.
Conclusion
In summary, our results achieved using two different methods strengthen the evidence towards a potential signal of mirtazapine abuse, confirming the findings from post-marketing reports. Further signal validation requires clinical assessment in order to confirm causality and is a step in the signal management process performed by the regulatory authorities. However, based on the positive correlation found between search analytics and incidents reported to the FAERS in this study and in line with other recent studies that combined web sources with more conventional pharmacovigilance data, 25 we suggest that similar methods could be invoked as supplementary pharmacovigilance tools to detect drug safety signals.
Footnotes
Declaration of conflicting interests
The author(s) declared no potential conflicts of interest with respect to the research, authorship, and/or publication of this article.
Funding
The author(s) received no financial support for the research, authorship, and/or publication of this article.