
Abstract
This article retrospectively analyses a primary percutaneous coronary intervention dataset comprising patient referrals that were accepted for percutaneous coronary intervention and those who were turned down between January 2015 and December 2018 at Altnagelvin Hospital (United Kingdom). Time series analysis of these referrals was undertaken for analysing the referral rates per year, month, day and per hour. The overall referrals have 70 per cent (n = 1466, p < 0.001) males. Of total referrals, 65 per cent (p < 0.001) of referrals were ‘out of hours’. Seasonality decomposition shows a peak in referrals on average every 3 months (standard deviation = 0.83). No significant correlation (R = 0.03, p = 0.86; R = −0.11, p = 0.62) was found between the referral numbers and turndown rate. Being female increased the probability of being out of hour in all the groups. The 30-day mortality was higher in the turndown group. The time series of all the referrals depict variation over the months or days which is not the same each year. The average age of the patients in the turndown group is higher. The number of referrals does not impact on the turndown rate and clinical decision making. Most patients are being referred out of hours, especially females. This analysis leads to the emphasis on the importance of working 24/7 CathLab service.
Keywords
Introduction
Whenever a patient calls the emergency services complaining of any kind of chest pain, paramedics or other healthcare professionals record and interpret the patient’s 12-lead electrocardiogram (ECG) using the ST-segment elevation myocardial infarction (STEMI) criteria. On referral for primary percutaneous coronary intervention (PPCI), the activator (specialist nurse) will further adjudicate whether to refer the case on to a cardiologist who then interprets the patient’s case including the 12-lead ECG, demographics and other symptoms such as chest pain to make a decision on whether to accept or turndown the patient for referral to the CathLab.
When a patient is diagnosed with an acute STEMI, they are referred to CathLab via a PPCI service for coronary reperfusion. Understanding clinical workflows, pathways and patient referrals to a PPCI service could be useful for identifying sub-optimal clinical decision making and result in new improved protocols and procedures. Unfortunately, there is a lack of data analytics and data mining research to elicit insight into patient pathways and PPCI referrals, which is the aim of this article. Acute MI or a STEMI is caused by atherosclerotic plaque, and treatment via reperfusion therapy (PPCI/angioplasty/stenting) for these patients is time critical.1–3 The time (in minutes) from the patient entering the hospital to the time when a balloon-tipped catheter is used to reopen the blocked artery is referred to as ‘door-to-balloon time’. Recommended door-to-balloon time was previously ⩽90 min which has now decreased to ⩽60 min.4–6 Scholz et al. 7 investigated the consequence of contact-to-balloon time on mortality in STEMI patients with and without hemodynamic instability. One research study was conducted to analyse mortality in relation to sex and race alone, resulting in no statistically significant findings. 8 Sederholm Lawesson et al. 9 presented the gender dependency on the symptoms in STEMI patients. They found that chest pain was less prevalent in women compared to men; furthermore, other symptoms such as shoulder, throat and back pain are as twice as common in men. Another study 10 investigated the effectiveness of in-hospital and long-term outcomes for STEMI patients treated by PPCI within normal working hours compared with those treated out-of-hours (OOHs) and found similar effective treatment provision for all the patients regardless of the time of presentation. Another study evaluated the effect of implementing a dashboard for the STEMI patients to calculate the door-to-balloon time. They highlighted the importance of monitoring, evaluation and providing feedback on ischemic time delays in STEMI patients. It was concluded that use of this dashboard named H2H (home to hospital) improved the overall performance and process and approximately 90 per cent of the patients achieved the recommended door-to-balloon time of 60 min. 11 Sillesen et al. 12 suggest that transmission of prehospital ECG and the correct identification of STEMI by paramedics can decrease door-to-balloon times. Many studies have also been completed to showcase the performance in ECG interpretation. Veronese et al. 13 conducted a survey for 135 physicians who interpreted 4603 ECGs showing an overall accuracy of 69.1 per cent. They also concluded that ECG interpretation for diagnosing a STEMI lacks the necessary sensitivity and specificity to be considered a reliable ‘stand-alone’ diagnostic test. Mencl et al. 14 conducted a survey of a similar nature where 420 paramedic staff interpreted 10 different types of ECGs. The study showed that only 39 per cent (185/472, 95% confidence interval (CI): 35%–44%) correctly identified all three STEMIs. The study 15 compares ECG diagnostic skill among cardiologists and of other internal medicine specialties (non-cardiology fellows). The conclusion suggested that skills in ECG interpretation were not adequate. However, comprehensive method to ECG education is necessary. In another similar study, heat maps were used to track the eye gaze for the interpretation of the ECG. 16 The authors recommend ECG annotators to adopt an initial first impression/pattern recognition approach followed by a conventional systematic protocol to ECG interpretation. This recommendation is based on observing misdiagnoses given due to first impression only. Another study concluded that physicians can have accuracy as low as 40 per cent in ECG interpretation. 17
The aforementioned literature shows that there have been many studies on different aspects and analysis of the PPCI pathway; however, there is a lack of time series analysis to unveil unique patterns with respect to the acceptance and turndown of patients referred to the CathLab. Nevertheless, Cox et al. 18 conducted a retrospective time series analysis of primary care trusts to assess the impact of three referral management centres (RMCs) and two internal peer-review approaches to referral management on hospital outpatient attendance rates. The study used linear regression and autocorrelation to determine the time series effects of attendance ratio/rate with introduction of referral management. The study concluded there was not any association between referral management and reduction in the outpatient attendance rate in any group. Another study conducted time series analysis 19 from 2004 to 2008 and explored the possible association between the occurrence of varicella infection and various climatic factors in Hong Kong. The study concluded that lower relative humidity in cool seasons is associated with higher number of paediatric varicella hospital admissions. As can be seen in this literature, such referral time series analysis can provide useful and actionable insights which can be beneficial for optimising healthcare services.
This article comprises the following research questions:
What time series patterns exist per hour, per day, per week, per month and per season for all PPCI referrals and for referrals that were turned down or accepted?
Are the time series patterns of PPCI referrals per hour, per day, per week, per month and per season consistent for each independent year?
Do turndown rates for PPCI change over a time series, that is, per hour, per day and per month?
Does 30-day mortality change over time series, that is, per hour, per day and per month?
What are the gender and age differences in the referral data for those turned down and for those who were accepted for PPCI?
Methods
This study involved analysis of an anonymized dataset collected at Altnagelvin Hospital (Northern Ireland, UK) which has a 24/7 PPCI service. The total study population consisted of 2096 patients including 882 patients that were accepted for a PPCI intervention (76% men, n = 673) and 1464 patients that were referred by turned down for a PPCI intervention (68% men, n = 996). Data were collected in the cardiac care unit (CCU) during January 2015 to December 2018 for STEMI patients. However, the accepted referrals dataset includes data from January 2015 to December 2018. For patients who were referred but then turned down for PPCI referral, data were collected from January 2015 to December 2017. For analysis, both groups were aggregated for the common years, that is, 2015–2017. This referral data were routinely recorded by a staff nurse using a paper-based form and then digitised using a spreadsheet. After the approval of an ethics application to undertake this analysis, the staff nurse removed all personal identifiable information such as names, date of birth, and patient identifiers.
Data analysis
All statistical analyses were performed using R-Studio and the R programming language. Time series visualisations were generated using ggplot2 (an R package for visual analytics). Data were interrogated for missing values and data completeness. Regarding the most important outcome measurements (i.e. time series data), there were no missing values. Frequencies and proportions were computed to summarise distributions in the patient referral dataset. Comparisons between the proportions in distinct groups were investigated for significance using Chi-square tests for categorical dichotomous variables. Student t-test or Mann–Whitney test were used for continuous variables depending upon whether the variables were normally distributed. Continuous variables were summarised using means ± standard deviation (SD) or medians (interquartile range (IQR)). Logistic multivariable regression analysis was performed on independent variables such as gender and age where the response variable was activation for one model and mortality for another model. Correlation was computed using Pearson product moment correlation coefficient. Other aspects we found interesting to investigate include the gender distribution of the referrals, in-hour and OOH ratio and finally 30-day mortality.
Ethical aspects
Permission for the study was obtained from the regional Ethical Review Board IRAS 251710, NHS (ORECNI) and complied with the Declaration of International Research Integrity Association. 12
Results
Time series analysis of all referrals
The turndown group also had similar results as of total referrals with the year 2016 having maximum turndown referrals with 38 per cent (548, p < 0.001) compared with 29 per cent in 2015 and 33 per cent in 2017. Similarly, the acceptance referral rate for the years available (2015, 2016, 2017 and 2018) was 23, 23, 26 and 28 per cent, respectively. December had the maximum acceptance rate of 11 per cent (p = 0.008). Figure 1 shows the detail of referral rates per month. It is evident that the first 2 months of a year have more turndown referrals as compared to accepted referrals benchmarked against the end of the year.
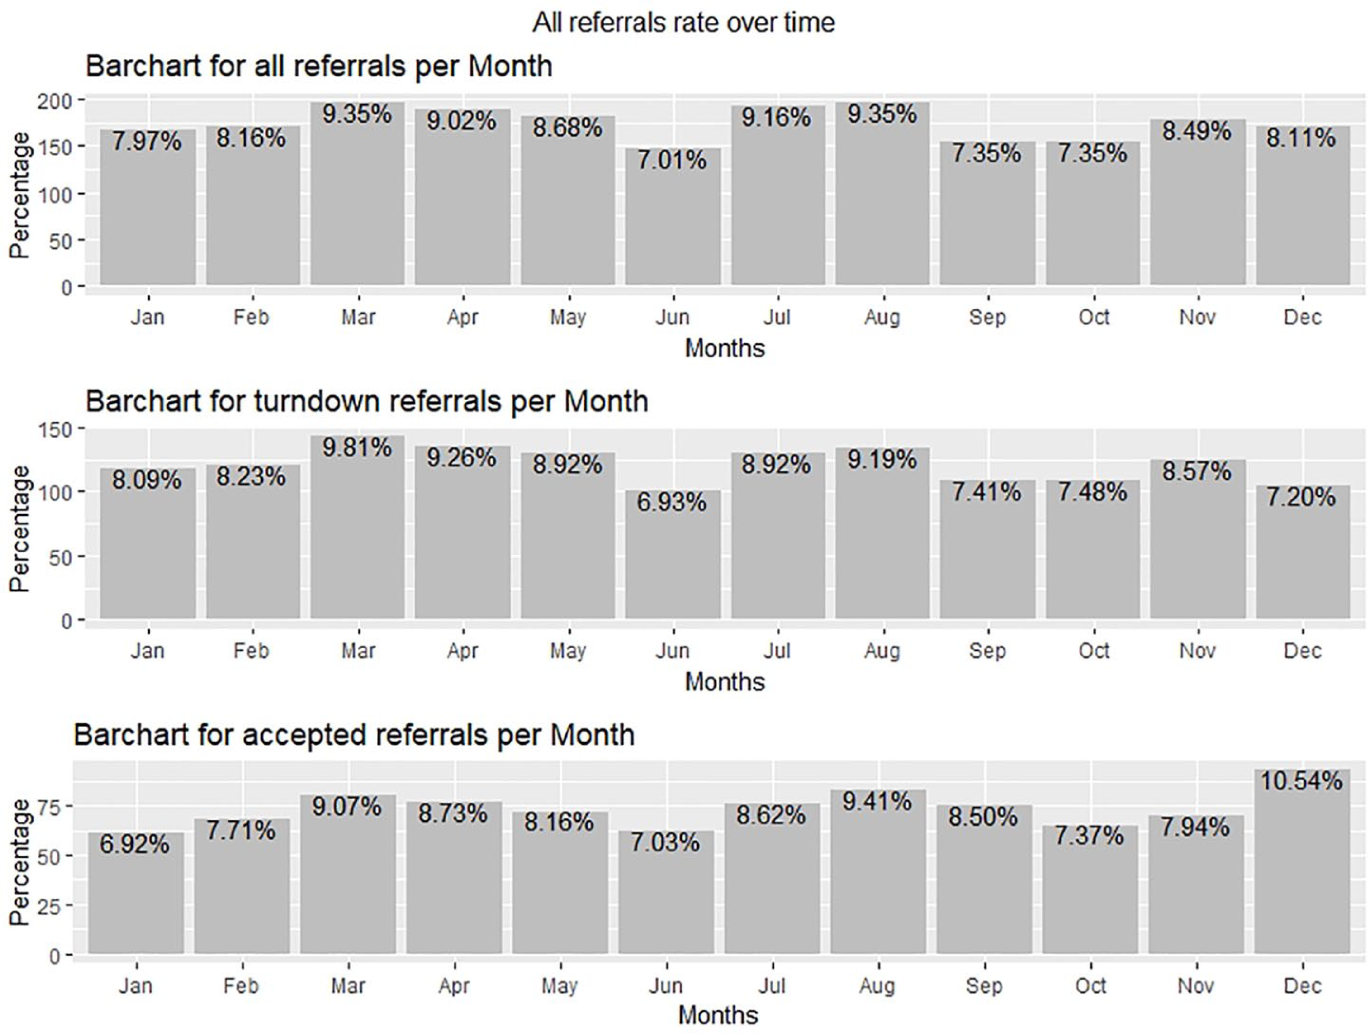
Showing referrals rate over time: (a) all referrals, (b) turndown referrals and (c) accepted referrals.
Figure 2 shows the seasonality, trend and autocorrelation of the total referral data. The seasonality of the data shows nine different peaks for all the 3 years. Average interval between each peak is calculated as 3 months (SD = 0.83). The autocorrelation shows a correlation every 4 months that depicts the relation of the referrals every 4 months.
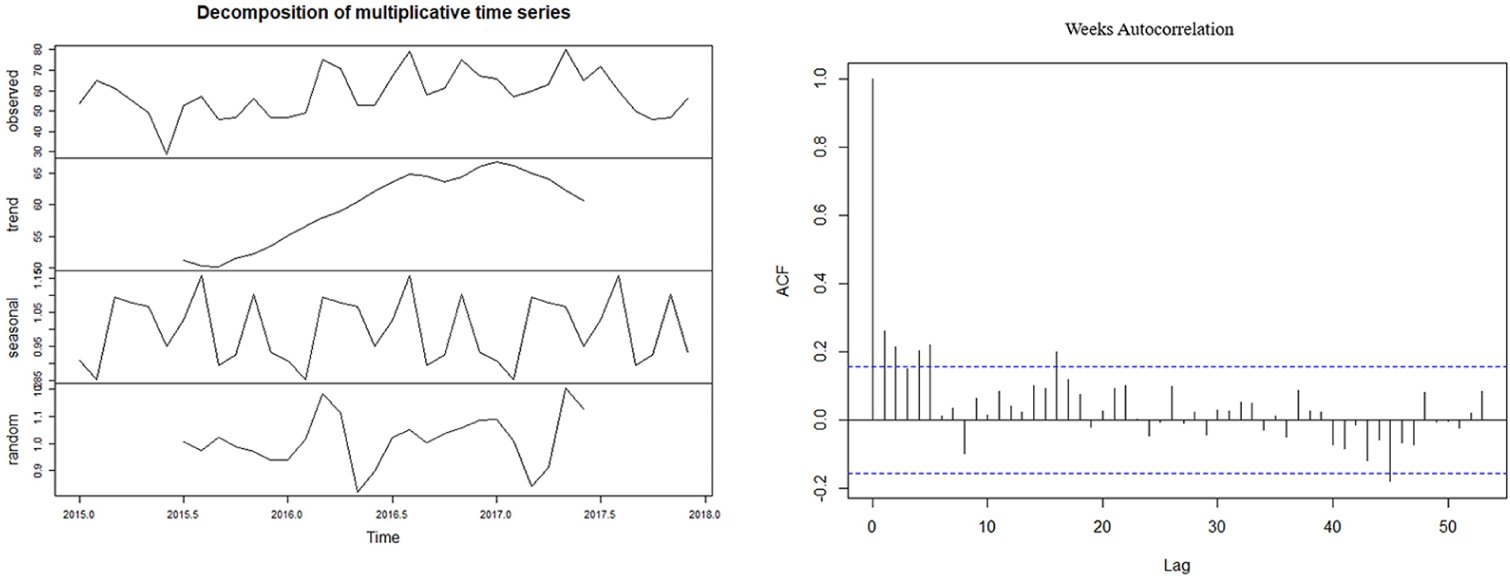
Showing time series decomposition and autocorrelation of all referrals.
Figure 3 depicts the overall time series analysis of total referrals over years. The bar chart shows the referral rate per season for each year. The overall increase each year per season is observable; however, among the four seasons, summer had a visible gradual increase over each year. Nevertheless, there is a lack of consistency in the distribution of referrals per year based on season. All years have multiple peaks over the months. However, there has been a significant decrease in referrals for the month of June (p = 0.007). Also, no correlation was found between the monthly referral rate of each year (p > 0.05). Therefore, seasons or the times of the year do not cause or correlate with people having heart attacks.
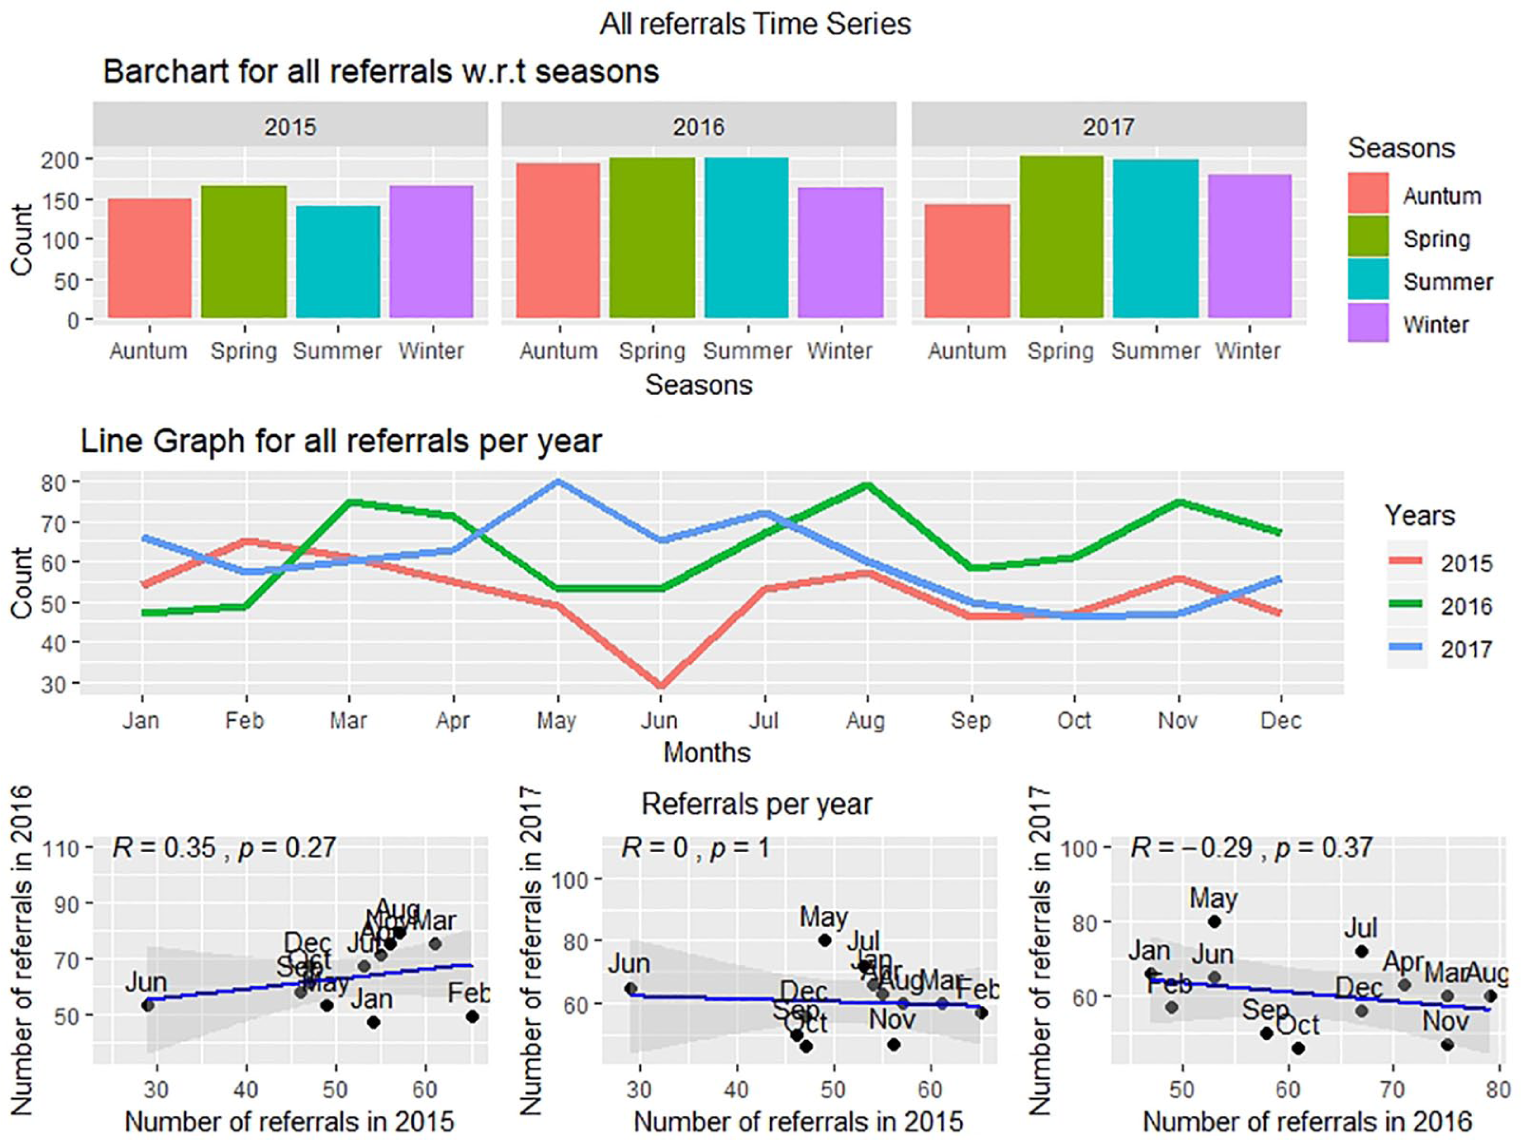
Time series of referral rates: (a) per season, (b) per month and (c) correlation between the number of referrals per month in 1 year with another year.
The weekly distribution of total referrals depicts multiple peaks. Figure 4(a) shows the referrals distribution as well as the scatter plot which shows a strong correlation between the referrals of the year 2015 and 2016. The hourly distribution of total referral rates is similar for each year. Figure 4(b) shows the referral rate distribution on an hourly basis as well as the scatter plot which shows a strong correlation (r ~ 0.7) between the hourly referral rates of year 2015, 2016 and 2017.
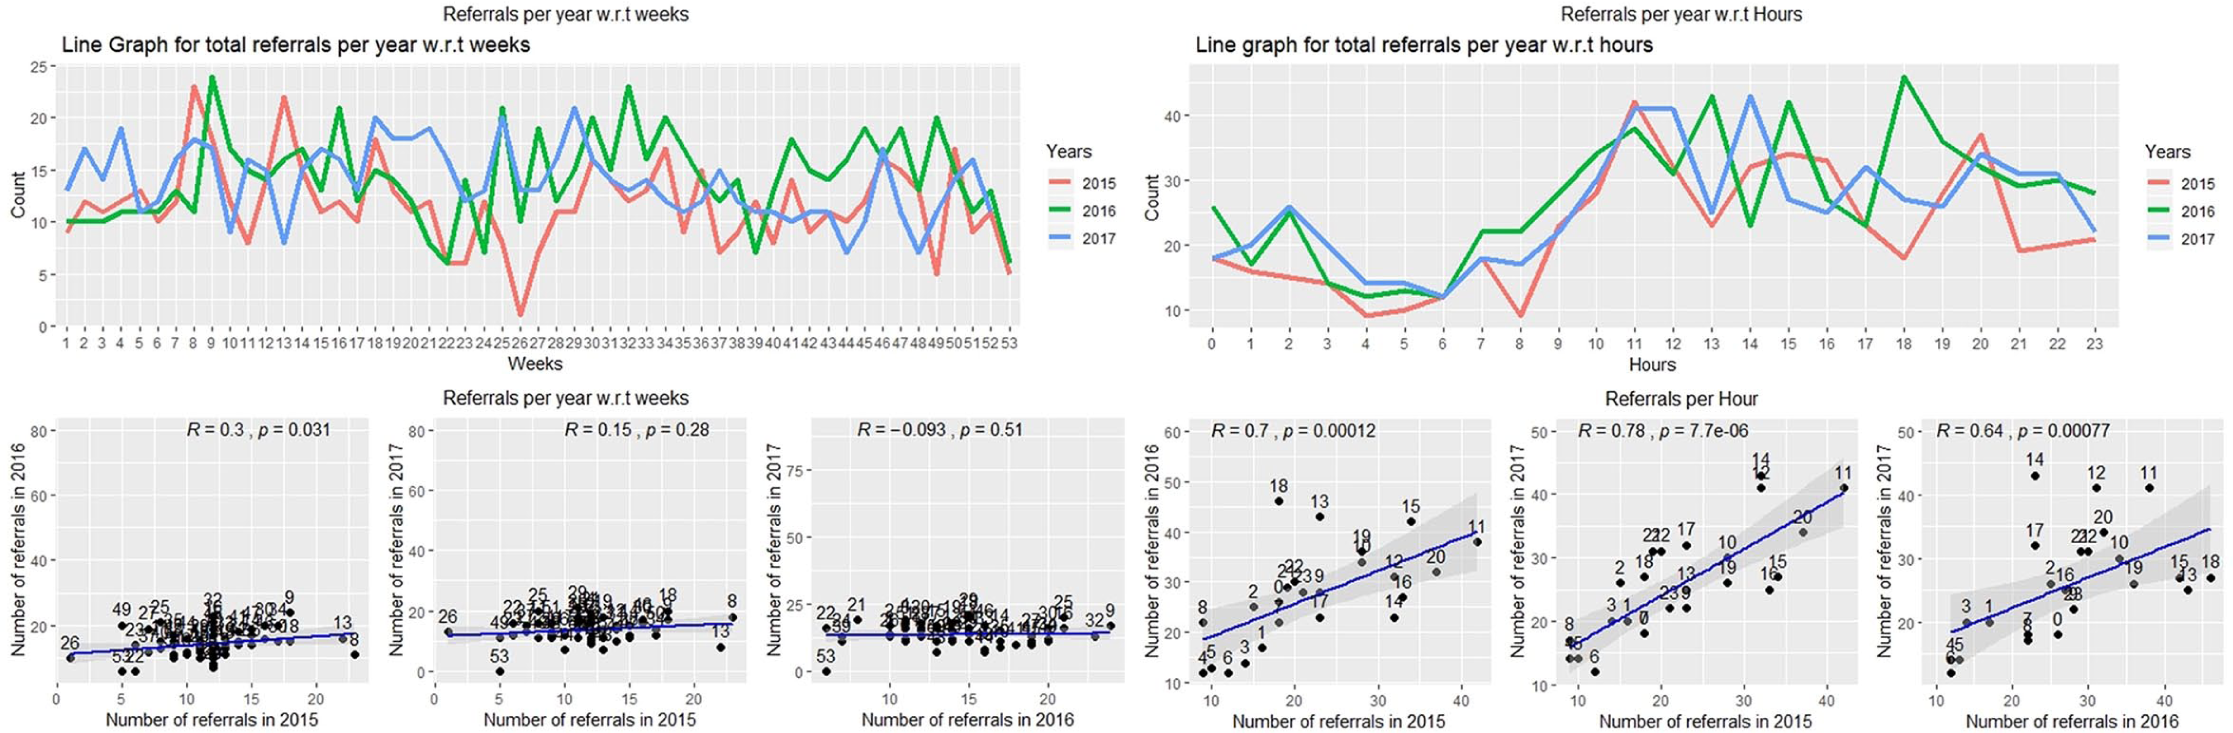
Scatter plots showing a correlation value between the number of referrals (a) per week and (b) per hour in 1 year with another year.
Turndown and accepted referral time series analysis and comparison
Turndown and accepted referrals time series analysis
Figure 5 shows the referral rates over each month, weekday and hour for each year for those patients who were turned down. Figure 5(a) provides a time series analysis for the turndown and accepted referral patterns per month for each year. No single month in all the years exhibit a significant turndown or accepted count. Collectively March, April and May had the maximum number of turndown referrals for all years (28%).
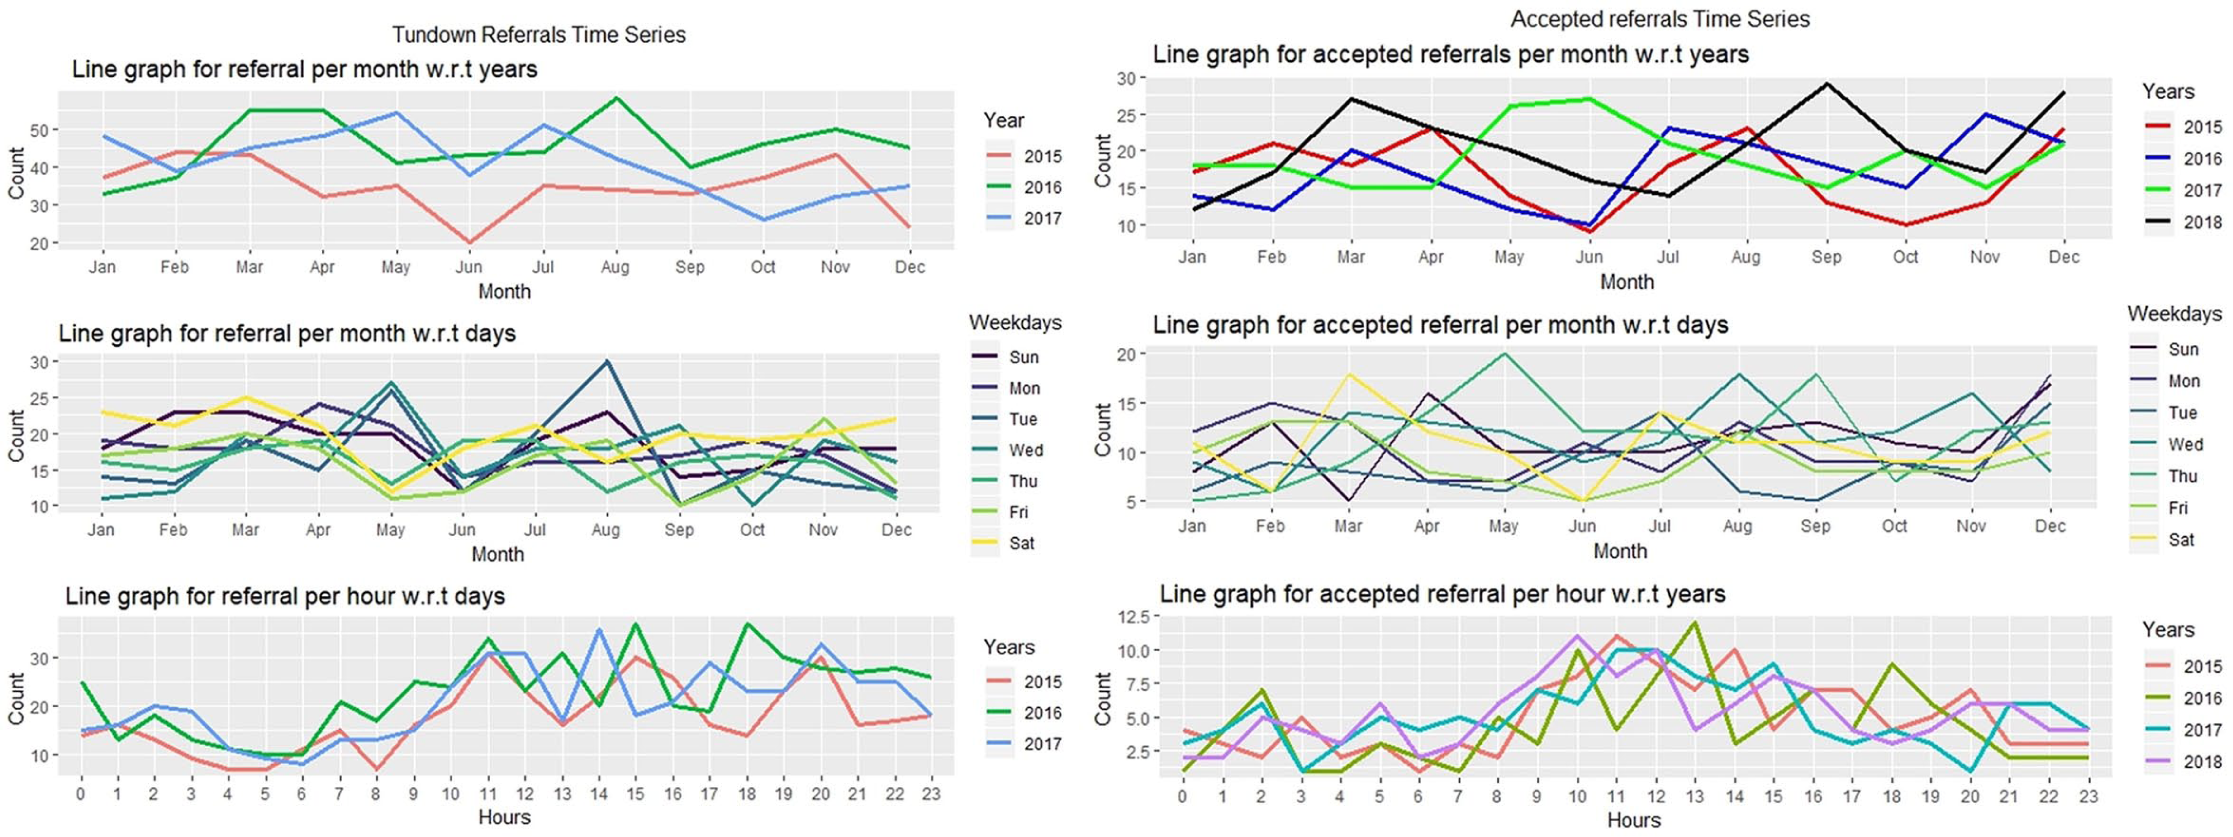
Turndown and accepted referrals time series analysis for (a) per month, (b) per week and (c) per hour.
Figure 5(b) and (c) shows the referrals pattern over weekdays and hours. In the turndown group, Tuesday had the highest variation with SD = 6.03 and Thursday was most consistent with SD = 2.74. In terms of hour, 11 a.m. has highest variance with SD = 3.66 and 4 a.m. (SD = 1.31) had highest consistency over the months. In the accepted group, Thursday was highest variant day with SD = 4.50 and Friday was the highest consistent with SD = 2.54 over the months. In terms of hours, 11 a.m. and 2 p.m. had maximum variation with SD = 2.01 and 6 a.m. is the most consistent with SD = 0.866 over the months.
Figure 6 shows the correlation between the total number of all referrals with referral turndown rate for each month over all 3 years. The analysis shows no statistical significance, which implies that an increase in referrals may not impact on decision making or a disproportionate increase in turndowns (see Figure 6).
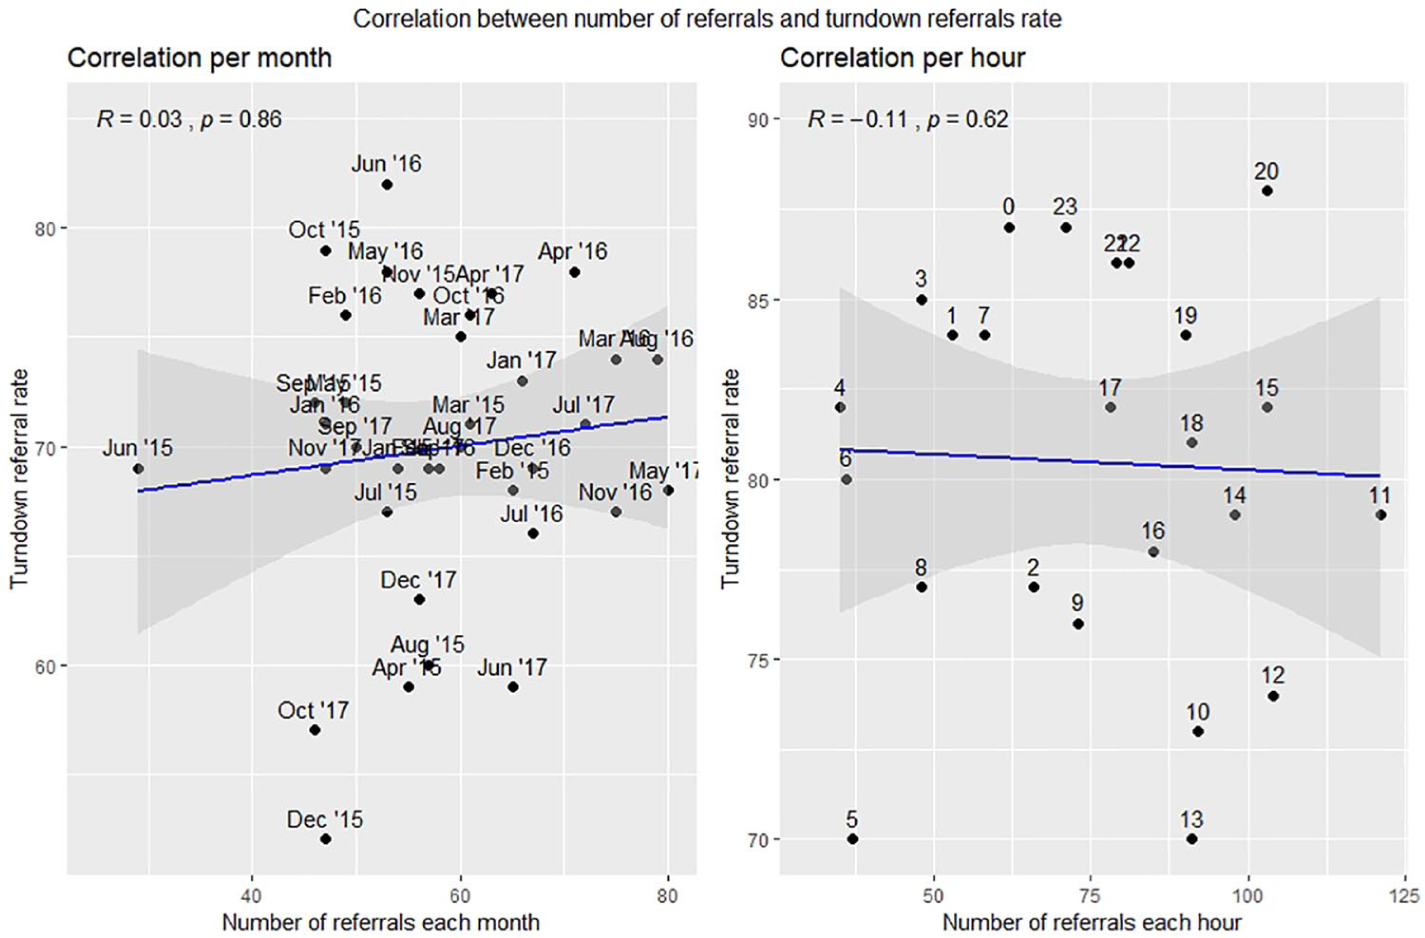
Turndown referral rate correlation with number of referrals.
Analysis of all referrals
Figure 7 shows the bar chart for each group. The gender distribution of all referrals is predominantly male. A total of 70 per cent of the referrals were male patients. More than 50 per cent of the referrals are OOH (up to 75%) with more referrals reported over the weekends (p < 0.001). This indicates the necessity for 24/7 PPCI services.
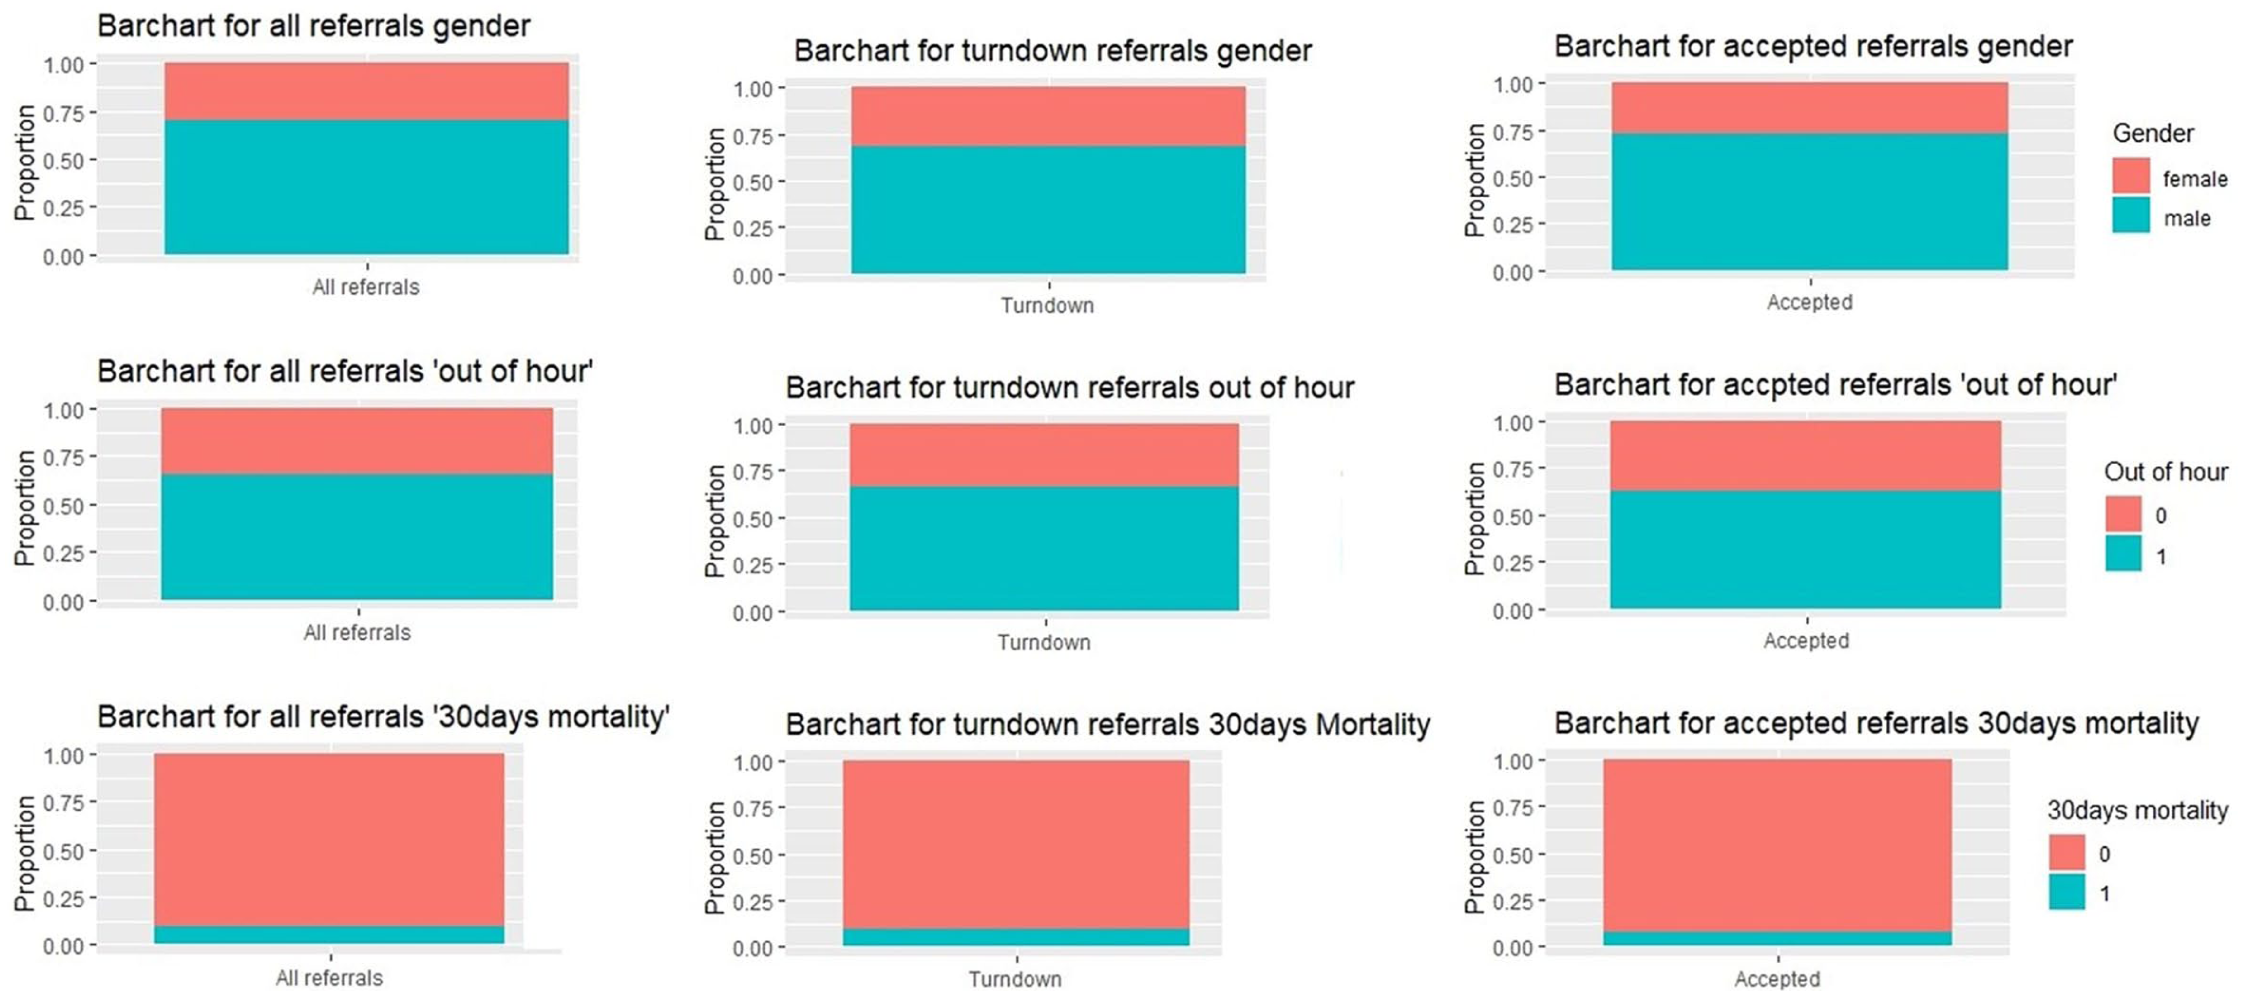
General analysis of all referrals, turndown referrals and accepted referrals.
Figure 8 depicts that 4 a.m. and 8 p.m. were the peak referral times for those patients with 30-day mortality. However, the month of September had maximum of 30-day mortality for turndown referrals, whereas January, July and November had a greater number of patients with 30-day mortality in accepted referrals.
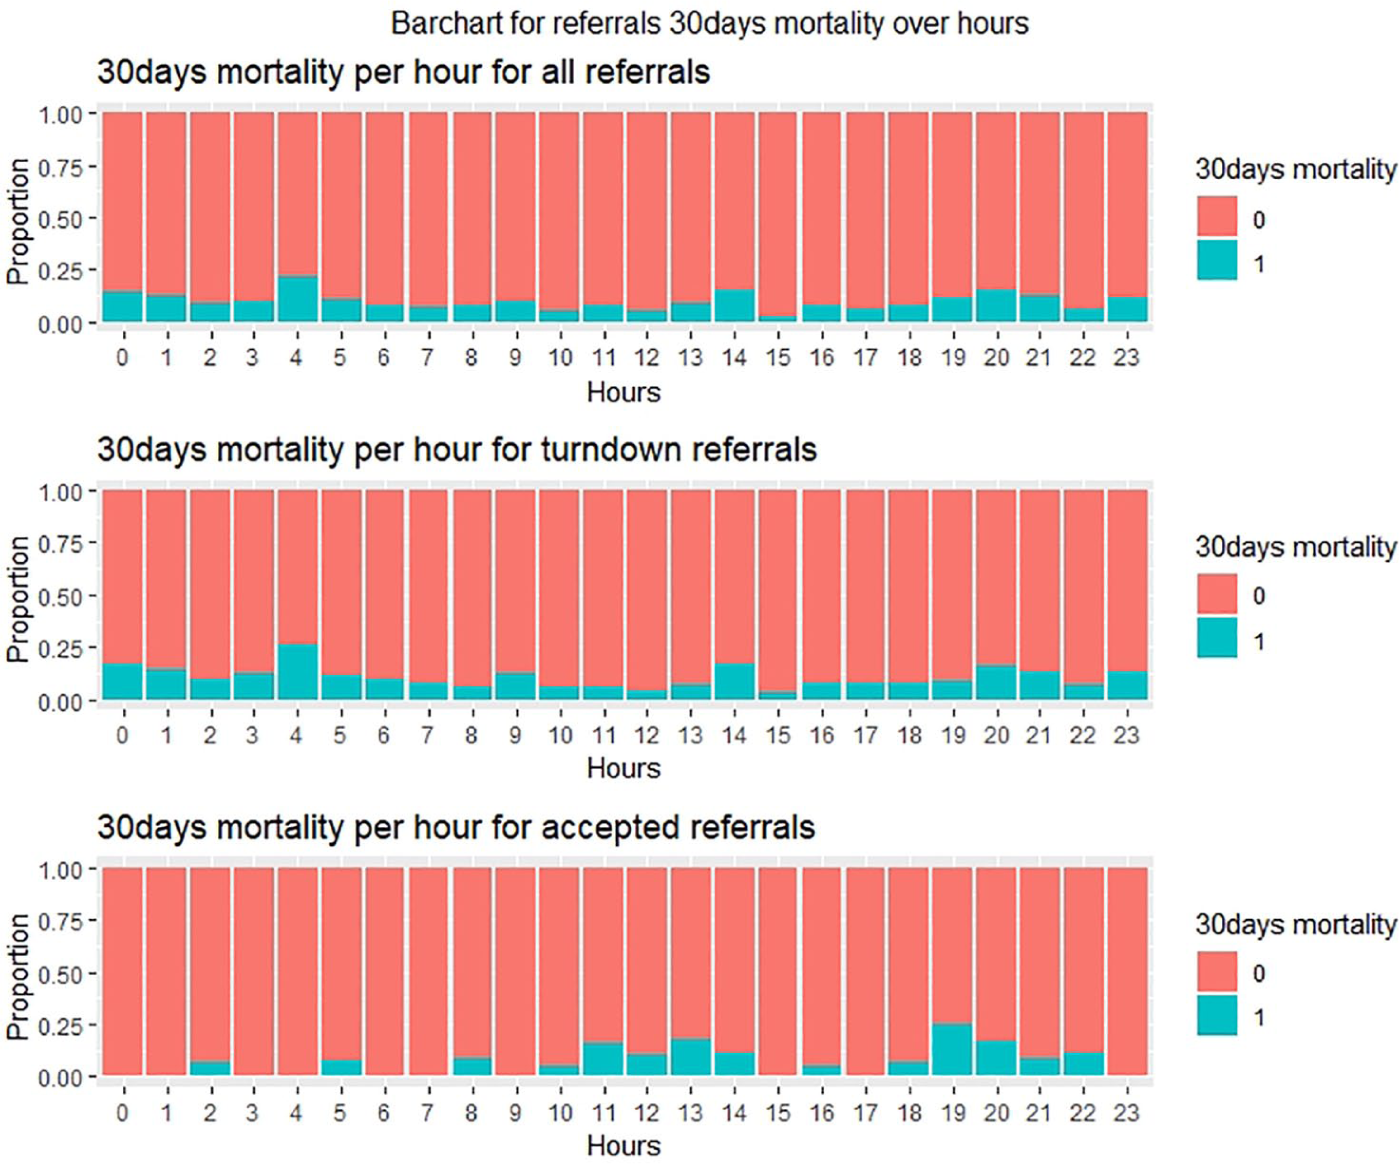
Thirty-day mortality analysis per hour of ‘all referrals’, turndown referrals and accepted referrals.
General analysis and comparison between turndown and accepted groups
Figure 9 shows that women were older than men in both the groups, that is, the turndown group (mean ages 73.0 vs 64.9 years, p < 0.001) and the accepted group (70.48 vs 61.44 years, p < 0.001). Both males and females have greater mean age in the turndown group. Regarding the ‘OOH’ referrals, 66 per cent of the total referrals were turned down ‘OOHs’, among which 32 per cent were made on the weekends, whereas in accepted patients, 59 per cent of referrals were accepted ‘OOH’, among which 52 per cent were made on weekends shown in Figure 7. The OOH referrals for both groups merged are significant (p < 0.001) compared to in-hour referrals. For all the referrals that were turned down, the peak hours were 11 a.m. (7%), 3 p.m. (6%) and 8 p.m. (6%). The rate of acceptance peaked during the morning hours of 10 a.m. (38/540 (7%)), 11 a.m. (38/540 (7%)) and 12 p.m. (48/540 (7%)). Patients that were accepted during these peak hours included ~30 per cent females and ~70 per cent males. There is a significant difference between the 30-day mortality rate among accepted patients and turned down patients, that is, 5.4 per cent versus 8.0 per cent in the turndown referrals (p = 0.01). Sixty percent of patients with 30-day mortality in the accepted group are ‘OOH’, and 73 per cent of patients with 30-day mortality in the turndown group are ‘OOH’ (see Figure 8).
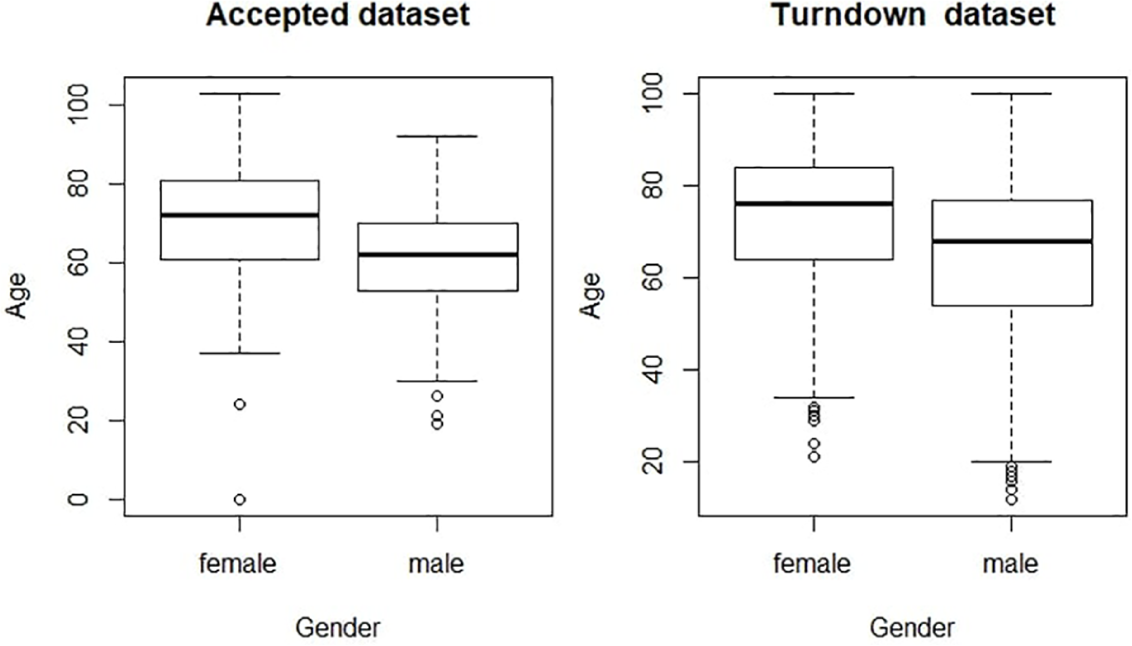
Mean age with respect to gender.
Logistic regression
Table 1 shows the odds ratios for all referrals, Table 2 shows the results for the turndown group and Table 3 shows results for the accepted group. In ‘all referrals’ and in the ‘turndown referrals’ both, age (p < 0.001) and being an OOH referral (p > 0.05, not significant) increased the odds of mortality after 30 days (Tables 1 and 2). Being a female increased the odds of being referred ‘OOH’ (p = 0.039).
Odds ratios of variables derived from multiple logistic regressions in all referrals group.
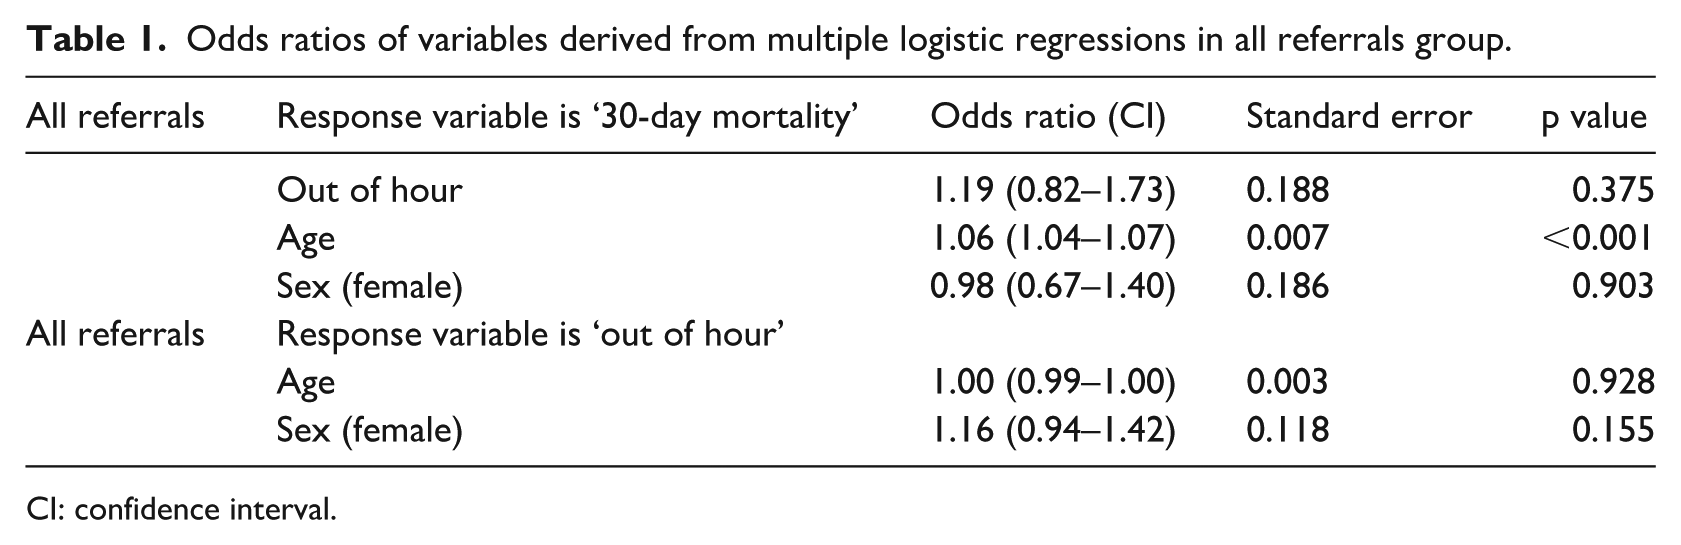
CI: confidence interval.
Odds ratios of variables derived from multiple logistic regressions in the turndown group.
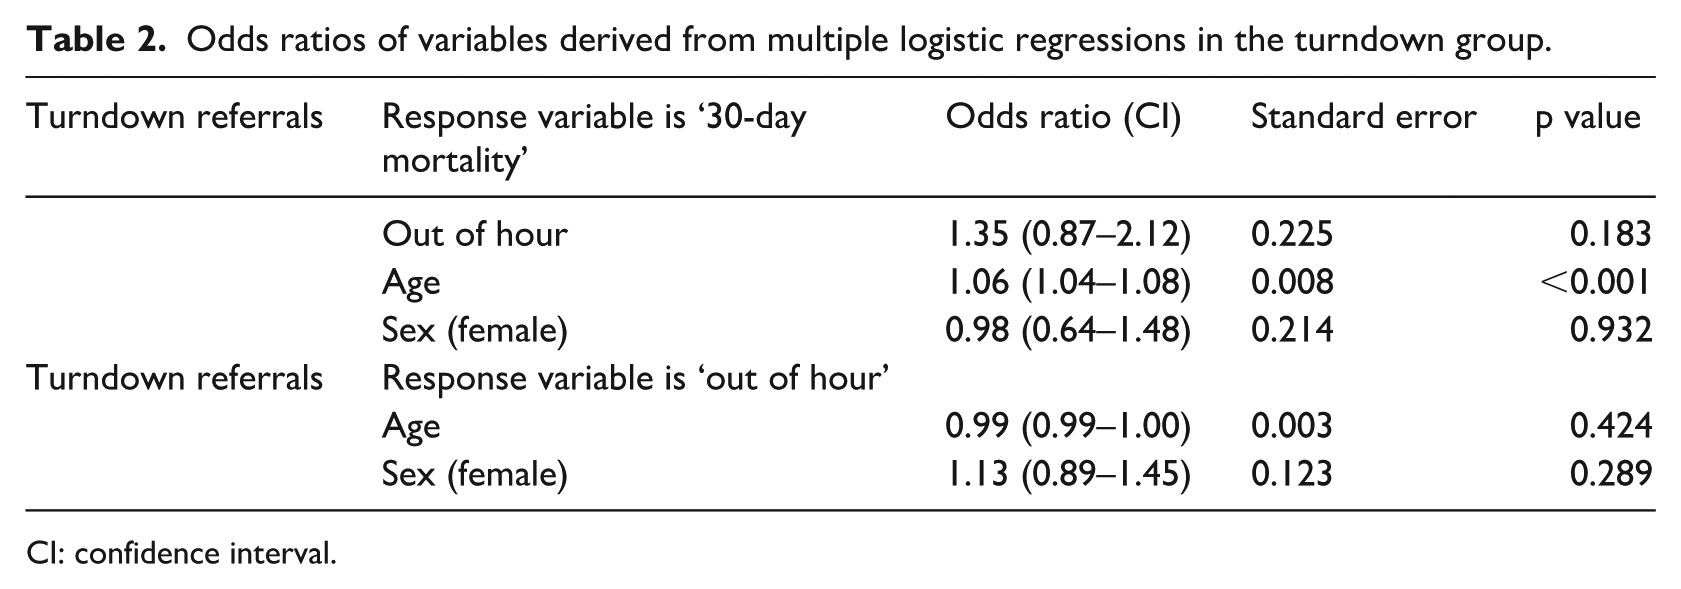
CI: confidence interval.
Odds ratios of variables derived from multiple logistic regressions in the accepted group.
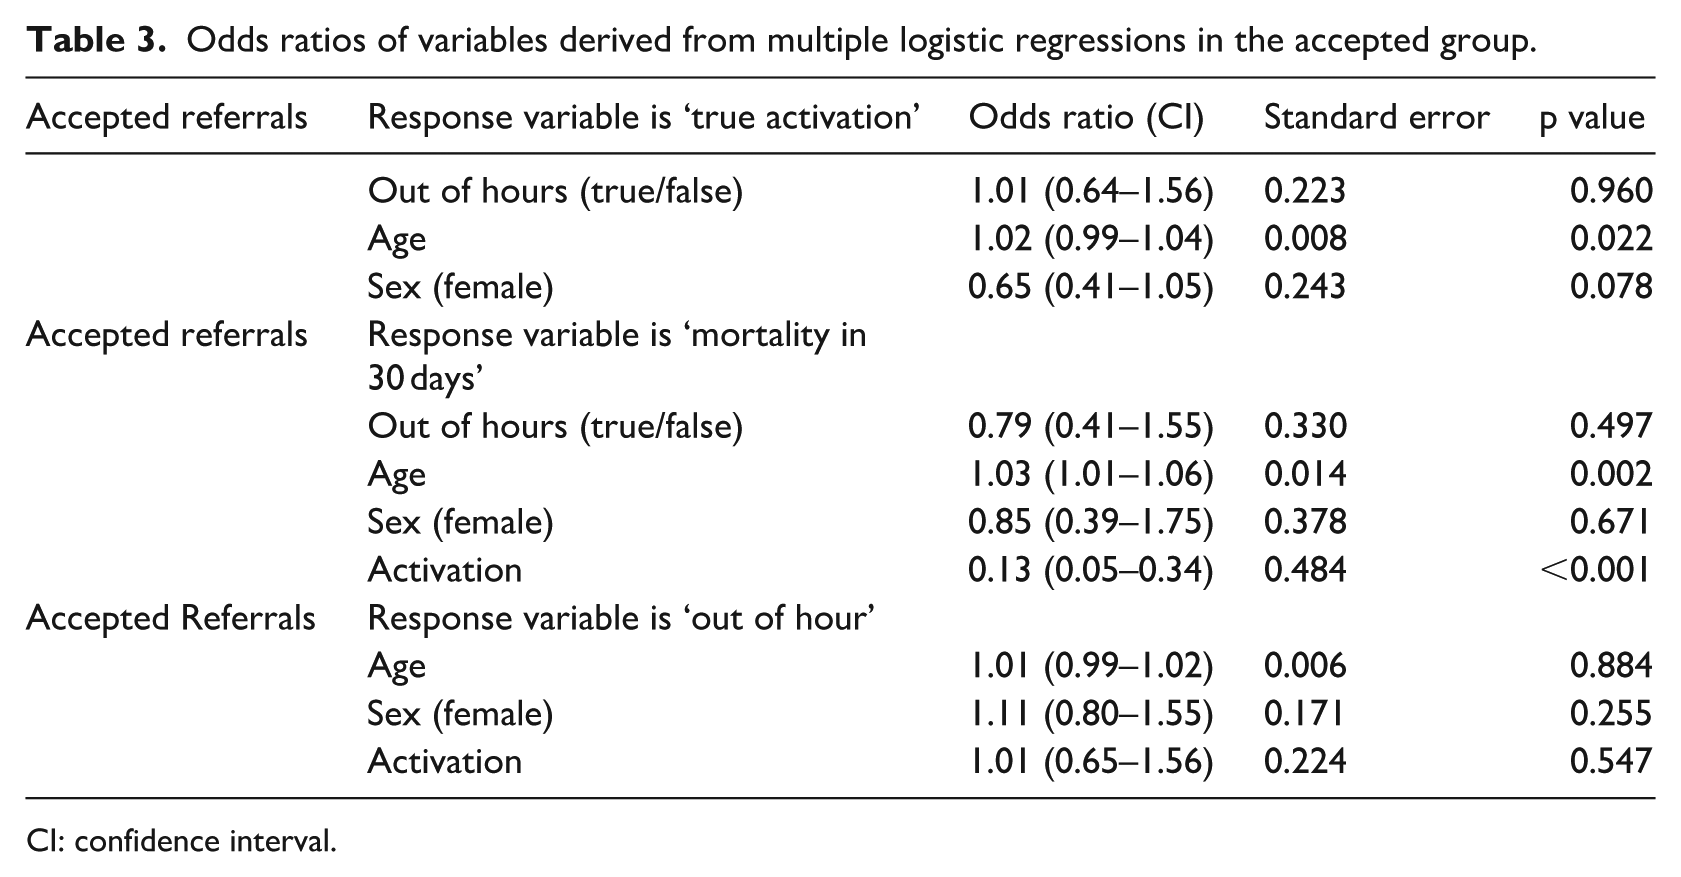
CI: confidence interval.
In the accepted group, there could be true activations as well as a false activation. A false activation is when a patient referral is accepted and taken to the CathLab, but the angiogram reveals that there is no blockage. The 30-day mortality (p < 0.001) reduced the odds of a true activation in accepted referrals (Table 3). Age (p < 0.001) and being ‘OOHs’ increased the odds of mortality after 30 days. The STEMI true activation and being a female increased the odds of being referred ‘OOHs’.
Discussion
The results depict a lack of consistency in the distribution of referrals over the seasons for each year. Furthermore, referral rates per hour show similar patterns between the referral rates for each year. For weeks, no correlation was found except for years 2015 and 2016. However, there was a statistically significant correlation (r = 0.7, r = 0.7, r = 0.6, p < 0.001) between the hours of each year (2015, 2016 and 2017).
This research found some gender differences, that is, 70 per cent of referrals were male. Sederholm Lawesson et al. 9 illustrate the gender dependency on STEMI symptoms where females tend to have less chest pain. Another significant finding in the analysis includes the fact that 65 per cent (p < 0.001) of the total referrals were OOHs. This result determines the importance of a working 24/7CathLab. A study investigated the effectiveness of STEMI patients treated by PPCI within normal working hours compared with those treated OOHs, resulting no significant difference. 10 However, that study used a single centre’s experience which limits the results. Females were older in both the turndown and accepted groups. Also, we found that ‘younger’ patients were accepted for PPCI when compared with the turndown group. It is evident from the analysis that mortality within 30 days is higher in the turndown patients when compared with the accepted referrals. Also, mortality rate in accepted referrals is lower at night-time (midnight to 6 a.m.) when compared with turndown referrals.
This is an early development; hence, we are currently working with Raigmore Hospital in NHS Scotland to gather their PPCI referral data for aggregation and comparison. Therefore, in the future, we aim to perform a multi-centre study. Also, we aim to add the ethnicity or socioeconomic status differences in the referral data to our analysis as well. Given a time series of data, we did use an autoregression (AR) model for predicting future values in this series. The AR part involves regressing the variable on its own lagged (i.e. past) values. However, we did not use the moving average model in this study, but it will be interesting to use the autoregressive moving-average (ARMA) model in a future article.
Limitations
These findings are based on one dataset of a single hospital of Northern Ireland which can limit the results and may not be a depiction of all PPCI services. However, in future analysis, enhancement has been planned in terms of including the dataset from other UK hospitals.
Conclusion
This research identified the time series for PPCI referrals as well as for each type of referral (accepted and turndown). The variation/fluctuation of referral rates over the months or days of the week is unpredictable since the rates are not similar for each year. However, the changes in the referral rates over hour of the day are consistent and predictable for each year. A pattern of referral rate peaks of 3-month seasonality can be found. Each respective referral group has more male referrals as compared to the females. The average age of the patients in the turndown group (68 ± 27) is higher when compared to the accepted patients (63 ± 40), which perhaps indicates that there is less chance of having STEMI at an older age. Furthermore, the two groups have different peak referral months, days and hours, for example, most of the referrals were made and turned down at the start of the year; however, most referrals were accepted at the end of the year. Similarly, the maximum number of referrals was turned down at 11 a.m.; however, most referrals were accepted at 10 a.m. Most patients (58%–65%) were referred OOHs (p < 0.001). Females are more likely to be referred OOHs in all three groups. This analysis leads to the emphasis on the importance of a 24/7 CathLab and PPCI service. Also, patient referrals that are accepted at night time (after midnight) are less likely to die within 30 days. However, if patients are referred and turndown in the night hour, then they are more likely to die within 30 days.
Footnotes
Declaration of conflicting interests
The author(s) declared no potential conflicts of interest with respect to the research, authorship and/or publication of this article.
Disclaimer
The views and opinions expressed in this paper do not necessarily reflect those of the European Commission or the Special EU Programmes Body (SEUPB).
Funding
The author(s) disclosed receipt of the following financial support for the research, authorship and/or publication of this article: This research is supported by the European Union’s INTERREG VA Programme, managed by the Special EU Programmes Body (SEUPB).