
Abstract
This study aims to explore the use of Instagram by the Centers for Disease Control and Prevention, one of the representative public health authorities in the United States. For this aim, all of the photos uploaded on the Centers for Disease Control and Prevention Instagram account were crawled and the content of them were analyzed using Microsoft Azure Cognitive Services. Also, engagement was measured by the sum of numbers of likes and comments to each photo, and sentiment analysis of comments was conducted. Results suggest that the photos that can be categorized into “text” and “people” took the largest share in the Centers for Disease Control and Prevention Instagram photos. And it was found that the Centers for Disease Control and Prevention’s major way of delivering messages on Instagram was to imprint key messages that call for actions for better health on photos and to provide the source of complementary information on text component of each post. It was also found that photos with more and bigger human faces had lower level of engagement than the others, and happiness and neutral emotions expressed on the faces in photos were negatively associated with engagement. The features whose high value would make the photos look splendid and gaudy were negatively correlated with engagement, but sharpness was positively correlated.
Keywords
Introduction
Social networking services (SNSs) can have much potential for public health communication. 1 SNS users connect to other users, express about themselves, and share their interests freely and easily, and analyzing those online activities would enable public health authorities to observe and understand people regarding various public health issues. Also, public health authorities can utilize SNSs for spreading information among people by such actions as delivering everyday health information, sharing emergency situation and what should be done under the situation, and providing online and offline event information. 2 These two kinds of information flow—from people to public health authorities and the other way around—have been dramatically widened thanks to the advances in communication technology including SNSs.
In this regard, public health literature has paid attention to SNSs. One of the most studied aspects has been the health-related information sharing of individuals on SNSs. Posts with various health-related topics including infectious disease,3,4 alcohol, 5 obesity, 6 and cancer have been uploaded by SNSs users. 7 Previous studies have focused on the amount, 8 subtopics,9,10 and content of the SNS posts that were uploaded by individual users. 11 Also, analyzing the use of SNSs operated by public health authorities has taken another part of the literature. Chou et al. 12 summarized the topics of the literature about health promotion using SNSs and suggested that commentary/review and descriptive studies constituted the majority of extant literature. Capurro et al. 13 concluded that the literature consists mainly of observational studies of users and usages of SNS regarding public health topics. While many studies about public health and SNSs have been conducted, there has been relatively little research about what the public health authorities deliver through SNSs to public. Also, the issue of what kind of messages entails more engagement or more positive responses has not been studied enough.
Meanwhile, most of the previous research on public health authorities and SNSs analyzed data in text form. Past studies failed to reflect the exponentially growing share of SNS posts in visual forms. More and more users of Facebook and Twitter are now using them for photo sharing, and Instagram, a photo-centric SNS, has grown to be one of the most widely used SNSs. This changing social media environment calls for the need to incorporate SNS photo data into the public health research realm. Photos and videos can be an effective way of revealing the expertise of organization and delivering information because of their “easy-to-understand format,” but their potential has not been fully realized. 14
Based on these considerations, this study aims to explore the use of Instagram by the Centers for Disease Control and Prevention (CDC), one of the representative public health authorities in the United States, for public health communication through photos. For this aim, all photos uploaded on the CDC Instagram account were crawled and the content of the photos was analyzed. Here, computational method using online artificial intelligence services was employed instead of the traditional content analysis using human coders. Computational method enables researchers not only to analyze a large number of photos but also to extract various information which was hard to get through human coders. Next, the engagement of public to each photo was measured using the sum of numbers of likes and comments from accompanying metadata to the Instagram photos. 15 Which photo features were associated with the engagement and how accurately photo features might predict the engagement were examined. Finally, the sentiments of comments revealed by online artificial intelligence services were compared with photo features. Whether photo features can be used to predict the sentiments of comments was examined.
The present study is structured as follows. First, in the “Related works” section, the previous studies about the public health and social media are reviewed. Next, how the data was gathered and which features were extracted from the Instagram photos are described in the “Material and method” section. The content of Instagram photos, the associations of photo features with engagement and comment sentiments, and the predictabilities of photo features on engagement and comment sentiment are presented in the “Results” section. Finally, the implications of results are discussed in the “Discussion” section.
Related works
Analysis of SNS content on public health
Many studies have analyzed the content of SNS posts on public health uploaded by individual users. In some cases, simply counting the number of posts can provide researchers useful information. For example, Signorini et al. 3 compared the number of tweets about H1N1 or swine flu with the actual number of reported patients and showed that the volume of tweets can be an index of disease level. Hanson et al. 8 counted the number of tweets about Adderall, the most commonly abused prescription stimulant among college students, and explored the possibility of analyzing SNS posts for monitoring drug abuse. More studies, however, examined the content, beyond the count, of SNS posts on public health.
The most widely used method was content analysis by human coders. Scanfeld et al. 10 analyzed 1000 tweets about antibiotics and categorized them based on their content into 11 groups including general use, advice/information, side effects/negative reactions, and so on. Harris et al. 6 analyzed the content of tweets about childhood obesity and suggested that the focus was placed more on individual behaviors than on environment or policy issues. Also, Harris et al. 9 utilized Amazon Mechanical Turk and categorized the tweets with #diabetes hashtag into nine groups. The most common tweet topics were medical and nonmedical resources on diabetes. Vos and Buckner 4 analyzed 25,598 tweets about H7N9 (also known as bird flu) virus: they concluded that most of the tweets contained sensemaking information rather than efficacy information that would be useful for responding to the crisis appropriately. Donovan et al. 7 conducted a content analysis of 194 cancer blog entries. They found that more than 90 percent of cancer blog posts were written based on a valenced frame: either negative, positive, or balanced. Also about cancer, Gage-Bouchard et al. 16 investigated whether cancer information on social media is scientifically accurate. They demonstrated that about 67 percent of cancer information was deemed accurate and concluded that social media can be useful as a cancer-related information resource while more effort is also needed for recommending more reliable sources. Nastasi et al. 17 examined the characteristics of Twitter conversation about breast cancer screening. They suggested that Twitter users appear to have low approval and confusion regarding breast cancer screening guidelines and called for effort for education and dissemination of accurate information to the general public.
A group of studies analyzed the content of SNS beyond the post level. The unit of analysis in the study by Bender et al. 18 was each Facebook group: the content of breast cancer Facebook groups was analyzed, and awareness-raising, fundraising, and support-seeking were found to be the major topics. In Moreno et al., 5 Facebook profiles of 307 college students were analyzed focusing on whether alcohol-related activities were displayed in their profiles. Coupling with the result of cross-sectional survey, they reported that displaying alcohol-related activities was associated with problem drinking and alcohol-related injury.
Although the content analysis by human coders has been the major method employed to analyze SNS content on public health, there also has been a group of studies that utilized computational methodologies which enable other kinds of analysis that the content analysis by human coders cannot provide. To name a few, Radzikowski et al. 19 collected 669,136 tweets about Measles vaccination, identified dominant terms and popular hashtags, and investigated their associations among each other in the form of co-occurrences. Based on this analysis, they captured how the themes of measles vaccination were structured on Twitter. Salathe and Khandelwal 20 also focused on the vaccination narratives on Twitter, but they conducted sentiment analysis on tweet data. They found that sentiments expressed in tweets were correlated with vaccination rates by region estimated by the CDC. Myslín et al. 21 conducted sentiment analysis on 7362 tobacco-related tweets and found that sentiment toward tobacco was more positive than negative or neutral even except for marketing tweets about tobacco products. In addition to these key term extraction and sentiment analysis, topic modeling has been employed to analyze SNS content on public health. Prier et al. 22 applied topic modeling technique on 2,231,712 tobacco-related tweets and identified the subtopics that make up the discussion about tobacco on Twitter. Paul and Dredze 23 collected 144 million tweets and identified health-related topics using topic modeling: seasonal influenza, allergies, exercise, and obesity were included in major topics. Glowacki et al. 24 analyzed tweets about e-cigarette from medical professionals: they extracted topics from 3800 tweets and suggested that tweets from the United States focused more on the danger of e-cigarette to teenagers while tweets from the United Kingdom focused more on the potential of e-cigarette for smoking cessation aid. Waszak et al. 25 focused on the spread of medical fake news on social media: they analyzed social media posts related to the most common diseases and causes of death using the BuzzSumo Application. They found that 40 percent of the most frequently shared links included fake news and the most misinformed content was about vaccine.
As seen from the above, analyzing SNS content on public health has been paid much attention to the literature. It needs to be noted, however, that the majority of studies analyzed the SNS posts uploaded by individual users. While those studies are useful for understanding individuals’ online behaviors concerning public health, it is needed what public health authorities upload on their account and how they interact with public through SNS as well. Also, analyzing SNS post in text form has been taking a large part in the literature and studies analyzing other types of data, such as photo, are still small in number.
SNS content of public health authorities accounts
SNS accounts run by individual users and public health authorities may have different purposes. 26 Public health authorities have a strategic goal and they run SNS accounts for communicating with public for the goal. 26 Also, which topic or content public health authorities deliver to public has an influence on audience behavior and engagement. 27 Thus, analyzing the content of public health authorities’ SNS accounts would provide researchers and professionals with valuable insights about what information the public authorities aim to deliver to public.
In this regard, a group of studies paid attention to the SNS content of public health authorities accounts. Park et al. 26 analyzed the content of 1760 wall comments of various health organizations’ Facebook pages and examined how health organizations use interactive channels on Facebook: they found that government agencies and schools/universities take a wider use of interactive features than nonprofit organizations do. They conducted another analysis of Twitter data on health literacy messages: 28 Their content analysis of 571 tweets revealed that these tweets were often quoted or retweeted by other Twitter users, but that more strategic approach for positive organizational self-presentations is needed. Also, Thackeray et al. 1 conducted a content analysis of various social media accounts of state public health departments and found that posts uploaded on these accounts were primarily for information distribution rather than interaction with public. Concerning a particular campaign, Struik and Baskerville 29 analyzed the content of Crush the Crave, a Facebook-based smoking cessation intervention, and found that the main purposes of uploaded posts were to support smoking cessation and to market Crush the Crave. Jiang and Beaudoin 15 examined a similar campaign in China: their content analysis of anti-smoking campaign in Sina Weibo revealed that the persuasive content can be characterized by perceived risk, subjective norms, and self-efficacy.
Other groups of studies grounded their work on the theoretical perspective that organizations’ social media messages serve one of three functions: information (transmission), community (engagement), or action. 30 Neiger et al. 2 analyzed the content of tweets on the accounts of local health departments: their results suggest that while Twitter is being adopted by most of local health departments, a large part of tweets was for one-way information transmission on personal health topics and organization-related information. Park et al. 14 conducted a content analysis on 1583 tweets uploaded on sampled major health organizations’ accounts: they reported that the majority of tweets were about the organization rather than about health, and that hashtags and hyperlinks were most frequently used as interactive tools.
The content of SNS posts on the accounts of public health authorities has been analyzed in previous studies including the ones briefly reviewed above. It needs to be noted that however, quantitative measure of engagement in consideration of the content features has been rarely attempted. Park et al. 14 measured engagement as the number of likes and retweets and suggested that the messages about personal health action were more likely to be liked and retweeted than the ones about organizational information, but this work can be regarded as one of rare exceptions. Furthermore, how public health authorities engage with public through photos, rather than posts in text form, has been scarcely studied.
Analysis of photo data on public health
SNS posts in photo form can be worthy of much academic and professional attention because of its wide spread among SNS users. In particular, they can provide public health researchers and professionals a lot of insights because a majority of SNS photos are about what food they eat, 31 what exercise they do, 32 what place they go, 33 what disease they suffer from, 34 and/or in what mental status they are, 35 all of which are the topics that can be included in public health domain.
A small number of studies analyzed photo data on public health. Jun 36 conducted a content analysis of the images from online brochures of the Korean medical tourism industry. Their results suggested that among nine categories in total, active procedures/surgeries, patients interacting with doctors, and hospital interiors were the images that appeared most frequently. Chu et al. 37 analyzed the content of Instagram photos about e-cigarette and found that advertisement was the most common type of photo. Another group of studies also analyzed Instagram data, but their target was not the photos themselves but the accompanying metadata in text form. Sharma and De Choudhury 38 extracted nutritional information from Instagram food post texts and explored whether users react actively to healthy or non-healthy food posts. They found that moderately healthy foods were popular in the Instagram world. Correia et al. 39 made use of the hashtags with drug names in Instagram post texts. They analyzed the co-occurrence network of drug and disease names and examined the potential that Instagram hashtag data can be utilized to monitor the drug–drug interactions and adverse drug reactions. Vraga et al. 34 analyzed the Instagram posts on cancer, but their analysis was not about the content of photos but about the difference in the number of posts between Instagram and Twitter.
In spite of increasing adoption and significance of photo-based SNSs, SNS photo data such as Instagram have not been actively embraced as a data source in public health research. In addition, the method that was employed to analyze the photo content was confined to the content analysis by human coders. This limited method hinders not only analyzing a large number of photos but also utilizing a variety of photo features that can be extracted only by advanced computational method. 40 Furthermore, it was rarely studied which high- and low-level features extracted from the photos from the accounts of public health authorities would entail increased engagement and more positive responses from general public.
Based on the literature reviewed above, the following research questions are proposed:
RQ1. What are key characteristics of the contents of Instagram photos on the CDC account measured by content category, optical character recognition (OCR) feature, and post texts?
RQ2. What are the relationships between the features of Instagram photos on the CDC account and the engagement of public?
RQ3. What are the relationships between the features of Instagram photos on the CDC account and the sentiments of comments?
Material and method
Data collection
All photos and accompanying metadata, including likes and comments, from the CDC Instagram account (https://www.instagram.com/cdcgov/) were crawled using Instagram scraper (https://github.com/rarcega/instagram-scraper). The authors collected 1545 photos, 6828 comments, and 375,725 likes for this analysis; all these collections were used for analysis.
Photo features
Content category
The content category of each photo was determined. Computer Vision API in Microsoft Azure Cognitive Services (https://azure.microsoft.com/services/cognitive-services/computer-vision/) was employed for this task. 41 Pretrained artificial intelligence service categorizes the content of an uploaded photo into one of 15 categories: abstract, animal, building, dark, drink, food, indoor, others, outdoor, people, plant, object, sky, text, or transportation.
Face features
Human faces on each photo were detected and various face features were extracted from each detected face using Face API in Microsoft Azure Cognitive Services (https://azure.microsoft.com/services/cognitive-services/face/). Artificial intelligence service provides information on a variety of facial features, including age, gender, emotions, and size, from the detected faces from an uploaded photo.
First, (1) the number of faces on each photo was counted. And (2) closeup was measured by the ratio of the size of the biggest face to the total size of the photo, and (3) face ratio was measured by the ratio of the sum of sizes of all faces to the total size of the photo; (4) age was measured by average age and (5) female was measured by the number of female faces determined by Face API from all detected faces in the given photo. Face API determines emotions revealed on each face so that the sum of all emotions becomes 1. Averages of each eight emotions on all faces on a given photo were measured: the eight emotions are (6) anger, (7) contempt, (8) disgust, (9) fear, (10) happiness, (11) neutral, (12) sadness, and (13) surprise.
OCR feature
In order to detect the English words presented on a given photo, OCR in Computer Vision API in Microsoft Azure Cognitive Services was employed: it returns the detected English words and their locations on the photo. We measured number of words as the number of English words appeared on a given photo.
Pixel features
Features concerning the pixel-level information were extracted using the program written by the authors in Python programming language and OpenCV library. Pixels in digital photos contain the numbers that represent colors—RGB (red, green, blue), HSV (hue, saturation, value), or others according to the different color space models—and these numbers can be used to measure various features for each photo.
First, the means and variances of RGB in each photo pixels were measured ((1) red mean, (2) red variance, (3) green mean, (4) green variance, (5) blue mean, (6) blue variance), and the means and variances of saturation and value (i.e. brightness) were also measured ((7) saturation mean, (8) saturation variance, (9) value mean, (10) value variance). Concerning hue, the total range of hue (0 to 179 in OpenCV) was divided into intervals (7, 23, 35, 90, 136, 169) so that each interval corresponds to each of key colors: red, orange, yellow, green, blue, and violet. 40 And the number of pixels whose hue falls into each interval in a given photo was counted and the share of each color in a photo was measured ((11) red share, (12) orange share, (13) yellow share, (14) green share, (15) blue share, (16) violet share). In addition, (17) the share of warm colors (red, orange, and yellow) and (18) the share of cold colors (green, blue, and violet) were measured as well. Also, the number of peaks in the hue histogram ((19) hue peaks) was measured.42,43 A histogram was generated from hue values in a given photo, smoothed by Kernel Density Estimation, and the number of local maximums of the smoothed histogram was counted. 40 Finally, affections from the pleasure–arousal–dominance (PAD) model ((20) pleasure, (21) arousal, (22) dominance) were calculated using the formula: (pleasure = 0.69 × value + 0.22 × saturation; arousal = –0.31 × value + 0.60 × saturation; dominance = –0.76 × value + 0.32 × saturation) from previous research by Valdez and Mehrabian. 44
Visual features
Visual features that represent how attractive a given photo is were measured. 45 First, (1) brightness, which represents how bright a given photo is, was measured as the average of luminance (Y values in the YUV color space) in the pixels of the photo. Next, (2) colorfulness, which represents how colorful a given photo is, was measured using the means and standard deviations (SDs) of metrics composed of relative amounts of RGB values in the pixels. 46 (3) naturalness, which represents how much a given image corresponds to human perception of reality, 47 was measured using the proportion of pixels whose saturation and luminance fall in a certain range. 45 (4) contrast, which represents the relation of local luminance variations to the surrounding luminance, was measured as the SD of luminance in pixels divided by the number of pixels. 45 (5) RGB contrast, which is the extension of contrast into the three-dimensional RGB color space, was also measured. (6) sharpness, which represents the clarity and the level of detail of a photo, was measured as a function of Laplacian of each pixel’s luminance, normalized by the local average luminance in the surroundings of each pixel. 48
In addition to these attractiveness measures, two metrics about color were also measured. (7) Color diversity, which represents how diverse the colors used in a given photo is, was measured by fractal dimension using box-counting method. 49 Fractal dimension has been used as a metric of color diversity in previous studies.40,50 (8) Color harmony, which represents how harmonious the dominant colors in a given photo are, was measured by the geometric formulations that the dominant colors generate on color wheel. 51 Here, hue histogram was generated and smoothed by kernel density estimation, and the highest and the second highest peaks were identified as the top two dominant colors. The internal angle that the two colors make on color wheel is color harmony. 52
Engagement
Engagement is a metric of linkage of social media message to action of public. 53 We measured engagement as the sum of numbers of likes and comments because liking or commenting on a particular message represents responsive online behavior to the message. As reviewed in the previous section, Park et al. 14 operationalized engagement as the sum of number of likes and retweets. This study adapted their scale into the sum of number of likes and comments.
Comment sentiments
Sentiment analysis of comments was conducted. Except for 402 photos without any comment, comments to 1143 photos were analyzed. Text Analytics API in Microsoft Azure Cognitive Services (https://azure.microsoft.com/ko-kr/services/cognitive-services/text-analytics/) was employed for this task. For each uploaded document, the API returns a sentiment score between 0 (most negative) and 1 (most positive). Sentiment scores of all comments made to each photo were averaged and used as a photo feature.
Results
The content of Instagram photos on the CDC account
Figure 1 shows the frequency of Instagram photos in the CDC account that falls into each content category determined by Azure Cognitive Services Computer Vision API. It demonstrates that “text” photos take the largest part (34.6%) and “people” photos follow (26.8%): over half were photos with words or people on it.
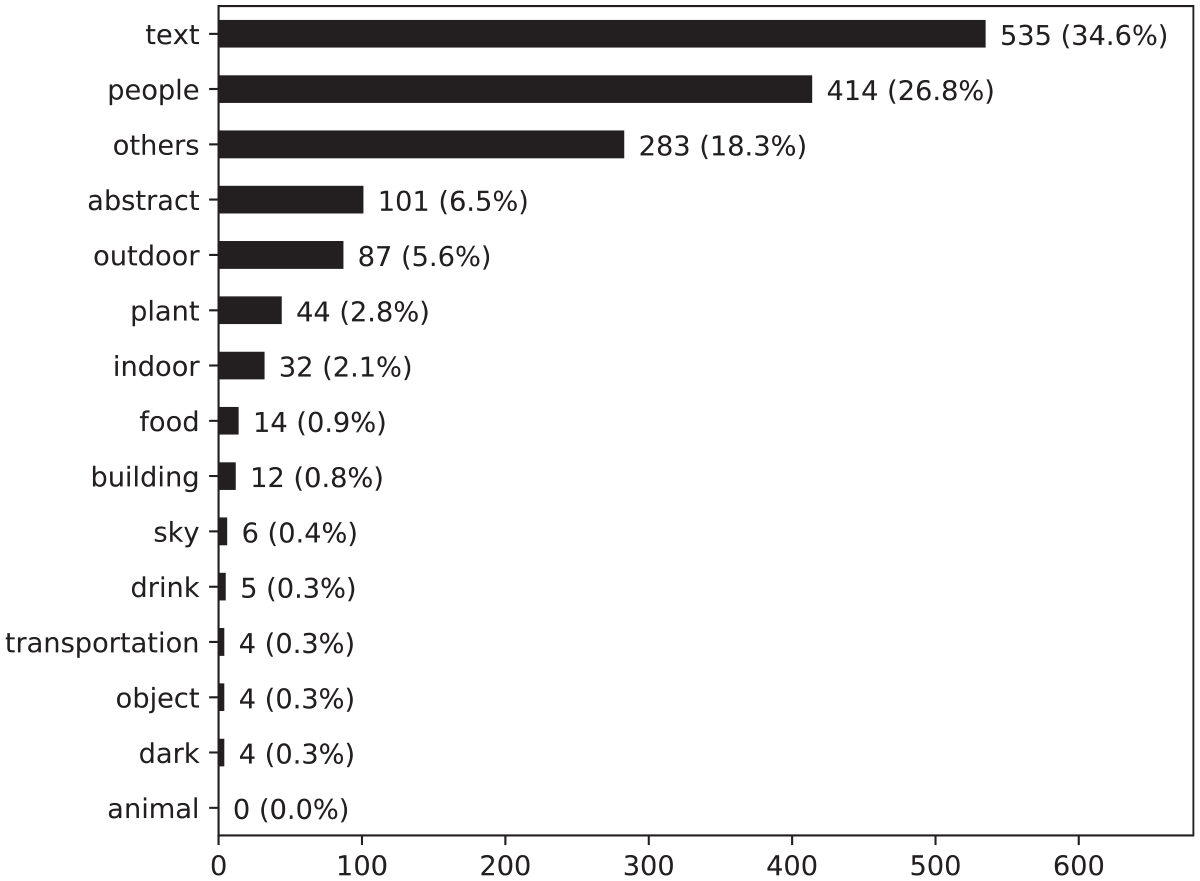
Frequency of photos by content category on the CDC Instagram account.
Based on the result that “text” photos take the largest part, the result of OCR was examined in order to figure out what message the words on photos (not the text part of posts) deliver. The total number of photos that OCR detected any word was 834, and a total of 16,392 detected words were analyzed. Words were transformed into lower cases, and punctuation marks and the frequent but meaningless words (“and,” “the,” “to,” “of,” “for,” “a,” “in,” “with,” “is,” “or,” “about,” “from,” “are,” “be,” “•,” “et,” “have,” “on,” “at,” “by,” “not,” “&,” “1,” “2,” “3,” “v,” “if,” “up,” “this,” “that,” “as,” “an,” “-,” “it,” “o,” “c,” “after,” “no,” “than,” “may,” “has,” and “only”) were removed. Figure 2 shows the frequency of remaining words. The figure suggests that there are many words which call for actions: get, quit, more, call, use, don’t, learn, help, 1-800-quit-now, and so on. And the key issues were Ebola, smoking, cancer, infectious disease, flu, antibiotics, food, and so on.
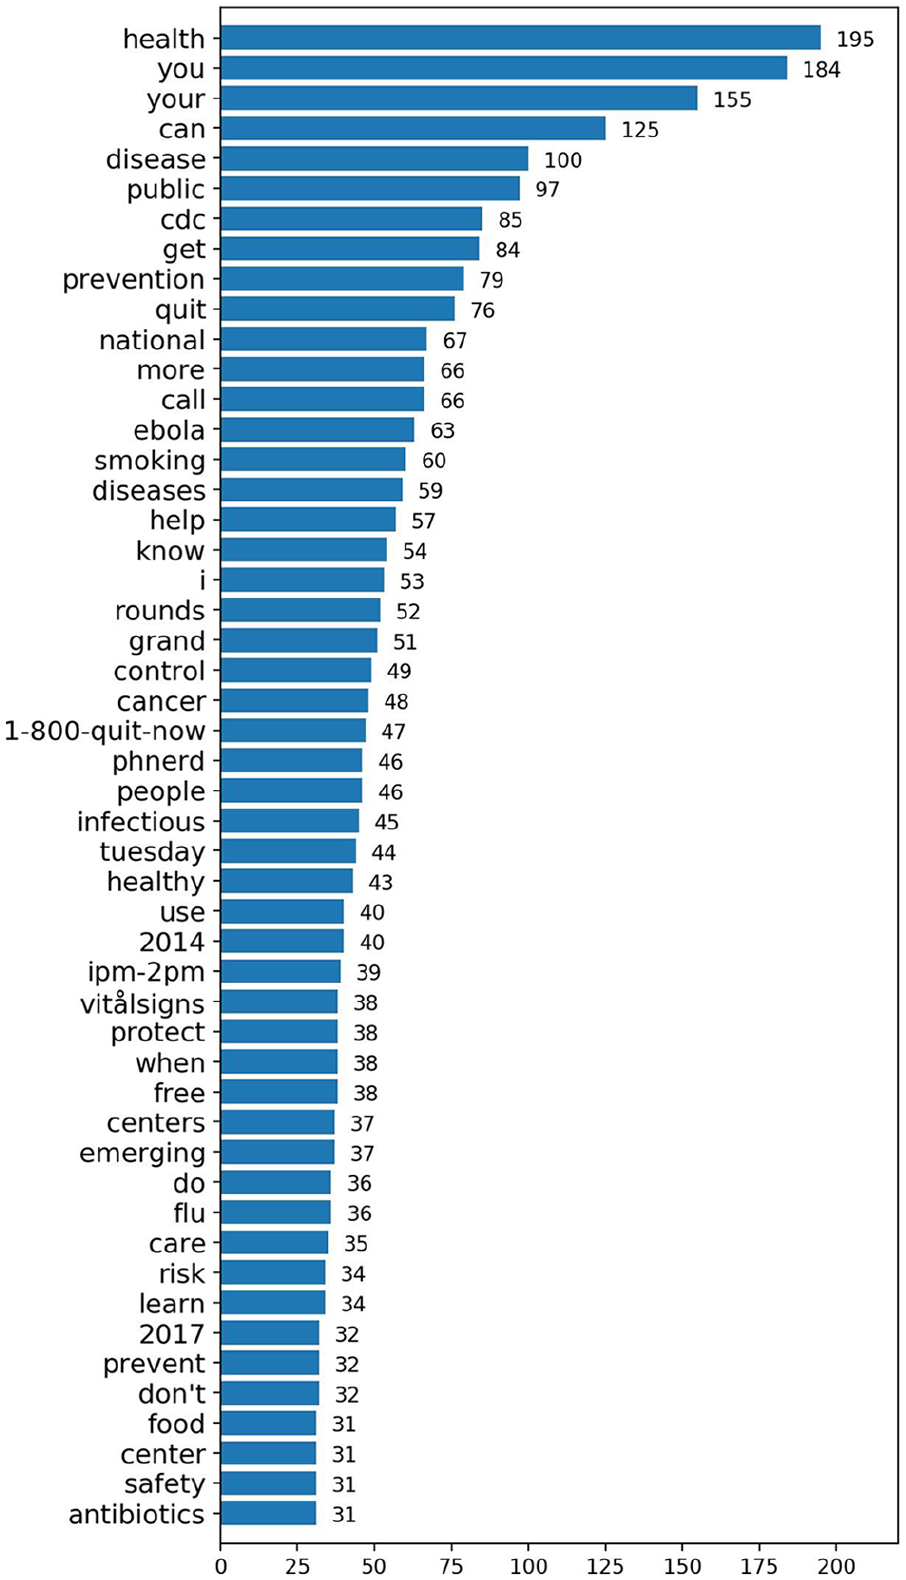
Top 50 frequent words detected by OCR (optical character recognition) from the CDC Instagram photos.
For the purpose of comparison, we also analyzed the post texts accompanied to Instagram photos. Post texts were tokenized into words, transformed into lower cases, and lemmatized, and punctuation marks and English stop words (stop words were from Natural Language Toolkit (NLTK), a Python library for natural language processing. Full English stop words are listed in https://gist.github.com/sebleier/554280) were removed. Figure 3 shows frequency of remaining words. It suggests that the name of organization, CDC, appeared overwhelmingly the most, and the words for Uniform Resource Locations (URLs), such as http, gov, bit, ly, www, appeared a lot. And the key issues were Ebola, infection, disease, virus, outbreak, flu, vaccine, smoking, zika, bacteria, and so on. Considering the results from analysis of OCR and post texts together, calling for actions by words imprinted in the photos, and providing the source of more information seem to be the major way of message delivering on the CDC Instagram account.
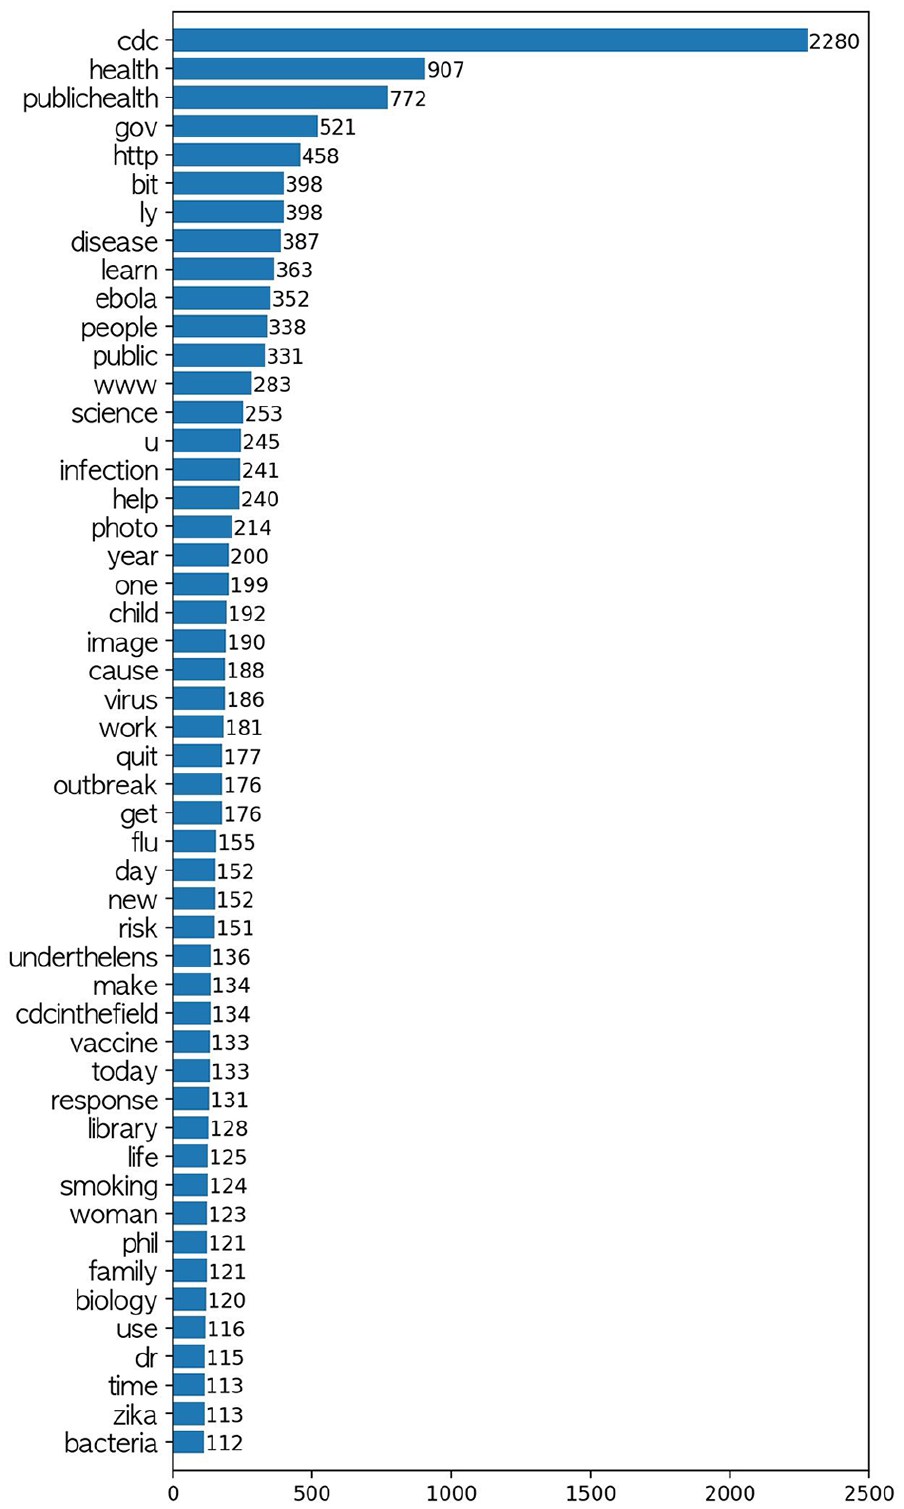
Top 50 frequent words of post text.
A total of 14 shared words between Figures 2 and 3 are about public health (health, disease, public, CDC, get), diseases (Ebola, flu, risk), and behaviors recommended (quit, smoking, help, people, use, learn). These shared words stand for commonalities between the texts embedded in photos and post texts.
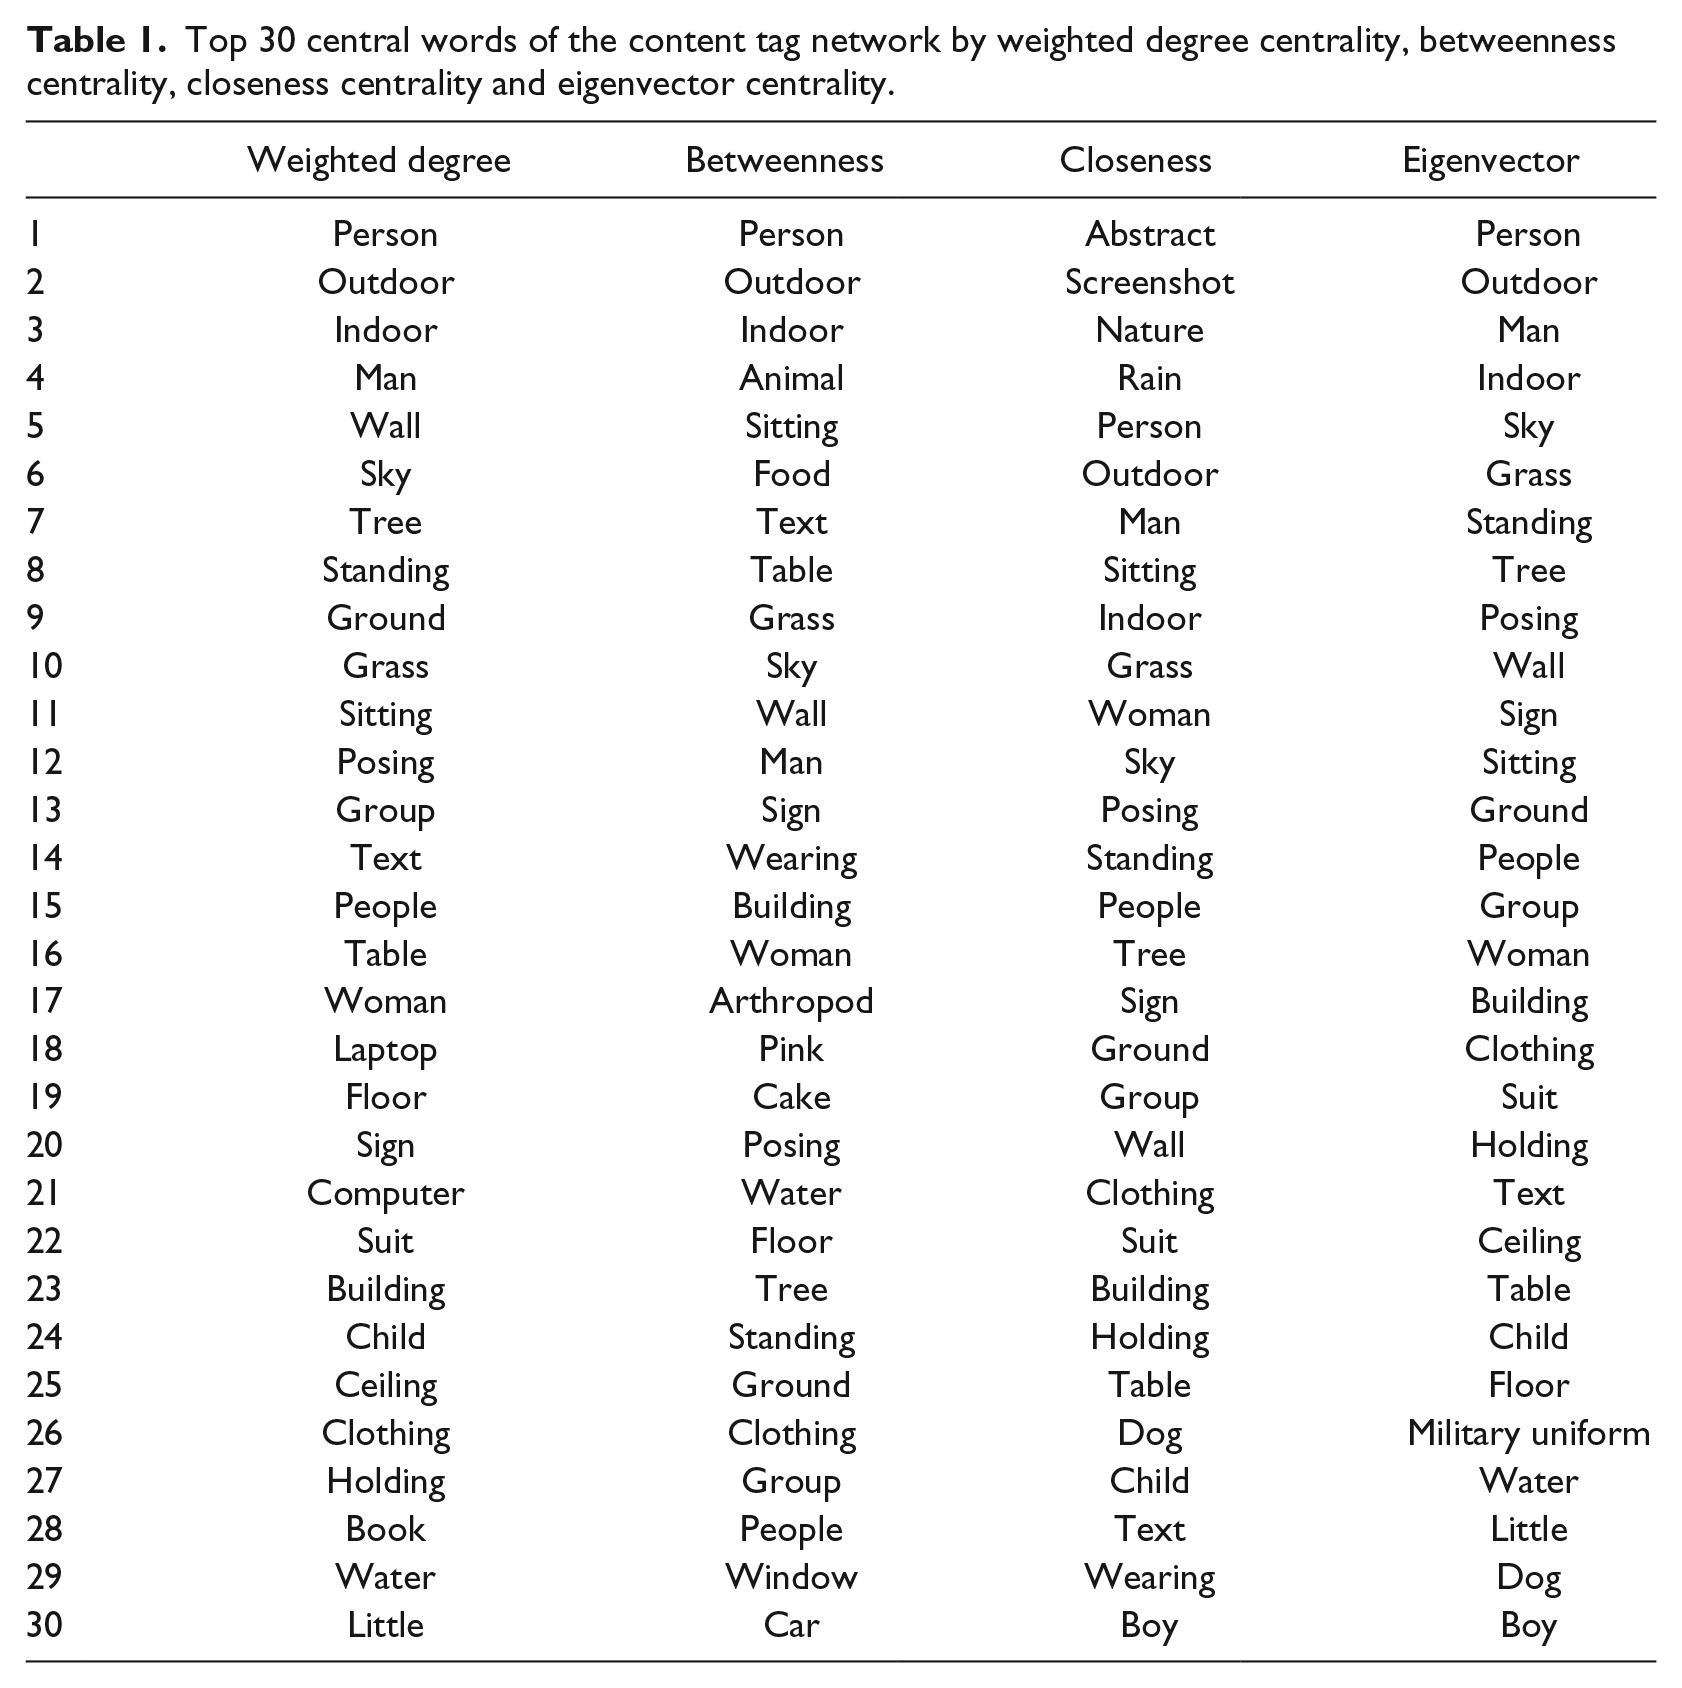
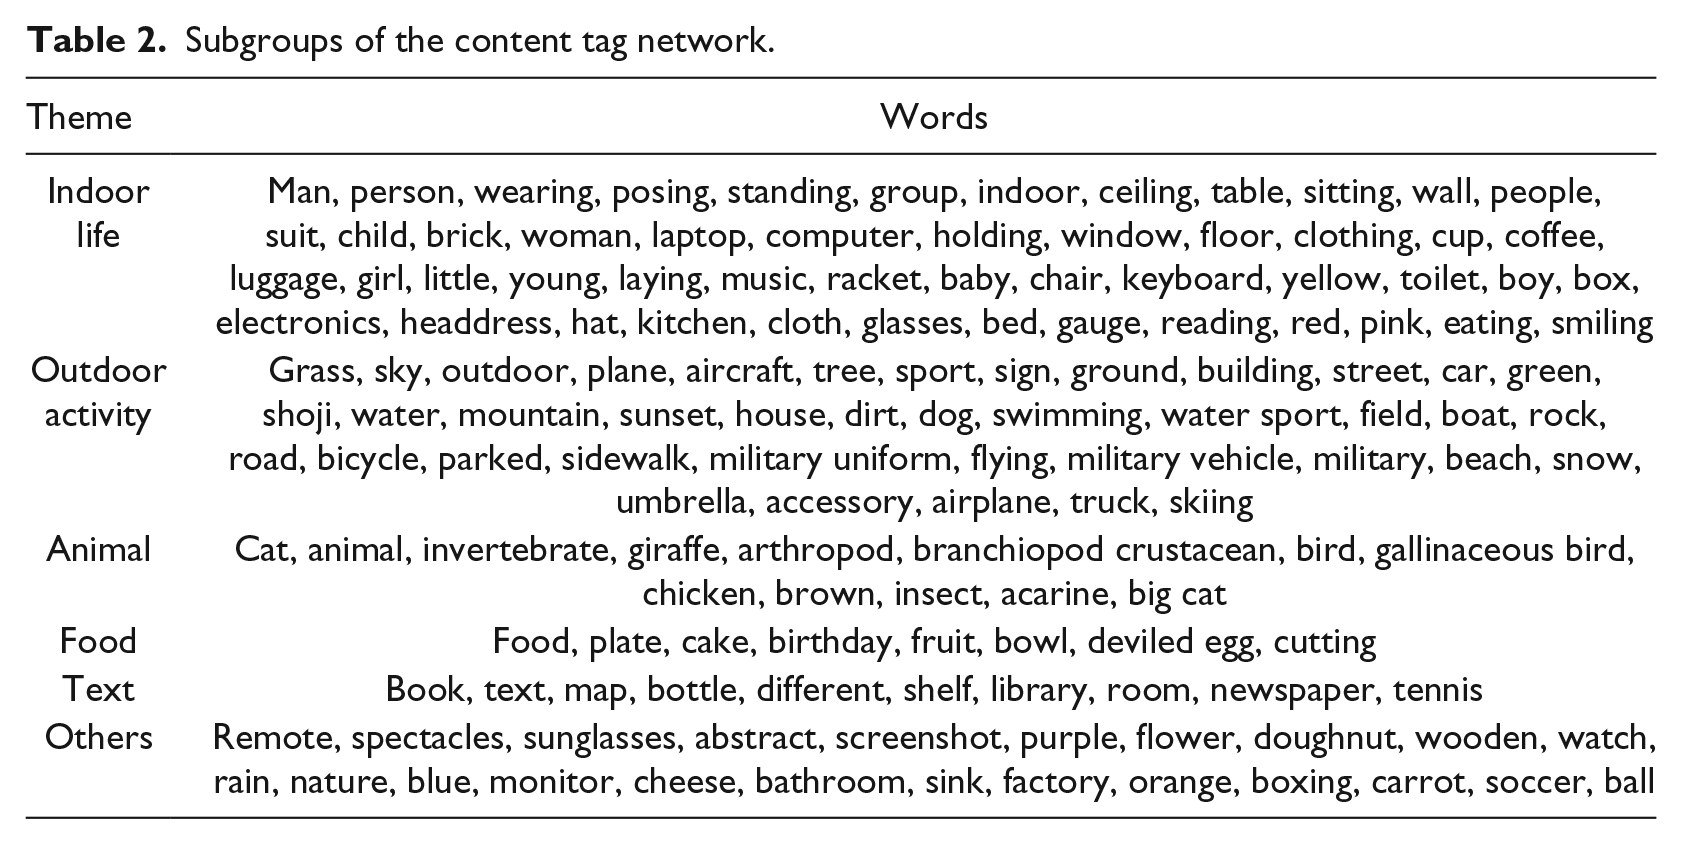
In addition, the content tags network was generated and analyzed. First, content tags for each photo were obtained by Computer Vision API of Microsoft Azure Cognitive Services. For each uploaded photo, the pretrained artificial intelligence service returns tags which would correspond with the content of the given photo. Next, tags with high correspondence were selected. Computer Vision API returns confidence score, which stands for how much a tag would correspond with the content of the photo, with each tag. Tags with confidence score greater than or equal to 0.9 were remained. And a content tag network was generated by connecting two tags when these tags were suggested for the same photo. For example, if tag A and tag B were returned content tags from Computer Vision API with confidence score over 0.9, two tags were added as nodes of the content network and the two nodes were connected with an undirected, weighted link. We used Gephi (https://gephi.org) for network visualization (see Figure 4). Finally, we analyzed the network. In order to figure out the central words, centrality analysis was conducted by four centrality measures: weighted degree centrality, betweenness centrality, closeness centrality, and eigenvector centrality. 54 The result in Table 1 suggests that the subject words that refer to the actors in the photos were mainly person, people, man, woman, and child, and that the action words that refer to what and where the actors do in the photos were mainly outdoor, indoor, sky, grass, standing, sitting, posing, wearing, and clothing. To detect the main themes of the content tag network, community detection was conducted by the Louvain algorithm. 55 The nodes were grouped into five groups and remaining, and the theme for each group was identified based on the nodes in the group. The result in Table 2 suggests that the key themes in the content tag network were indoor life, outdoor activity, animal, food, and text.

Content tag network. Node size represents the size of weighted degree centrality, and the nodes with the same color belong to the same subgroup determined by community detection using the Louvain algorithm.
Top 30 central words of the content tag network by weighted degree centrality, betweenness centrality, closeness centrality and eigenvector centrality.
Subgroups of the content tag network.
Instagram photo features and engagement on the CDC account
First, the mean engagement by content category was examined. Figure 5 shows that Instagram photos that were categorized into “plant” and “abstract” induced the most engagement from public. One thing to note is that while photos of “text” and “people” categories were the largest in number, their mean engagements were not relatively high. The engagements were different by content category (F = 9.207, p < 0.001).
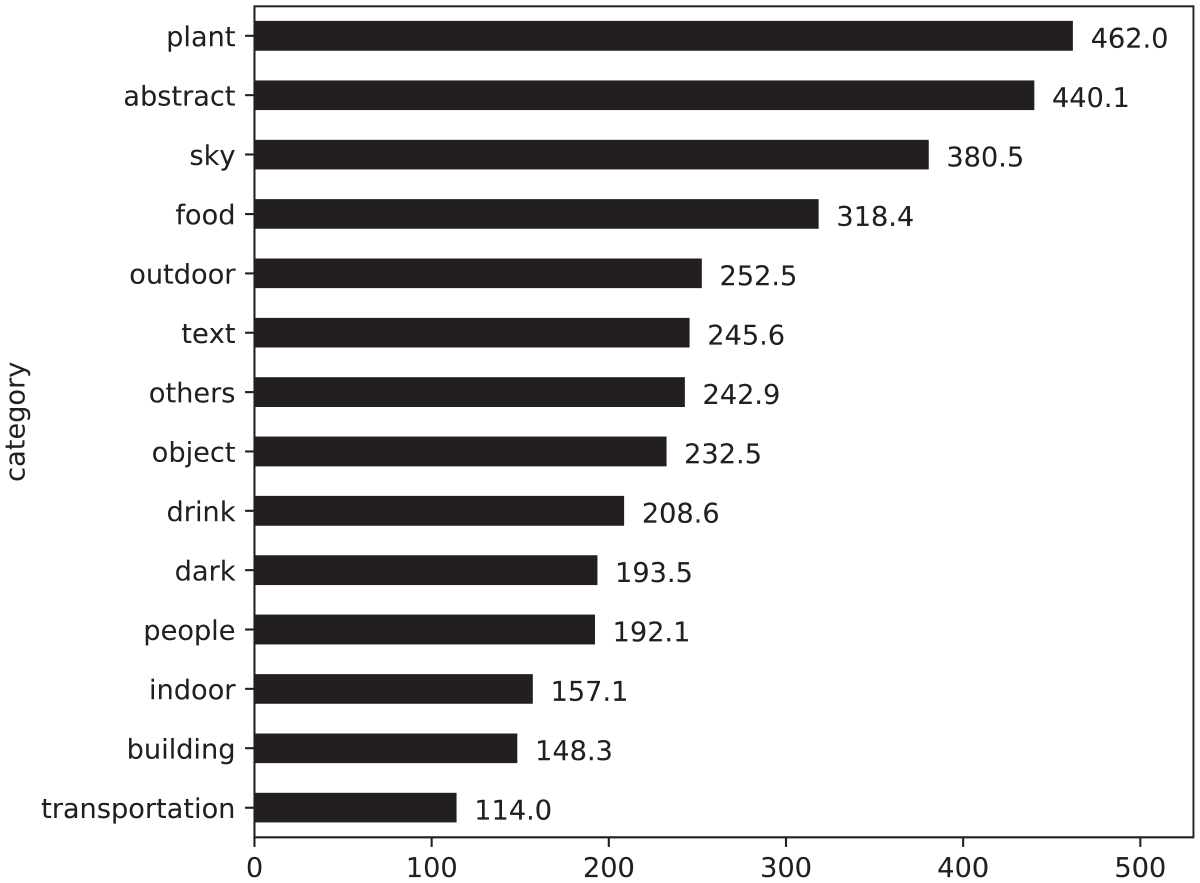
Mean engagement by content category.
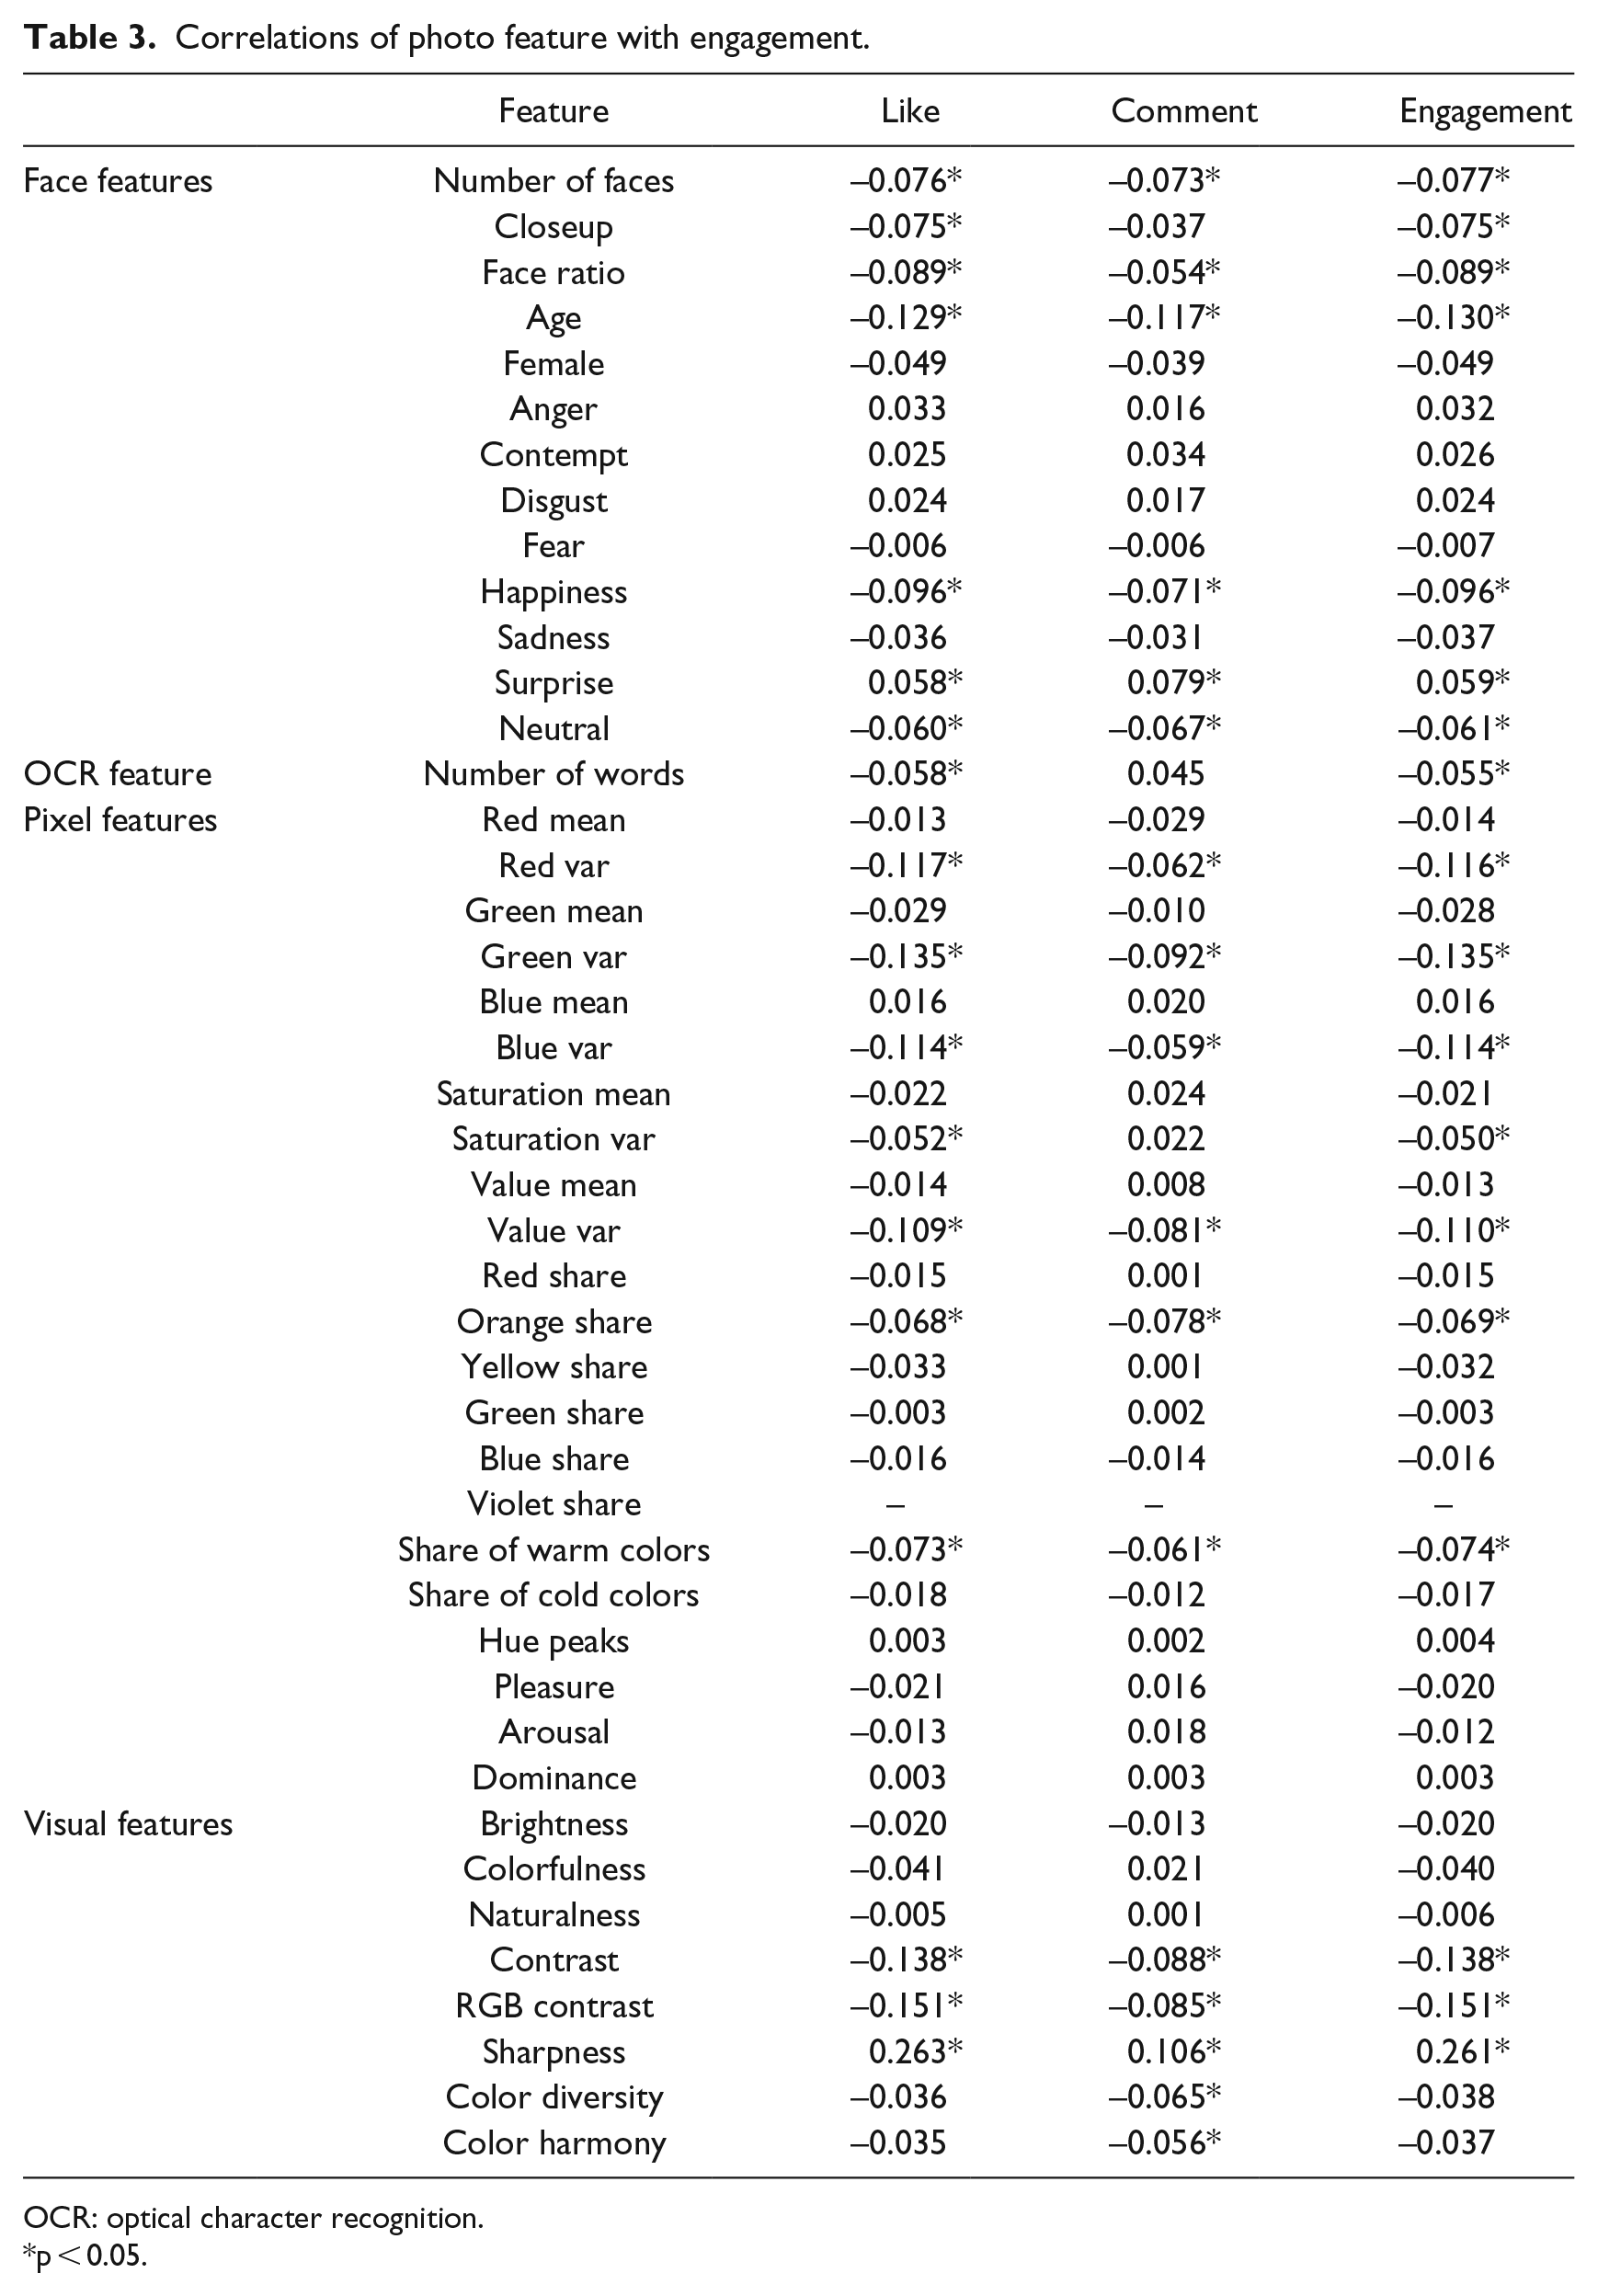
Next, the correlation coefficients between photo features and engagement were examined and the results are presented in Table 3. The negative associations of number of faces, closeup, and face ratio with engagement indicate that photos with more and bigger human faces have lower level of engagement. Also, surprise was positively correlated with engagement while happiness and neutral were negatively correlated: they suggest that photos with happy and neutral faces have lower engagement while photos with surprised faces have higher engagement. And the negative correlation of age with engagement indicates that photo with older people has lower engagement. The negative correlation of number of words with engagement suggests that photos with more imprinted words have lower engagement.
Correlations of photo feature with engagement.
OCR: optical character recognition.
p < 0.05.
The variances of RGB, saturation, and value were negatively correlated with engagement. Variance, other than mean, of color or brightness in an object tends to influence the perceived color or brightness. 56 For example, higher variance of brightness would make the photo look brighter. Also, the share of warm colors was negatively correlated with engagement. Concerning visual features, contrast and RGB contrast were negatively correlated with engagement while sharpness was positively correlated. Overall, these results suggest that the photos that look splendid and gaudy have lower engagement and the photos that look sharp and clear have higher engagement.
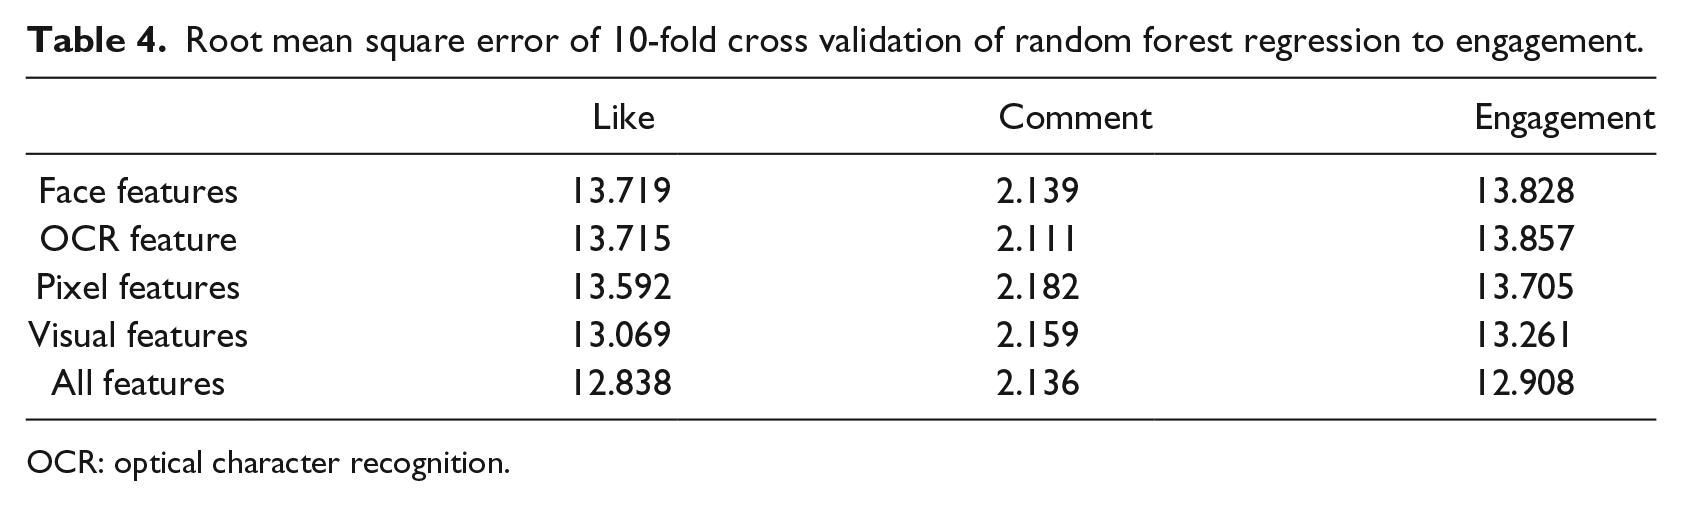
Finally, predictive models were built in order to investigate how accurately the photo features predict the engagement. Random forest regression models were trained with 10-fold cross validation and their root mean square errors (RMSEs) are presented in Table 4. Considering the means and SDs of like (M: 243.188, SD: 256.427), comment (M: 4.419, SD: 8.617), and engagement (M: 247.983, SD: 262.241), we can conclude that the RMSEs are relatively small and the photo features have acceptable level of predictability on engagement.
Root mean square error of 10-fold cross validation of random forest regression to engagement.
OCR: optical character recognition.
Instagram photo features and comment sentiment on the CDC account
First, the mean comment sentiments by content category were examined. Figure 6 shows that Instagram photos that were categorized into “transportation” and “indoor” induced the most positive comment from public. Also, comments to the photos that were categorized into “dark” were negative (below 0.5) while comments to the photos of other categories were positive (above 0.5). The comment sentiments were different by content category (F = 2.587, p = 0.002).
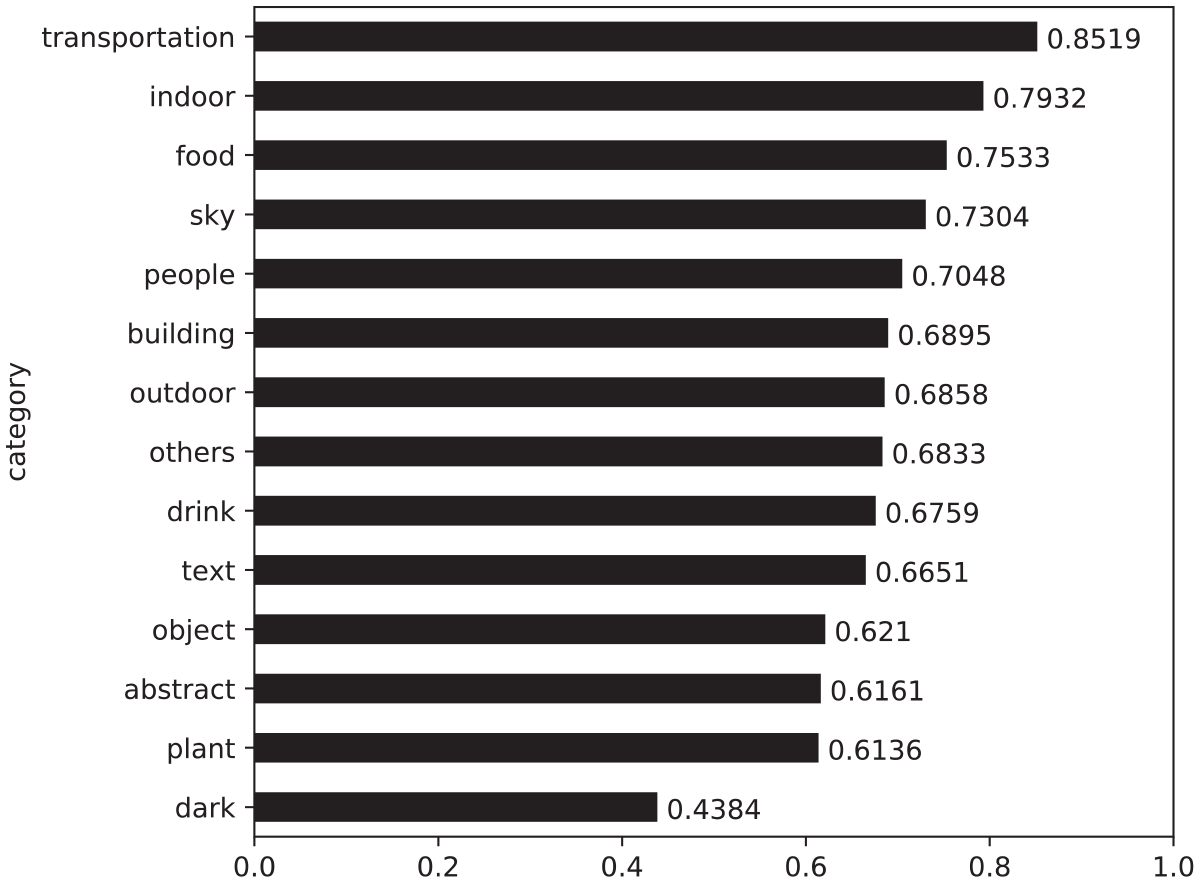
Mean comment sentiment by content category.
Next, the correlation coefficients between photo features and comment sentiment were examined and the results are presented in Table 5. The positive association of happiness with comment sentiments indicates that photos with happier faces induced more positive comments from public. Also, age was positively correlated with comment sentiments, which suggests that photos with older people have more positive comments. The negative correlation of number of words with comment sentiments suggests that photos with more imprinted words have more negative comments. None of pixel features except for value variance showed significant correlation coefficients with comment sentiments. Concerning visual features, contrast and RGB contrast were positively correlated with comment sentiments while sharpness was negatively correlated. Also, color diversity showed positive correlation coefficients with comment sentiments. Overall, these results suggest that the photos that are bold in contrast and diverse in color have more positive comments and the photos that look sharp and clear have more negative comments.
Correlations of photo feature with comment sentiment.
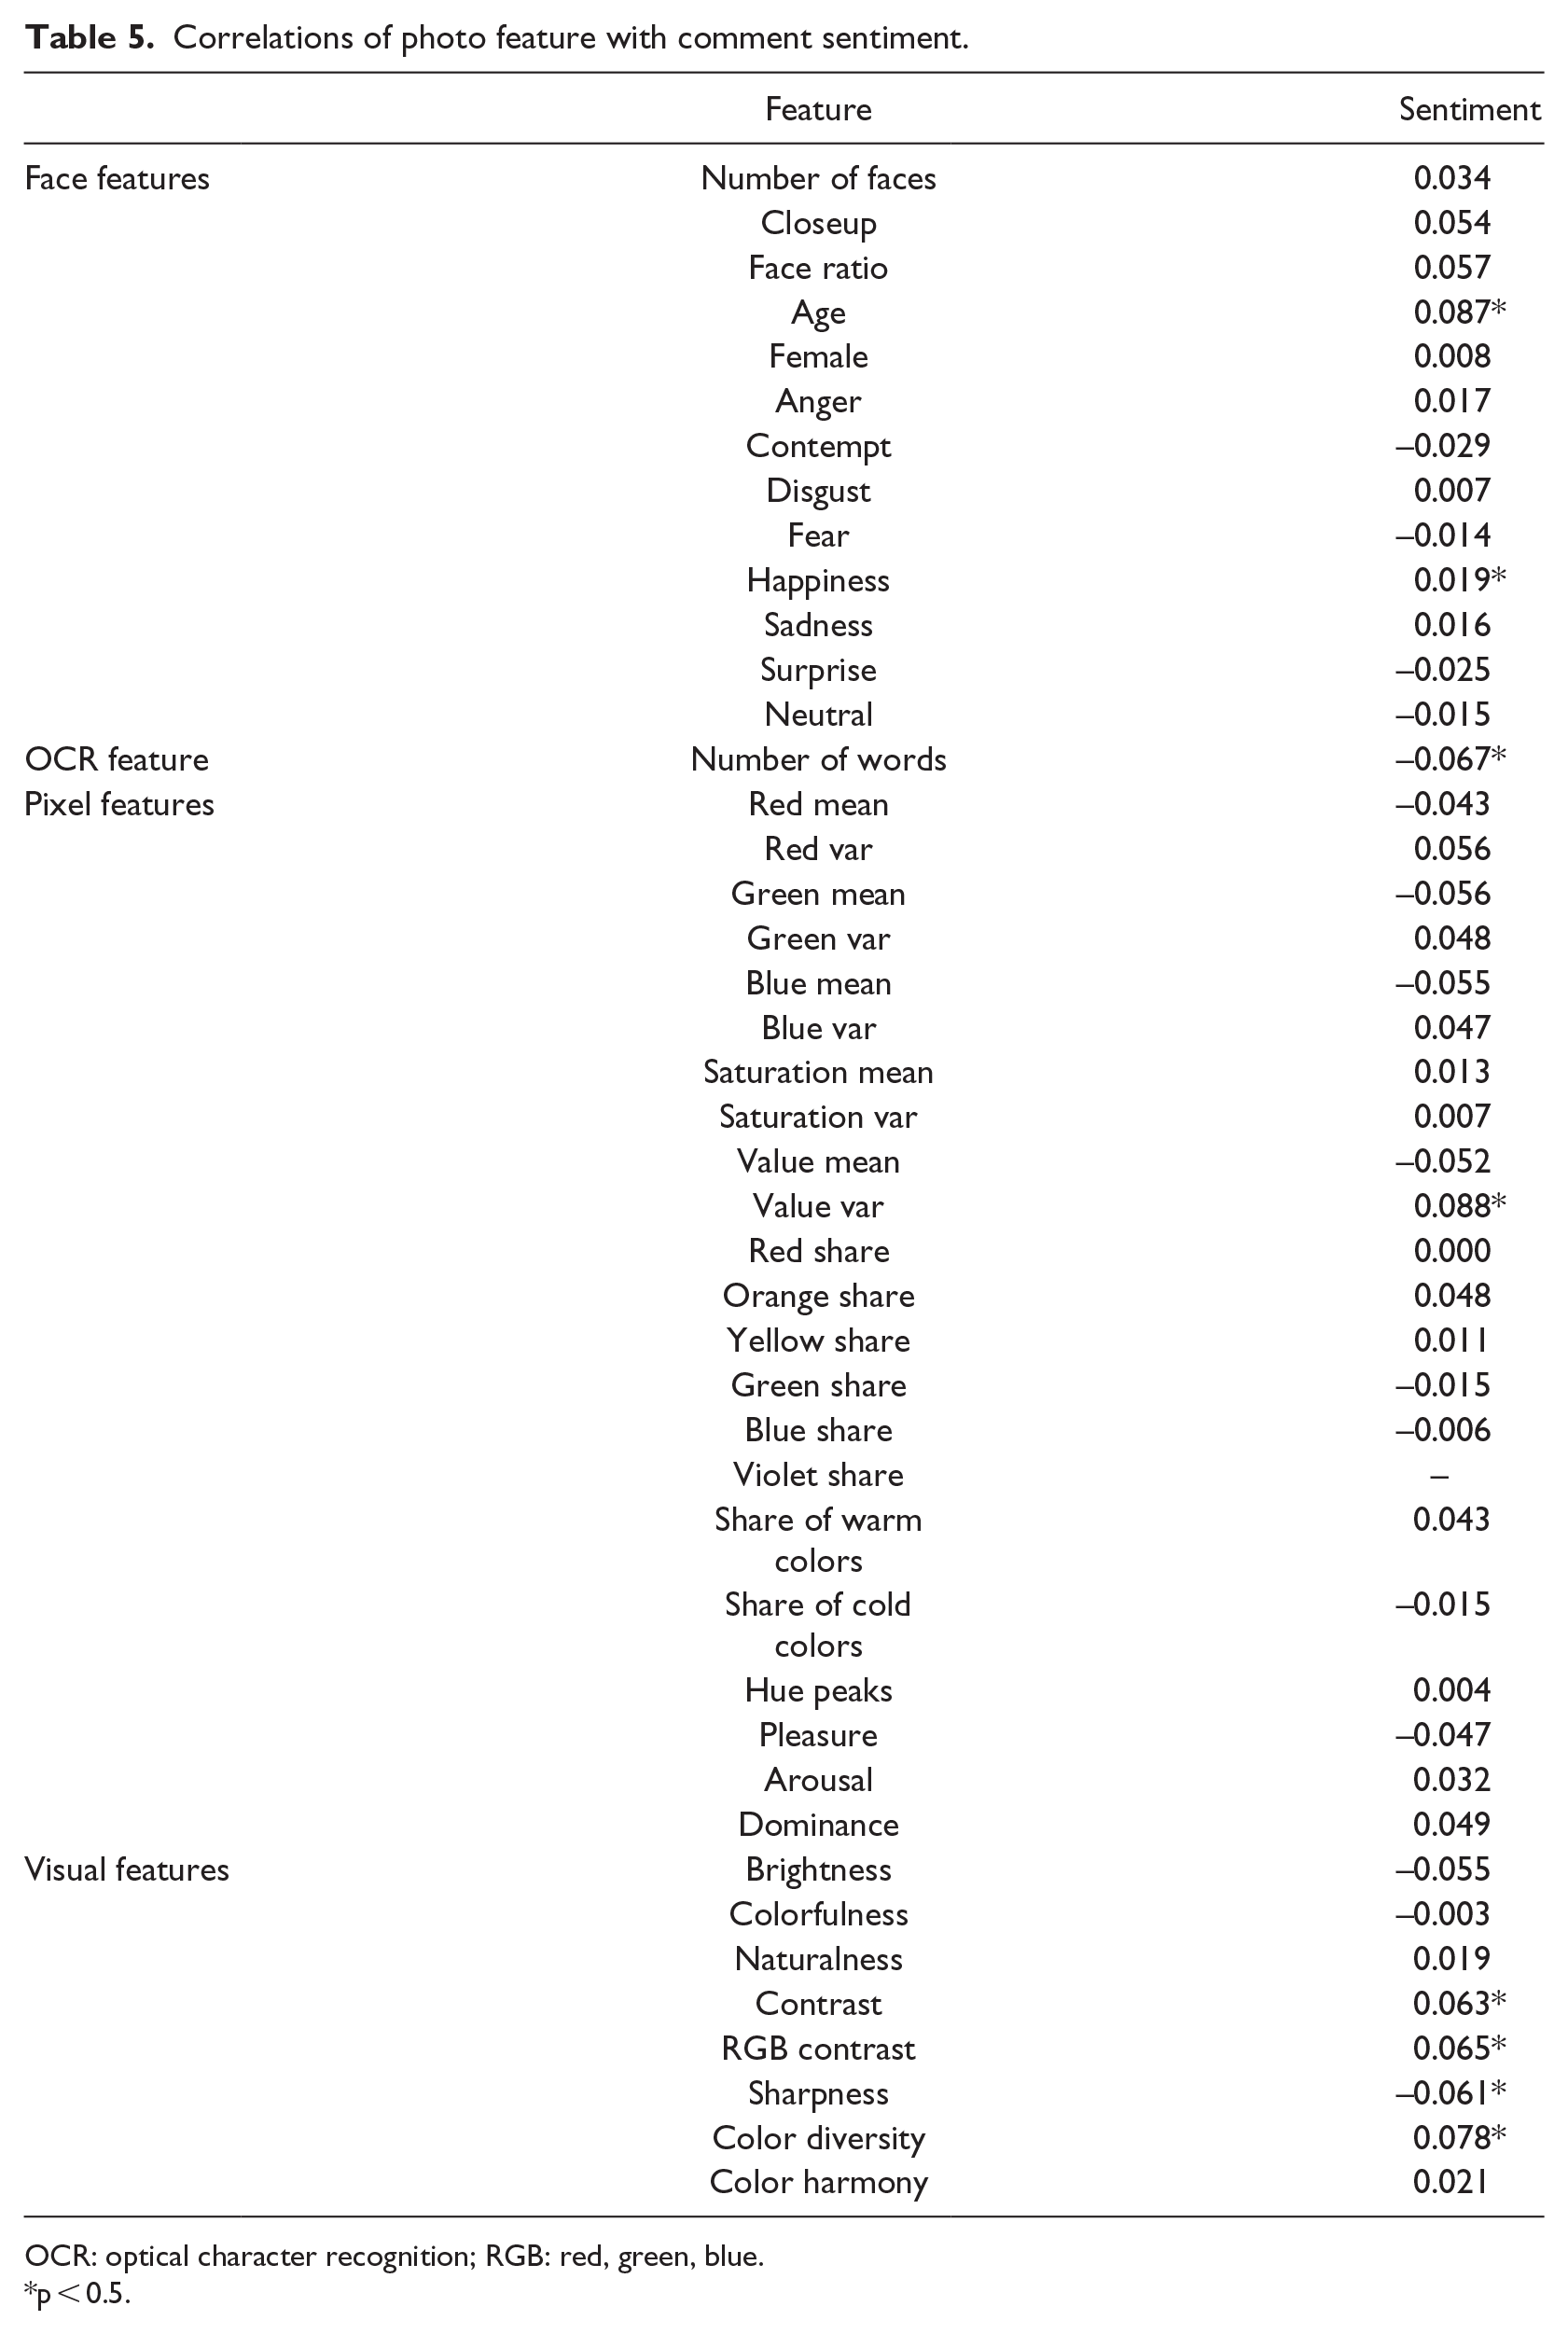
OCR: optical character recognition; RGB: red, green, blue.
p < 0.5.
Finally, predictive models were built in order to investigate how accurately the photo features predict the comment sentiments. Random forest regression models were trained with 10-fold cross validation and their RMSEs are presented in Table 6. Considering the mean and SD of comment sentiment (M: 0.678, SD: 0.208), we can infer that the RMSEs are relatively large and the predictability of photo features on comment sentiments is unsatisfactory.
Root mean square error of 10-fold cross validation of random forest regression to comment sentiment.
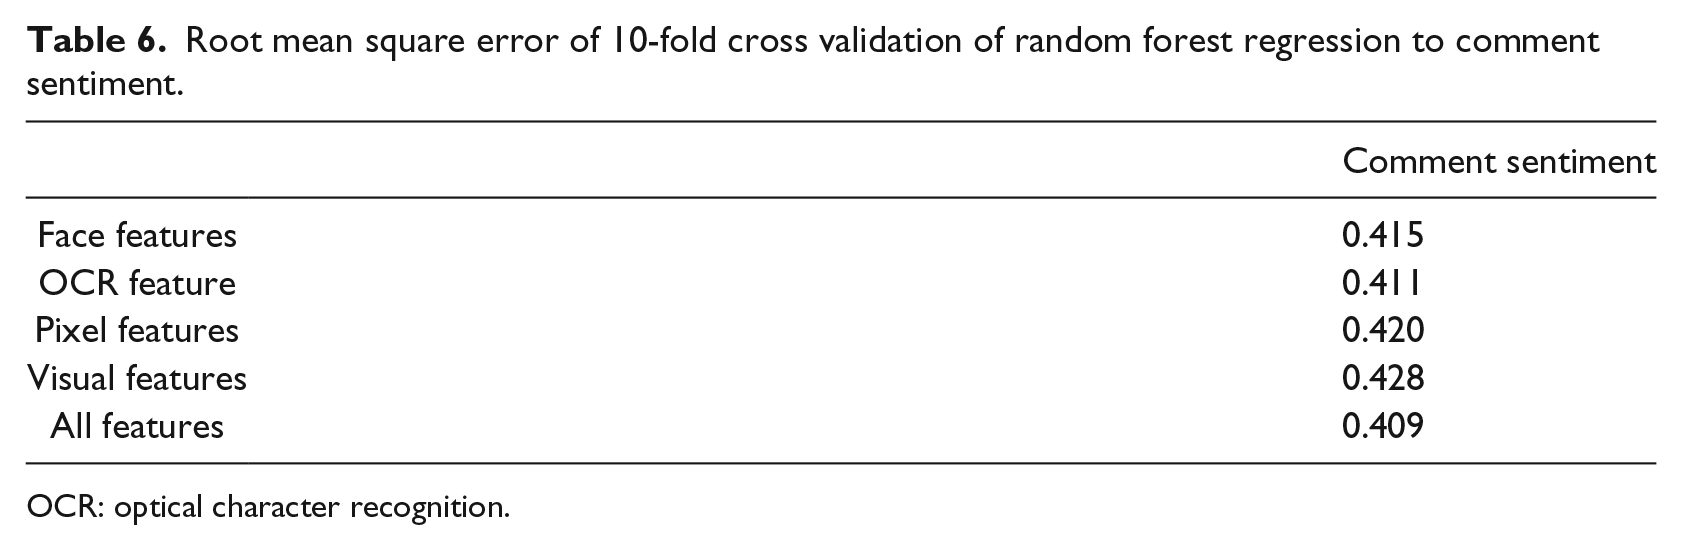
OCR: optical character recognition.
Discussion and implications for social media use for public health
The number of SNS posts in photo form has been dramatically increased. Especially, Instagram has been adopted among a lot of SNS users and many organizations opened Instagram accounts to interact with SNS users through photos. Public health authorities are not the exception, and this study explored the interaction of CDC, one of the representative public health authorities in the United States, with public through photos on Instagram. The content of Instagram photos on CDC account was analyzed, and the engagement and the sentiments of the comments were also analyzed. Major findings and discussions about them are as follows.
First of all, CDC’s major way of delivering messages on Instagram was found to be imprinting the key messages that call for actions on photos and providing the source of complementary information on post texts. This was revealed in the results that the most frequent type of photo was text, the imprinted words on photos were mainly about calling for actions, and the post texts accompanied with photos were mainly about providing the source of more information. However, this can be an efficient way of employing the characteristics of photo medium. Imprinted texts on photos are usually bigger and easier to draw attention than post texts, and it can be an effective strategy to divide key messages in the texts on photos and detailed information in post texts.
Next, however, this way of delivering messages on Instagram was found to be unsuccessful in terms of public’s response. The mean engagement and the mean comment sentiments of text-categorized photos were not relatively high. And the number of words detected by OCR on photos was negatively correlated with both engagement and comment sentiments. These results suggest that imprinting texts on photos can be an inadequate strategy, or, at least, the length of words imprinted photos needs to be shortened. The share of photos that were categorized into text type can be said too large (over one-third, 34.6%), and that the type of photos needs to be diversified from text because text-centered strategy seems not so efficient.
The clue of diversification can be found from other results of this study. It was found that the photo features regarding human faces were significantly related to engagement. Photos with more and bigger human faces had lower level of engagement. At first thought, it seems contrasting with the previous research that personalized narratives, usually presented with human faces, are one of the effective messaging strategies.57,58 Furthermore, happiness and neutral expressed on the faces in photos were negatively associated with engagement. In previous studies, it was reported that affective tone in social media message was a significant predictor of message endorsement. 59 While a group of studies reported that messages with positive emotions were more likely to be propagated, 60 other groups of studies reported that messages with negative emotions were more likely to be effective for campaign.61,62
This contrast may be resolved if we take the “two modes” 63 into consideration: in processing health information, the heuristic mode is sensitive to public messages, negative appeals, and nonprofessional authority while the systematic mode is sensitive to private messages, positive appeals, and both professional and nonprofessional authorities. 63 From this perspective, public seems to respond to CDC’s Instagram message in heuristic mode, and the photos need to be designed to contain less number of and less size of human faces and less amount of happy emotion to induce more engagement from public. Also, the result that surprise in human face was positively correlated with engagement would be a good guide for designing Instagram photo messages.
Next, a part of the low-level features, pixel and visual features, employed for analysis in this study showed significant correlations with engagement. The features whose high values would make the photos look splendid and gaudy, the variances of RGB, the variances of saturation and value, share of warm colors, contrast, and RGB contrast, were negatively correlated with engagement. These results suggest that Instagram photos that are splendid and gaudy can be inadequate to engage with public. Rather, photos with high sharpness, which is clear and keen, would be appropriate as a medium to engage with public.
Finally, comment sentiments showed the relationships with photo features mainly in the opposite to engagement. Photos with more and bigger human faces had lower level of engagement, but it was not the case with comment sentiments. Age and happiness were negatively correlated with engagement but positively with comment sentiments. Surprise and neutral showed significant associations with engagement but not with comment sentiments. Many of pixel features that showed significant correlations with engagement did not show such significant correlations with comment sentiments. Rather, visual features that had significant negative correlations with engagement, contrast, RGB contrast, and sharpness showed their correlations in opposite direction. These results overall indicate that engagement, measured by the number of likes and comments, cannot catch the other area of public responses that can be revealed by comment sentiments. Furthermore, those two metrics even could be opposite. The prediction by photo features was acceptable for engagement but unsatisfactory with comment sentiments. This tells us that how many times the public like and/or comment on the photo message would be grounded on different mechanism to with what sentiments their comments are about. It can be a topic for a future study on why and how this difference occurs. Public health authorities, however, need to have the result in mind and to make careful decisions about a message strategy. The message design should be different depending on whether they aim to increase the number of likes and comments or they aim to induce more positive response from public.
The major implication of this study is that it analyzed SNS photo data and investigated how photos are utilized by public health authority as media for public communication. Visual materials are playing an important role in online communication and their significance has been growing. However, the literature has paid relatively little attention how visual materials are employed for public health communication and how public responds to the visual communication. This study examined this issue and contributes to the body of literature by extending the research realm to the visual materials.
Furthermore, this study revealed the major messaging strategy of public health authority and suggested how it can be improved. In addition, this study showed that the public response to SNS public health communication can have two aspects, engagement and comment sentiment, which can be contrasting to each other. These can have considerable social implication in that they can be a good starting point for designing and implementing effective public health communication.
Also, this study can be meaningful with regard to the research method. It employs online artificial intelligence services for analyzing the content of photos and the sentiment of texts. The computational methodologies of data analysis are getting increasing attention in social sciences, and this study can be an example of applying those methods. In addition, this study utilized various low-level (pixel-level) features for photo analysis. Low-level features can be a path where implicit information can be conveyed, and analyzing them can produce other kinds of results that content analysis cannot. The approach of this study can be extended to analyze other kinds of Instagram photos such as non-governmental organization (NGO), corporate, or government accounts.
The major limitation of this study is that it dealt with only one institution’s one type of social media accounts. Future study might include more Instagram accounts run by diverse public health authorities and compare them among one another.
Footnotes
Declaration of conflicting interests
The author(s) declared no potential conflicts of interest with respect to the research, authorship, and/or publication of this article.
Funding
The author(s) disclosed receipt of the following financial support for the research, authorship and/or publication of this article: This paper was supported by Samsung Research Fund[S-2018-1784-000], Sungkyunkwan University, 2018.