
Abstract
Current mortality prediction models and scoring systems for intensive care unit patients are generally usable only after at least 24 or 48 h of admission, as some parameters are unclear at admission. However, some of the most relevant measurements are available shortly following admission. It is hypothesized that outcome prediction may be made using information available in the earliest phase of intensive care unit admission. This study aims to investigate how early hospital mortality can be predicted for intensive care unit patients. We conducted a thorough time-series analysis on the performance of different data mining methods during the first 48 h of intensive care unit admission. The results showed that the discrimination power of the machine-learning classification methods after 6 h of admission outperformed the main scoring systems used in intensive care medicine (Acute Physiology and Chronic Health Evaluation, Simplified Acute Physiology Score and Sequential Organ Failure Assessment) after 48 h of admission.
Introduction
Early physiological monitoring and laboratory surveillance can aid clinicians in making effective interventions to improve patient outcome. Existing severity scoring systems and machine-learning approaches give rise to challenges in integrating a comprehensive panel of physiologic variables and presenting to clinicians interpretable models early in a hospital admission. This problem has particular importance in the intensive care unit (ICU), as patients are necessarily very unwell and there is considerable complexity. Early hospital mortality prediction for ICU (EMPICU) patients remains an open challenge as the majority of the severity of illness scores developed provide risk assessments for ICU patients based on the first 24, 48 or 72 h of a patient’s ICU stay.1–11 According to research conducted in Luo et al., 1 many measurements are not yet available during the first half of the first day (i.e. first 12 h), as a result data from this time period are usually missing and so excluded from the analysis. However, patients receive a great deal of intervention in this period, imposing a burden upon them and conferring a cost. It is in the interest of both patients and providers that intensive care intervention is delivered only where it is likely to be effective. The early identification of patients who are more likely to survive, and more likely therefore to benefit, may help both patients and providers to make informed choices about their care.
Therefore, this study presents a thorough time-series analysis for hospital mortality prediction during the first 48 h of ICU admission together with examining the impact of missing values on the performance of mortality prediction in order to establish the most effective model for EMPICU patients. The question that emerges is as follows: Given the ICU patients’ medical records, how early in the ICU admission can data mining (DM) methods help in predicting hospital mortality considering the impact of missing measurements, and what are the most effective data mining methods for EMPICU?
This article is organized as follows. The ‘Related work in ICU mortality prediction’ section introduces previous work that has been done in ICU mortality prediction. The ‘Challenges in ICU data’ section presents challenges in ICU data. The ‘Time-series analysis for mortality prediction using data mining (DM) techniques’ section introduces the time-series analysis for ICU mortality prediction presented in this research. ‘A framework for early ICU mortality prediction’ section introduces a framework for early mortality prediction in the ICU. The ‘Results’ discussion’ section discusses the results, and finally the ‘Conclusion’ section concludes the work done in this research.
Related work in ICU mortality prediction
This section highlights some DM challenges in ICU mortality prediction facing medical doctors and data scientists. It provides a review of similar solutions for mortality prediction, including severity scoring systems, real-time models, daily models and DM approaches.
Scoring systems for mortality prediction
Traditional scoring systems for mortality prediction
In this section, we will discuss the following traditional ICU scoring systems: (1) Acute Physiology and Chronic Health Evaluation (APACHE), 9 (2) Simplified Acute Physiology Score (SAPS) 12 and (3) Sequential Organ Failure Assessment (SOFA). 13
Several publications in the literature have discussed and compared mortality prediction models for ICU patients that rely on panels of experts or statistical models.8–10,12,14–17 For example, APACHE 9 and SAPS 12 assess disease severity to predict outcome. The objective of these models is to characterize disease severity from patient demographics and physiological variables obtained within the first 24 h after ICU admission in order to assess ICU performance. These models have been refined for use within specified geographical areas, such as France, Southern Europe and Mediterranean countries, and to Central and Western Europe.3,16–21 Using a very different strategy, Hoogendoorn and others 22 built two prediction models. The methods used were as follows: (1) extraction of high-level (temporal) features from electronic medical records (EMRs) and to build a predictive model; (2) definition of a patient similarity metric with prediction based on the outcome observed for similar patients. Neither approach gave optimal discrimination but the first model, using temporal features (area under the receiver operating characteristic curve (AUROC) = 0.84), was superior to the patient similarity model (AUROC = 0.68). In a recent study,23,24 the authors looked at use of Random Forest (RF) in early ICU mortality prediction; however, the study does not provide time analysis of the proposed framework.
Prediction systems have evolved since their inception but have not always led to improved discrimination. APACHE-III 18 was developed in 1991, and APACHE IV 25 was developed in 2002/2003, which provides length of stay prediction equations, in addition to the prediction capability of earlier iterations. A more detailed comparison of the current APACHE scoring systems is available in Vincent and Singer. 16 Research in Le Gall et al. 19 introduced an expanded SAPS-II by adding six admission variables: age, gender, length of pre–ICU hospital stay, patient location before ICU, clinical category and presence of drug overdose. Results show that the expanded SAPS-II performed better than the original and a customized SAPS-II, with an AUROC of 0.879. However, a study conducted by Gilani et al., 17 comparing APACHE scores and SAPS-II score, showed that the discrimination of APACHE-II (as measured by the AUROC) was excellent (AUROC = 0.828) and acceptable for APACHE-III (AUROC = 0.782) and SAPS-II (AUROC = 0.778) scores. In addition, Kramer and others 26 found that the discrimination of APACHE IVa was superior with AUROC (0.88) compared with Mortality Probability Model–III (MPM) 27 (0.81) and ICU Outcomes Model/National Quality Forum (0.80). 26
Another traditional scoring systems is the SOFA score, 13 which is limited to six organ systems by looking at respiration, coagulation, liver, cardiovascular, central nervous system and renal measurements. For each organ system, the score provides an assessment of derangement between 0 (normal) and 4 (highly deranged).
According to the clinical review conducted by Vincent and Singer, 16 the different types of score should be seen as complementary, rather than competitive and mutually exclusive. Scoring systems have focused on providing increasingly refined methods for benchmarking ICU performance and have laid the foundation for robust systems of quality control, but the use of such tools for individual decision Support remains unproven.
Early scoring systems for mortality prediction
The MPM
28
was described by Lemeshow et al.
28
Initially, 137 variables were considered; using statistical techniques, the relative importance of each variable was determined and only those with a strong association with outcome retained. This resulted in seven variables collected at admission and seven at 24 h. Unlike APACHE and SAPS, this model could be applied at the time of admission. Furthermore, the physiological variables are recorded as affirmative or negative rather than as an actual number. Lemeshow published an updated form of the model, the MPM-II in 1993.
10
This resulted in two models:
Another scoring system for early mortality prediction is SAPS-III. 21 The objective of the development of SAPS-III was the evaluation of the effectiveness of ICU practices; therefore, the focus of the model was on data available at ICU admission or within a day of admission. Missing values were coded as the reference of ‘normal’ category for each variable. In data collection, maximum and minimum values were recorded during a certain time period; missing maximum values of a variable were replaced by the minimum and vice versa. Some regression imputations were performed if noticeable correlations of available values could be exploited. Selection of variables was done according to their association with hospital mortality, together with expert knowledge and definitions used in other severity of illness scoring systems. The objective of using this combination of techniques rather than regression-based criteria alone was to reach a compromise between over-sophistication of the model and knowledge from sources beyond the sample with its specific case mix and ICU characteristics. The study conducted by Poole et al. 14 compared the predictive ability of SAPS-II (originally developed from data collected in 1991/1992) and SAPS-III (developed from data collected in 2002) scores on a sample of critically ill patients. Both scores provided unreliable predictions, but unexpectedly SAPS-III turned out to overpredict mortality compared to SAPS-II.
The MPM and SAPS-III attempt early mortality prediction; however, they were not used in comparison with our model as most of their attributes are not available in the Multiparameter Intelligent Monitoring in Intensive Care–II (MIMIC-II) database and are complex to calculate. On the contrary, the traditional scoring systems – APACHE-II, SAPS-I and SOFA scores – were used.
DM techniques for mortality prediction
Various studies have advocated the use of DM techniques for predicting ICU mortality, such as the one proposed by Calvert et al., 29 which attempts to predict mortality 12 h before in-hospital death. Although the work conducted shows strong predictive accuracy, however, we question the practical utility of the tool, which predicts at a point 12 h from the sampling. It is not clear at what stage in the evolution of a critical care episode that this tool should be employed to best effect. If it were used continuously until such time as a death, it would be very high risk for patients, and for many of them, there already have been a protracted ICU course with the attendant burdens of treatment. While this delay is acceptable where the intended purpose is unit quality benchmarking, it is slow for the purpose of decision support. In contrast, the model proposed in our study attempts to predict in-hospital mortality shortly after ICU admission. It is our hypothesis that accurate prediction of hospital mortality is possible using data collected in the earliest phase of admission.
Another study that attempted early mortality prediction was proposed by Sadeghi et al., 30 which focuses on specific patient diagnosis. The study proposed a novel method to predict mortality using 12 features extracted from the heart signals of patients within the first hour of ICU admission using the MIMIC-III database. Similar to our work, their study showed that the random forest classifier satisfies both accuracy and interpretability better than the other classifiers – linear discriminant, logistic regression, support vector machine (SVM), random forest, boosted trees, Gaussian SVM and K-nearest neighbourhood, producing an F1-score and AUROC of 0.91 and 0.93, respectively. The study indicates that heart rate (HR) signals can be used for predicting mortality in patients in the ICU. In addition, Crawford and others 7 concluded that a decision tree (DT) used in their study provided a clinically acceptable mining result in predicting susceptibility of prostate carcinoma patients at low risk for lymph node spread. On the contrary, Ramon and others 31 reported that the AUROCs of DT-based algorithms (DT learning, 65%; first-order RF, 81%) yielded smaller areas compared to those of naive Bayes (NB) networks (AUROC, 85%) and tree-augmented NB networks (AUROC, 82%) in their study on a small dataset containing 1548 mechanically ventilated ICU patients. Also, the work conducted by Yakovlev et al. 32 showed that overall prediction accuracy was highest (90.0%) for NB in predicting in-hospital mortality for patients with acute coronary syndrome.
Unlike these models, the framework proposed by our study attempts mortality prediction from physiological data, including chart variables, lab tests, vital signs and patient demographics, that are not necessarily related to one specific organ/diagnosis as the ICU is a very complex environment and normally patients get admitted suffering from several conditions. Early mortality prediction is motivated by the intention to assist clinicians and patients in the assessment of the risks and benefits attending intensive care admission. We hold that it is in the interests of patients, or their advocates, to be informed of a quantitative mortality risk, as early as possible, and preferably before committing to burdensome critical care interventions, whenever that is possible.
Similarly, Pirracchio and others 3 reported that Bayesian Additive Regression Trees (BARTs) is the best candidate when using transformed variables, while random forests outperformed all other candidates when using untransformed variables. Other authors achieved improved mortality prediction using a method based on SVMs. 33 Davoodi and Moradi 34 proposed a Deep Rule-Based Fuzzy System (DRBFS) to develop an accurate in-hospital mortality prediction in the ICU employing a large number of input variables. The method developed was evaluated against several common classifiers, including naïve Bayes, DTs, Gradient Boosting and Deep Belief Networks. The AUROC for NB, DT, Gradient Boosting, Dynamic Bayesian Networks and proposed method were 73.51, 61.81, 72.98, 70.07 and 73.90 per cent, respectively.
Many studies show that customized models perform better than traditional scoring systems. 23 Lee and Maslove 35 conducted a retrospective analysis using data from the MIMIC-II database; the study concluded that customized models trained on ICU-specific data provided better mortality prediction than traditional SAPS scoring using the same predictor variables. However, ICU is a very complex environment where patients may suffer from more than one condition, which makes it difficult to specify which customized model to use. Therefore, there is a need for general mortality prediction models, which is the focus of this study.
Challenges in ICU data
There are a number of challenges due to the characteristics of typically available ICU data: (1) attribute selection, (2) missing values in data and (3) the class imbalance problem. In this section, we will briefly discuss each challenge, and the details of how we addressed each of these challenges will be discussed further in the article.
Attribute selection: It is often difficult to decide which attributes in a dataset should be used to construct the model. Therefore, one of the core stages is to select the appropriate attributes; several manual and automatic methods are used to select the attributes.
Missing values: Not all medical variables/tests are measured for all patients within the first few hours of admission; therefore (for each patient), there may be some missing data. Missing values can be handled either by ignoring those records from the dataset that are not complete or by filling in missing values by a number of techniques. 36
Class imbalance: Class imbalance is a major problem in EMPICU, because the number of patients who die inside the hospital is relatively less in comparison with the number who survive. Techniques for dealing with class imbalanced datasets include modifying the dataset (resampling), 36 making the classifier ‘cost sensitive’ 37 or a hybrid method that combines both.
Time-series analysis for mortality prediction using DM techniques
The target of this section is to realize how early is it to predict hospital mortality, considering the impact of missing measurements in early hours of ICU admission. This research performs experimental investigation on ICU patient data using DM classification techniques to predict mortality. Earlier studies 1 have defined early as the first 12 h of admission; others have defined it as 24, 48 or 72 h after admission.1–11 These assumptions triggered work done in this research to perform a time-series analysis for mortality prediction over the first 48 h of ICU admission to try and define how early enough is it to effectively predict mortality in the ICU. The algorithms are evaluated on the PhysioNet/CinC Challenge 2012 Citi and Barbieri 33 dataset. The study considered 4000 subjects with single ICU stays whose age at ICU admission was 16 years or over in Medical ICU (MICU), Surgical ICU (SICU), Coronary ICU (CICU) or Cardiac Surgery ICU (CSICU), and whose initial ICU stay was at least 48 h long admitted. The data used for the challenge consisted of five general descriptors, including age, gender, height, ICU type and initial weight. The remaining variables are 36 time series (measurements of vital signs and laboratory results) from the first 48 h of the first available ICU stay of a patient’s admission, published previously in Citi and Barbieri. 33
We employ the RF, PART “The algorithm name”, Bayesian Networks (BN) algorithms. Random forest is an ensemble learning method for classification that operates by constructing multiple DTs at training time and outputs the class that gets the majority vote of the individual trees. PART uses partial DTs (feature subset selection) to generate the decision list shown in the output. Only the final decision list is used in classification. It produces rules from pruned partial DTs. A Bayesian network is a probabilistic graphical model that represents a set of variables and their conditional dependencies via a directed acyclic graph. 36
The primary outcome was hospital mortality. Performance measures were calculated using cross-validated AUROC to minimize bias. All experiments were done using Weka (Version 3.7.13; University of Waikato, Hamilton, New Zealand). 38 The results noted in Table 3 are AUROC of the average of 10 runs; each run is 10-fold cross-validated. The results are presented in detail in the following sections.
Experiment setting
This section presents the results for the top performing DM algorithms – RF, BN and PART. It is important to note here that we have also evaluated a larger set of algorithms, such as DTs – J48 (DT), SVMs and JRip; however, they were outperformed by the reported methods. Random forest is one of the most accurate learning algorithms available. For many datasets, it produces a highly accurate classifier. It runs efficiently on large databases and it has an effective method for estimating missing data and maintaining accuracy when a large proportion of the data is missing. PART uses partial DTs to generate the decision list shown in the output. Only the final decision list is used in classification. Bayesian networks are an increasingly popular methods for modelling uncertain and complex domains, such as medical diagnoses and the evaluation of scientific evidences. They provide a natural way to handle missing data, allow combination of data with domain knowledge, facilitate learning about causal relationships between variables and provide a method for avoiding over-fitting of data. 36
Methods
A total of 4000 ICU patients and 37 time-series variables were selected from every hour over the first 48 h of a patient’s admission for modelling.
We evaluated each of the three DM algorithms on each of the six versions of the dataset:
Original datasets (original),
Datasets after modified by applying the Synthetic Minority Oversampling Technique (SMOTE), 39 an oversampling technique that involves increasing the size of the minority class with the insertion of synthetic data (original + smote),
Datasets after replacing missing values with the mean (rep1) to handle the issue of missing values,
Datasets after replacing missing values with mean and then applying SMOTE (rep1 + smote),
Datasets after replacing missing values using the EMImputation algorithm (rep2),
Datasets after replacing missing values using EMImputation algorithm and applying SMOTE (rep2 + smote).
Results
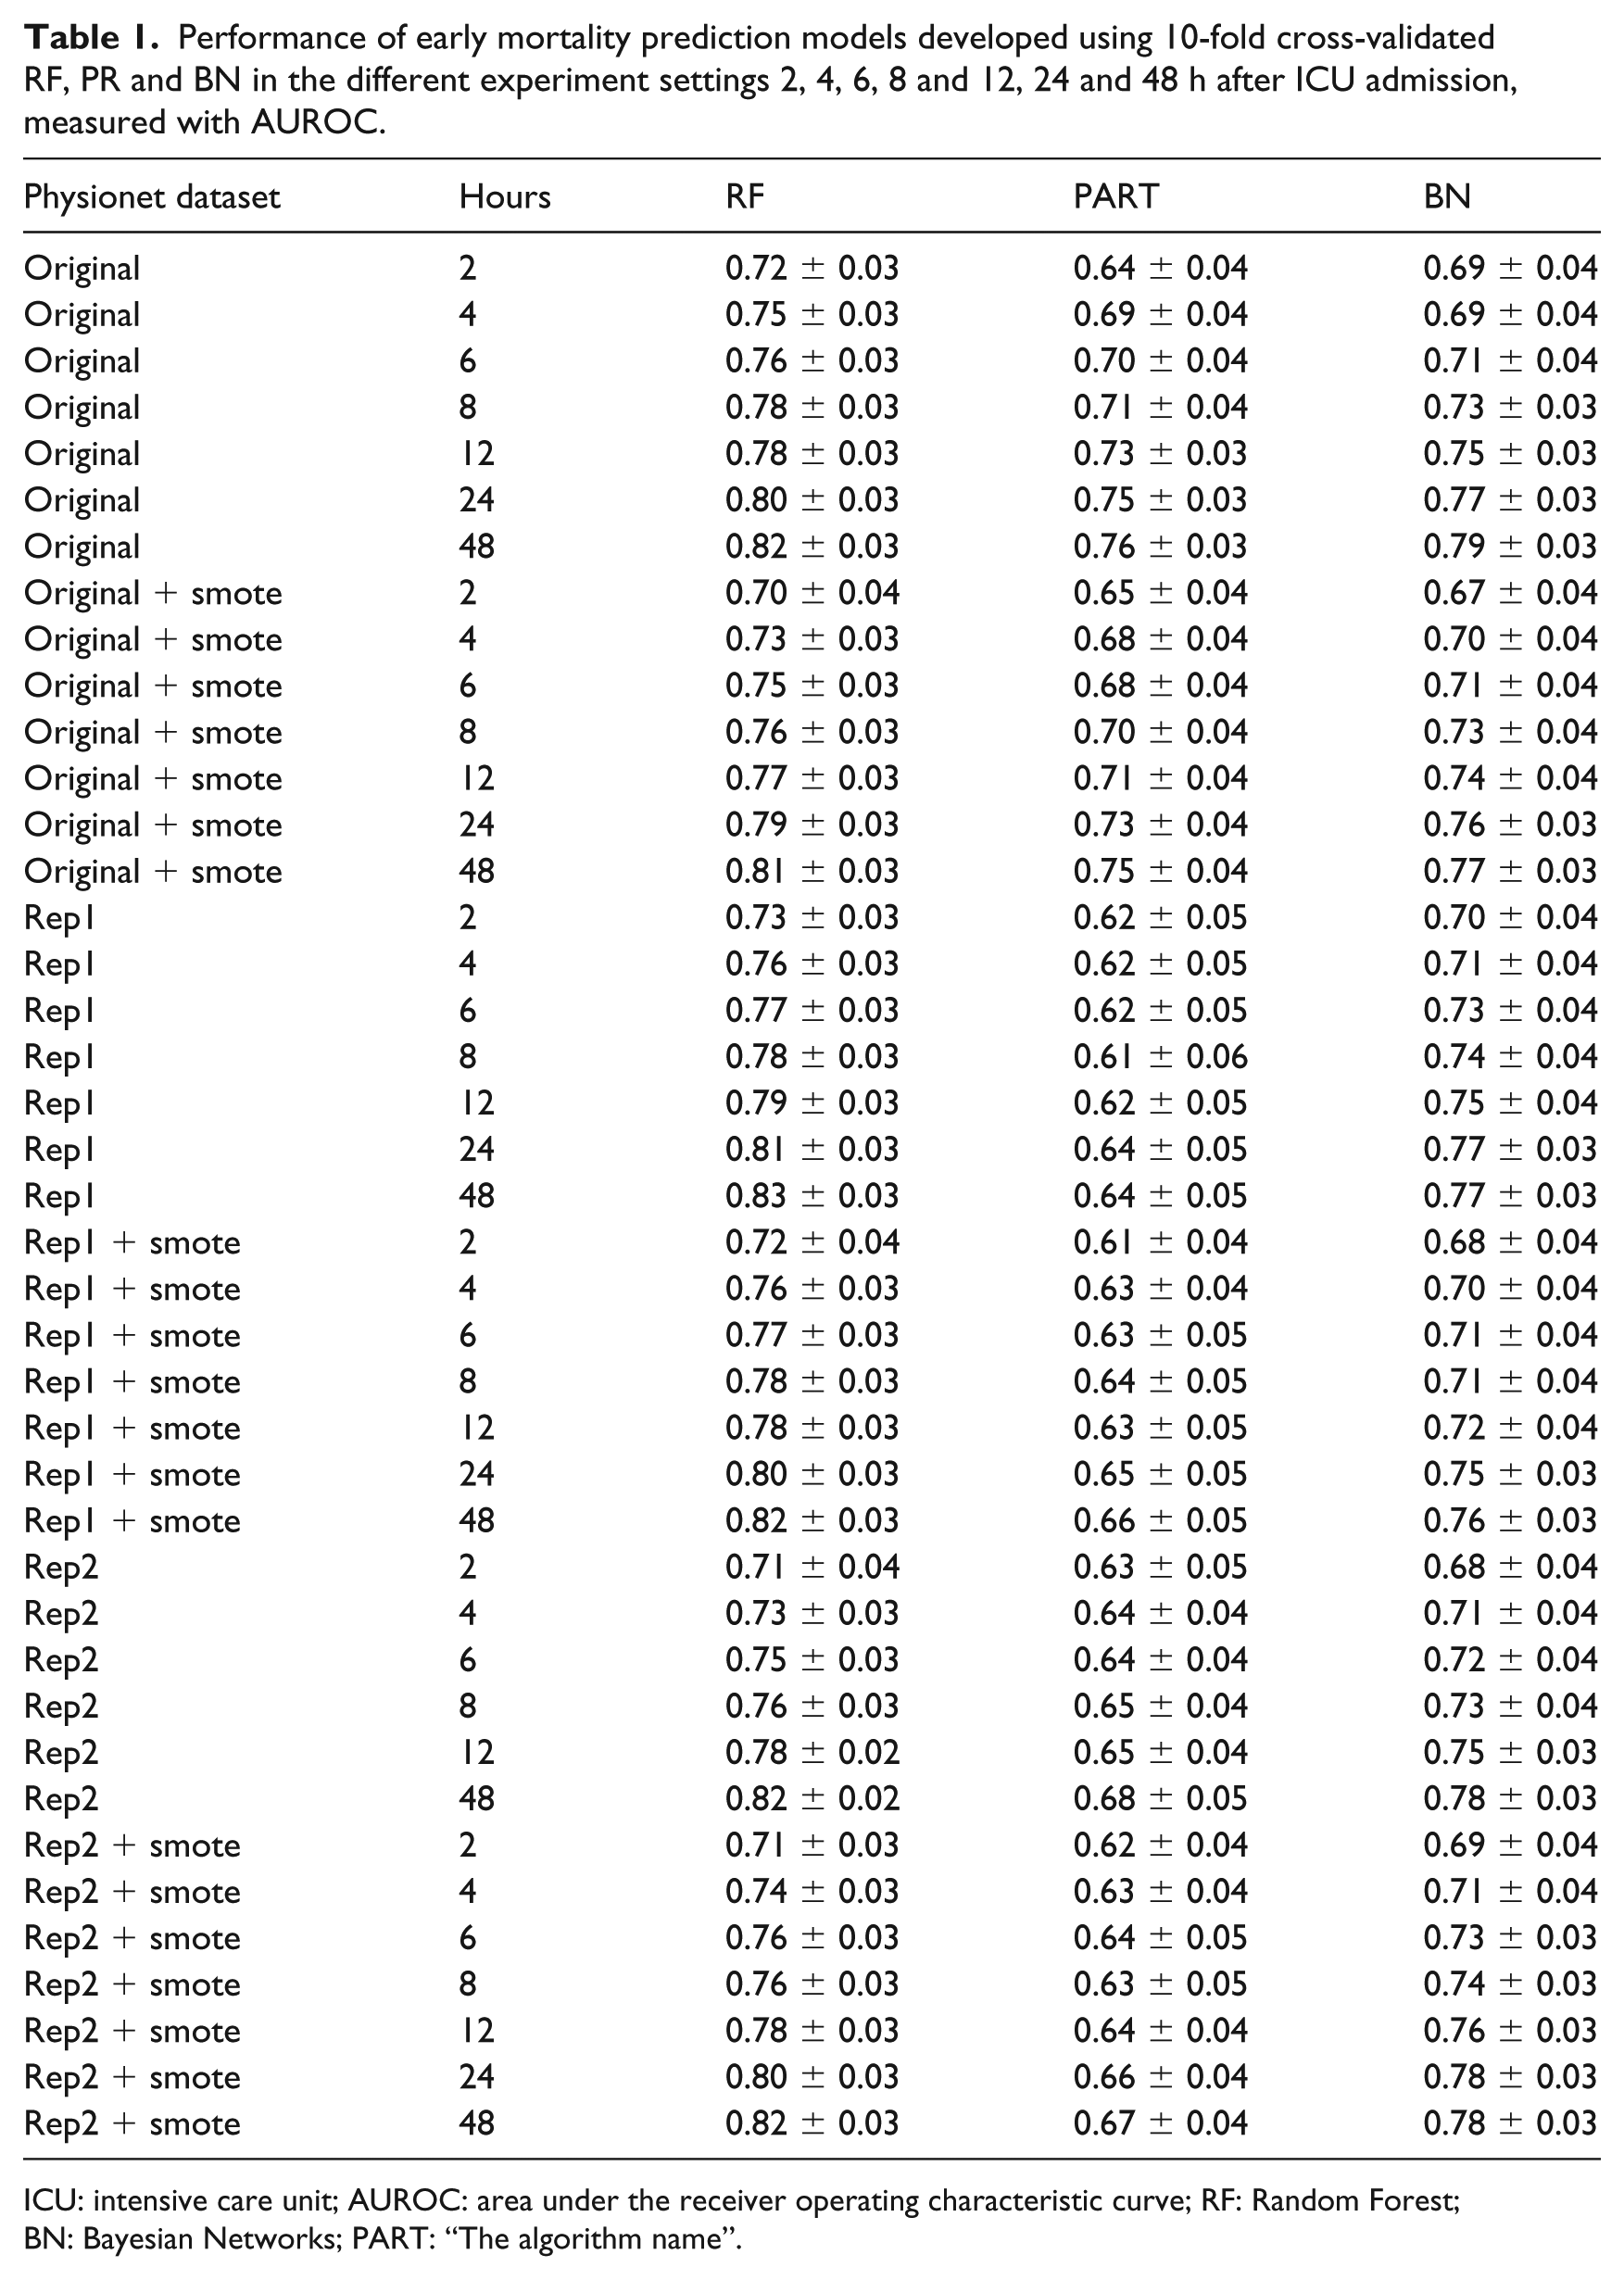
The performance of RF, PART and BN for the six versions of the dataset is displayed in Table 1 for simplicity. The performance of the three algorithms on all the original 48 datasets is displayed in Figure 1(a).
Performance of early mortality prediction models developed using 10-fold cross-validated RF, PR and BN in the different experiment settings 2, 4, 6, 8 and 12, 24 and 48 h after ICU admission, measured with AUROC.
ICU: intensive care unit; AUROC: area under the receiver operating characteristic curve; RF: Random Forest; BN: Bayesian Networks; PART: “The algorithm name”.
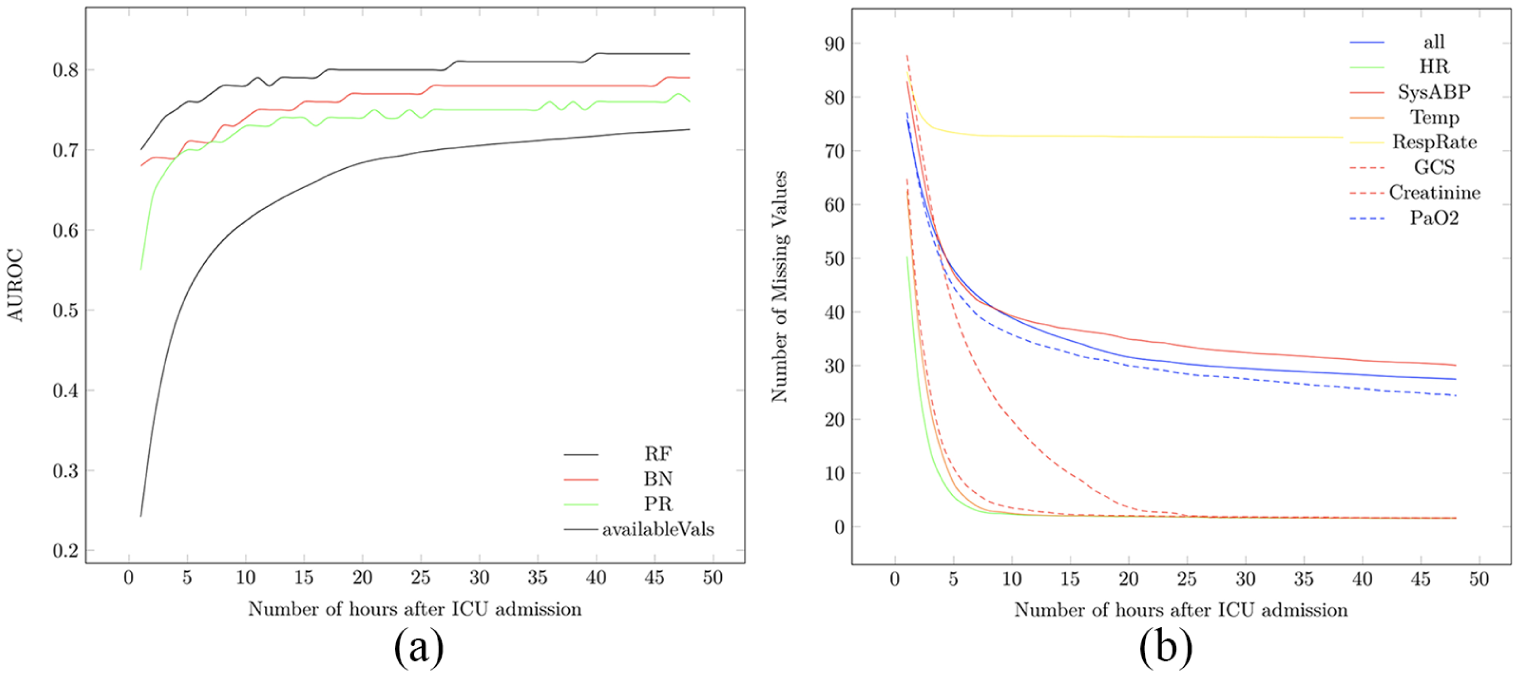
(a) The performance of all algorithms on the Yes class (patients at risk of dying inside the hospital) per hour during the first 48 h of ICU admission together with the percentage of available measurements during the first 48 h of ICU admission. (b) The percentage of missing values of all attributes and vital signs attributes during the first 48 h of ICU admission.
Performance analysis
Table 1 shows the performance of the three machine-learning algorithms (at 0.05 confidence level) in predicting hospital mortality among this patient cohort. Results were obtained on the original, original + smote, rep1, rep1 + smote, rep2 and rep2 + smote datasets, as shown in column 1 of Table 1. Among the six experiment categories, RF performed best, followed by BN then PR. The most effective RF performance model was obtained on the rep1 with AUROC = 0.83 ± 0.03 at hour 48, followed by the original, rep1 + smote and rep2 datasets with AUROC = 0.82 ± 0.03 at hour 40, then rep2 + smote with AUROC = 0.82 ± 0.03 at hour 48.
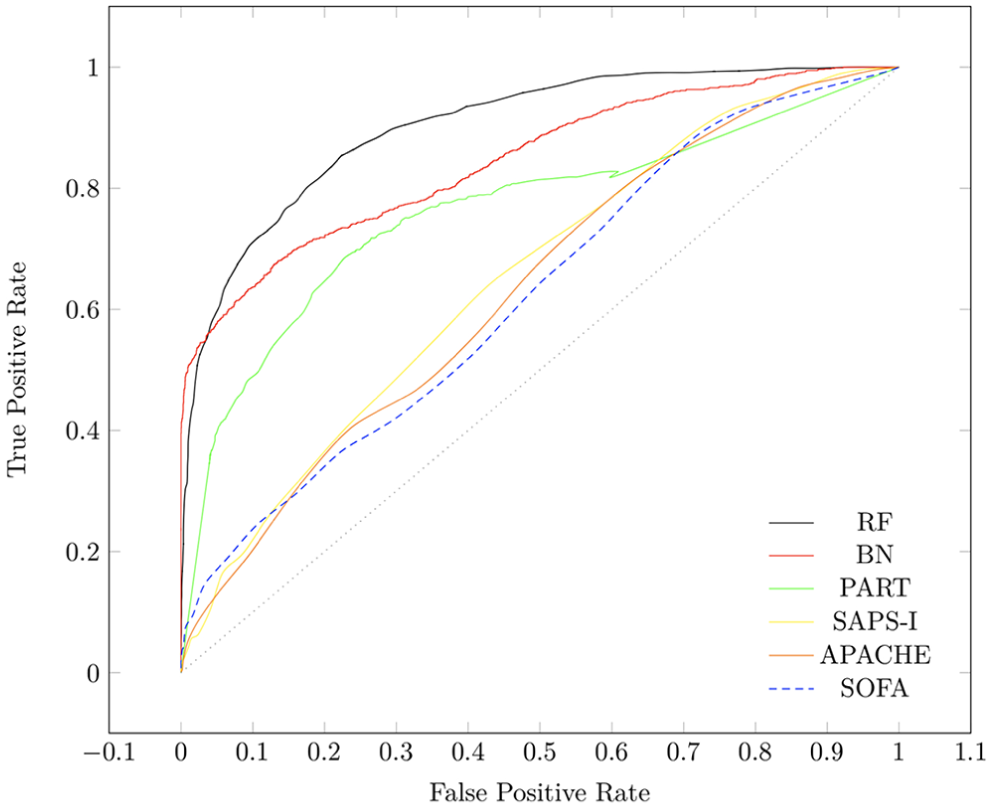
As shown in Figure 1(a), there is a dramatic increase in available measurements shown at hour 6 of ICU admission making it a suitable point for in-depth analysis of our proposed framework. We compared the performance of RF, PART and BN on patient data after 6 h of ICU admission with the performance of SOFA and SAPS scores on patient data after 24 h of ICU admission to figure out whether our proposed early mortality prediction framework (EMPICU) is relatively effective or not. Due to limited number of figures, we only display Figure 2, which displays the performance of all algorithms against SAPS and SOFA scores on only one dataset setting (original dataset). The figure shows that our models after 6 h of admission outperformed the main scoring systems used in intensive care medicine (APACHE, SAPS-I and SOFA) after 24 h of admission. The best performing classifier is RF, followed by BN, then PART. As represented in the graph of Figure 2, the RF model outperforms the main scoring systems (APACHE-II, SAPS-I and SOFA) both in terms of mortality prediction performance (AUROC) and in terms of time (i.e. early prediction; higher prediction performance at 6 h after admission compared to that of the scoring systems at 24 h after admission). Table 2 displays the AUROC and the standard deviation of the best performing model RF at 6 h after admission and the scoring systems at 24 h after admission.
The performance of RF, BN and PART after 6 h of ICU admission compared to SAPS-I, APACHE and SOFA on Rep1 + smote dataset after 24 h of ICU admission on the Yes class (patients at risk of dying inside the hospital).
The AUROC and the standard deviation of the best performing model RF at 6 h after admission and the scoring systems at 24 h after admission.
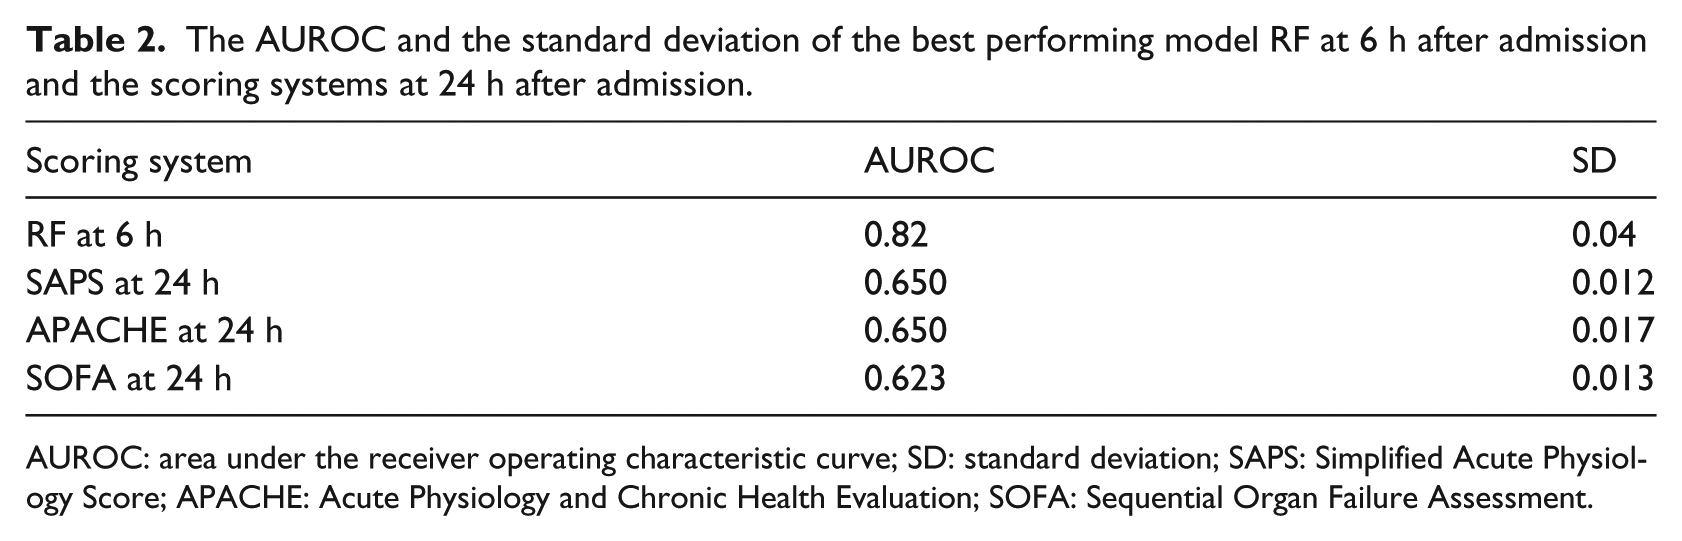
AUROC: area under the receiver operating characteristic curve; SD: standard deviation; SAPS: Simplified Acute Physiology Score; APACHE: Acute Physiology and Chronic Health Evaluation; SOFA: Sequential Organ Failure Assessment.
Missing values analysis
We also analysed the missing values over the 48-h time interval. Results displayed in Figure 1(a) show the percentage of available measurements during the first 48 h of ICU admission. As noted in the graph, a dramatic increase in available measurements is shown at hour 6 of ICU admission and no major increase between hours 24 and 48. In addition, Figure 1(b) displays the percentage of missing measurements of all attributes and vital signs attributes during the first 48 h of ICU admission. As noted on the graph, respiratory rate (RespRate) has the highest percentage of missing values, followed by invasive systolic arterial blood pressure (SysABP), then partial pressure of arterial oxygen (PaO2), while HR, Glasgow Coma Scale (GCS) and temperature (Temp) have the lowest percentage of missing values, while Creatinine is in the middle.
A framework for early ICU mortality prediction
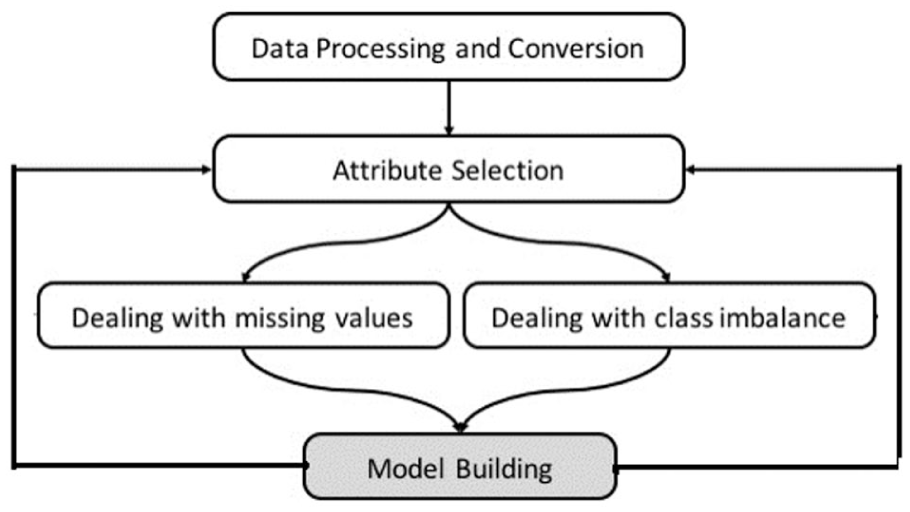
In this section, we present the general framework for dealing with early ICU mortality prediction. Figure 3 illustrates how we handle EMPICU patients in this study. From the previous time-series analysis, it is clear that there are a number of challenges in ICU data. The framework addresses three of these: (1) attribute selection, (2) missing values in data and (3) the class imbalance problem. In this section, we investigate different attribute selections, different methods of handling missing values and class imbalance problem. The focus of the framework in this section is EMPICU patients; by early, we mean the first few hours of admission (i.e. 6 h). We particularly selected the first 6 h, as it is clear from Figure 1(a) that the percentage of missing measurements significantly increases at the 6-h threshold. In addition, after consulting several intensivists and considering gaps in literature, it appeared that analysing patient data at the 6-h threshold is a sensible time point, balancing the need for information early in the admission against data adequacy.
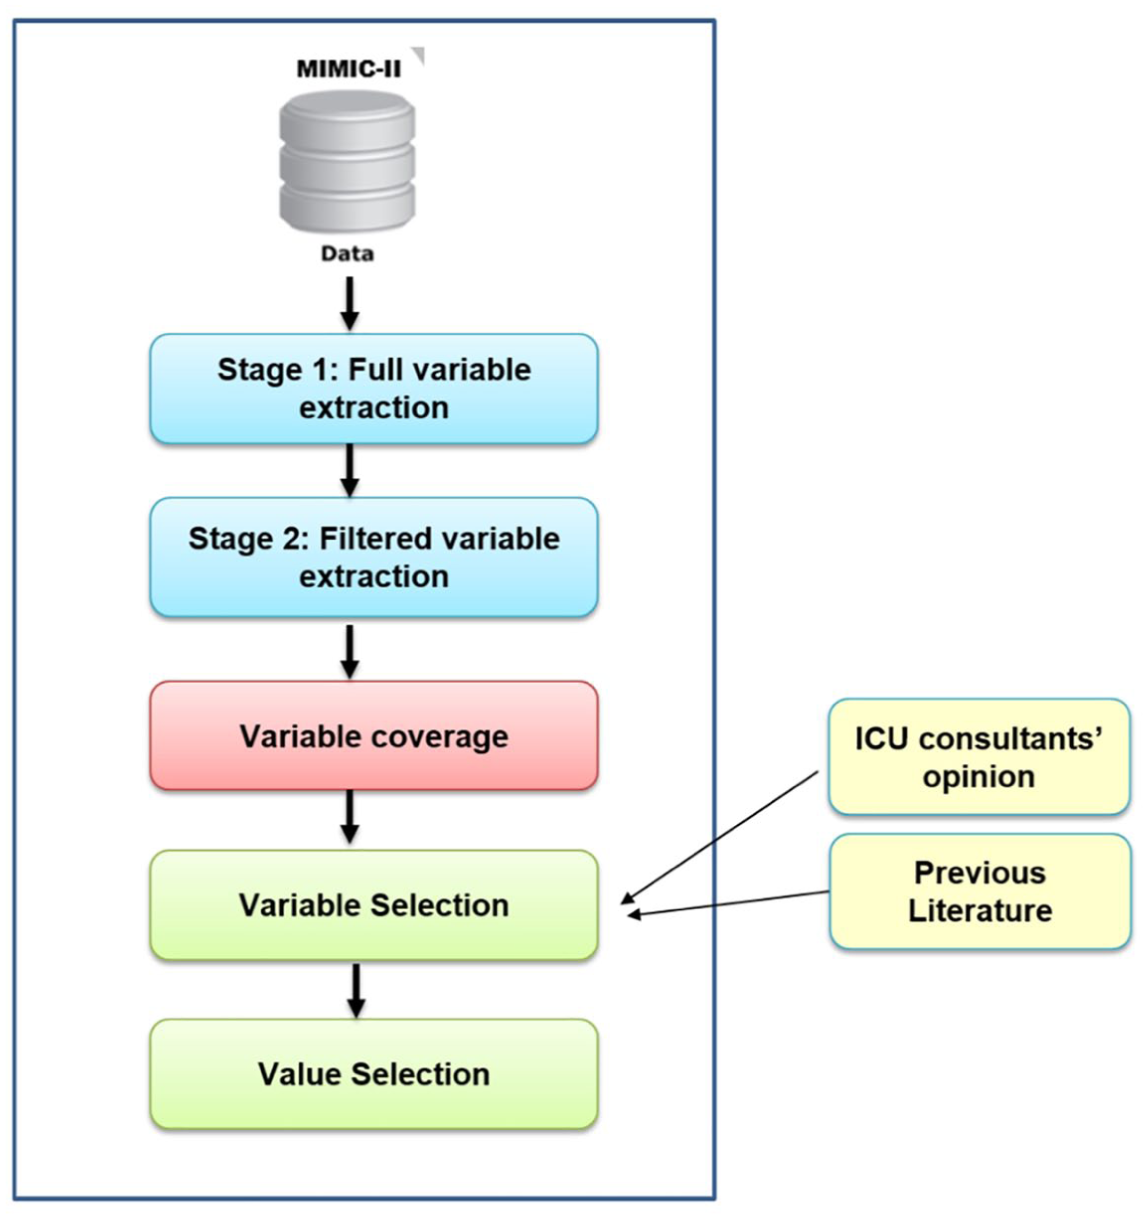
Proposed framework of an early mortality prediction model in the ICU.
In this study, we used the MIMIC-II 40 database for analysis and modelling. In preparing the data for use, an extensive examination of data variables was conducted, which meant making a variety of choices and assumptions. Only patients with a single ICU stay at the age of 16 years old and above in MICU, SICU or CSICU are considered in the analysis; this cohort included 11,722 patients. Also patient mortality is defined as death inside the hospital.
The structure of data in the MIMIC-II database had to undergo some initial preprocessing and conversion in order to prepare it for use in this study, as shown in Figure 3. We initially combined patient chart and lab test variables in one relational database in order to facilitate variable extraction. Data extraction was conducted in two stages, as shown in Figure 4. In the first stage, we extracted all variables for the entire ICU patients in the database; then in the second stage, we filtered the variables based on the required time window, which is the first 6 h of a patient’s admission. The final process of attribute selection was based on three main criteria: (1) attribute coverage (measured for above 10% of the patients), (2) expertise of ICU consultants and (3) proposed variables from previous literature, as shown in Figure 4. We calculated both the coverage of each chart attribute and lab test for patients within the first 6 h to select those variables/tests with high coverage. We only ignored attributes with coverage below 10 per cent. This explains why some common variables in the literature might not be included in this study as they had low coverage in the first 6 h of admission. In addition to the initial statistical experiments on the chart attributes and lab tests, direct consultation with subject matter experts in intensive care medicine, data proposed in previous work and DM algorithms were also considered in attribute selection.
Data extraction process.
The following section discusses thoroughly which attributes are considered in this study. Finally, we extracted the values ( maximum and/or minimum ) for each patient variable within the specific required time window (6 h after admission). It is important to note that there are several methods for selecting variable values. Each variable may have more than one value within the specified time window. For example, HR may have been measured seven times within the first few hours of admission. In this case, the minimum and maximum HR values within the specified time window are both considered, as very low or very high HR values indicate severity. On the contrary, there are some variables that are one direction, such as GCS, in which only the minimum value of the variable indicates severity of illness; that is why the maximum value of the variable is ignored from our attribute selection. However, in the case of RespRate, for instance, only the maximum value is considered as it indicates a more critical patient condition than low RespRate. In summary, we used three strategies for value selection of the attributes: (1) minimum value, (2) maximum value or (3) minimum and maximum values.
Following attribute selection, we used two methods to handle missing values in data: (1) replacing missing values with the mean (Rep1) and (2) replacing missing values using EMImputation. The SMOTE 39 was used to handle the issue of class imbalance. SMOTE is one of the most effective and widely used oversampling techniques that was used by several works in literature41–46 to effectively handle the class imbalance problem. SMOTE increases the number of patient records who die inside the hospital (minority class) by inserting synthetic patient records. We employed RF, PART and BN algorithms to build the models. Building the models was done iteratively using different attribute selections, as shown in Figure 3, discussed thoroughly in the following section.
Selected attributes
We selected 33 chart attributes and 25 lab tests from the initially identified attributes with high coverage. Attributes with higher coverage were considered, resulting in a total of 20 unique variables (age, Temp, HR, RespRate, SysABP, PaO2, GCS, creatinine, fractional inspired oxygen, serum urea nitrogen, potassium, sodium, haematocrit, white blood cells, blood clotting – International Normalized Ratio (INR), platelets count, bilirubin, AIDS, metastatic cancer and type of admission); 29 if we count maximums and minimums.
Results
This section presents the results for the top performing EMPICU DM models – EMPICU-RF, EMPICU-DTs, EMPICU-NB and EMPICU-PART. It is important to note here that we have also evaluated a larger set of algorithms, such as SVMs and JRip; however, they were outperformed by the reported methods. DTs are extremely fast at classifying unknown records. They are quite robust in the presence of noise. They also provide a clear indication of which fields are most important for prediction. The NB algorithm affords fast, highly scalable model building and scoring. It scales linearly with the number of predictors and rows. 47
We conducted three different experiments. In the first experiment, we used all original 20 attributes and in the second we used only vital signs (age in addition to Temp, HR, RespRate, SysABP, PaO2, GCS and creatinine). We evaluated each of the four DM algorithms on each of six versions of the dataset mentioned earlier.
In the third experiment, we used filtered top 10 attributes that provide the highest information gain (IG) (i.e. those variables that contribute to better classification); we eliminated records missing any of the top 10 attributes. The InfoGainAttributeEval algorithm in Weka 38 evaluates the worth of an attribute by measuring the IG with respect to the class. We used four versions of the dataset:
Dataset with eliminated records and the 20 unique variables (original),
Dataset with eliminated records and the 20 unique variables and then applying smote (original + smote),
Dataset with eliminated records and the top filtered ranked variables only (filtered top 10), and
Dataset with eliminated records and the top filtered ranked variables only and then applying smote (filter + smote).
All experiments were done using Weka (Version 3.7.13). The results are noted in AUROC of the average of 10 runs; each run is 10-fold cross-validated. Table 3 ranks the experiments that showed the best performance (highest AUROC) using the best performing model, RF.
The table shows the top AUROC results shown in Table 1
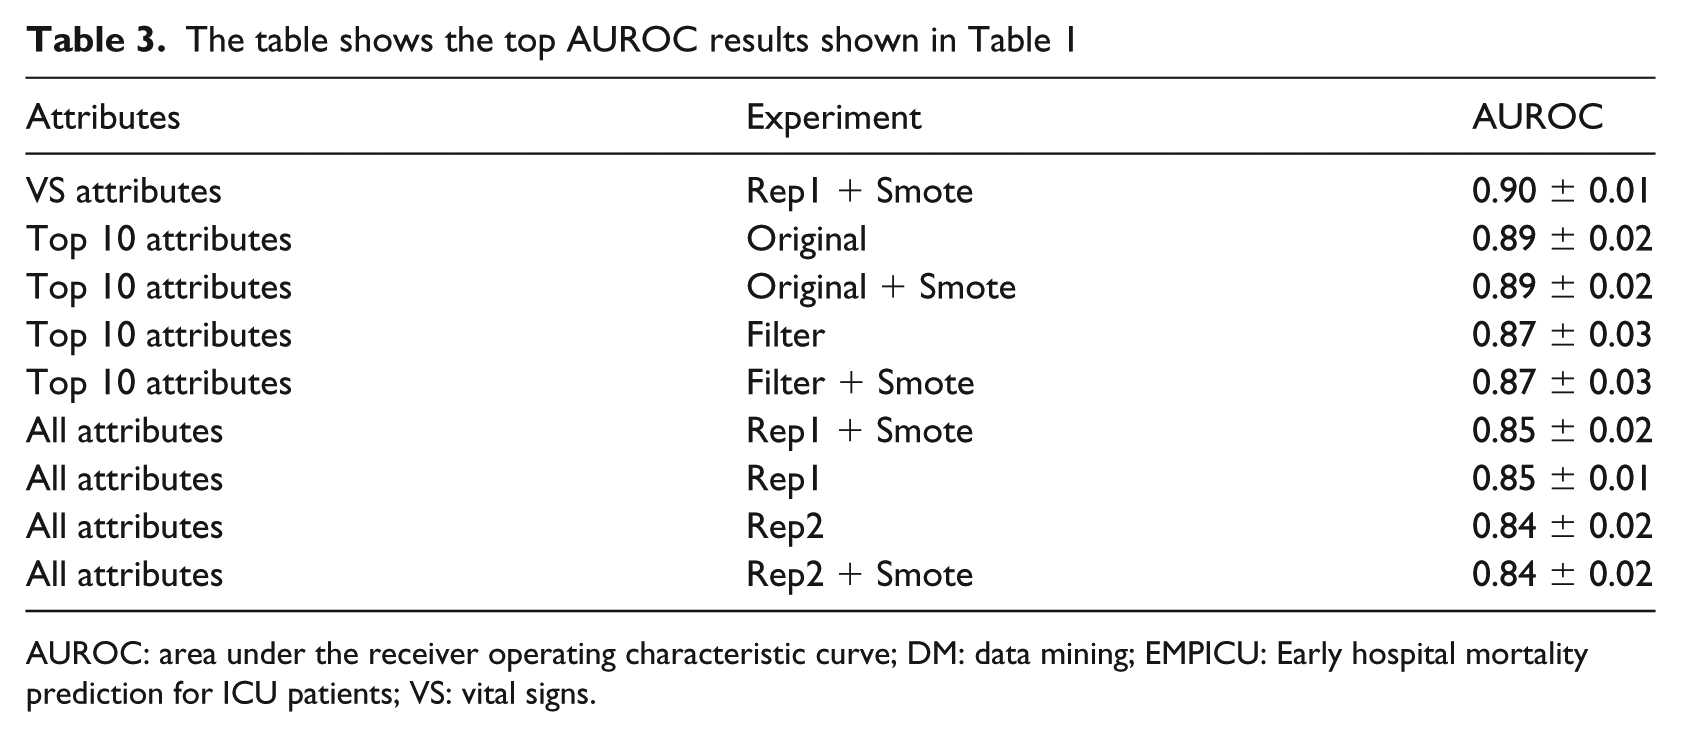
AUROC: area under the receiver operating characteristic curve; DM: data mining; EMPICU: Early hospital mortality prediction for ICU patients; VS: vital signs.
Results’ discussion
By referring to Figure 1(a), when comparing the performance of all algorithms on the Yes class (patients at risk of dying inside the hospital) per hour during the first 48 h of ICU admission, we find that there is an abrupt improvement in performance at the 6th hour of ICU admission, after which the increase in performance is relatively smaller till the 48th hour of ICU admission. Similarly, the percentage of available values in the dataset increases dramatically at the 6th hour of ICU admission and continues to increase gradually till the 48th hour of ICU admission. In general, as time proceeds, the performance of the RF, BN and PART models increases, as shown in Figure 1(a) and Table 1. As displayed in Table 1, in general, both replacing the missing values with mean (rep1) and replacing the missing values with EMImputation (rep2) gave almost similar performance results. In addition, SMOTE oversampling technique has not enhanced the classification performance.
On the contrary, as shown in Table 3, when comparing the performance of all three experiments in the proposed early mortality prediction models – EMPICU, in general applying the SMOTE oversampling technique significantly enhances the classification performance. Both replacing the missing values with mean (rep1) and replacing the missing values with EMImputation (rep2) gave almost similar performance results. In addition, we also find that when using the vital signs and filtered top 10 attributes, the prediction performance is better than when using all 20 unique attributes. In general, in the filtered top 10 experiment categories, the models developed with the original attributes (without any filtering) performed better than those with filtering. In the experiments without filtering, top 10 (original) and (original + smote) performed best (AUROC = 0.89 ± 0.02). As for the filtered experiments, top 10 (filter) and (filter + smote) also performed best (AUROC = 0.87 ± 0.03).
Conclusion
The ICU is an information-rich environment, uniquely suited to data analysis. Several scoring systems and DM methods have been developed to predict clinical deterioration and mortality in the ICU. However, most of these methods are designed for prediction after 1 or more days of admission. To our knowledge, there have been no definitive studies comparing mortality prediction per hour during the first 48 h of a patient’s admission in order to define to clinicians when is the ideal time for ICU data analysis. This article aims to draw attention of the medical and data science communities to the importance of time-series analysis in the ICU taking into consideration the challenge of missing values in early patient data. The work in this research evaluated a wide range of DM methods on 4000 patients (from MIMIC-II database). We acknowledge the specific findings are particular to this database, but the methodology we have used is transferable. We intend to validate this work on the MIMIC-III 48 database, which was released in August 2015, 1 year after this research project has started.
From a DM perspective, the best performing model in this study is the EMPICU-RF, followed by EMPICU-BN and EMPICU-PART. In all experiments, EMPICU-RF performed significantly better than EMPICU-BN and EMPICU-PART (at a 5% confidence level). As mentioned earlier, other algorithms were tested, such as DTs, SVM and JRip; however, their performance was relatively poor. This finding supports work conducted by Ramon et al. 31 Ramon et al. 31 reported that AUROCs of a DT yielded smaller areas compared to an RF (DT, 65%; first-order RF, 81%).
Our results show the following:
There is a sharp improvement in performance at the 6th hour of ICU admission, after which the increase in performance is relatively smaller till the 48th hour of ICU admission.
The percentage of missing values in the dataset drops dramatically at the 6th hour of ICU admission and continues to decrease gradually till the 48th hour of ICU admission.
The discrimination power of the machine-learning classification methods after 6 h of admission outperformed the main scoring systems used in intensive care medicine (APACHE, SAPS-I and SOFA) after 24 h of admission. The best performing classifier was RF, followed by BN, then PART on different experimental settings.
Both replacing the missing values with mean (rep1) and replacing the missing values with EMImputation (rep2) gave almost similar performance results.
SMOTE oversampling technique did not enhance the classification performance when the dataset was 4000 patients only, while it did enhance the classification performance with the larger dataset of 11,722 patients.
For clinicians, this research draws attention to the problem of missing values in variables over time in order to emphasize on the importance of collecting certain measurements early on; this will influence the predictive performance of mortality prediction models. While we fully acknowledge that we have not developed a usable clinical tool in this work, we have shown that there exists rich information signal early in a critical care admission, which can provide guidance about likely individual outcome. We have shown this on a database with incomplete data. It is our view that this signal may in future be further strengthened by refinements to the methodology, which we have used, in order to assist both clinicians and patients in early outcome prediction.
Footnotes
Declaration of conflicting interests
The author(s) declared no potential conflicts of interest with respect to the research, authorship, and/or publication of this article.
Funding
The author(s) disclosed receipt of the following financial support for the research, authorship, and/or publication of this article: A PhD scholarship from the Arab Academy for Science and Technology, Egypt.