
Abstract
Learning from patient safety incident reports is a vital part of improving healthcare. However, the volume of reports and their largely free-text nature poses a major analytic challenge. The objective of this study was to test the capability of autonomous classifying of free text within patient safety incident reports to determine incident type and the severity of harm outcome. Primary care patient safety incident reports (n=31333) previously expert-categorised by clinicians (training data) were processed using J48, SVM and Naïve Bayes.
The SVM classifier was the highest scoring classifier for incident type (AUROC, 0.891) and severity of harm (AUROC, 0.708). Incident reports containing deaths were most easily classified, correctly identifying 72.82% of reports. In conclusion, supervised ML can be used to classify patient safety incident report categories. The severity classifier, whilst not accurate enough to replace manual processing, could provide a valuable screening tool for this critical aspect of patient safety.
Keywords
Background and significance
Harm associated with healthcare is the third leading cause of death in the United States. 1 It affects over 10% of patients in hospital2,3 and 2%–3% of those seen in primary care settings. 4 A patient safety incident is said to occur when a situation that could have resulted, or did result, in avoidable harm to a patient is observed during healthcare delivery. 5 Many of these incidents can involve life and death moments.
Healthcare has a poor record of creating actionable learning for quality improvement from patient safety incident reports. 6 One important reason for this is that the most important information is described in the free-text part of an incident report. While every incident report is read and actioned locally, it is often not until they are aggregated that patterns become apparent. To aggregate these data though, it must be categorised in the same manner and to the same standard. A traditional approach of establishing a classification framework, creating categories and rules for applying them and then training coding clerks is invariably defeated by the logistics. For example, in England and Wales, over 100,000 patient safety incident reports are submitted by frontline clinical staff every month. 7 On a national level, only a small proportion of patient safety incidents a year is ever analysed for causation.8,9 This is a remarkable and troubling failure to use data that have already been collected to protect patients from harm and inform health system improvements. Rather than focusing decisions on which small minority of incidents to prioritise for analysis, 10 a potential solution is natural language processing (NLP) used in conjunction with machine learning (ML). Together, they can convert unstructured free text into structured information autonomously.11–15 Automatically and accurately assigning incident categories to incident reports would remove a major manual component of our current patient safety strategy on a national level.
A predeterminant of success of a supervised NLP implementation is the availability of large quantities of suitable training data from which the machine can learn 11 and which have been categorised by a domain expert. 13 The recent Primary Care Patient Safety (PISA) study 16 provided a unique corpus of primary care patient safety incident reports that had been read, categorised and coded by trained clinicians with expertise in patient safety and human factors.
Aim
This study aimed to test the capability of NLP/ML to classify unstructured free text within patient safety incident reports in two main themes: the incident category and harm severity. Each incident had been previously classified manually by an expert clinical and human factors team applying a classification framework that had been developed and validated by the research group. 16 For each of these, the study sought to examine whether this could be achieved using just the unstructured free-text description of an incident report alone or whether the addition of structured categorical data (routinely collected as part of incident reports, such as specialty) improved the success of the autonomous classification.
Materials and methods
Classifiers
This study tested supervised ML classifiers, which use preexisting categorised data to derive learning. 17 ML classifiers and techniques, which are able to classify text in documents, including within-patient safety incident reports, were identified through literature review. For each research question, three different ML classifiers were trained and subsequently evaluated – Naïve Bayes (NB), J48 and Support Vector Machine (SVM) with a polykernel. J48, NB and SVM were chosen since they have been successful in classifying medical incident reports in previous studies18,19 and represent two distinct approaches to supervised ML, namely generative and discriminative models: 20
NB, a traditional generative classifier, has repeatedly demonstrated success in document classification tasks. 15
J48’s decision tree structure provides an output that can be intuitively checked by domain experts with limited ML/NLP experience, allowing validation of the core logic of the tree. 21
SVMs are discriminative classifiers which can cope well with training data consisting of large numbers of irrelevant features, as is the case with our text data. For this reason they have consistently outperformed other classifiers in a number of text categorisation tasks. They are also less prone to class imbalance problems. 22
Data sources
Patient safety incident reports are principally a free-text description 23 with additional categorical values such as location and time to add context. As part of the PISA study, the incidents have been categorised against a framework which was iteratively developed, validated and described in detail elsewhere (the PISA framework). 7 Categories were applied using the Recursive Model of Incident Analysis, which ensures a chronological listing of incidents culminating in the event that directly harmed the patient. 7 This leads to several levels of incident type – ‘primary’ denoting the incident directly impacting the patient, and then subsequent levels show the chain of events and factors that may have contributed to the incident. The PISA study 16 also reclassified the severity rating. This was used in the present study.
Subset
Incidents that had been categorised as part of the PISA study and related studies were extracted from the database at Cardiff University. Those that had not been categorised by the main PISA incident and severity framework were removed, leaving 31,333 incident reports. There were 16 categorical variables and 4 free-text variables of data extracted for all incident reports (see Appendix 1). One free-text category was rarely completed and often with similar material and therefore was treated as categorical. The data were then split into two subsets – one including just the free-text ‘description of what happened’ field and another that included all the columns of data available to allow evaluation of whether the additional columns of categorical data assisted the classifier or not. The data were then converted into the Attribute-Relation File Format ready for importing into the ML software, as per previous studies in the area.19,24
Dataset processing – characteristics
Figure 1 shows the class imbalance inherent at a high level, with 12,649/31,333 (40.4%) incidents in the ‘0 – Incorrect use of system’ category, compared to only 501 (1.6%) in the ‘10 – Other’ category. Therefore, the ‘0 – Incorrect use of system’ category and ‘6 – Medications’ categories were expanded to their second-level categories to reduce the class imbalance. Figure 2 shows the incident categories after the expansion.
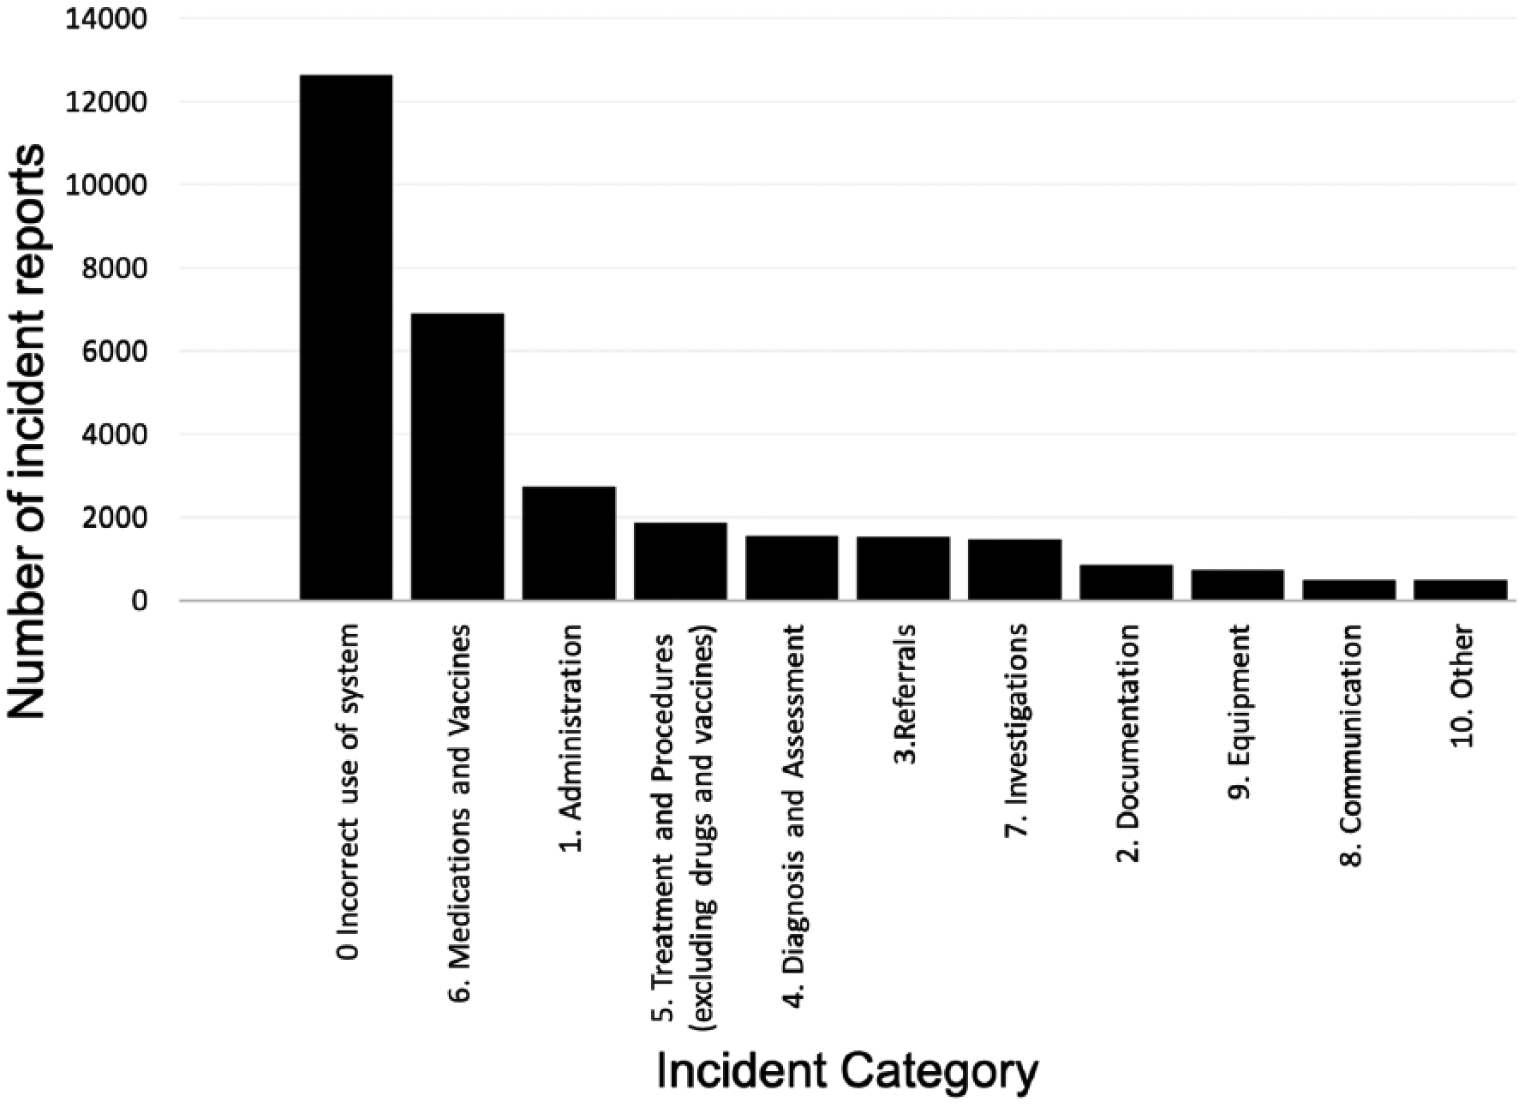
Number of incident reports by highest level incident categories (0–10).
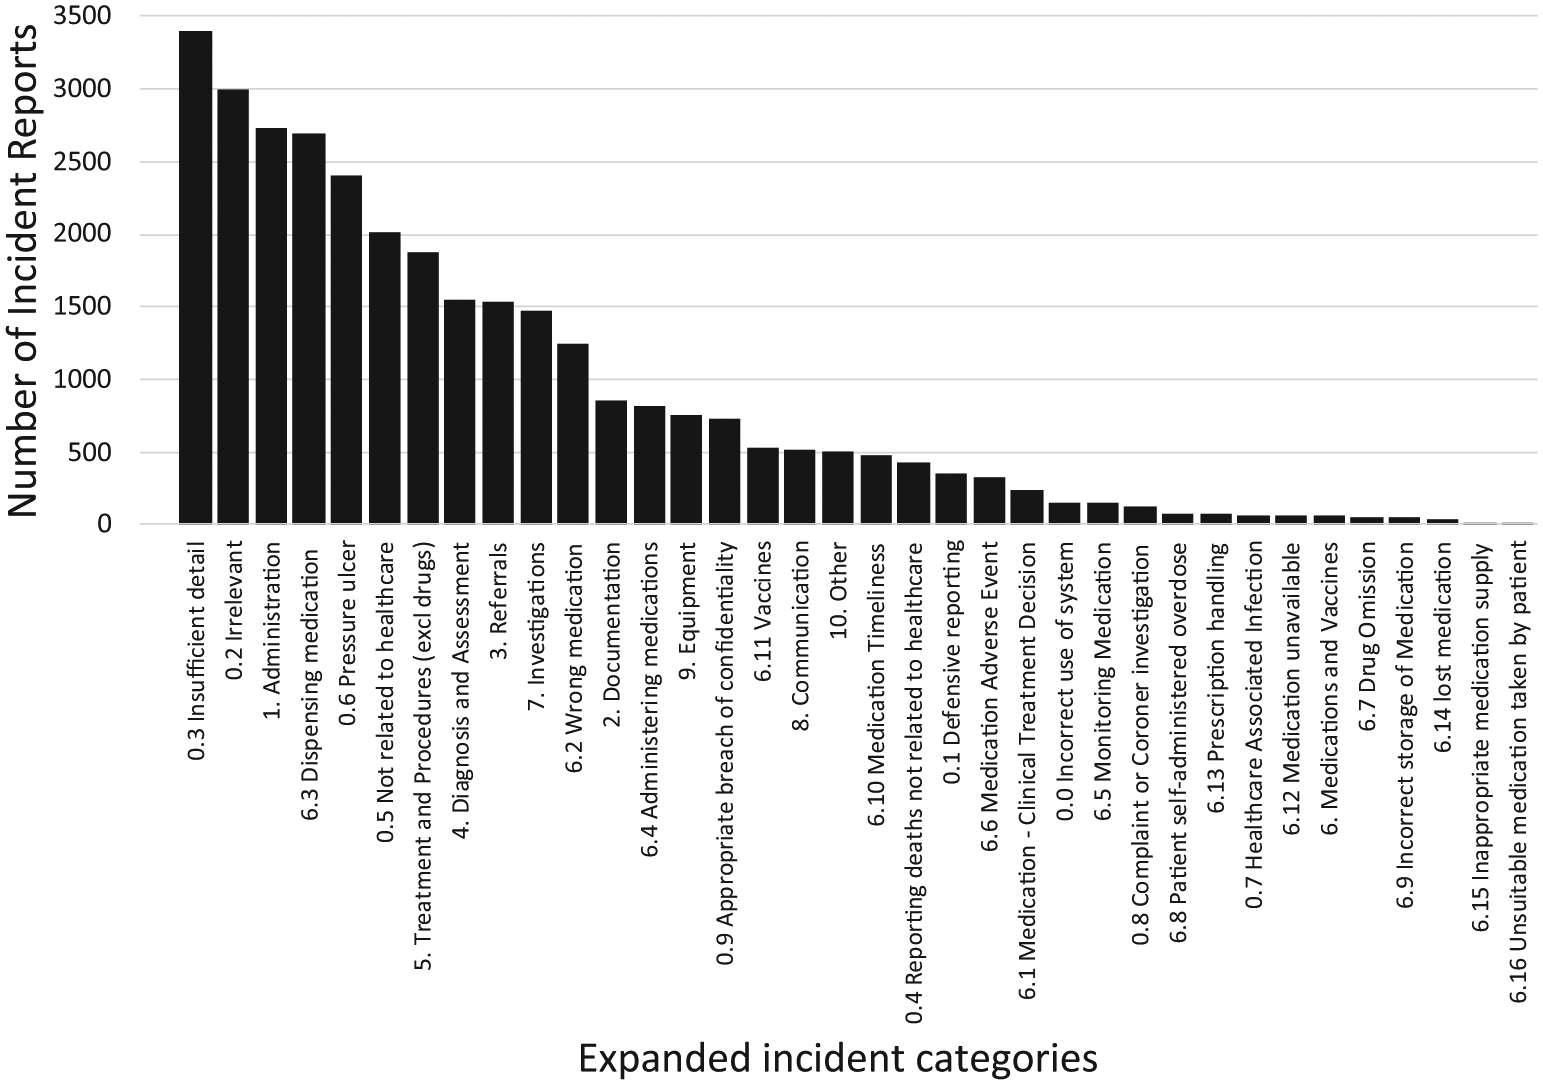
Number of incident reports by expanded incident categories (0.1–10).
Figure 3 shows the incident severity categories. There were 19,323 (61.7%) incidents that did not contain a severity category since they involved categories that were excluded from severity assessment during the PISA study (e.g. ‘no harm from primary care’ or ‘defensive reporting’).
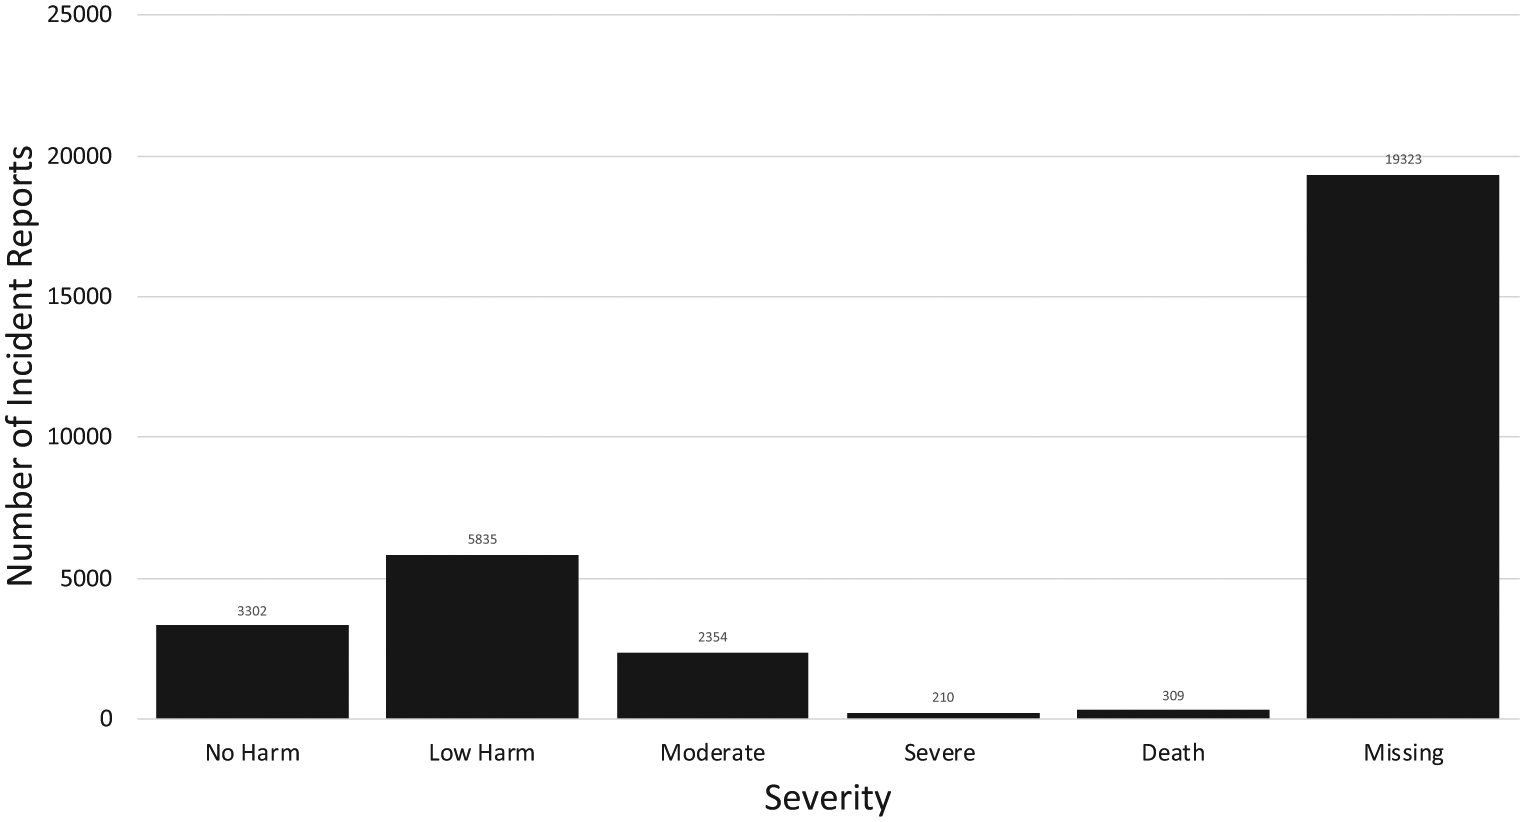
Number of incident reports by severity.
Software
Data were accessed and extracted through Microsoft SQL Server 2014, hosted on a secure Microsoft Windows Server 2012R2 instance at Cardiff University. Data were subsequently imported into the Waikato Environment for Knowledge Analysis (Weka) 3.8.0, an NLP and ML environment. 25 Weka is regularly used in healthcare document classification and has been used in previous studies into incident report classification.18,19
Preprocessing incident reports
All free-text variables were first processed using the Weka’s StringToText filter to create a uniform representation for the reports. The following procedures were applied:
Data security
All data were stored and accessed on a designated patient safety research computing cluster at Cardiff University, which has been designed with full NHS Information Governance Toolkit assurance for secondary use of data (IG Toolkit ID: 8WG65-PISA-CAG-0182). All data were stored and accessed in accordance with a data sharing agreement between NHS England and Cardiff University.
All data were anonymised by NHS England, compliant with the highest standards of information governance regulations, before being received by Cardiff University.
Training and testing the individual classifiers
Each classifier (e.g. SVM, NB) was trained and evaluated using a stratified 10-fold cross-validation technique built into Weka, ensuring the maximum amount of training material was available for the training while also ensuring rigour and reproducibility.15,19
Statistics and analyses
Some types of incident reports are naturally reported more frequently (such as those related to medications and vaccines 16 ) leading to a ‘class imbalance’. The area under the receiver operating curve (AUROC) was chosen as our primary outcome measure since it provides a single global measure of performance even in imbalanced data. 31 Previous studies in ML/NLP have shown an AUROC of approximately >0.8 as being satisfactory and the closer to 1.0 the better.32,33 However, to allow comparability with previous NLP and ML studies in this field, percentage correct and incorrect, precision, recall and F-measure are also reported. Weighted average values, as natively produced by Weka, are reported.
Ethical research considerations
The training data used for this current study were generated as part of the NIHR HS&DR study – ‘Characterising the nature of primary care patient safety incident reports in England and Wales: mixed methods study’–the PISA study, which analysed patient safety incident reports submitted to the National Reporting and Learning System from primary care in England and Wales between 2005 and 2013. 7 The PISA study did not require Health Research Authority’s Research Ethics Committee (REC) approval and the Aneurin Bevan University Health Board research risk review committee waived the need for ethical approval (ABHB R&D Ref number: SA/410/13). Ethical approval for the current study was granted by the Swansea University REC (REF: 040816).
Results
Incident type classification – highest level incident categories (0–10)
Table 1 shows the results of the ML categorisation for the highest level incident categories. SVM had the highest AUROC, improving from 0.839 to 0.854 with the additional columns of data available (see Appendix 2).
Results of incident-type categorisation for the highest level incident categories.
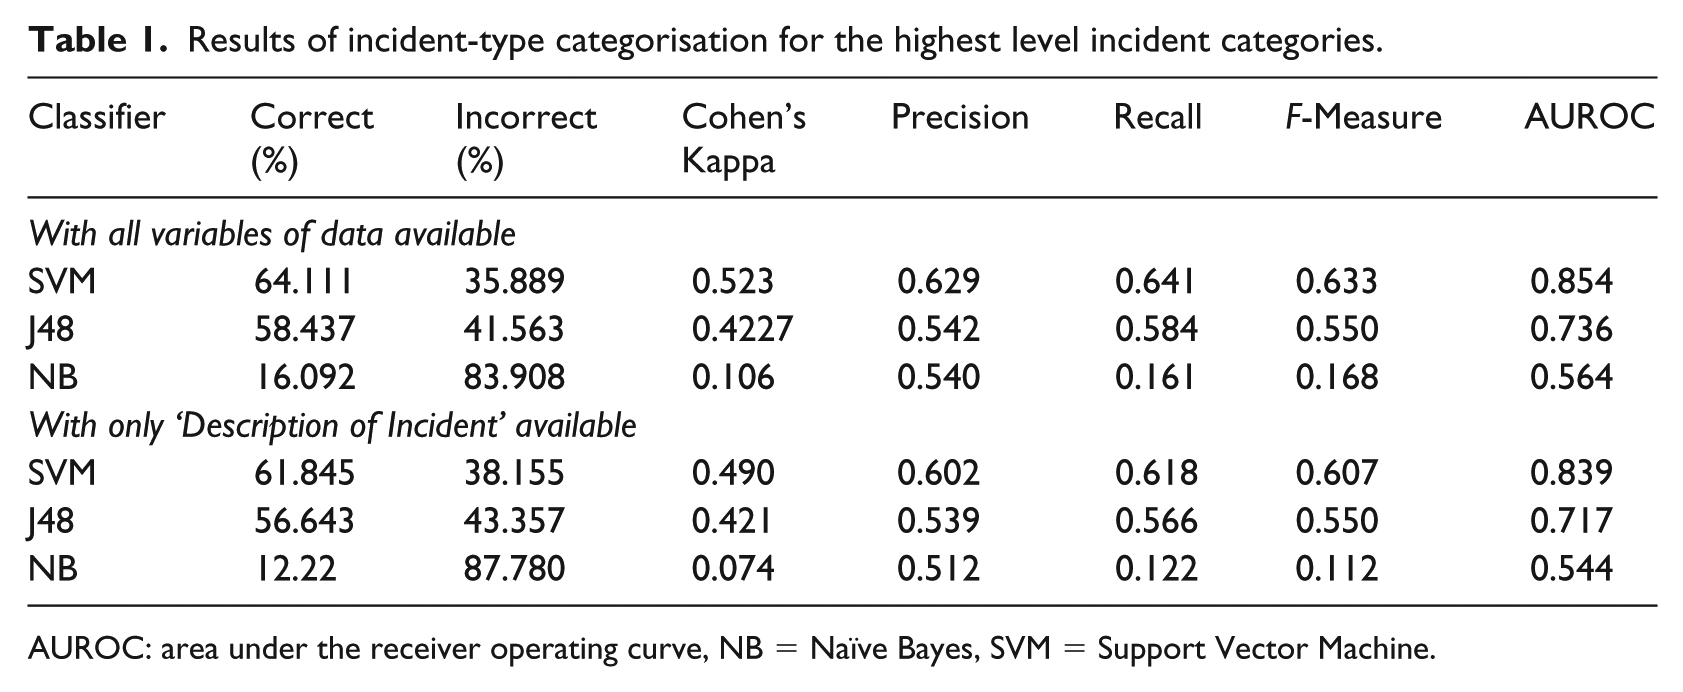
AUROC: area under the receiver operating curve, NB = Naïve Bayes, SVM = Support Vector Machine.
Incident type classification – expanded incident categories (0.1–10)
Table 2 shows the results of the ML categorisation for the expanded incident categories. SVM consistently had the highest AUROC and was improved by the addition of the additional columns of data from 0.870 to 0.891. Neither J48 classifiers completed, aborting after 15 hours (see Discussion).
Results of incident-type categorisation for the expanded incident categories.
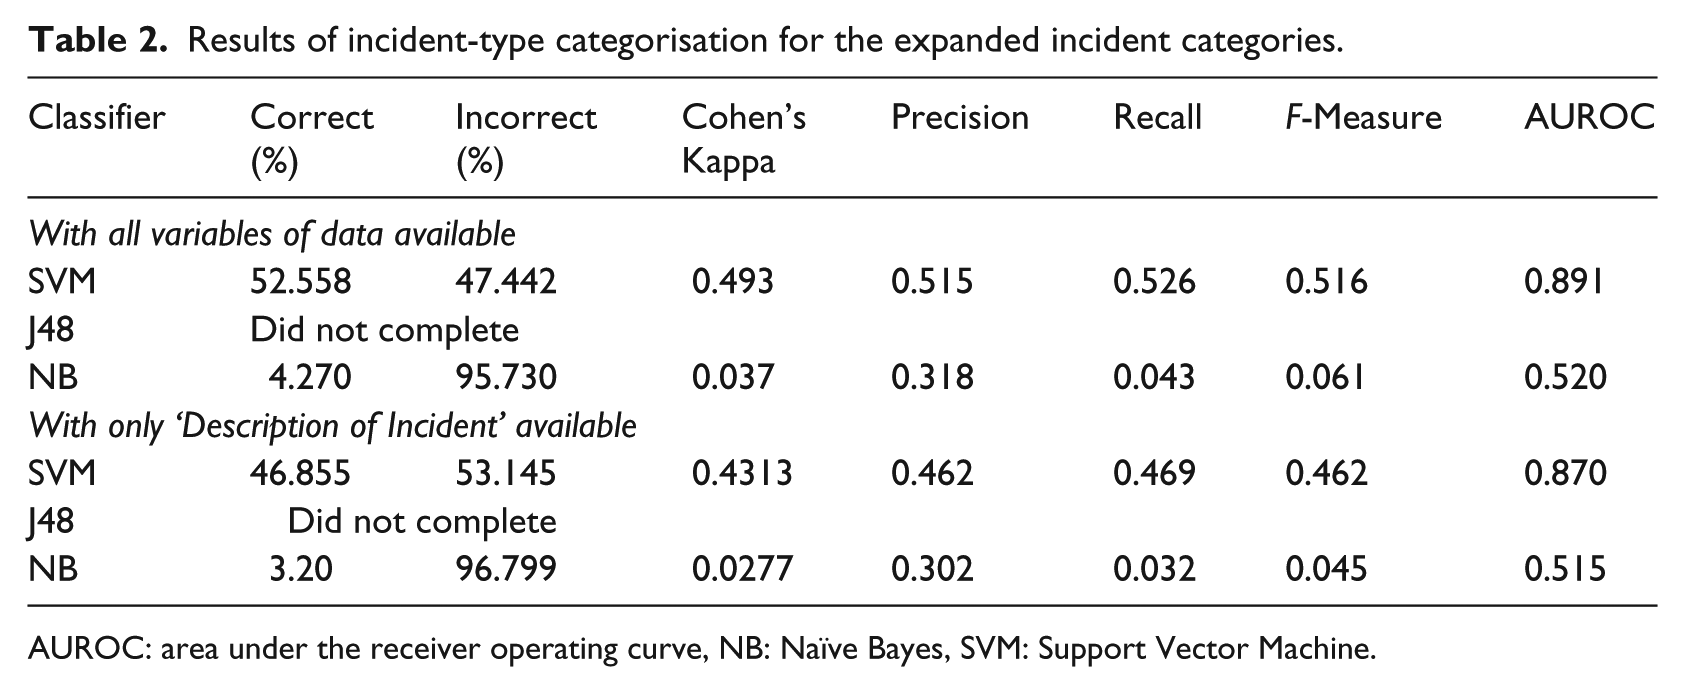
AUROC: area under the receiver operating curve, NB: Naïve Bayes, SVM: Support Vector Machine.
Table 3 shows the AUROC for each individual incident category, when using the SVM classifier and all variables of data. Classes that achieved AUROC >0.98 included 0.4, 0.6, 0.7, 0.9 and 6.11. An AUROC of >0.8 was achieved by 17 of the 18 medication categories.
AUROC for expanded incident categories, with all columns of data available using the SVM classifier.
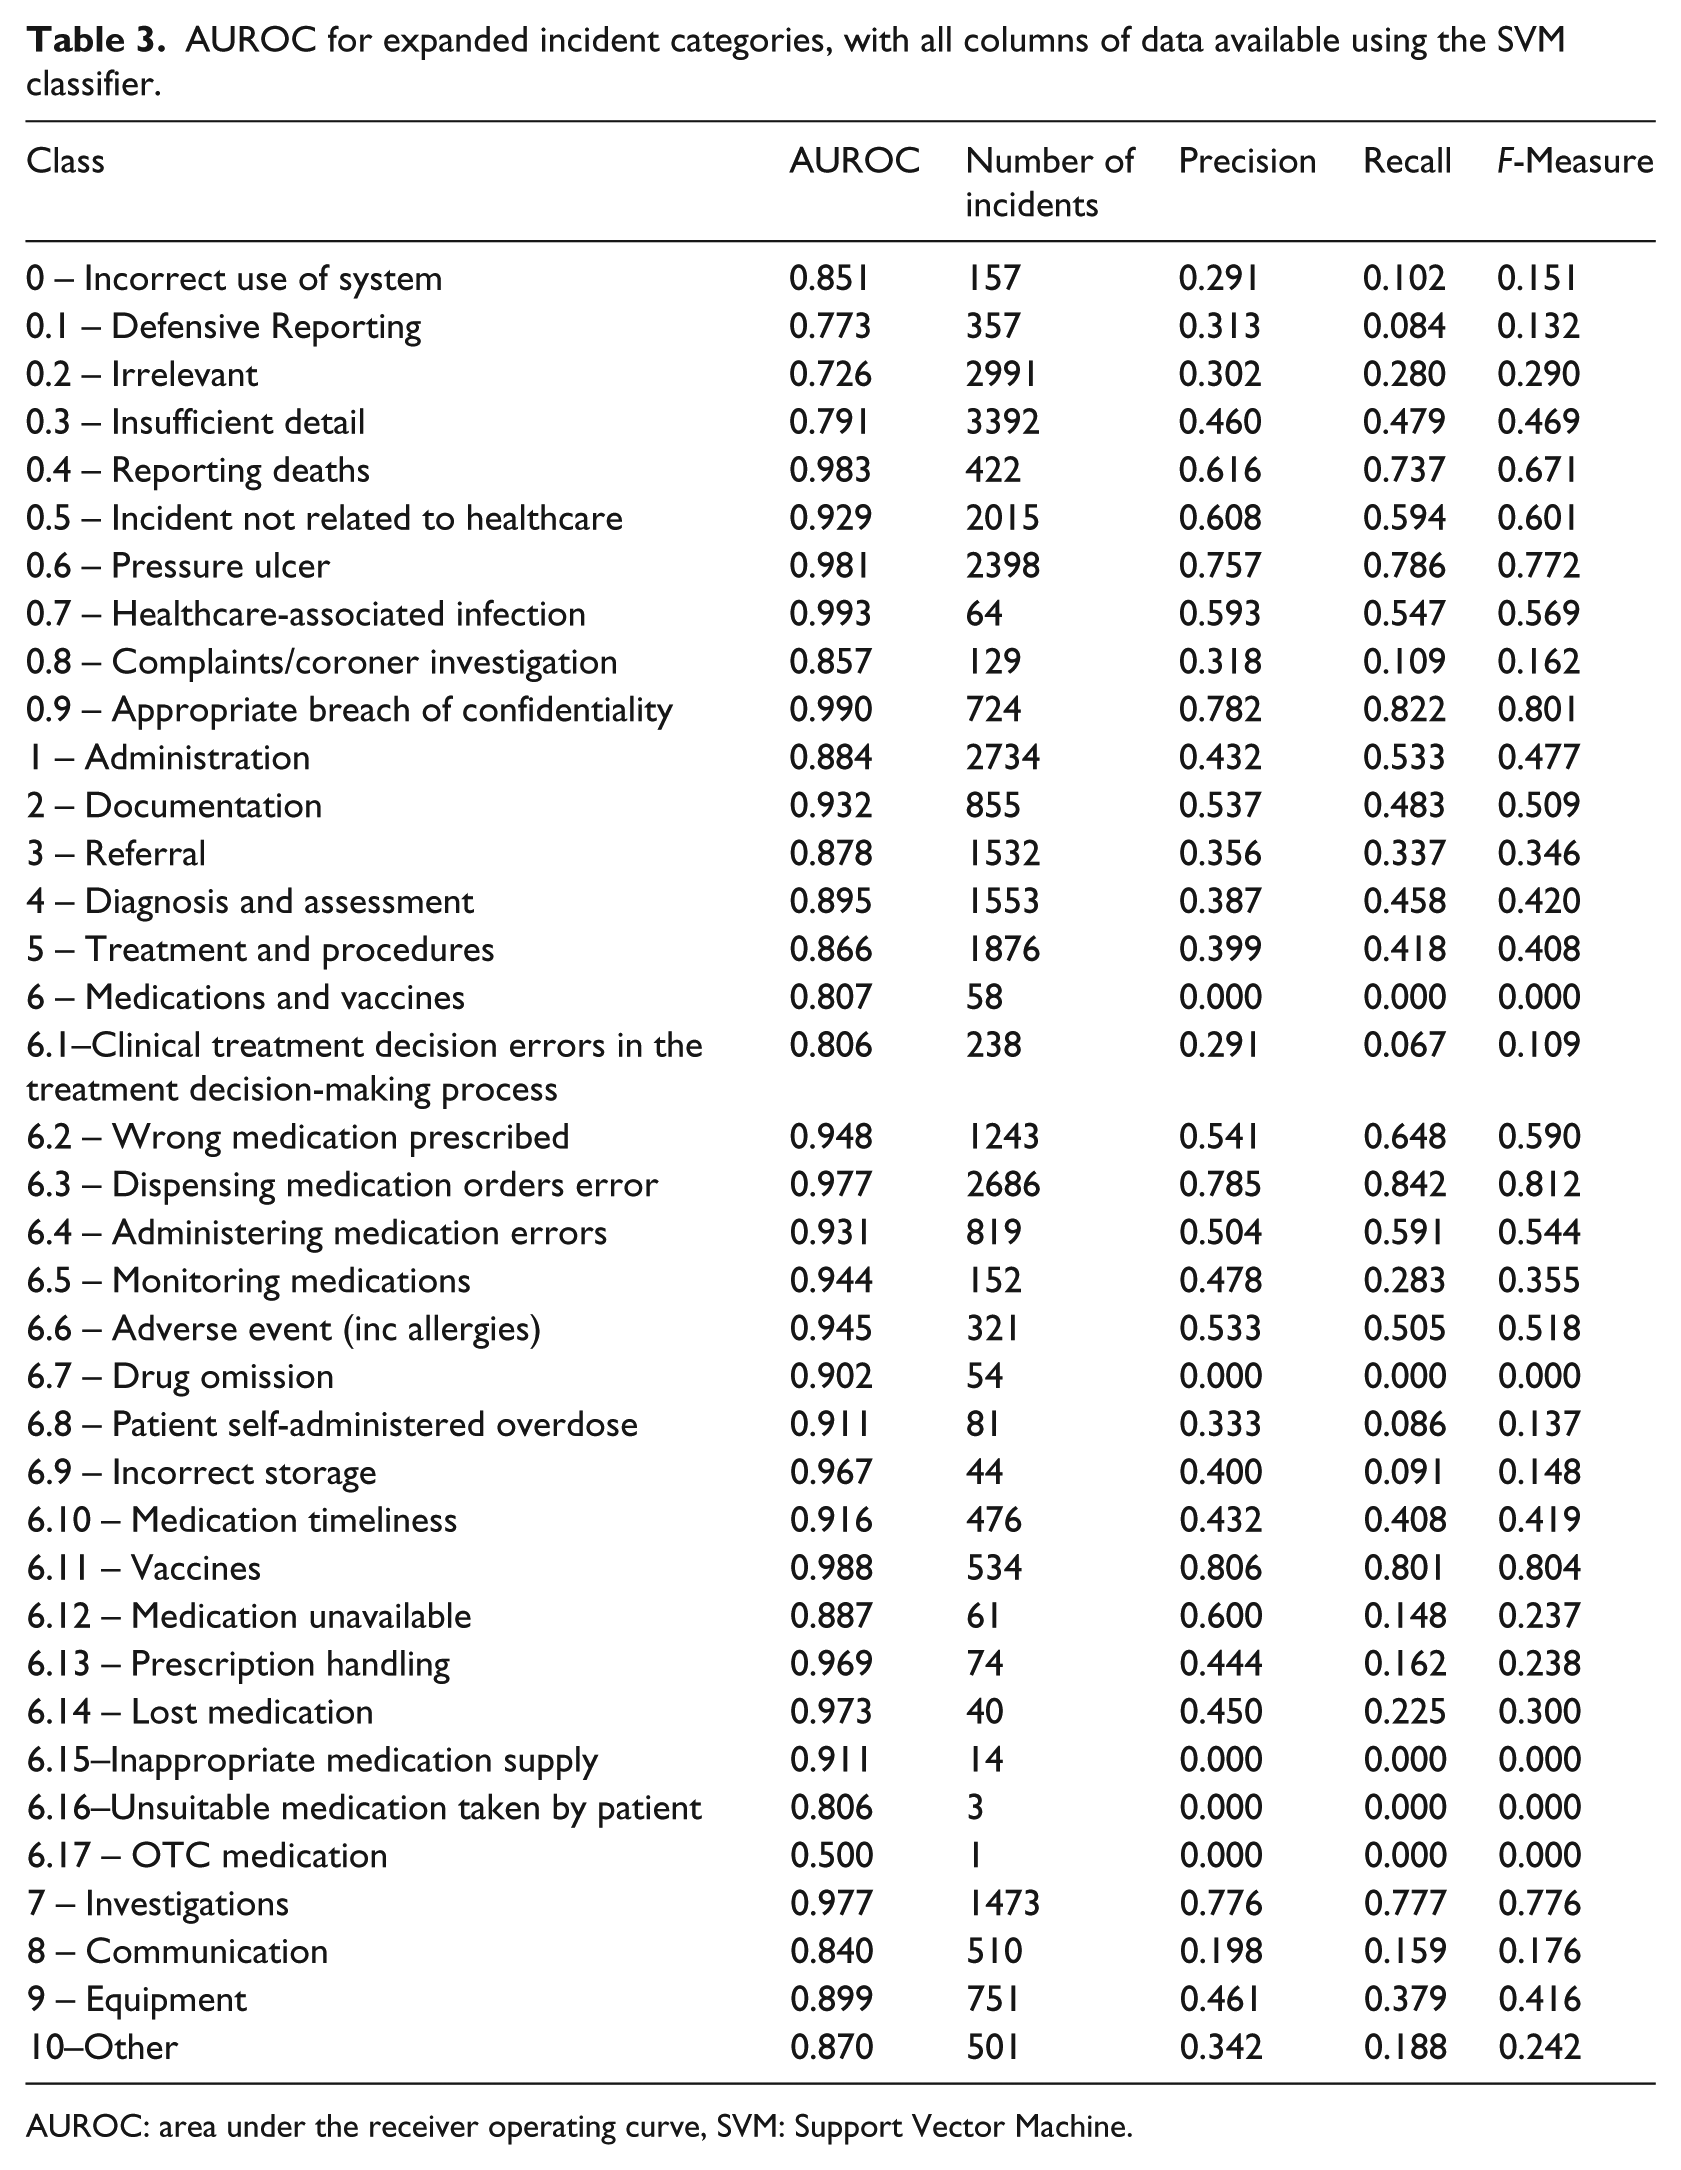
AUROC: area under the receiver operating curve, SVM: Support Vector Machine.
Table 3 also shows that the number of incident reports in a category is not necessarily proportional to AUROC. For example, category 6.3 has 2686 incidents, AUROC 0.977, but category 6.14 has only 40 incidents but an AUROC of 0.973. In addition, some categories had high numbers of incident reports but low AUROC such as category 0.3, which had 3392 incident reports but an AUROC of only 0.791.
Severity classification
Table 4 shows the results for severity classification. SVM achieved the highest AUROC at 0.708 with all columns of data, although this was not above our threshold for accuracy. Figure 4 shows the confusion matrix for the SVM classifier for the expanded incident categories and has been coloured to demonstrate where the classifier has classified correctly and where it has failed. In the death category, it correctly identified 72.85% (225/309) of cases involving death compared to only 20.95% in the severe harm category.
Results of severity categorisation for the expanded incident categories.
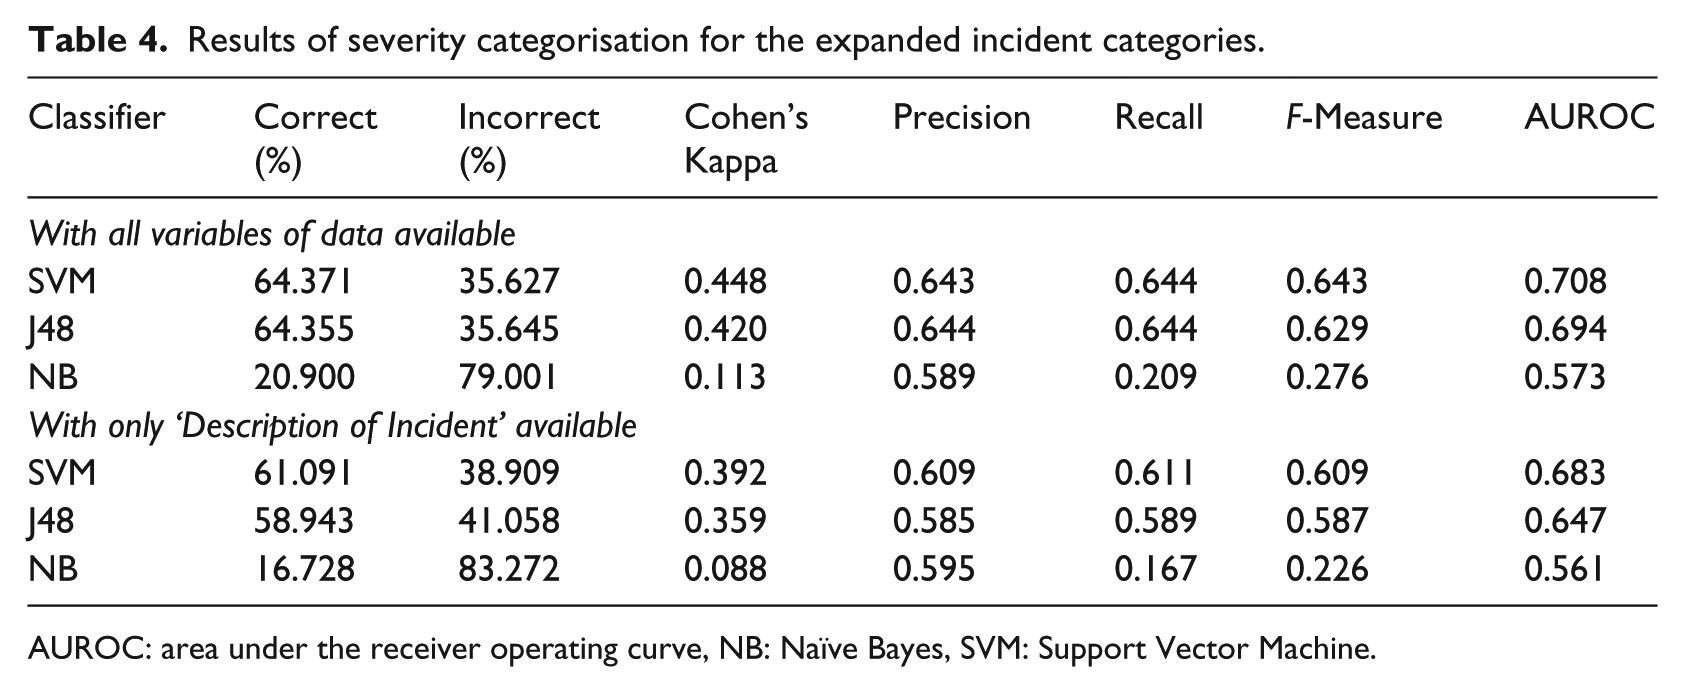
AUROC: area under the receiver operating curve, NB: Naïve Bayes, SVM: Support Vector Machine.
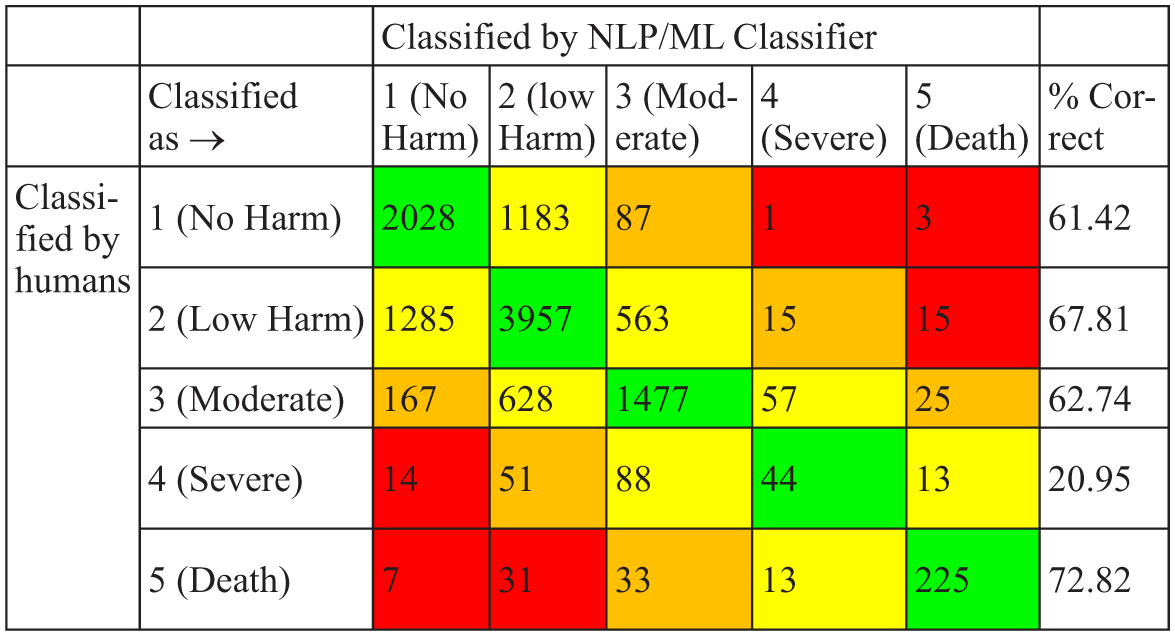
Confusion matrix for severity classification for SVM with all columns of data available.
Discussion
This study has shown great promise for automatically analysing patient safety incidents and has achieved this in several incident categories. It has succeeded in accurately classifying the content of incident reports particularly in medication incidents (17/18 categories achieving an AUROC of >0.8) and in pressure ulcers (AUROC 0.981). We have also succeeded in identifying patients who have died, from the content of incident reports, correctly 72.82% of the time, which will provide a valuable safety net.
However, we have also shown that this method does not perform well when classifying the severity of harm of patient safety incident reports. While the so-called ‘bag of words’ approach yields limited success, this may be sufficient to serve as a safety net to ensure that important cases are not missed during review. This study has also highlighted the categories that need both further refining of their definitions and where additional categorised incident reports are needed to most efficiently improve and refine the classifier. For example, vaccine errors achieved an almost perfect AUROC of 0.988 – thus, further human classification would not improve this value considerably. In contrast, further training material for the category ‘8 – Communication’ (with an AUROC of 0.84 and only 510 reports) may improve its accuracy considerably.
We found that the number of incident reports is not proportional to the overall success of the categorisation. This is consistent with Ong et al. (2010). 18 Potentially, once the classifier has ascertained the best words to identify an incident category, further reports do not add to its accuracy.
Certain categories were harder to classify autonomously than others. This is also true of incidents studied in the aviation industry. 34 This may be because certain categories have few specific terms that the algorithm can utilise to confidently discriminate. Conversely, certain categories which have very specific words, such as in pressure ulcers (category 0.6), where words such as ‘pressure’ and ‘grade’ are fairly unique in medicine to this topic, lead to highly accurate classifications. This has been highlighted in previous work. 32 Similarly, since healthcare professionals write reports in very high-level technical language, it regularly contains abbreviations and acronyms which pose a further problem for the classifier.35,36 More problematic for certain categories, such as ‘7 investigations’, where healthcare professionals are more likely to call a ‘full blood count’ an ‘FBC’ or a ‘positron emission tomography scan’ a ‘PET scan’ than in other domains such as communication. However, this can also be seen as a positive since terms that are specific to certain domains are ideal for a classifier. Nuances and ambiguity of language can lead to confusion for the classifier and this has been highlighted as a problem in other NLP/ML applications too. 11 The addition of spelling mistakes causes further issues for the classifier since it treats different spellings as different words and thus classifies them differently. This is regularly a problem in other NLP/ML studies. 35
However, although the number of words may not influence accuracy, when combined with our hardest task (computationally) – the expanded incident categories with 37 possible categories – it may explain why the J48 classifier failed. Decision trees are computationally expensive, needing large amounts of resource (processing and memory) and do not scale to large numbers of classes. 37 In this study, that led to the J48 classifier running out of memory before completing.
One key category which posed problems for the classifier is contained in the 0.2 category, 0.2.1 – no harm from primary care. This category is used where there is a patient safety incident but it was not caused by an act or omission by primary care. It is likely that the classifier correctly identifies these incidents as, for example, medication incidents but because it was caused by secondary care it is classified as ‘no harm from primary care’ by the PISA study. It is therefore seen as a misclassification, despite the classifier being technically correct.
Strengths and limitations
This study had several strengths. First, it was the first study of its kind to use UK primary care incident reports and moreover was the largest ML/NLP study of patient safety incident reports conducted that we are aware of. Second, it used more incident categories than any other study we are aware of, and it was the first of its kind to use not only the information from the reporter but also the expert-applied PISA classification system. 7
There are several broad limiting factors for the overall performance of the study; however, often these were out of our (and any studies) control namely the original content of the incident reports, the PISA coding of the incident reports (and their sampling) and inherent limitations of the classifiers themselves.
As seen in other studies on incident analysis, clear definitions can be more important than the size of the training set from which the classifier has to learn. 34 Table 4 shows this clearly and here this study’s methodology may have limited the outcome of its classifier. The PISA classification was iteratively developed and contains over 350 different incident categories. It was decided at the outset that there were insufficient data to train a classifier on all 350 categories, due to its hierarchical structure, and therefore to focus on the highest level categories (0 to 10). While this seems at the outset to be simpler for the classifier, it may conversely lead to more confusion since large quantities of incident reports are now grouped by broad vague concepts such as ‘Medication incidents’, ‘Incorrect use of system’ and ‘Other’. The ‘Incorrect use of system’ category is the broadest, ranging from pressure ulcers through to defensive reporting. To assess if this had caused further confusion, the broadest categories – ‘Incorrect use of system’ and ‘Medication incidents’ – were broken down to their next level in the hierarchy which increased the AUROC despite increasing the number of categories from 11 to 31 and at the same time reducing the number of categories available in each category from which to train.
The classifiers used in this study were trained only on the final incident that has directly led to patient harm. However, a single report may contain several interconnected incidents that led to the final outcome. The classifier may correctly identify any number of incidents contained within the report, but if it does not choose the final/primary incident, it will technically get the category wrong. This will require further research. The ultimate category applied to an incident is often subject to much debate and scrutiny, often requiring a third party to cast the final vote. 7 This is seen in numerous studies which used expert-categorised data to train their classifiers, where disagreement between experts was seen in up to 20% of cases. 38 Therefore, we should not expect every incident to have been categorised in exactly the same way due to there being several (albeit highly trained) coders in the original study. 16
The ‘bag of words’ strategy is a simple and effective approach; however, structure from the text is lost and thus the semantic meaning.12,18 Negation is lost (e.g. ‘no allergies’), which poses a major problem since it treats the word ‘allergies’ the same irrespective of the preceding terms and this has been shown to be a problem in other studies. 39 To compensate for this, bigrams and trigrams were utilised in this study which would have attempted to identify the above example. Another solution is to use a semantic processor which can analyse sentences in their entirety. 13 However, even with this approach, sometimes the sentences on either side can affect the meaning of the sentence in question, so-called ‘cross-sentence correlation’, which can have a similar effect as negation. 40 Recent works with paragraph vectors have shown improvements on the bag of words model by up to 30%. 41
Comparison with previous work
There has been little research conducted on the use of ML and NLP in automating incident report analysis in healthcare. 18 There has been considerably more research and success with it in incident reports in aviation 34 and notable successes reported for text classification from verbal autopsies, 42 which have several similarities with incident reports. Of those studies of safety reports in healthcare, Wong and Akiyama 32 undertook a study of 227 Canadian medication incident reports and used a custom classifier based on logistic regression to achieve good accuracy in autonomously categorising incident type. Ong et al. (2010) performed a larger study of 972 incident reports in Australia by focusing on two types of patient safety incident: ‘inadequate clinical handover’ and ‘incorrect patient identification’. 18 They used NB and SVM classifier with excellent results (accuracy up to 97.98% with SVM on patient identification incidents) but noted that the topics chosen had very specific words that the classifier could easily detect which probably lead to their good results. 18 Gupta and Patrick 19 undertook a larger study of 5448 Australian incident reports, including 13 categories of incident type and utilised NB, SVM and the J48 decision tree classifier. They have reported achieving good results in an online presentation; however, their detailed methodology has not been published making further comparison difficult. 19 The largest work in the field (up until now) appears to have been undertaken in Japan, where 15,000 patient safety incident reports were clustered using cluster analysis to ascertain their incident type, but they did not provide statistical or numerical results.23,43 A recent paper by Wang et al. 44 looked at using ML and NLP to categorise Australian incident reports. Their study used fewer incident categories and used a significantly smaller dataset than ours, and they too struggled to classify severity level. Wang et al also demonstrated the difference that using balanced datasets makes to the accuracy of the task, although since real-world incident report data are inherently imbalanced we did not choose to balance our dataset.
Recommendations for future work
This project is the largest attempt at classifying patient safety incident reports in primary care to date, but further research will be required to achieve the same results on secondary care data. Within the scope of the current dataset, future research could focus on examining incident reports in their entirety utilising semantic classifiers, 12 and whether sequences of incidents can be extracted, something that has been researched in airline incident report analysis. 29 Although the categorical data routinely collected with each report are often non-specific, as it improved our study’s performance, it would be prudent to further research how these data can be used to enhance incident report categorisation. Further work around J48, either using reduced categories or superior infrastructure, is required, since its ‘human readable’ output allows checking for plausibility by patient safety experts. Improving definitions and increased training examples of select categories will likely further improve the performance.
Conclusion
Converting unstructured data to structured data using NLP/ML is challenging across all subject domains.13,40,45 However, the highly nuanced and technical nature of medical text adds a further dimension of complexity. 46 While this study shows that NLP/ML is not perfect and cannot yet replace manual review entirely, 47 it suggests that it can act as a safety net, identifying cases that lead to severe harm and death, which have been incorrectly classified. The ability to determine certain categories accurately can also assist reviewers in those areas to focus on cases that need manual review – saving money and time. 14 It also opens up the possibility of clustering reports that are ‘near misses’ or ‘no harm’, which are currently too time-consuming to work on in healthcare, which is a key strategy used by the airline industry in their successful safety model. 48
Footnotes
Appendix 1
Appendix 2
Acknowledgements
Incident reports were originally coded for a project funded by the National Institute for Health Services and Delivery Research Program (project number 12/64/118), ![]() . The funders had no role in study design, data collection and analysis, decision to publish, or preparation of the manuscript. The views and opinions expressed herein are those of the authors and do not necessarily reflect those of the National Institute for Health Research Services and Delivery Research Programme, the National Health Service, or the Department of Health.
. The funders had no role in study design, data collection and analysis, decision to publish, or preparation of the manuscript. The views and opinions expressed herein are those of the authors and do not necessarily reflect those of the National Institute for Health Research Services and Delivery Research Programme, the National Health Service, or the Department of Health.
Declaration of conflicting interests
The author(s) declared no potential conflicts of interest with respect to the research, authorship, and/or publication of this article.
Funding
The author(s) disclosed receipt of the following financial support for the research, authorship, and/or publication of this article: The study was funded by the Division of Population Medicine, Cardiff University.