
Abstract
Typically acute deterioration in sick people is preceded by subtle changes in the physiological parameters such as pulse and blood pressure. The Modified Early Warning Score is a scoring system developed to assist hospital staff in gauging these physiological changes and identifying patients in need of urgent medical care to avoid catastrophic deterioration. This work discusses the design and implementation of an equivalent warning system that utilizes fuzzy logic techniques to categorize patients’ status. The system is implemented and tested in Rashid Centre for Diabetes and Research in UAE. Results are compared with those obtained using the Modified Early Warning System that is currently used in practice. We demonstrate that the implemented system provides reliable results that are in agreement with the current Modified Early Warning Score system, with the added benefit of a scoring scheme that provides a better insight into the status or medical condition of each patient.
Keywords
Introduction
Rapid and serious deterioration of patients in hospitals is often accompanied by deterioration of their vital signs. Studies indicate that evidence of clinical deterioration can be identified prior to the occurrence of serious adverse events such as death, cardiac arrest, or intensive care admission.1,2 The need for a mechanism by which hospitals are able to recognize patients at risk of catastrophic deterioration is therefore very critical. The Modified Early Warning Scoring (MEWS) system is a tested guide or tool for bed-side evaluation that has been used successfully to serve this purpose by identifying high-risk patients with the hope of taking timely preventive measures. The MEWS uses physiological parameters or vital signs readings such as temperature, blood pressure (BP), heart rate, respiratory rate, oxygen saturation, and blood sugar to reach a conclusion. Patients with a MEWS score that equals to or greater than 5 are immediately transferred to urgent care units. Its use has shown to offer clear clinical advantages, and the Royal College of Physicians (London) has recommended the MEWS as an appropriate aid in identifying patients at risk.2,3
Fuzzy logic theory was developed in the 1960s and is based on the theory of fuzzy sets. In fuzzy sets, the membership of an element is not strictly false or true like in Boolean logic and is not a crisp value, but rather gradual. The degree of membership of an element in fuzzy logic can be any real number in the interval [0, 1]. The advantage of fuzzy logic stems from the fact that it allows us to deal with the vagueness and imprecision of many real-world problems. In essence, it simulates human reasoning and its ability of decision-making based on not so precise information. The membership function is a graphical representation of the magnitude of participation of an input. It associates a weight with each of the inputs that are processed, defines functional overlap between inputs, and eventually determines an output response. For a detailed description of the theory behind fuzzy logic, readers are referred to the study of Ross 4 and Zadeh. 5
Fuzzy logic–based algorithms have shown a potential to improve health caretakers performance by imitating human thought processes in complex circumstances and accurately executing repetitive tasks to which humans are ill-suited. In practice, a precise model may not exist for a medical condition, or it may be too difficult to model; in such cases, fuzzy logic is considered to be an ideal tool as human minds work from approximate data, extract meaningful information, and produce crisp solutions. 6 Fuzzy logic has proven to be able to transfer human and expert knowledge, such as that of a medical doctor, into computer manageable models using linguistic terms. Fuzzy inference systems (FIS) use a number of if-then-rules, developed based on knowledge extracted from experts (medical doctors in the context of this work) to assist, for example, in diagnosing medical conditions or in recommending an appropriate treatment to an existing condition. 7
Previous work in fuzzy logic that has been implemented in the area of patients’ care include the work reported in the literatures.7–19 In Otto et al., 8 the authors developed a software prototype based on neural networks, fuzzy logic, and expert system concepts that predicts blood glucose level changes. This system used an implanted blood glucose sensor. The information from the sensor was used to adapt the rate of infusion of insulin to see whether it could cope with responses to common “inputs” such as daily insulin, food, and exercise. Another study developed a clinically practical system that utilized an internal blood glucose monitoring system. 9 The system was able to monitor the glucose level and adjust the insulin level using an expert fuzzy logic algorithm. In the study of Paul, 10 the author explored the use of an insulin pump and the application of fuzzy logic technology to act as an artificial pancreas in diabetes patient. In the study of Cosenza, 11 the author describe the use of fuzzy techniques in the development of a decision support system that allows the optimization of postprandial glycemia in type 1 diabetes patients taking into account the kind of meal taken by patients, the preprandial glycemia, and the insulin resistance. Also, fuzzy logic was used for heart disease diagnosis; 12 researchers have discussed the design of a fuzzy expert system for heart disease diagnosis. The system has 13 inputs including chest pain type, BP, blood sugar, heart rate (HR), cholesterol, and one output that indicates if the patient suffers from a heart disease or not. In another attempt, a fuzzy logic monitoring and diagnostic alarm system was developed to detect critical events during anesthesia administration. 13 In the study of Zziwa, 14 the author discussed a system that behaves like an unbiased expert that follows a process as the human expert and which searches the entire head and neck cancer patient database and identifies a patient record whose symptoms are most similar to the current case and suggests a starting point for generating a new plan. The system used case-based reasoning that was applied using fuzzy “If Then” rules to search the patient database. In the study of Tatari et al., 15 fuzzy and probabilistic computing are utilized to assess breast cancer risk development. The ability of fuzzy techniques to identify the dynamics of complex biological phenomena is illustrated in the study of Torres et al., 16 where a model of dengue and severe dengue epidemic is developed using multiresolution analysis and fuzzy systems. The design of non-stationary FIS for breast cancer treatment is discussed in the study of Garibaldi et al. 7 The authors demonstrated that incorporating variability into conventional FIS can lead to better decision-making in post-operative breast cancer treatment. In the study of Castanho et al., 17 researchers developed a fuzzy expert system to assist in the classification of patients with confined or non-confined prostate cancer. They fine-tuned the membership functions of the FIS using genetic algorithms. It is reported that the resulted fuzzy system has better performance than Partin probability tables for the database used. Sometimes, in complicated pregnancies, uterine contraction monitoring can provide valuable clinical information. In the study of Tiwari et al., 18 an expert system was developed using “uterine contraction–like” signals that are artificially simulated. The developed system generated results with a 0.98 efficiency and was successful in relating the status of the contraction to the key features of the uterine contractions. The implementation of a decision support system for the diagnosis of arthritis pain is presented in the study of Pandey et al. 19 Researchers argue that same arthritis symptoms can indicate multiple diseases and hence reaching an exact decision could be complex due to the levels of vagueness and uncertainty involved. They used World Health Organization guidelines for diagnosing rheumatic fever and knowledge elicited from experts in the disease to build the system with promising results.
In recent years, health monitoring systems are emerging due to various factors that include the increased healthcare needs of an aging population, new wireless technologies, better video and monitoring platforms, decreasing healthcare resources, and a proven cost-effectiveness of this remote monitoring approach. Many wireless patients’ monitoring systems are reported in the literature.20–36 Some of these systems are based on short-range communication protocols such as Bluetooth,20–22 Zigbee,23–25 WiFi, 26–28 and radio-frequency identification (RFID).29–34 Other systems combined short-range with long-range protocols such as General Packet Radio Service (GPRS) and WiMax.35,36 A detailed discussion of these implementations is beyond the scope of this article; however, a framework for comparing the different mobile monitoring systems is found in the study of Pawar et al. 37
In this article, we discuss the integration of mobile monitoring technology (that offers convenience to patients and healthcare providers) together with a novel fuzzy-based algorithm that provides timely warnings and messages to caretakers. Patients’ can be monitored remotely while they are on the move without having them confined to a hospital bed, or while transported, or when in the emergency room. Patients are monitored and readings collected for five vital signs including sugar level and heart rate. It is often the case that based on these readings; the diagnosis might not be very clear, and there is an element of uncertainty in the reasoning process followed to reach a diagnosis; the use of fuzzy logic in similar situations has shown to provide an effective reasoning methodology that can address uncertainties and vagueness since it allows for the representation of imprecise knowledge.
The rest of the article is organized as follows. Section “Overall system architecture” provides an overview of the system hardware and software architecture. In section “Patients’ profiles and data collection,” we discuss patients’ profile and data collection methods; in section “MEWS and inputs fuzzification,” we explain the fuzzification of data and discuss the development of the rule-based engine. Results are compared in section “Results and discussion,” and the article is concluded in section “Conclusion.” An example of system hardware validation is discussed in Appendix 1.
Overall system architecture
The primary functional requirements for the proposed system are to remotely collect patients’ vital signs that are measured using RFID-based sensors, evaluate the patient health status using fuzzy logic–based algorithm, keep patient health history in electronics medical records (EMR), and alert caretakers about the patient status and the need for urgent care or not. A block diagram of the proposed system is shown in Figure 1.
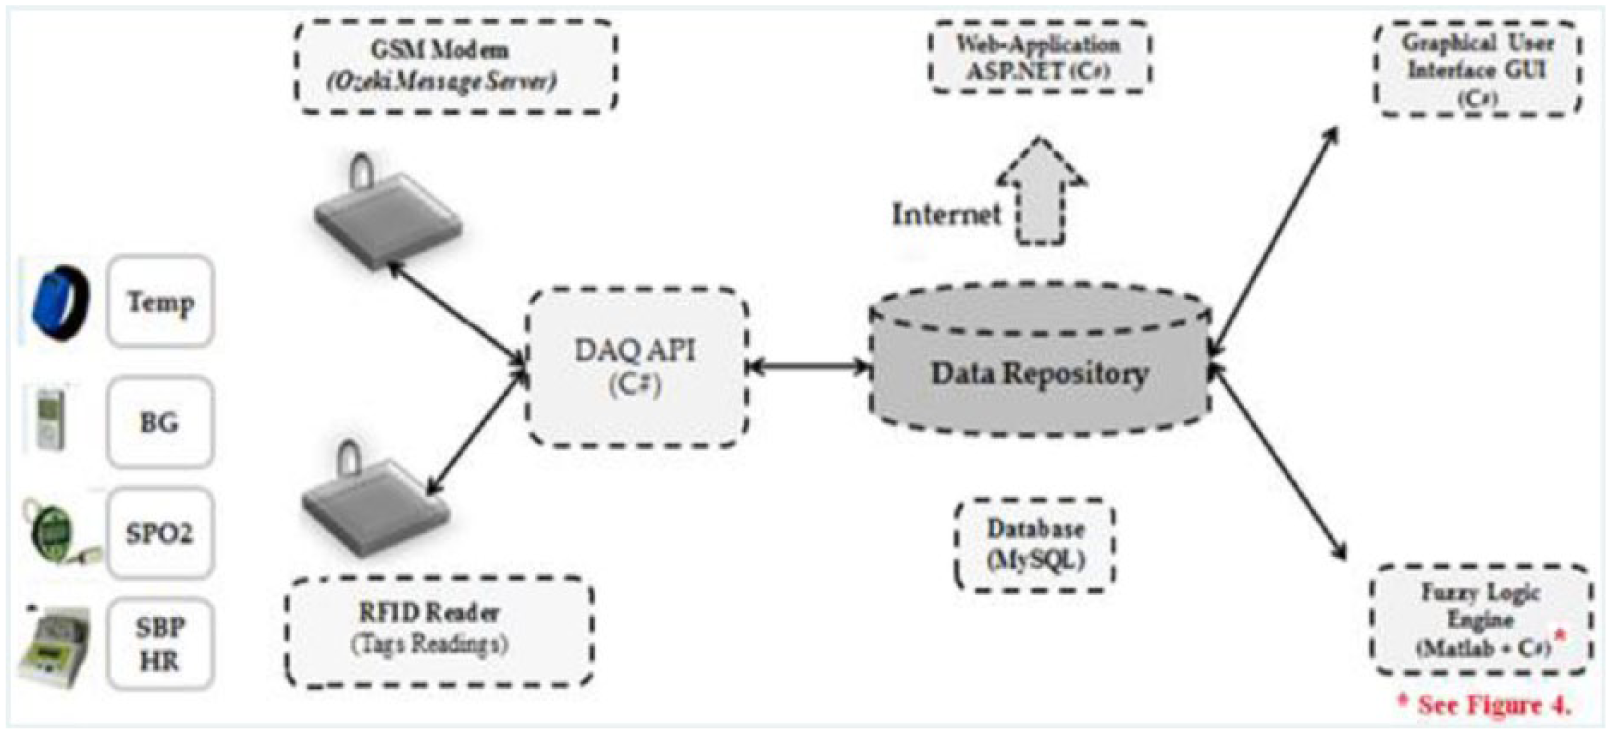
System architecture and components.
The mobile data acquisition unit consists of sensor units worn by the patient. These sensor units monitor in real-time vital signs including temperature, BP, heart rate, oxygen saturation, and blood sugar. Using RFID technology and wireless access points these vital signs readings are wirelessly transmitted, through mobile communication network module to a central monitoring computer for processing. The proposed system architecture is scalable in both the number of patients and number of monitoring areas covered. Each monitoring area can support multiple sensor units. Using this type of automated monitoring allows a minimal number of medical personnel to address the needs of a large number of patients. The mobile data acquisition unit module consists of RFID-based vital signs sensors that include a temperature detection wristband, a BP sensor, blood oxygen level (SPO2) meter and blood sugar meter. All tags are equipped with a unique RFID identification number and transmit their readings to an RFID reader that is connected to a high-end PC server. In addition, a global system for mobile communication (GSM) modem is interfaced with the server to send short message service (SMS) that contain the patients’ status to alert caretakers when an abnormality is detected.
The patient monitoring system (Figure 1) consists of five major software modules. These modules are as follows: a data acquisition unit–application programmable interface (DAQ-API), a fuzzy logic engine (FLE), a database manager (DM), a graphical user interface (GUI), and a web application (Web-App). The details and functions of each software module are summarized below:
The DAQ-API module allows interaction with the RFID reader in order to collect the patient’s real-time vital signs and display them on the API screen. It is the front-end monitoring and operating interface for system users.
DM, GUI, and the Web-App were developed as echo modules. They are used to profile users, store vital signs, and enable them to interact with the system through the web. Detailed description of these echo modules can be found in the study of Al-Damour. 38
The fuzzy logic module has three sequential processes: fuzzification, a rule-based system, and a defuzzification process as described in later sections.
Patients’ profiles and data collection
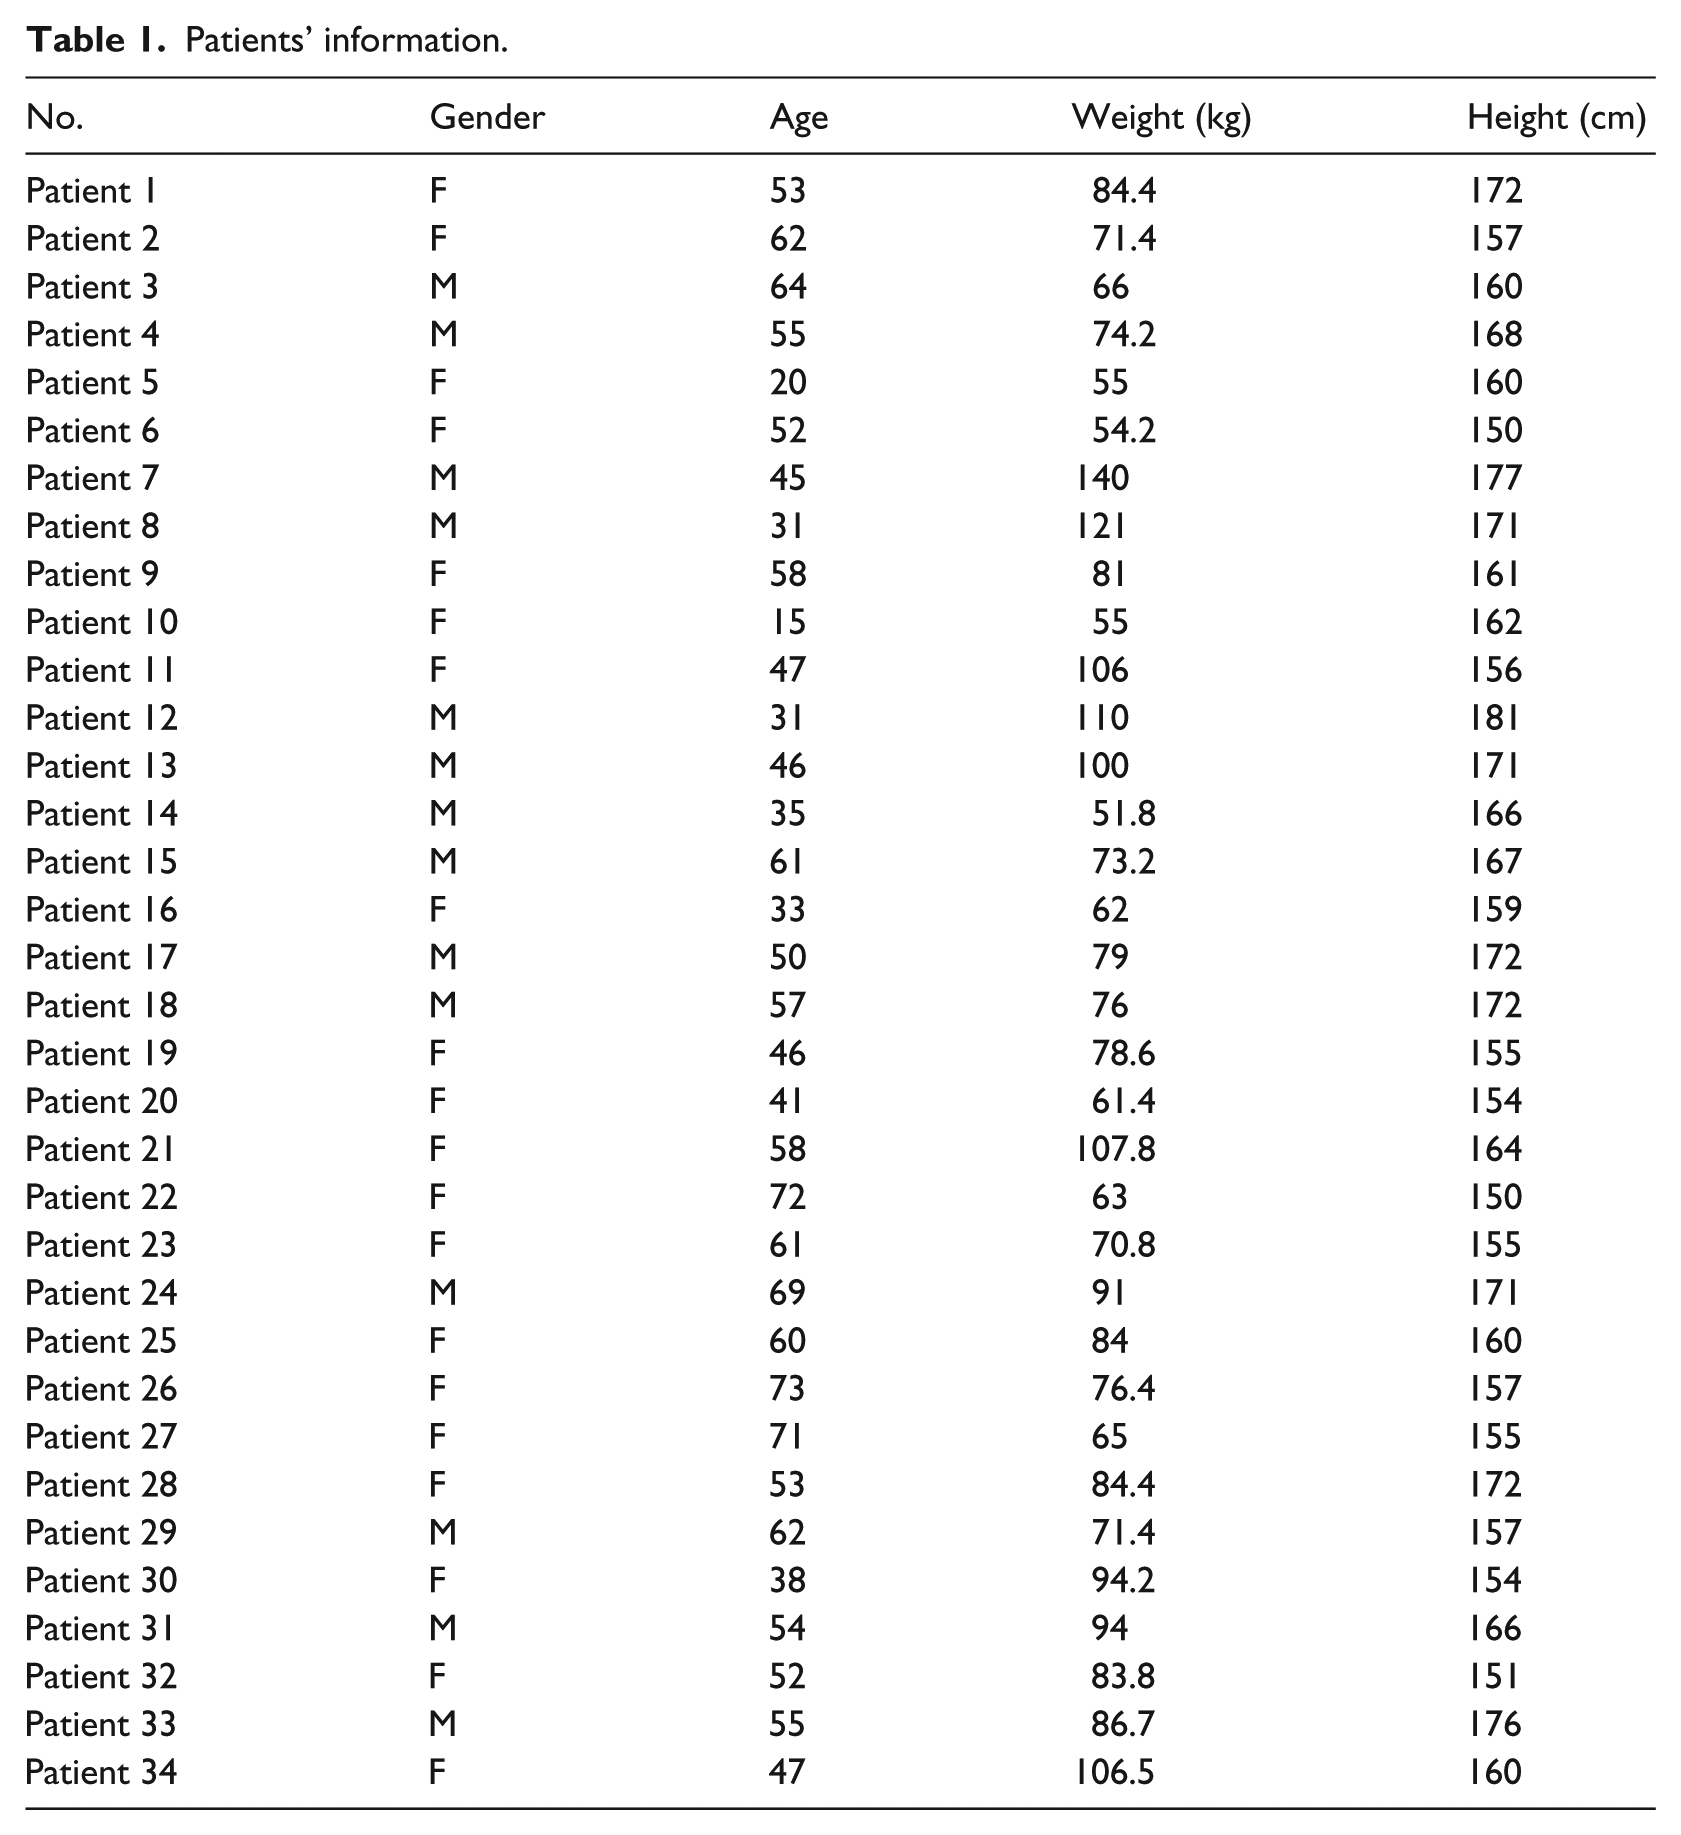
In total, 34 diabetes patients participated in this work. They are selected from “Rashid Centre for Diabetes and Research” (RCDR), Ajman, U.A.E. 39 Table 1 contains the details of each subject. They were selected to be from different genders, height, weight, and ages. The testing procedure was discussed and approved by the Medical Director of the Centre beforehand. Data collection is performed one patient at a time using the RFID-based sensory devices; samples of the participants’ BP, HR, SPO2, body temperature (TEMP), and blood sugar (BS) levels were collected from each patient. For brevity, the detailed validation and calibration steps of the RFID-based sensors is only discussed for the BP sensor in Appendix 1 of this article. Comprehensive details on data collection and the validation steps carried out for all sensory devices used can be found in the study of Al-Damour. 38
Patients’ information.
MEWS and inputs fuzzification
A MEWS score is calculated for a patient using the five physiological parameters shown in Table 2, namely, respiratory rate, heart rate, systolic BP, temperature, and an AVPU (A for “alert,” V for “responsive to verbal stimulation,” P for “responsive to painful stimulation,” U for “unresponsive”). A score is given to a specific range of values for each of the parameters in the table. The patient’s data for each parameter is cross referenced against the MEWS table, and a score from 0 to 3 is allocated. The scores for each parameter are then added to give the total MEWS score. A score of zero shows that the patient case is normal, a score that is more than zero and less than five shows that the patient is in a Low-Risk case, and a score of five or more shows that the patient is in a High-Risk case, and an admission to an intensive care unit is recommended.
The Modified Early Warning Score. 40
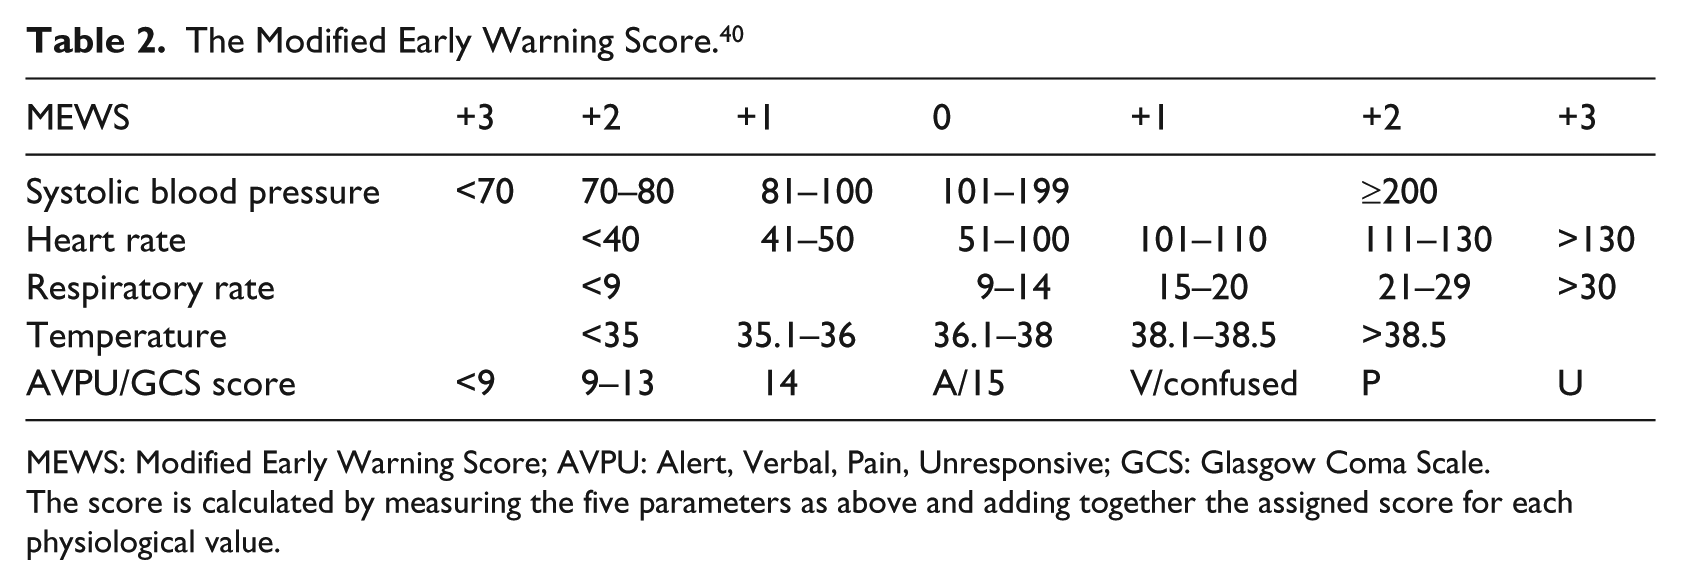
MEWS: Modified Early Warning Score; AVPU: Alert, Verbal, Pain, Unresponsive; GCS: Glasgow Coma Scale.
The score is calculated by measuring the five parameters as above and adding together the assigned score for each physiological value.
In this work, the MEWS parameters used are as follows: systolic blood pressure (SBP), HR, oxygen saturation (SPO2), TEMP, and BS.
To serve the proposed fuzzy logic system and in consultation with RCDR medical experts, the ranges in the MEWS are defined, categorized, and transferred into linguistic terms as shown in Table 3. For example and as shown in Tables 3 and 4, HR has six linguistic terms or categories associated with it, namely, Low2, Low1, Normal0, High1, High2, and High3. Each category identifies a fuzzy set. A membership function is identified for each set and a range is defined for each function.
MEWS-based categorization.
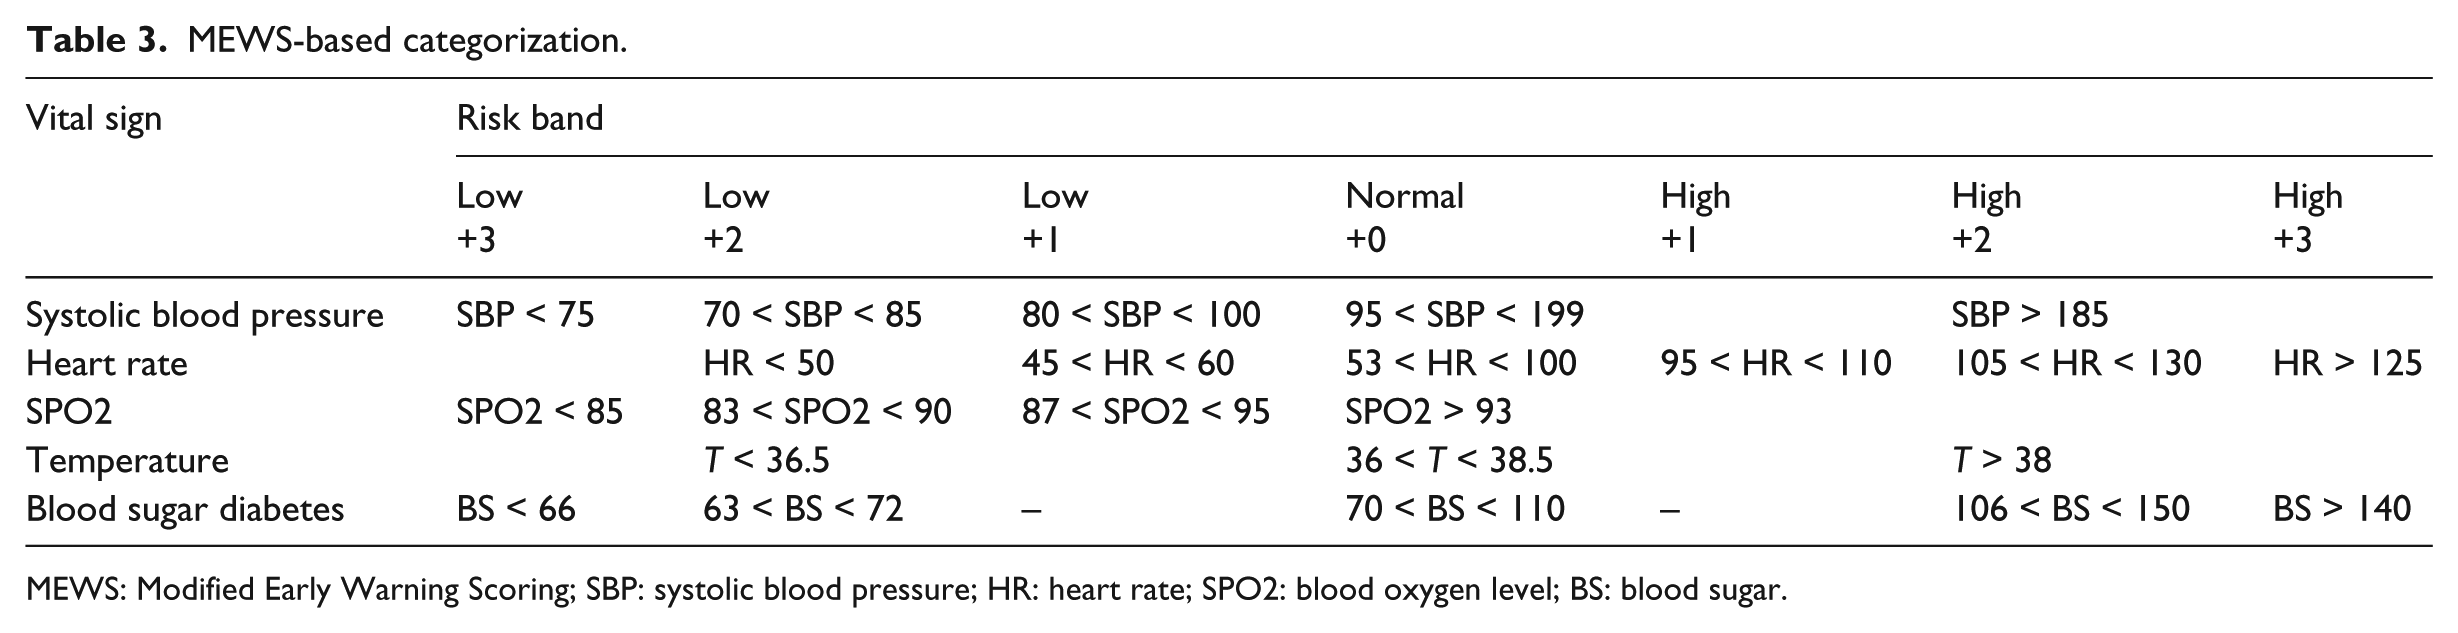
MEWS: Modified Early Warning Scoring; SBP: systolic blood pressure; HR: heart rate; SPO2: blood oxygen level; BS: blood sugar.
The HR ranges that correspond to each fuzzy set.
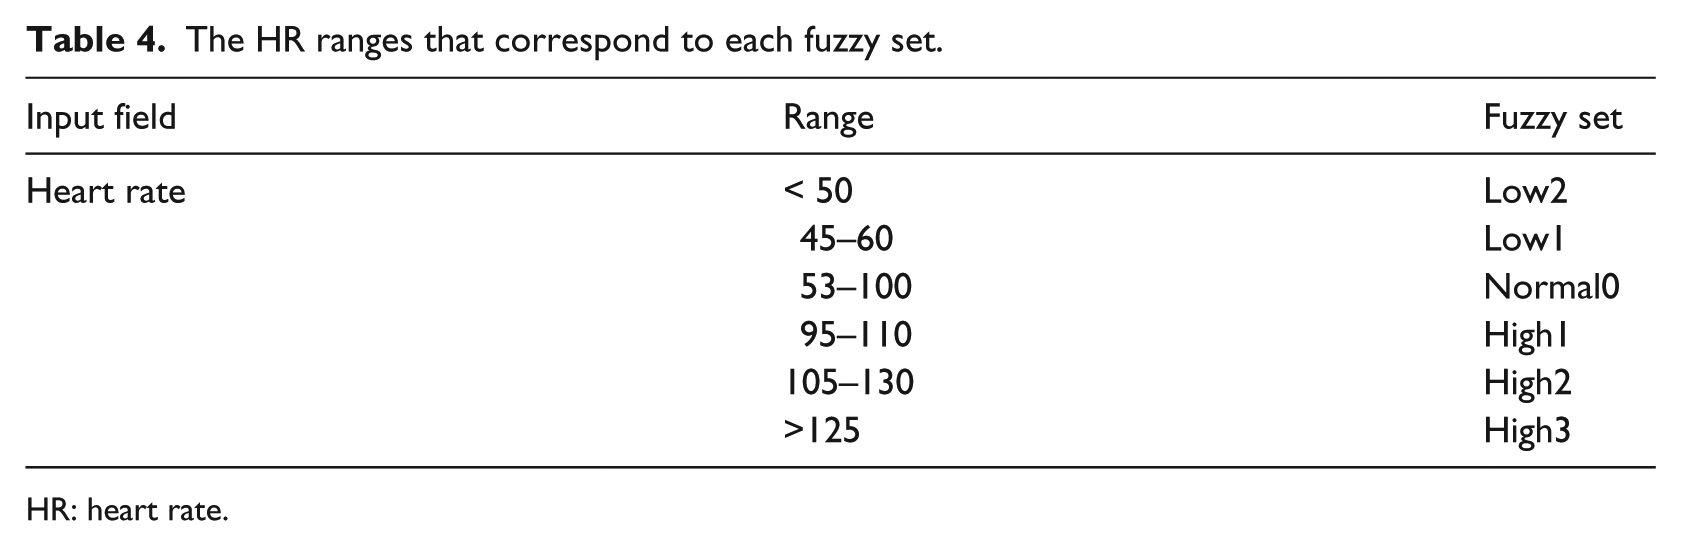
HR: heart rate.
Table 4 shows the HR ranges that correspond to each fuzzy set, and Figure 2 depicts the trapezoidal membership function selected for HR parameter and the various fuzzy sets with the overlap between them.
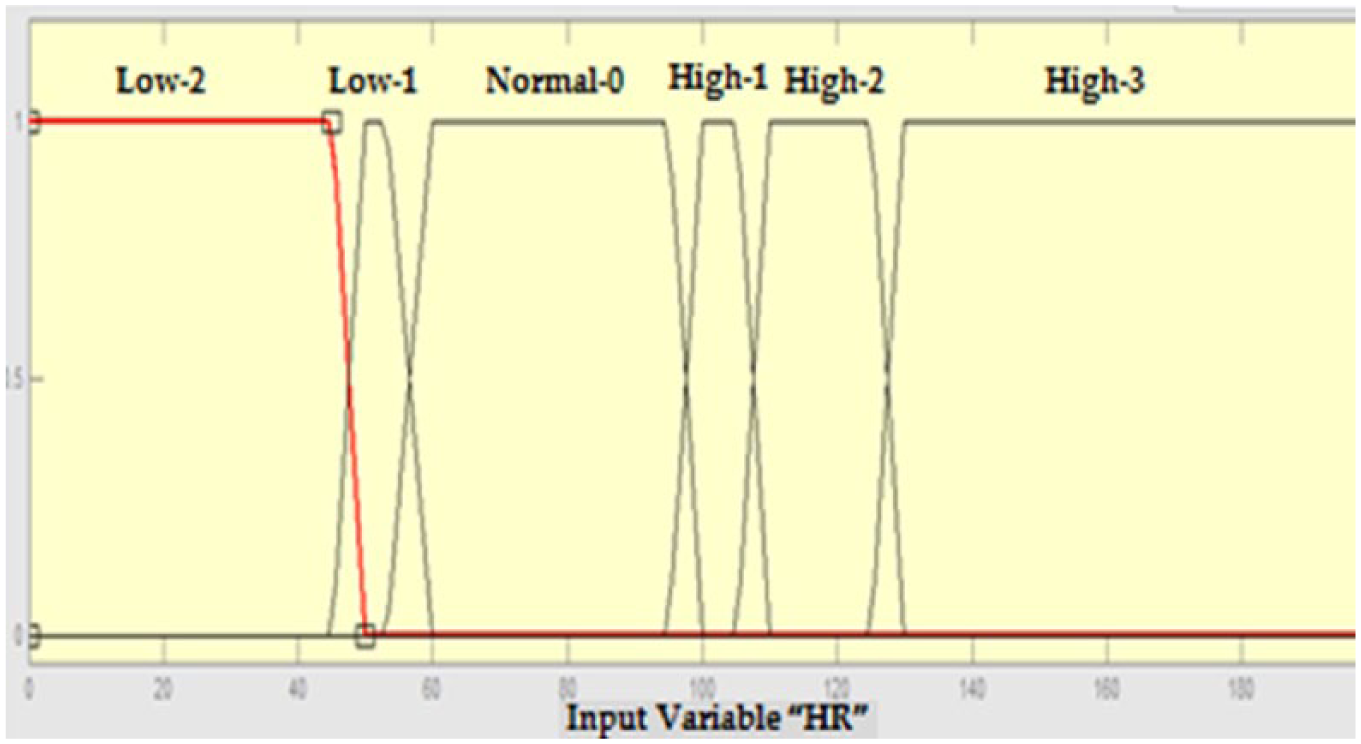
Membership functions for the heart rate (HR) parameter.
Similarly, for BS, the membership function shown in Figure 3 is used. Five fuzzy sets (Low3, Low2, Normal0, High2, and High3) are defined. For example, if the amount value of blood sugar is 64, then the patient has membership in both of the fuzzy sets Low2 and Low3 but with different degrees of membership.
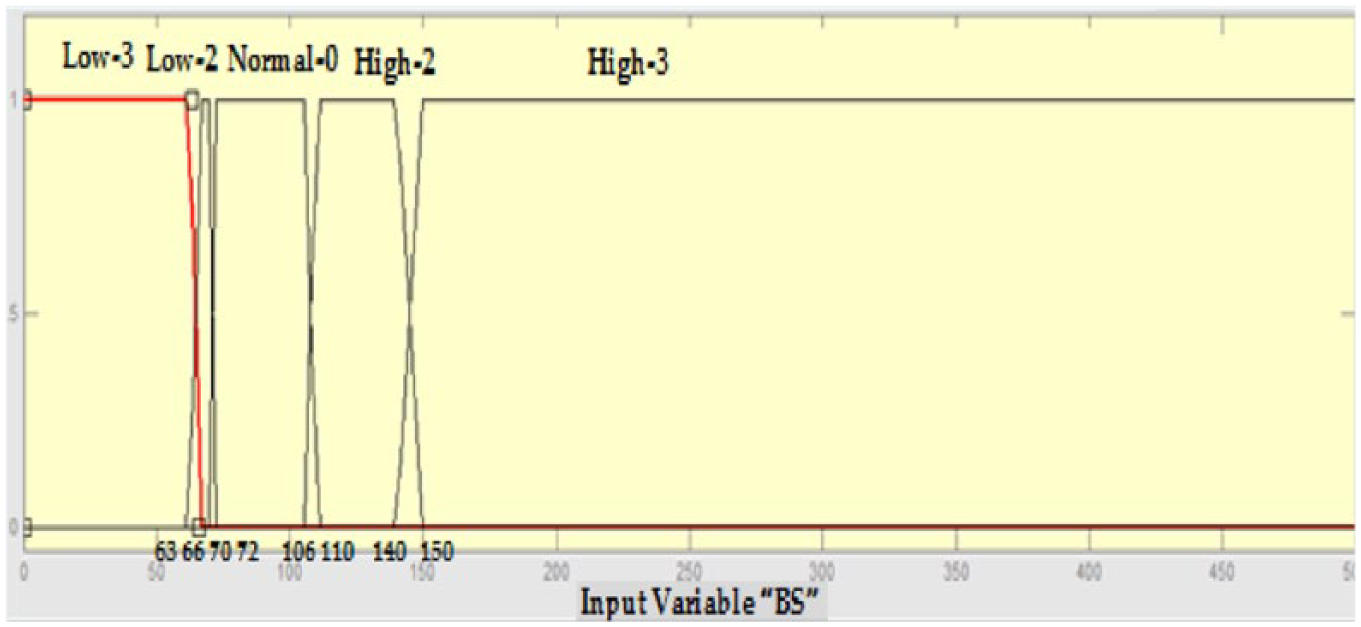
Membership functions for the blood sugar (BS) parameter.
Using a similar procedure, fuzzy sets and associated membership functions are developed for the rest of the input parameters: SBP, SPO2, TEMP, and BS. 38
The rule-based engine
A layout of the overall fuzzy system is shown in Figure 4. Information flows from left to right, processing data related to five inputs resulting in a single output that describes the patients’ health status. The parallel nature of the rules is one of the more important aspects of fuzzy logic systems. Instead of sharp switching between modes based on breakpoints, logic flows smoothly from regions where the system’s behavior is dominated by either one rule or another. The system is implemented using the MATLAB Fuzzy Logic Toolbox.
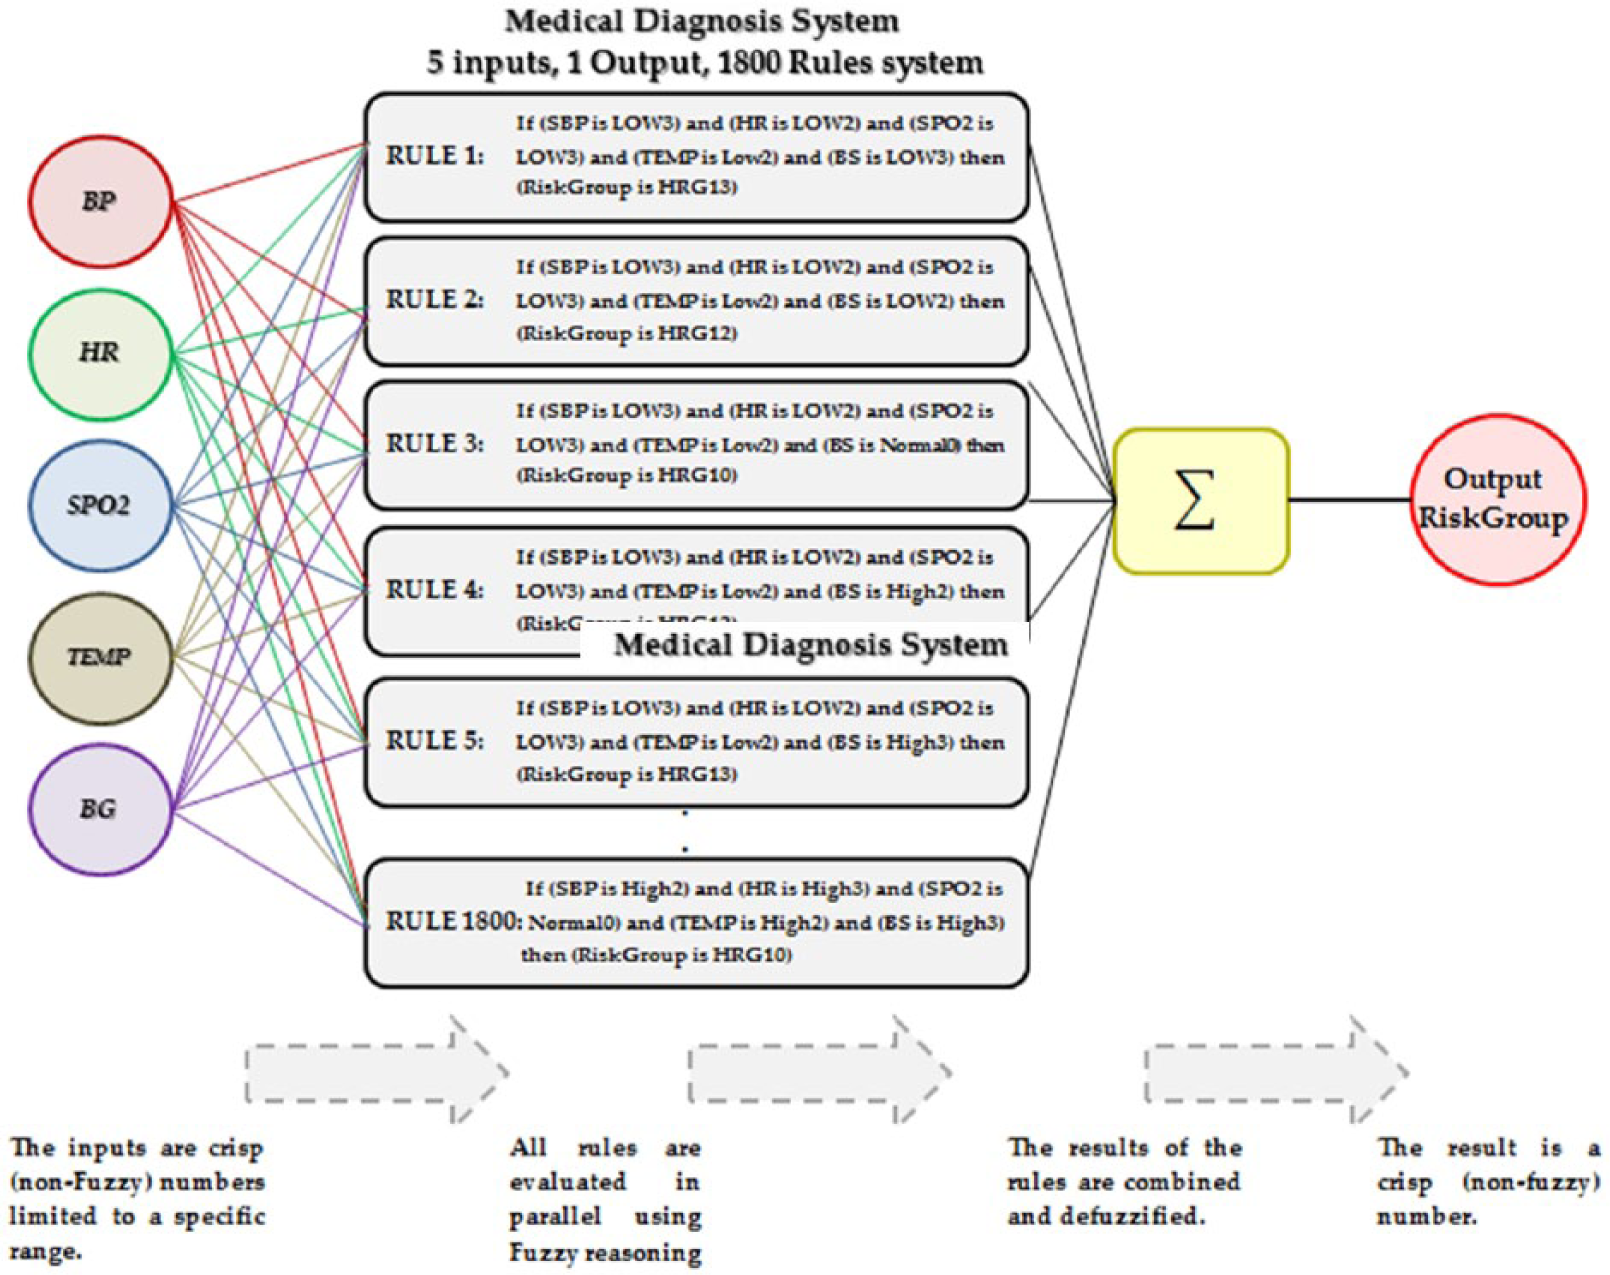
Fuzzy-based system flow.
Fuzzy inference is the process of formulating the mapping from a given input to an output using fuzzy logic. This mapping then provides the basis from which decisions can be made. FIS are composed of three major components: a rule base that is composed of a selection of fuzzy rules, a database that defines the membership functions, and finally a reasoning mechanism for inferring a reasonable output or conclusion. The two most popular FIS used in various fuzzy logic applications are the Mamdani and TSK (Takagi, Sugeno, and Kang) engines. Comparison of the two shows that Mamdani FIS is more intuitive, and its rule base can be easily interpreted. As the rule base has interpretable and perceptive nature, Mamdani-type FIS is broadly used in decision support applications. It can be used directly for both multiple-input-single-output systems as well as multiple-input-multiple-output systems. However, TSK systems can be used only in multiple-input-single-output systems. 41 Furthermore, Mamdani FIS has output membership function and an output distribution, whereas TSK FIS has no output membership function nor does it have any output distribution. Mamdani FIS computes a crisp result by defuzzification, whereas TSK uses a weighted average on rule’s consequent to calculate the crisp result. The majority of reported applications in the literature are developed using a Mamdani FIS mainly due to its simple structure and expressive power. It is beyond the scope of this article to provide a comprehensive discussion of the two FIS; for further details on both FIS, readers are referred to the previous studies.42–45
In the system implemented here, the Mamdani inference mechanism approach is used. Using this approach, and to compute the output of the inference system, given a set of inputs, one must first determine a set of fuzzy rules, then fuzzify the inputs using membership functions, next we combine the fuzzified inputs according to the fuzzy rules to establish a rule strength. We then determine the consequence of the rule by combining the rule strength and the output membership function; following this, we next combine the consequences to obtain an output distribution and finally defuzzify the output distribution if a crisp result is expected. 45 In this work, using the fuzzified vital signs of the inputs as described in section “MEWS and inputs fuzzification,” a set of rules is generated. The fuzzy rules are developed using a knowledge base acquired by interviewing health experts at the RCDR with the MEWS scoring system providing the basis defining the various categories or sets for each vital sign. The rules are developed using “IF premise (antecedent) THEN conclusion (consequent)” structure.46–48
The number of rules, {R1, R2, R3, …, RN}, is obtained using the formula given by equation (1)

where N is the total number of possible rules for the fuzzy system, and PN is the number of categories defined for each variable. Since the number of regions or categories for the five vital signs are (Table 3) HR = 6, SBP = 5, SPO2 = 4, TEMP = 3, and BG = 5, the number of rules possible would be N = 6*5*4*3*5 = 1800.
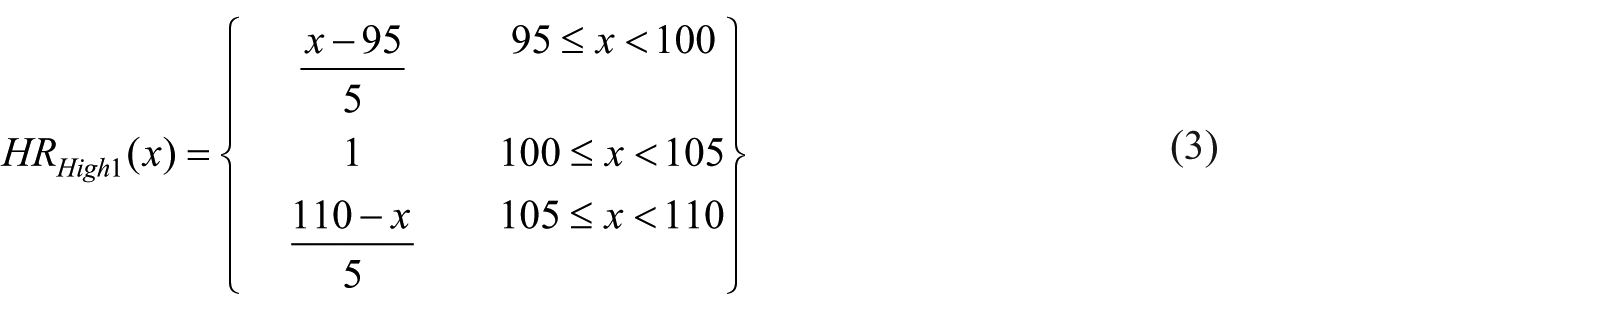
In a typical fuzzy system, the inference process consists of four steps as follows: fuzzification of the input variables, application of the fuzzy operator (AND in this case) in the antecedent and rule evaluation, aggregation of the consequents across the rules, and finally defuzzification.
We will demonstrate the application of these steps using an example of patient with the following vital signs readings: TEMP = 37, HR = 97, SBP = 200, SPO2 = 92, BS = 250.
The first step is to take the inputs and determine the degree to which they belong to each of the appropriate fuzzy sets via membership functions. Fuzzification of the inputs is performed at run time and consists of assigning membership degrees to the crisp inputs using a table lookup or function evaluation.
For example, in the above case, we assumed that the HR is 97; as shown in Figure 2 and Table 3, this value is located between sets Normal0 and High1, and corresponds to a membership value µ = 0.6 for the NORMAL0 set and a µ = 0.4 for the High1. These values are determined using the
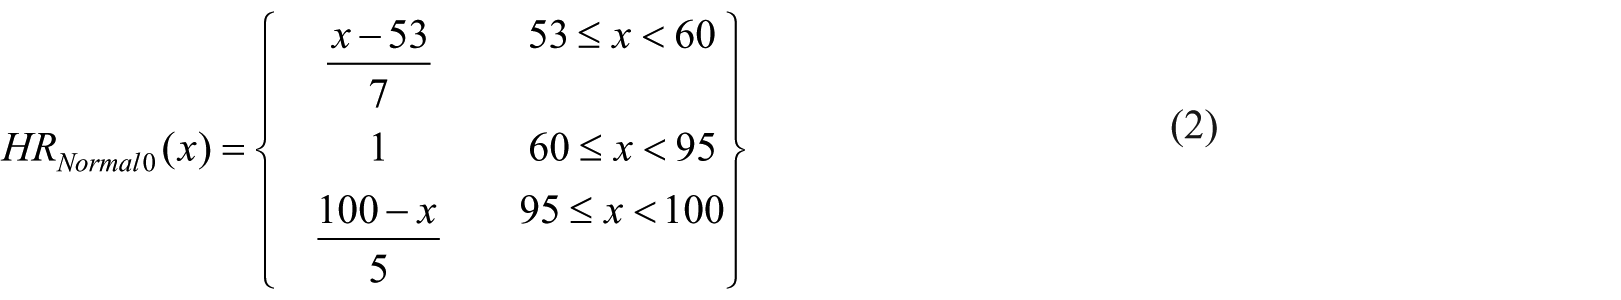
where
Next and after the inputs are fuzzified, the degree to which each part of the antecedent is satisfied for each rule will be known. If the antecedent of a given rule has more than one part, the fuzzy logical operators are applied to evaluate the composite firing strength of the rule.
For example, the above input values will fire rule number 1660. From this rule, the five different components of the antecedent ((SBP is High2), (HR is Normal0), (SPO2 is LOW1), (TEMP is Normal0), and (BS is High3)) yield the fuzzy membership values 1, 0.4, 1, 1, and 1 respectively. The fuzzy AND operator simply selects the minimum of the five values or 0.4, and the fuzzy operation for the rule is complete. This process is true for all rules that fire or have non-zero contribution.
Since decisions are based on the testing of all of the rules in a FIS, these rules must be combined in some manner in order to make a decision. Aggregation is the process by which the fuzzy sets that represent the outputs of each rule are combined into a single fuzzy set. Aggregation only occurs once for each output variable, just prior to the final defuzzification step. The input to the aggregation process is the list of truncated output functions returned by the implication process for each rule (the implication method is defined as the shaping of the output membership functions on the basis of the firing strength of the rule. The input for the implication process is a single number given by the antecedent, and the output is a fuzzy set).
The output of the aggregation process is one fuzzy set for each output variable. Figure 5 depicts two rules placed together to show how the output of each rule is combined or aggregated into a single fuzzy set whose membership function assigns a weight for every output value.
Aggregation of the output.
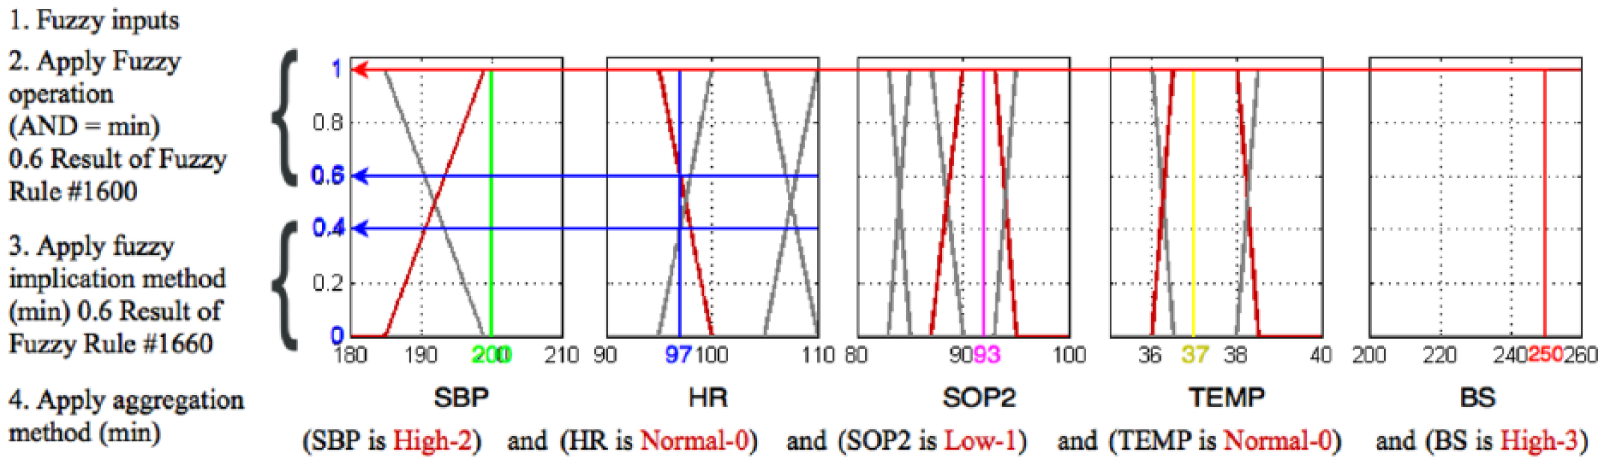
The output of our fuzzy system is a “Risk Group,” which identifies the degree of risk in the patient’s case. A patient case can be identified using 1 of 15 possible risk groups. The higher the value of the group, the higher the health risk of the patient. In this system, we have defined 15 fuzzy sets for the output variable risk group (NRM, LRG1, LRG2, LRG3, LRG4, HRG5, HRG6, HRG7, HRG8, HRG9, HRG10, HRG11, HRG12, HRG13, and HRG14). Membership functions for these sets are selected to be triangular in nature. The membership functions’ details are shown in Table 5 including the range for each triangular set and the linguistic terms identifying the different sets.
The output variable (Risk group) ranges that correspond to each fuzzy set.
The inference method used is the root sum square (RSS) that has the formula presented in equation (4)

where R1, R2, …, Rn are the strengths values of the different rules which share the same conclusion. In essence, the RSS techniques combine the effects of all applicable rules, scale the functions at their respective magnitudes, and compute the fuzzy centroid of the composite area.
As an example, for the inputs in the example above (SBP of 200, HR of 97, SPO2 of 92, TEMP of 37, and BS of 250) select regions of the “HRG6” and “HRG7” output membership functions. The respective output membership function strengths from the possible rules that are fired (R1600 and R1660) are calculated using equation (4) and provided in equations (5) and (6), respectively


Finally, the defuzzification of the data into a crisp output is accomplished using the “fuzzy centroid” algorithm. This is the most prevalent and intuitively appealing among the defuzzification methods.4,49 It is accomplished by combining the results of the inference process and then computing the “fuzzy centroid” of the area. The weighed strengths of each output member function are multiplied by their respective output membership function center points and summed. Finally, this area is divided by the sum of the weighed member function strengths, and the result is taken as the crisp output (equation (7))

Where n is the number of output members. By applying equation (7), the results for the set of inputs assumed in the example above are shown in equation (8)
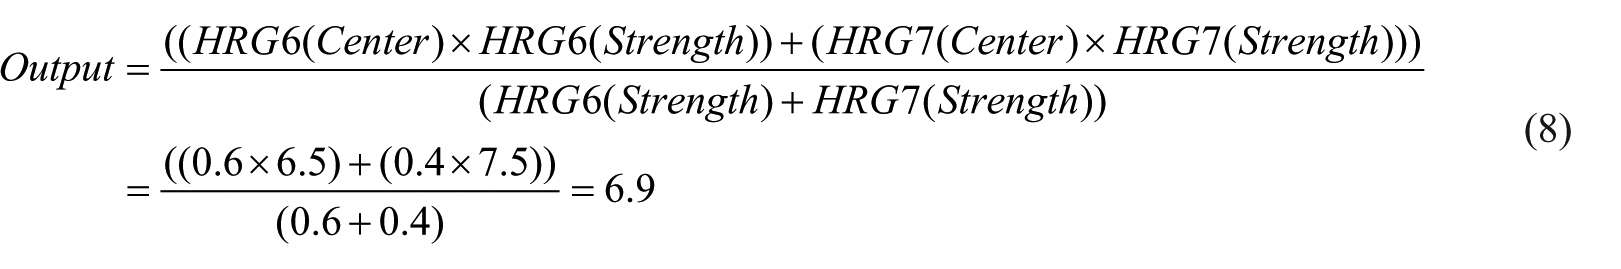
The computed result indicates that the patient is classified or belongs to the HRG7 Risk Group. A rule editor window with the rules and a rule viewer caption showing the results of the example discussed above are shown in Figure 6.
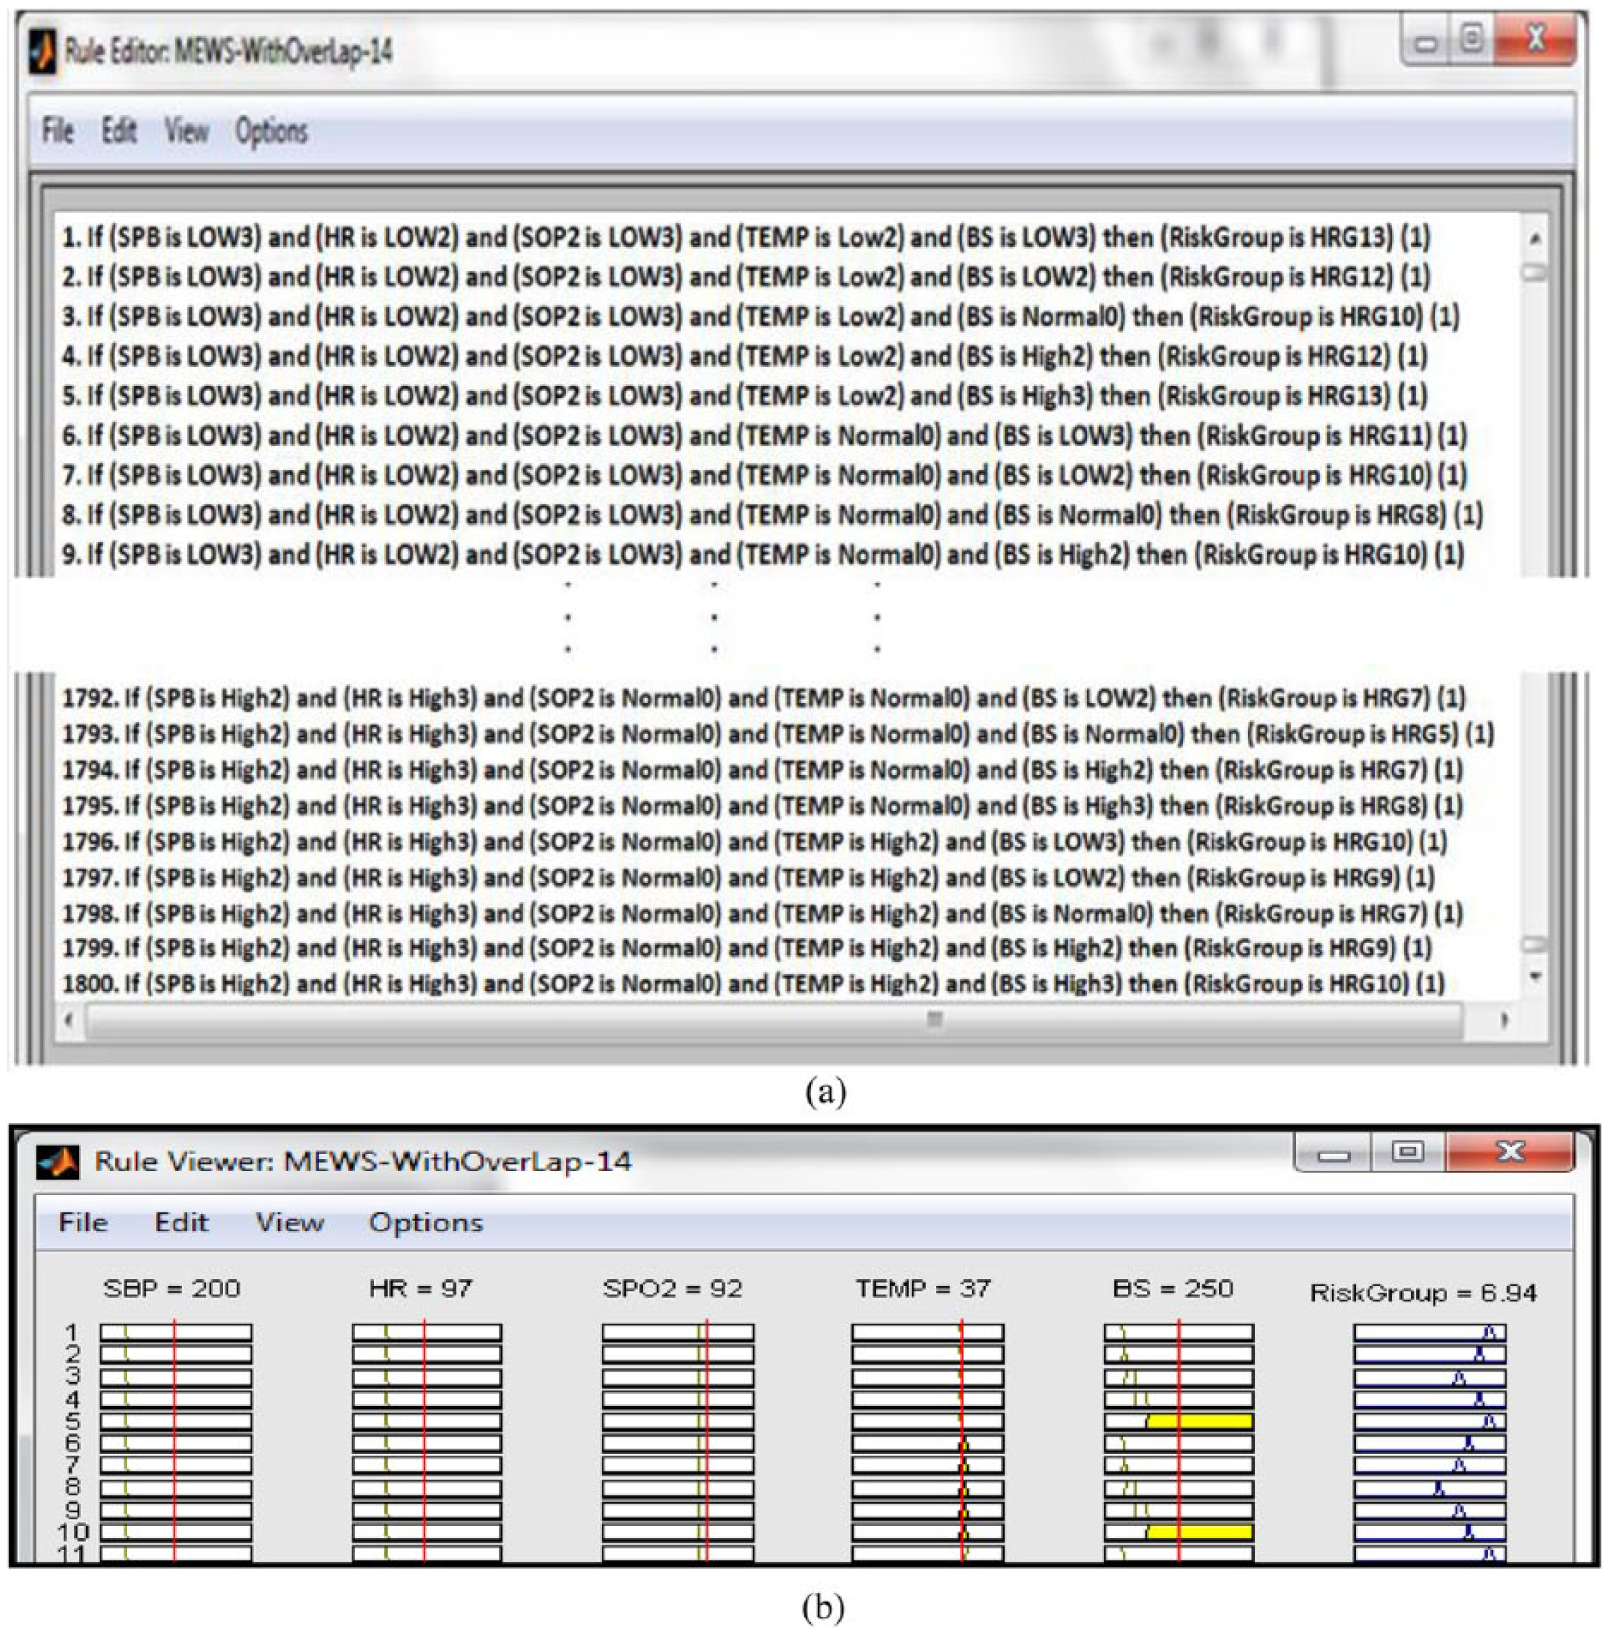
MATLAB simulation windows: (a) rule editor showing the rules and (b) rule viewer showing results of the above example.
Results and discussion
Results
The testing and evaluation of the proposed fuzzy logic–based system is carried out by collecting the vital signs readings from 34 patients affiliated with RCDR (Table 1). For comparison purposes, the vital signs of each patient are fed to the proposed fuzzy logic system as well as the MEWS scoring system. 1 Samples of the comparison result between the risk groups’ status as returned by the proposed fuzzy system and the risk groups’ status indicated by the existing MEWS scoring system are shown in Tables 6, 7, and 8. Figure 6 is a graphical depiction of the 34 patients’ results and how the two approaches compare.
Sample of normal group patients’ results.
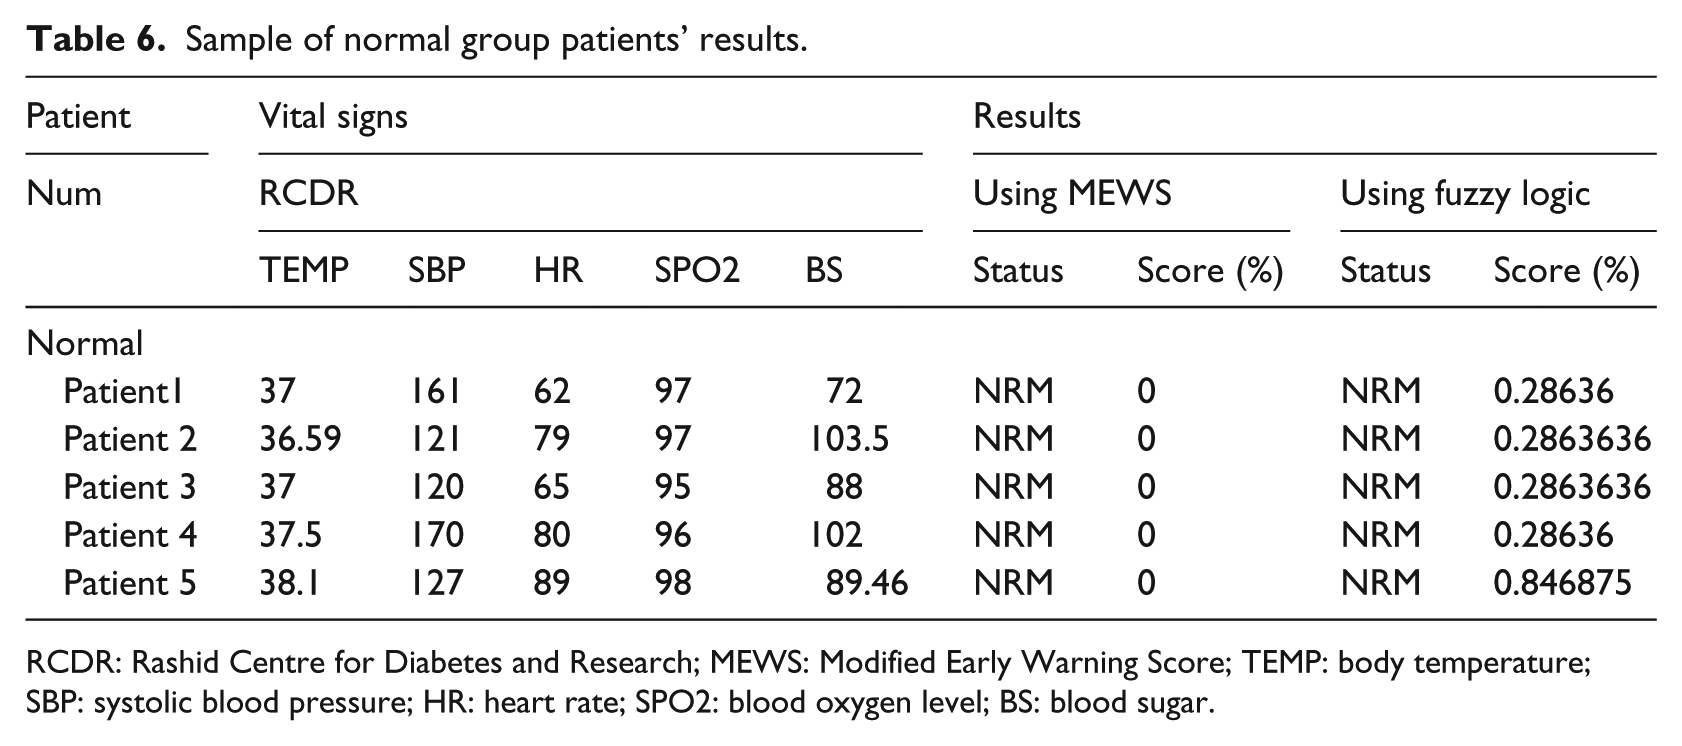
RCDR: Rashid Centre for Diabetes and Research; MEWS: Modified Early Warning Score; TEMP: body temperature; SBP: systolic blood pressure; HR: heart rate; SPO2: blood oxygen level; BS: blood sugar.
Sample of LRG patients’ scores.
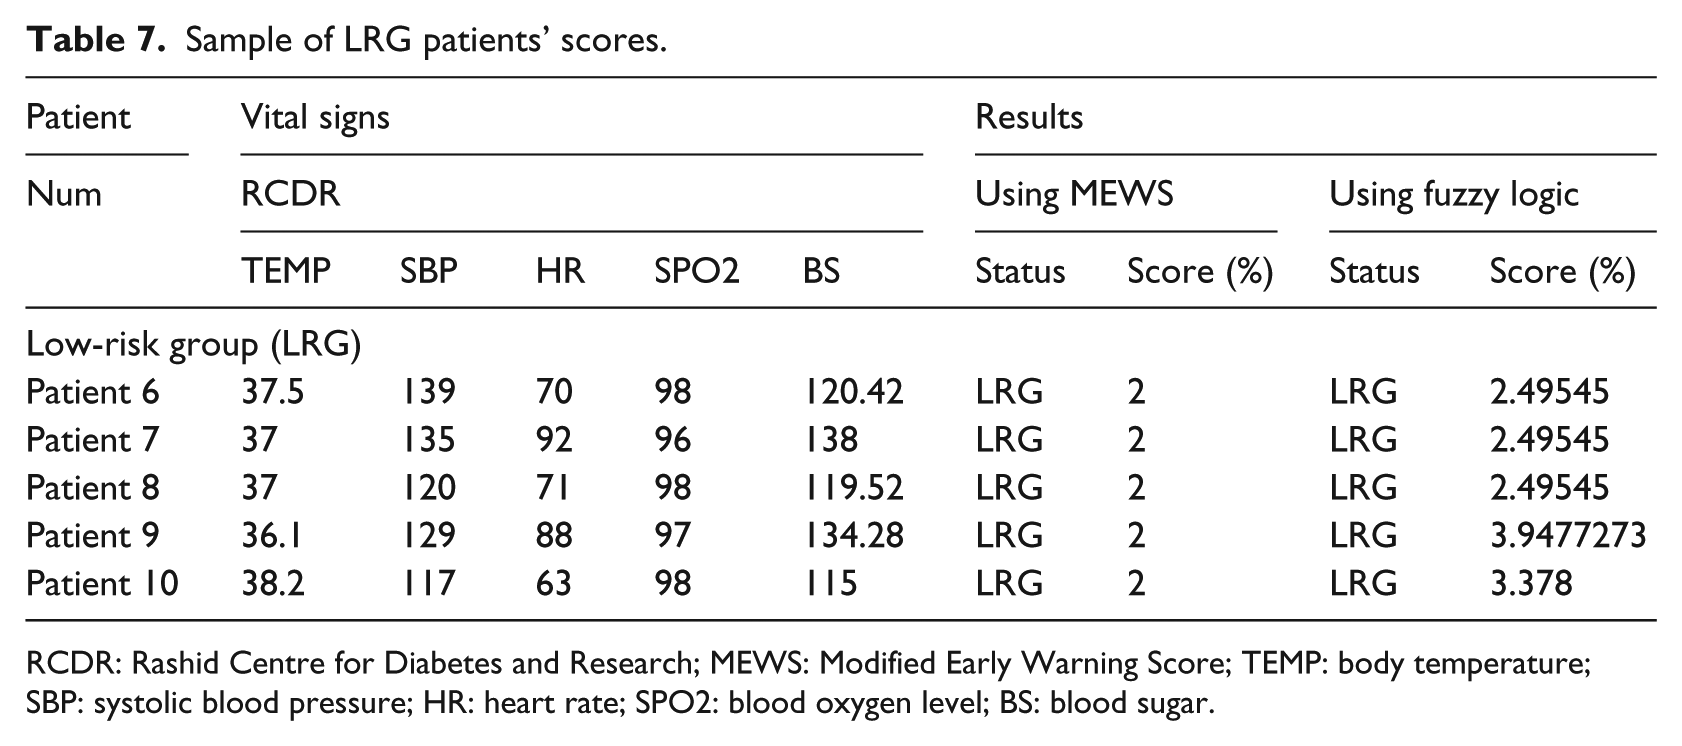
RCDR: Rashid Centre for Diabetes and Research; MEWS: Modified Early Warning Score; TEMP: body temperature; SBP: systolic blood pressure; HR: heart rate; SPO2: blood oxygen level; BS: blood sugar.
Sample of high-risk group patients’ status.
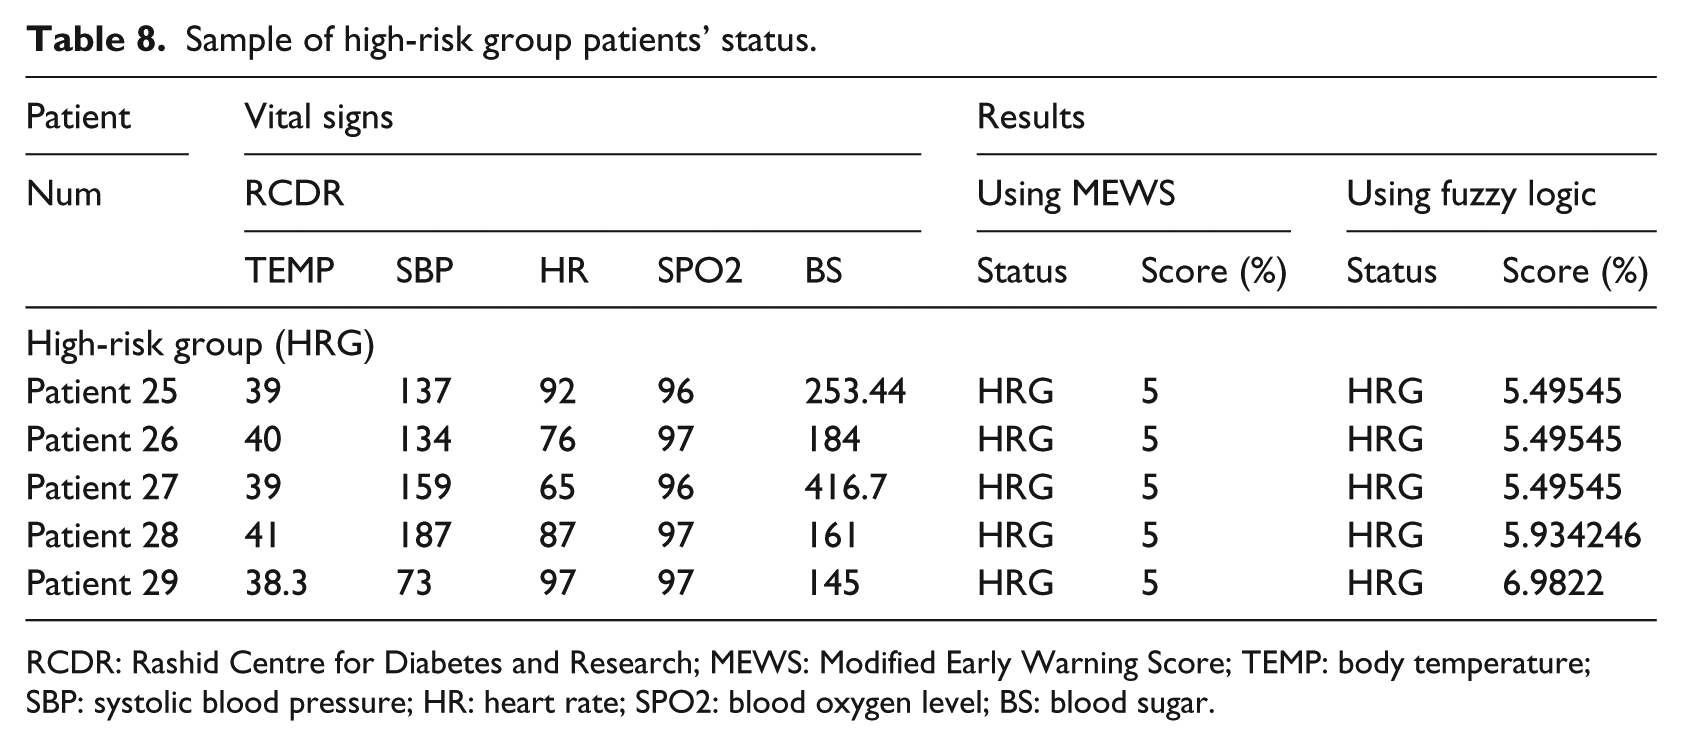
RCDR: Rashid Centre for Diabetes and Research; MEWS: Modified Early Warning Score; TEMP: body temperature; SBP: systolic blood pressure; HR: heart rate; SPO2: blood oxygen level; BS: blood sugar.
Discussion
Table 6 shows sample of the normal category patients’ results for both systems, the fuzzy and the MEWS.
Out of the 34 patients, 5 fell in the normal group category, 19 in low-risk group (LRG), and 10 are diagnosed to be in the high-risk group (HRG). For the first five normal (NRM) patients, the MEWS system scores were zero as expected. As for the fuzzy logic system, the five patients’ condition falls within the Normal category, but the absolute score is between zero to one, which indicates the level of normality. For example, patient #1 MEWS score is zero, while the corresponding fuzzy logic score is 0.28636, however, patient #5 MEWS score is zero and the fuzzy logic score is 0.846875. This means that the fuzzy logic system provide a relatively better indication of the assumed normality rather than a crisp logic 0 as the case with the MEWS system. This will assist the physicians to better understand the level of normality and hence the precise patient condition.
For the LRG category, 19 patients out of the 34 were diagnosed as LRG. Sample results of both proposed Fuzzy System and MEWS system are shown in Table 7. A closer look at the MEWS system classifications shows that five patients scored an absolute value of 2 but the same patients scored between 2.49545 and approximately 3.95 in the fuzzy approach. Even though patients are classified in the same LRG in both MEWS, the fuzzy system computed more precise numeric scores.
For the five patients in the HRG category, the proposed fuzzy system results were in agreement with the MEWS system risk group category, that is, HRG group. On the numeric scale, the MEWS numeric scored scale is absolute 5 compared with more precise numeric scale in the proposed fuzzy system which are 5.4954545, 5.9342466, …, 6.9822222. Table 8 shows samples of five HRG category and numeric scales. Again, this precision gives the physician a better idea about the status of the patient; after all, not all HRG group patients with score of 5 have the same health vital signs readings or may need exactly the same care.
The graph of Figure 7 shows the MEWS scoring system and the proposed fuzzy system are in agreement as far as the category, but the scores returned by the fuzzy system are more precise and indicative and hence providing the medical personnel with a better insight into the medical condition at hand.
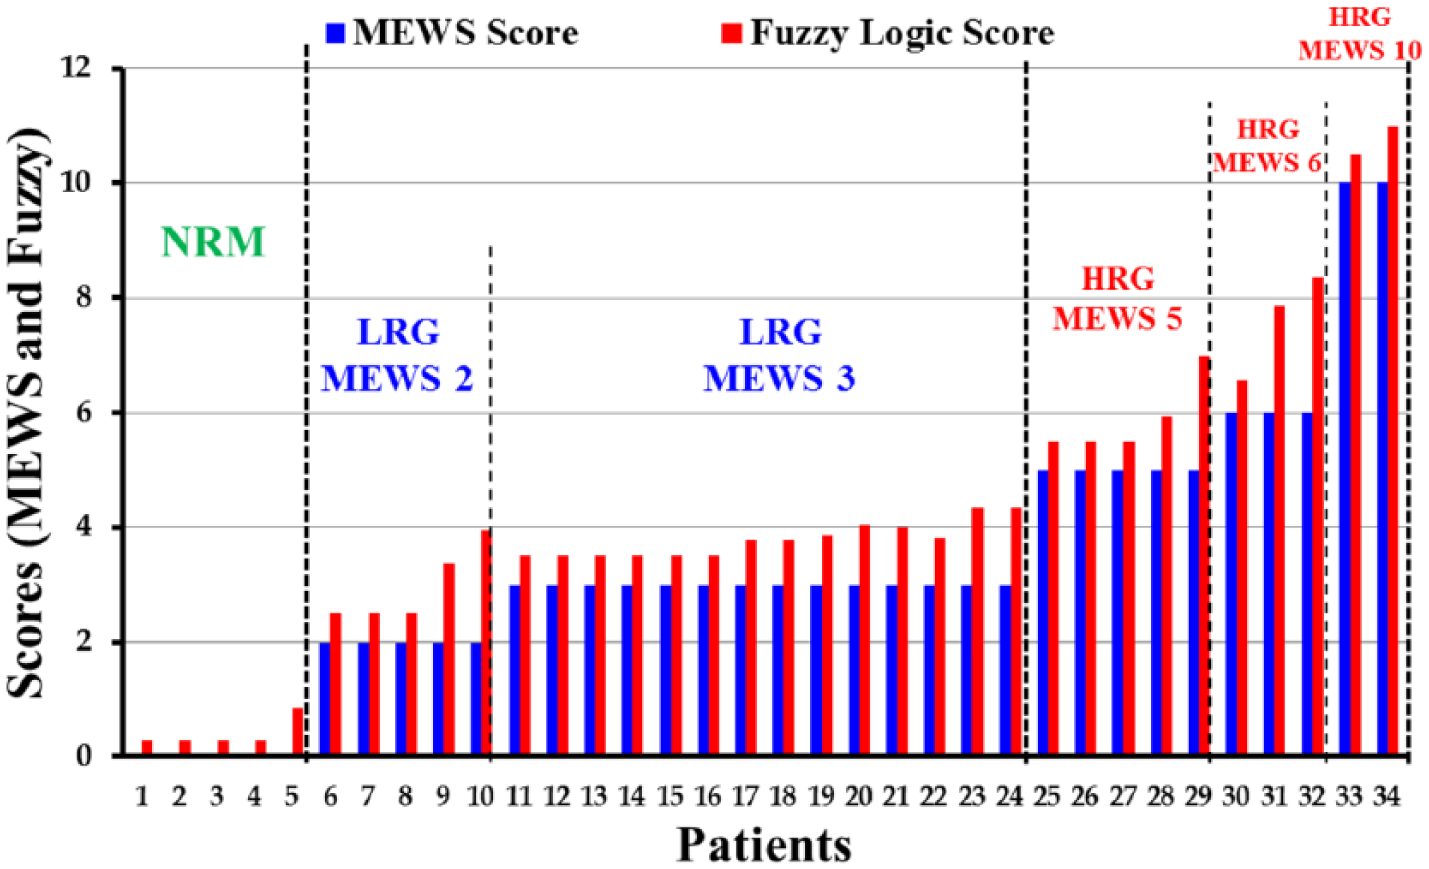
Comparison graph (MEWS and Fuzzy System).
In summary, the clinical implication of applying a fuzzy-based warning system instead of modified early warning system is very obvious in stratifying the clinical care need for patients and how early clinicians should attend to the patient. Looking at the comparison between the two systems from the clinical point of view, we observe that what is computed as a 0 score (normal) on the MEWS can be between 0.28 and 0.84 (Table 6) on fuzzy logic, for the same patient. So if that patient is monitored by fuzzy logic, although both systems indicate a normal condition, however on fuzzy logic, it showed 5 different grades which might allow the clinician to make an early intervention before the patient’s condition deteriorate further. Early intervention will prevent clinical deterioration, and it is very cost-effective to avoid admitting that patient to high level of care like intensive care. The same argument applies, for example, if the patient scores 2 (LRG) in MEWS, in comparison with fuzzy between 2.4 and 3.37 (Table 7). From the clinical point of view and patient condition, there is a difference between 2.4 and 3.37, and early and more attention will be given to same patient if he scores 3.37 using Fuzzy logic, while scoring 2 in MEWS. Hence, the advantages of fuzzy logic over MEWS are very clear in terms of affirming or shedding light on the degree of clinical care needed for the same patient.
Conclusion
A wireless fuzzy logic–based patient’s health monitoring and warning system is designed, implemented, and tested. The system uses RFID-based portable patient’s sensors units for vital signs measurement. The collected data are transmitted to a server that hosts a fuzzy logic–based system for analysis and classification of the patient condition into 1 of 15 risk groups. Following the classification step, the hospital personnel will subsequently determine the procedure to be followed depending on the risk group. The well-known MEWS scoring system (currently used in practice) provided the basis for designing the fuzzy system and for comparison of results as well. The essence of the study was to ascertain the degree to which each method represents the true diagnosis of the patient. Testing showed the fuzzy-based system outcomes are in full agreement with the existing early warning system as per category, and more precise numerically.
A clear advantage of the fuzzy approach is based on the fact that fuzzy diagnoses resembles human decision-making with its ability to work from approximate reasoning and ultimately finds a precise solution. Fuzzy logic provides a simple mechanism to reach a definite conclusion based upon ambiguous, vague, and imprecise input information. One disadvantage of the system is the high dependency of its response on the amount of available information in the rules database. When the available amount of information is high, the system response is useful for making diagnosis. A fuzzy rule base design has two important objectives. One is to achieve a good approximation. The other is to reduce the number of rules for computation purposes. The main difficulty is that these two objectives are contradictory. Hence, complexity reduction in fuzzy systems has become a valuable research topic. 50 Another aspect involves the selection or the determination of the exact membership functions. Methods for developing these functions include intuition, inference, neural networks, and few others techniques. 4 In this work, following a clear understanding of the problem and discussions with the knowledge expert, we selected triangular and trapezoidal functions. As a matter of fact, one might argue that the precise shapes of these functions are not necessarily critical in their utility; but it is the approximate placement of the curves on the universe of discourses, the number of curves or partitions used, and the overlapping character that are of utmost importance. 4
Footnotes
Appendix 1
To validate the mobile system components, calibration of the different components was carried out at “Rashid Centre for Diabetes and Research” (RCDR), Ajman, UAE. The testing was conducted by the center’s nurses on a sample of patients. The testing setup used the RCDR built-in and stationary vital signs reading devices and the mobile system radio-frequency identification (RFID)–based devices. Details of calibrating the blood pressure sensor are described next.
The blood pressure (BP) device’s validation method used was based on the protocol of the British Hypertension Society (BHS). 51 The BHS protocol describes a model of categorizing the differences between tests and standard measurements according to whether these measurements were within 5, 10, 15, or greater than 15 mm Hg, and accordingly, a grade of A, B, C, or D is assigned to the device used. The final grade of the system’s device is based on the number of differences that fall within these categories. The differences are calculated by subtracting the RCDR device measurements from those obtained using the RFID device. When differences are compared and classified, their absolute values are used. A difference falls into one of the following four groups according to its rounded absolute value for systolic blood pressure (SBP) and diastolic blood pressure (DBP):
The validation of the RFID BP device was performed using 23 patients. A total of 10 of the individuals were males, and 13 were females. A total of 46 measurements were evaluated. One measurement was taken with the RCDR BP monitor and another with the implemented system RFID BP monitor. The two measurements were independently analyzed, and the mean differences between the blood pressure measurements and the standard deviations of those differences were calculated. The results were analyzed according to the grading system of the BHS protocol.
The percentage of the RFID device measurements differing from the RCDR device measurements by 5, 10, and 15 mm Hg or less are calculated and tabulated in Table 9. When the measurements obtained using the RFID BP device were compared with those taken with the RCDR BP device, a difference of ±15 mm Hg was observed in 95.65 percent of the systolic and 95.65 percent of the diastolic blood pressure measurements; a difference ≤±10 mm Hg was observed in 86.9 percent of the systolic and 91.3 percent of the diastolic blood pressure measurements; a difference ≤±5 mm Hg was observed in 65.2 percent of the systolic and 66 percent of the diastolic blood pressure measurements. Overall, the RFID device earned a B grade which is acceptable based on the BHS criteria. 51 Similarly, to evaluate the accuracy and precision of the RFID blood sugar monitor in comparison to the RCDR reference instrument, we applied the Clarke error grid analysis method.38,52–54
Declaration of conflicting interests
The author(s) declared no potential conflicts of interest with respect to the research, authorship, and/or publication of this article.
Funding
The author(s) received no financial support for the research, authorship, and/or publication of this article.