
Abstract
Data mining provides the methodology and technology to transform huge amount of data into useful information for decision making. It is a powerful process to extract knowledge and discover new patterns embedded in large data sets. Data mining has been increasingly used in medicine, particularly in cardiology. In fact, data mining applications can greatly benefits all parts involved in cardiology such as patients, cardiologists and nurses. This article aims to perform a systematic mapping study so as to analyze and synthesize empirical studies on the application of data mining techniques in cardiology. A total of 142 articles published between 2000 and 2015 were therefore selected, studied and analyzed according to the four following criteria: year and channel of publication, research type, medical task and empirical type. The results of this mapping study are discussed and a list of recommendations for researchers and cardiologists is provided.
Introduction
Heart disease is a broad term used to describe a range of diseases that affect the heart. The various diseases that fall under the umbrella of heart disease include diseases caused by damage to the blood vessels (coronary artery disease), valvular heart disease, abnormal heartbeats (heart arrhythmias), thick heart muscle (cardiomyopathy), heart defect and heart infection. 1 The consequences of heart disease are very diverse. They can range, for instance, between high blood pressure, cardiac insufficiency, arrhythmia, stroke, heart attack and sudden cardiac arrest, depending on which part of the cardiovascular system is affected. Thereby, heart disease is a very serious disease that, if not treated properly and on time, can lead to very serious complications, including death. This is why heart disease is considered as one of the main priorities in medical research, which in turn generates huge amounts of data. These increasing volumes of data are very well suited to be processed using data mining (DM) techniques that can handle them with efficiency.
Using DM methods in heart disease studies is one of the best ways in which to use the large volumes of heart disease data sets available to extract knowledge. In fact, according to Fayyad et al., 2 DM is defined as “a process of nontrivial extraction of implicit, previously unknown and potentially useful information from the data stored in a database.” DM can therefore be considered as a powerful process to extract knowledge and discover new patterns embedded in large data sets. 3 DM techniques have already been applied in various areas for more than four decades. Recent studies show an increase in the amount of applications using DM techniques in several domains such as education,4,5 clinical medicine, 6 financial fraud detection7,8 and genetic data analyzing. 9
The studies on the application of DM techniques in medicine in general and cardiology in particular have recently undergone a rapid growth in order to assist physicians, improve public health and support patients. To the best of our knowledge, there is no existing systematic mapping study (SMS) that focuses on DM-based empirical studies carried out in cardiology covering all DM tasks and all cardiology disciplines. We were therefore motivated to perform an SMS regarding the application of DM techniques in cardiology in order to analyze the empirical studies available, synthesize the outcomes and identify the challenges in this field of research. We therefore selected and studied 142 papers published in the period from 1 January 2000 to 31 December 2015. Each of these studies was classified with regard to the following: publication channel, year of publication, research type, medical task and empirical type. The objective of this SMS is to summarize and analyze evidence concerning the following: (1) the research type most frequently adopted by researchers, (2) the medical tasks that receive most attention and (3) the empirical type most frequently used.
This article is organized as follows: Section “Related work” presents an overview of the existing reviews in literature regarding the DM-based studies in cardiology. Section “Research methodology” describes the research methodology used in our study. Section “Results” reports the results. Section “Discussion” discusses the findings of this SMS. Section “Implications for researchers” presents implications for researchers. Finally, our conclusion and future work are presented in section “Conclusion.”
Related work
In this section, previous reviews associated with DM in cardiology are outlined. This section aims to better understanding of cardiac knowledge extraction background. For this reason, five review papers are analyzed.
Kumari and Godara 10 reviewed in their study four DM classification techniques to predict cardiovascular disease. They analyzed and compared RIPPER classifier, decision tree (DT), artificial neural networks (ANNs) and support vector machine (SVM) based on their structure and efficiency. The results of this analysis showed that (1) the classification carried out by RIPPER is computationally inexpensive, (2) DT results are easier to read and interpret, (3) ANN draws consistent conclusion and it can be built and evaluated using a large number of cases and (4) SVM is highly accurate, owning to their ability to model complex nonlinear decision boundaries. 10 Shouman et al. 11 identified in their study gaps in the research on heart disease diagnosis and treatment by reviewing a set of related papers. This review has identified that the application of DM techniques in the diagnosis of heart disease has a significant success, unlike the treatment stage where less attention has been given. Sivagowry et al. presented in their study of application of DM in heart disease prediction based on a limited number of selected studies (13 papers). The review results showed that classification task in DM plays a vital role in heart disease prediction when compared with prediction, association and clustering. Moreover, text mining the medical data was identified as another extension in predicting the health care data. 12
Bharti and Singh 13 studied and compared various DM algorithms that can be used to predict the heart disease in order to identify the best method of prediction of disease. The techniques analyzed include the following: genetic algorithm (GA), particle swarm optimization (PSO), ANN, DT, K-nearest neighbors and Naïve Bayes. The analysis results showed that combining GA, ANN and PSO with various DM techniques will enhance the performance and achieve high accuracy rate. Feng et al. 14 provided in their study insights for the main features of DM and their applications of integrative medical studies in coronary heart disease (CHD). The goal of this study is to analyze the progress and prospect in this field. The results showed that the application of DM methods in clinical intervention to CHD is still in the developing stage, and its own methodology and practical application are continuously improved. Moreover, the study identified four development directions for CHD in the future including (1) following the general rules of DM methods, (2) combining it with the characteristics of clinical practice, (3) continuing to explore suitable DM methodology and (4) getting continuous optimization improvement in practice on the basis of the existing databases. 14
Research methodology
The objective of an SMS is to identify and classify all research related to a broad research area. 15 It provides an overview of a topic area and identifies the quantity and type of research and results available within it. The research questions (RQs) for such a study are quite high level and include issues such as which sub-topics have been addressed, what empirical methods have been used and what sub-topics have sufficient empirical studies to support a more detailed systematic review.
Figure 1 presents the mapping process which involves five steps, namely, definition of RQs, conducting the search for relevant papers, screening of papers, keywording of abstracts and data extraction and mapping. Each process step has an outcome; the final outcome of the process is the systematic map. A mapping study differs from a literature review 16 which reviews primary studies of a specific research area in depth and describes their methodology and results.
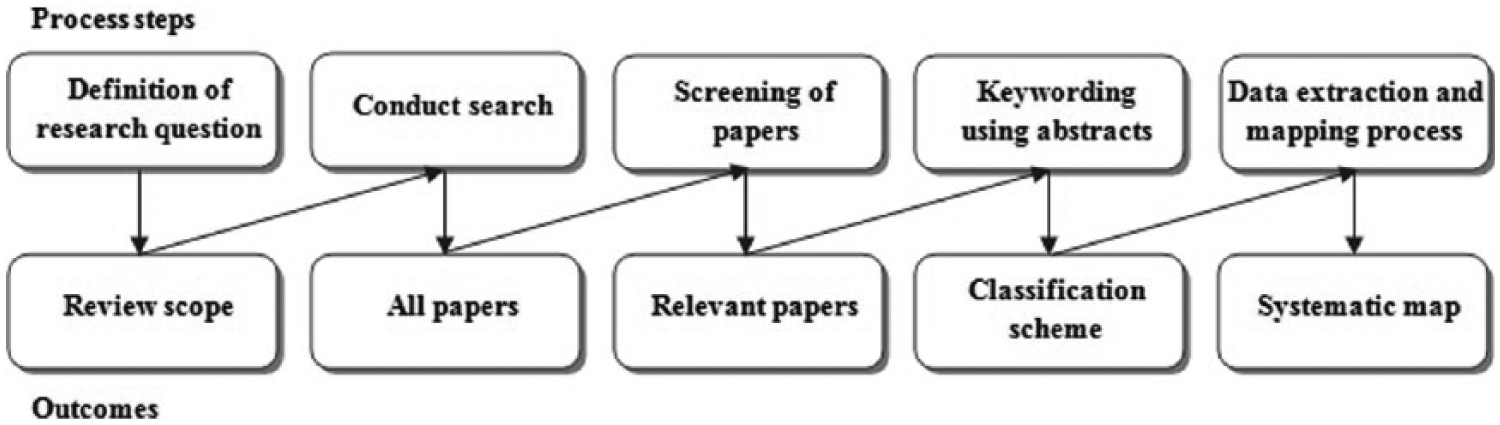
Systematic mapping study process.
RQs
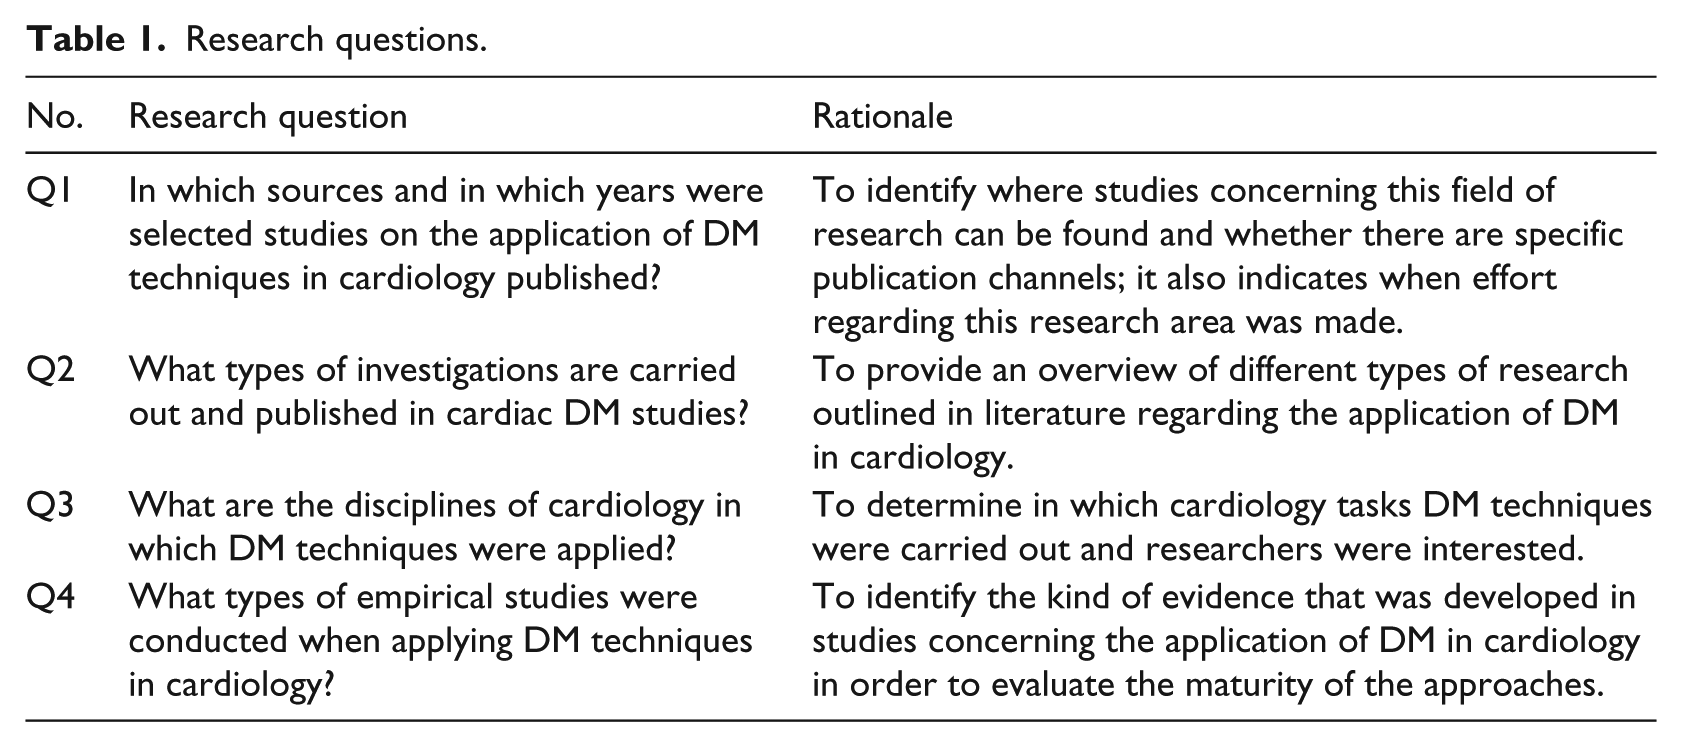
The main goal of our mapping study is to identify, analyze and synthesize articles published since 2000 regarding the application of DM techniques in cardiology. To obtain a more detailed and comprehensive view of the topic, the overall objective was divided into four concrete RQs, which are presented in Table 1 along with their motivations.
Research questions.
Search strategy
Once the RQs have been determined, it is essential to identify and precisely state the search strategy to be followed. The primary studies were therefore identified by means of a search string which was used in the following eight digital databases: IEEE Xplore, SpringerLink, DBLP Computer Science Bibliography, ScienceDirect, ACM Digital Library, MEDLINE (Medical Literature Analysis and Retrieval System Online), Embase (Excerpta Medica Database) and CINAHL (Cumulative Index to Nursing and Allied Health Literature). The reasons for choosing these digital libraries were as follows: (1) they collect articles covering the fields of computer science, medical informatics and cardiology, which represent the areas of interest for this study; (2) they index millions of articles from diverse types of publication channels such as journals, conferences and workshops and (3) they have been used as sources for previous systematic reviews related to computer science in cardiology. 3
The search string should provide the maximum coverage but be of a manageable size. Thus, in order to determine the search string, the major terms matching the RQs presented in Table 1 were derived and the synonyms for the main terms were identified. The Boolean OR was used to join alternative terms and the Boolean AND was used to link the major parts. 17
The complete set of search string was designed as follows:
(cardi*
AND
(“data mining”
AND
(model*
Study selection
The selection process aims to filter the candidate papers that were selected by applying the search string to the libraries chosen in order to identify the most relevant articles, based on their titles, abstracts and/or keywords, as regards the objective of this study. This signifies that when several papers report the same study, only the most recent should be considered and included. Moreover, in the case of repeated studies found in different publication channels, only one study is considered.
Inclusion and exclusion criteria were applied to the candidate papers so as to identify and include studies that would be relevant to answer the RQs in Table 1. We therefore defined the following inclusion criteria in order to select the most appropriate publications. The inclusion criteria (IC) are linked using the OR Boolean operator:
IC1: Empirical studies presenting newly developed DM-based models in cardiology, either evaluated or not.
IC2: Empirical studies validating an existing DM-based model in cardiology.
IC3: Papers providing only comparisons between DM techniques in cardiology without proposing any new developed models.
With regard to the exclusion criteria, papers that met at least one of the following exclusion criteria (EC) were excluded:
EC1: Papers presenting studies on the application of DM techniques in medical disciplines other than cardiology.
EC2: Papers published earlier than 2000 and later than 2015.
EC3: Papers presenting an overview of existing approaches that apply DM techniques in cardiology.
Each candidate paper was evaluated by two authors in order to decide whether it should be included, by considering its title, abstract and keywords. Articles that were judged differently were discussed by the two authors using either the partial text or the full text until an agreement was reached. The reference lists of the relevant papers were also scanned by the authors to find extra relevant papers and add them to the set.
Quality assessment
In order to support the inclusion/exclusion process, it is important to analyze and assess the quality of primarily selected studies for them to be eventually included in the data extraction and reporting process. In fact, the aim of assessing the quality is to ensure that the study findings are relevant and unbiased. 18 We therefore identified a set of quality assessment (QA) questions so as to enhance our study and evaluate the relevance and rigorousness of the candidate studies. The design of this questionnaire was inspired by previous SMSs.18–20
QA1: The study presents empirical evidence that is analyzed quantitatively or qualitatively. The possible answers are “quantitative research (+1)” and “qualitative research (+0).”
QA2: The study presents an experimental design that is justifiable and detailed. The possible answers are “yes: +1,” “no: 0” and “partially: 0.5.”
QA3: The study measures and reports the accuracy rate of the experimental method. The possible answers are “yes: +1” and “no: 0.”
QA4: The study presents a comparison between the proposed empirical method and other methods. The possible answers are “yes: +1” and “no: 0.”
QA5: The study explicitly analyzes the benefits and limitations of the study. The possible answers are “yes: +1,” “no: 0” and “partially: 0.5.”
QA6: The study has been published in a recognized and stable publication source. The possible answers to this question were as follows:
For conferences, workshops and symposia:
(+1.5) if it is ranked CORE 2014 A; (+1) if it is ranked CORE 2014 B; (+0.5) if it is ranked CORE 2014 C; (+0) if it is not in CORE 2014 ranking.
For journals:
(+2) if it is ranked JCR 2014 Q1; (+1.5) if it is ranked JCR 2014 Q2; (+1) if it is ranked JCR 2014 Q3 or Q4; (+0) if it has no JCR 2014 ranking and for other journals.
QA2 is rated partially when the experimental design and the techniques used are explained in a very limited way or one of the techniques used is not detailed. QA5 is scored partially when only one and not both of the benefits and challenges of the study are reported. QA6 is rated based on the CORE Conference Ranking Exercise 2014 21 and the Journal Citation Reports (JCR) 2014. 22 The score for QA6 was identified based on the fact that journals are more advantageous than conferences, workshops and symposia because the possibility of publishing works in Q1 or Q2 journals may be more difficult than in other publication channels. 23
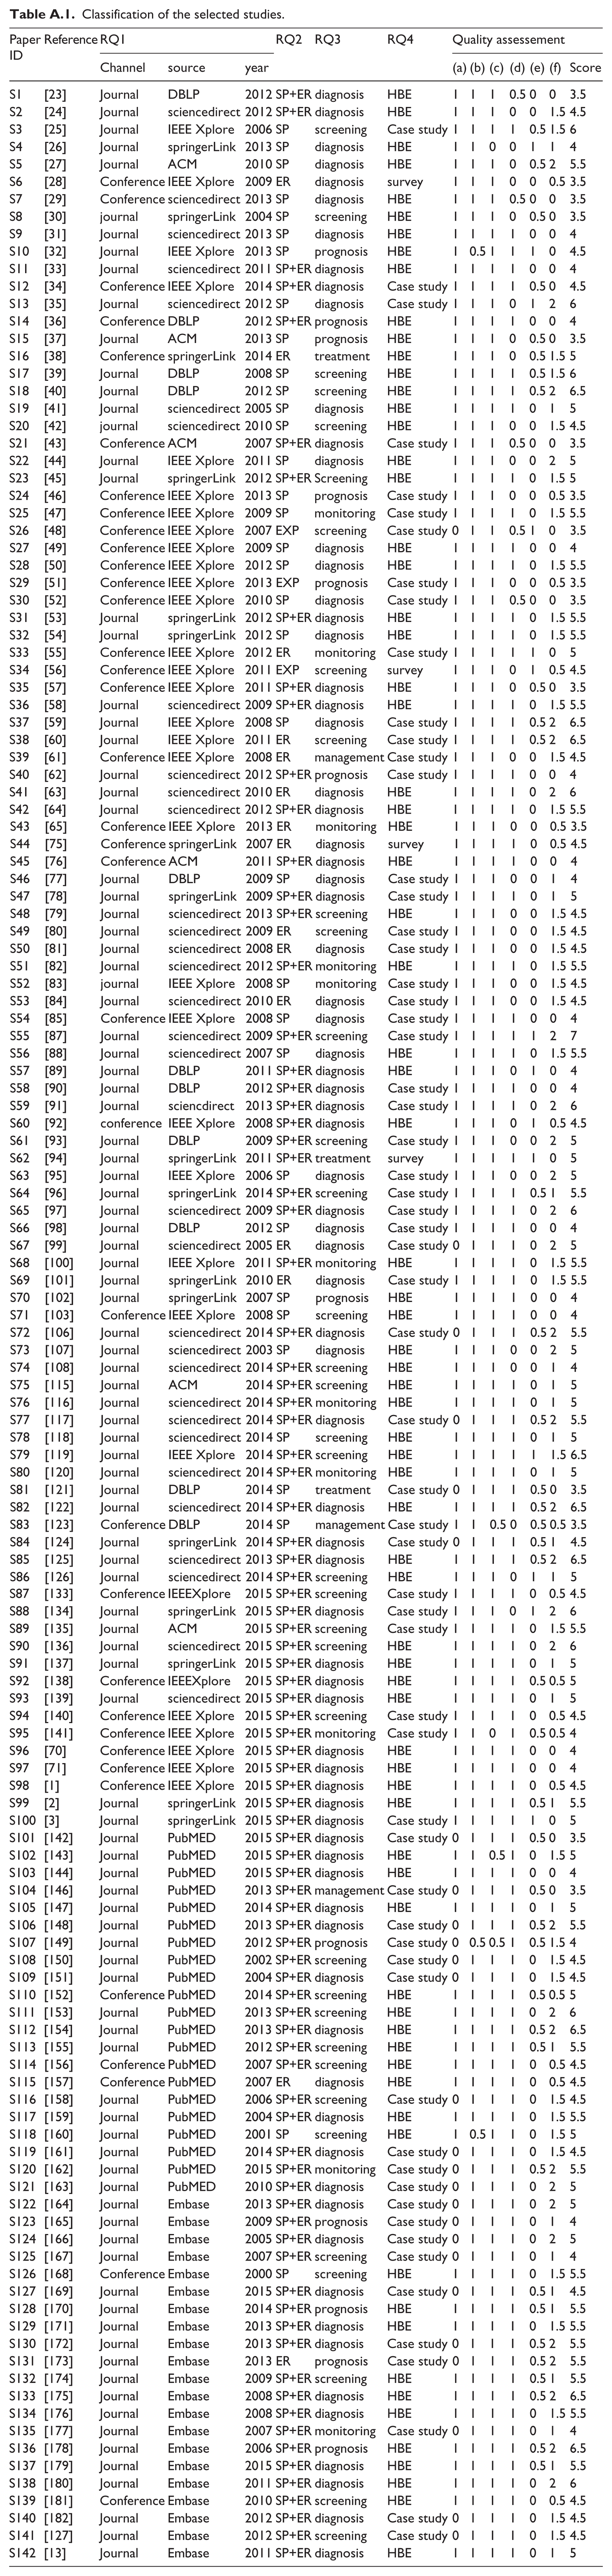
In order to ensure the efficiency of the outcomes of this study, we considered the quality score as an exclusion criterion and therefore selected only those relevant studies with a quality score that exceeded 3.5, which is 50 percent of the perfect score: 7. The complete list of the studies selected and details of their QA can be found in Table A.1 (Appendix).
Data extraction strategy and synthesis
A data extraction form was used to collect all relevant data from the selected studies in order to provide answers to the RQs in Table 1.
RQ1: To answer this question, it is necessary to identify the publication source and channel for each paper. The articles should also be classified per publication year.
RQ2: A research type can be categorized as being of the following types: 16
Evaluation research (ER): An assessment of one or several DM-based techniques in cardiology is conducted.
Solution proposal (SP): The development of a new DM-based technique for cardiology. This can also be an important improvement to an existing DM-based technique.
Experience papers (EP): The researchers report their personal experience when testing the DM-based model developed in a cardiac unit and present the results obtained.
RQ3: The disciplines of cardiology can be classified as follows: 3
Screening: This is used to identify the existence of a disease even though its symptoms have not yet appeared. This is carried out with people who appear in good health.
Diagnosis: This is considered to be one of the crucial tasks in cardiology since it attempts to identify the nature of a disease. The selection of an appropriate treatment method is therefore based on the results of a diagnosis procedure.
Prognosis: This consists of predicting current disease outcomes in terms of mortality and morbidity and the patient’s chances of recovery.
Treatment: This aims to allow the patient to recover and prevent the disease from progressing.
Monitoring: This concerns the observation phase of the disease and the patient’s condition over the time.
Management: This is related to health promotion and medical services.
RQ4: The empirical research type can be classified as follows:24,25
Survey: An approach that allows the necessary information to be gathered by means of a questionnaire that asks several questions.
Historical-based evaluation (HBE): This consists of looking for patterns in historical data.
Case study: An empirical validation of DM techniques in cardiology using data sets collected from hospitals and cardiac units.
In order to synthesize the data extracted to answer the RQs in Table 1, we employed different strategies. The studies selected were therefore ranked on the basis of their QAs and classified in each of the RQs’ answers. A narrative synthesis method was used for all RQs. This method was supported by visualization tools such as tables, a pie chart and a bar chart in a manner consistent with the questions.
Threats to validity
The main threats to the validity of this study are analyzed in the following three respects:
Study selection bias: The selection of relevant studies for this mapping study depended on the search strategy, the literature sources, the selection criteria and the quality criteria. We have therefore constructed the search string to match the RQs identified and have used them to retrieve the relevant studies in the five electronic databases listed above. However, it is possible that some relevant studies were not returned in the autonomic search. We addressed this threat by manually scanning the reference lists of the selected studies to look for extra relevant studies that were not covered by the search in the five electronic databases. Moreover, in order to prevent the relevant studies from being excluded incorrectly, we defined the selection criteria and QAs that strictly comply with the RQs. The final decision as regards study selection was made by means of a double confirmation. In fact, two researchers initially conducted the process of selecting the relevant studies separately, and any disagreements between these researchers were then discussed until a final agreement was reached.
Publication bias: It is well known that in each study, researchers attempt to prove the performance of their DM-based model and may tend to claim that their model outperforms others. There is consequently a risk of overestimating the performance of the DM-based models developed. Fortunately, the fourth inclusion criterion in this study may reduce this threat because it aims to identify the studies that simply conduct comparisons of the DM-based models developed for cardiology and does not propose a new developed model. These comparative studies report the comparison results in an objective way. In these studies, therefore, both positive and negative comparison results are likely to be reported, which to some extent helps reduce publication bias.
Data extraction bias: Data extraction was also one of the most critical tasks in this study. In order to reduce the threat of inaccurate data extraction, the studies were read and analyzed independently by two researchers and the data required to provide answers to the RQs were collected. All disagreements between the extractor and checker were resolved by discussion among all the researchers.
Results
This section presents the findings related to this study. First, we introduce an overview of the result of the selection process; and second, all the results for each RQ are reported.
Overview of the selected studies
A search in the eight electronic databases identified above permitted the selection of 2392 candidate papers, as shown in Figure 2. Of the 2392 papers, 1992 papers were discarded after applying the exclusion criteria, thus leading to the identification of 400 articles regarding the use of DM techniques in cardiology. In fact, the duplicate papers were first discarded and only one study was considered. Besides, the papers reporting the same study were also excluded and only the most recent one was included. Then, the exclusion criteria EC1 and EC2 were applied on the remaining papers leading to the exclusion of 1992 papers. These papers were analyzed in depth in order to select only the most relevant articles. In fact, after scanning the titles, abstracts and keywords, only papers that met at least one of the inclusion criteria were included. At the end of this stage, 166 papers were discarded and 234 articles were included. In the next phase, the reference lists of these relevant papers were scanned and this resulted in the discovery of 21 extra relevant papers that had been missed in the initial search. Finally, in order to assess the quality of the selected papers based on their full texts, the QAs were applied to the remaining studies, resulting in the exclusion of 113 papers with low-quality scores; 142 papers were therefore eventually identified as the final selected studies, which were then used to obtain data extraction information in order to provide answers to the RQs of this review.
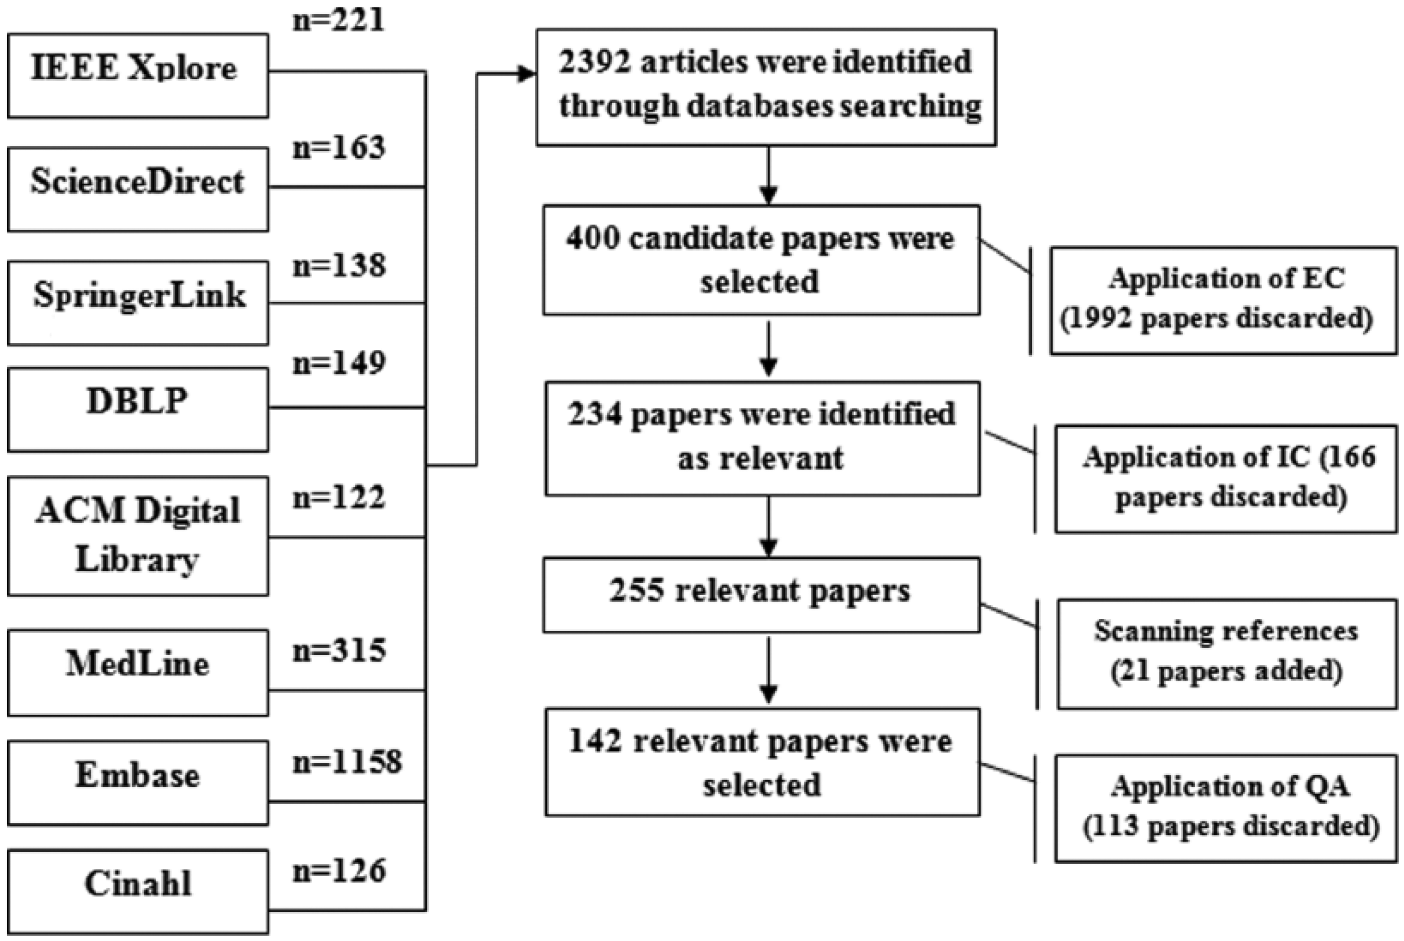
Result of selection process.
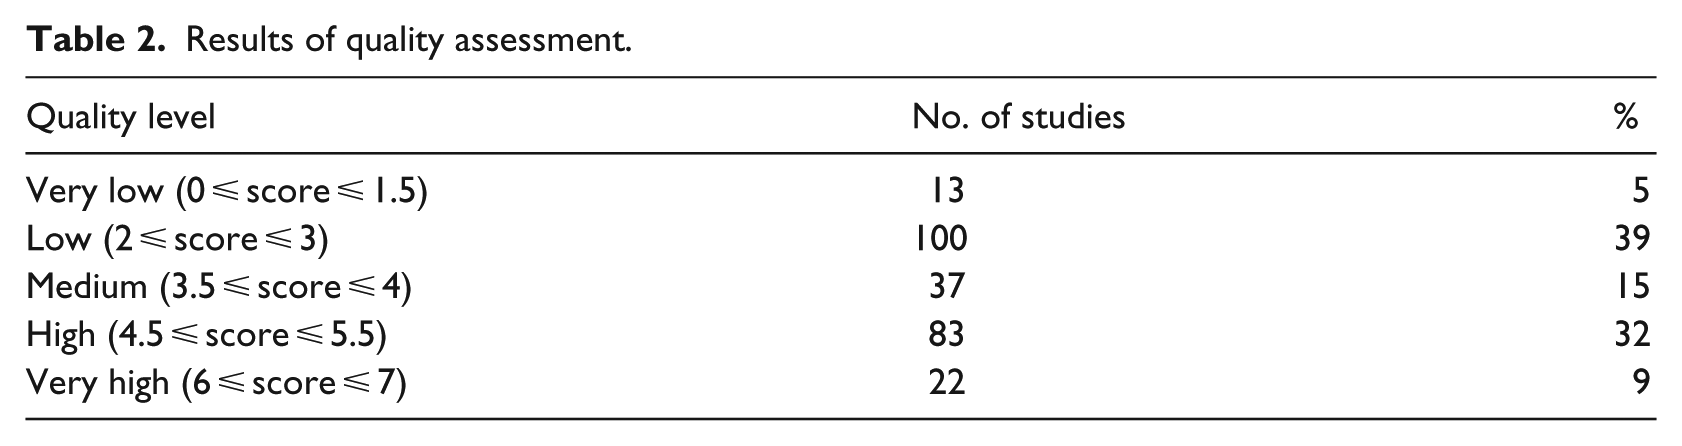
We used QA to evaluate the quality of the relevant studies. Hence, since the perfect quality score was 7, the quality score of each selected paper had to exceed 3.5. Table 2 summarizes the results of the QA process. Of the articles selected, 56 percent had a higher or equal average score and 44 percent of the papers were under the average score and were therefore discarded. Furthermore, 15 percent had an average score and 41 percent of the studies had a high quality score. The complete list of these 142 selected papers with details of the overall classification results can be found in Table A.1 (Appendix).
Results of quality assessment.
RQ1: In which sources and in which years were selected studies on the application of DM techniques in cardiology published?
The selected articles were published in several channels, as shown in Table 3 in which publication channels that were repeated more than once and the number of papers per publication source is listed. Two publication channels were therefore identified, which are journals and conferences. Of the selected papers, 26 percent were presented at conference proceedings and 74 percent were published in journals. According to Table 3, the most frequent targets are journal of Computer Methods and Programs in Biomedicine (7.3%), Expert Systems with Applications (6.1%) and IEEE Transactions on Information Technology in Biomedicine (4.6%); and the most frequent conferences are the International conference of the IEEE Engineering in Medicine and Biology Society (3.3%) and the International Conference on Biomedical Engineering and Informatics (1.3%).
Publication sources.
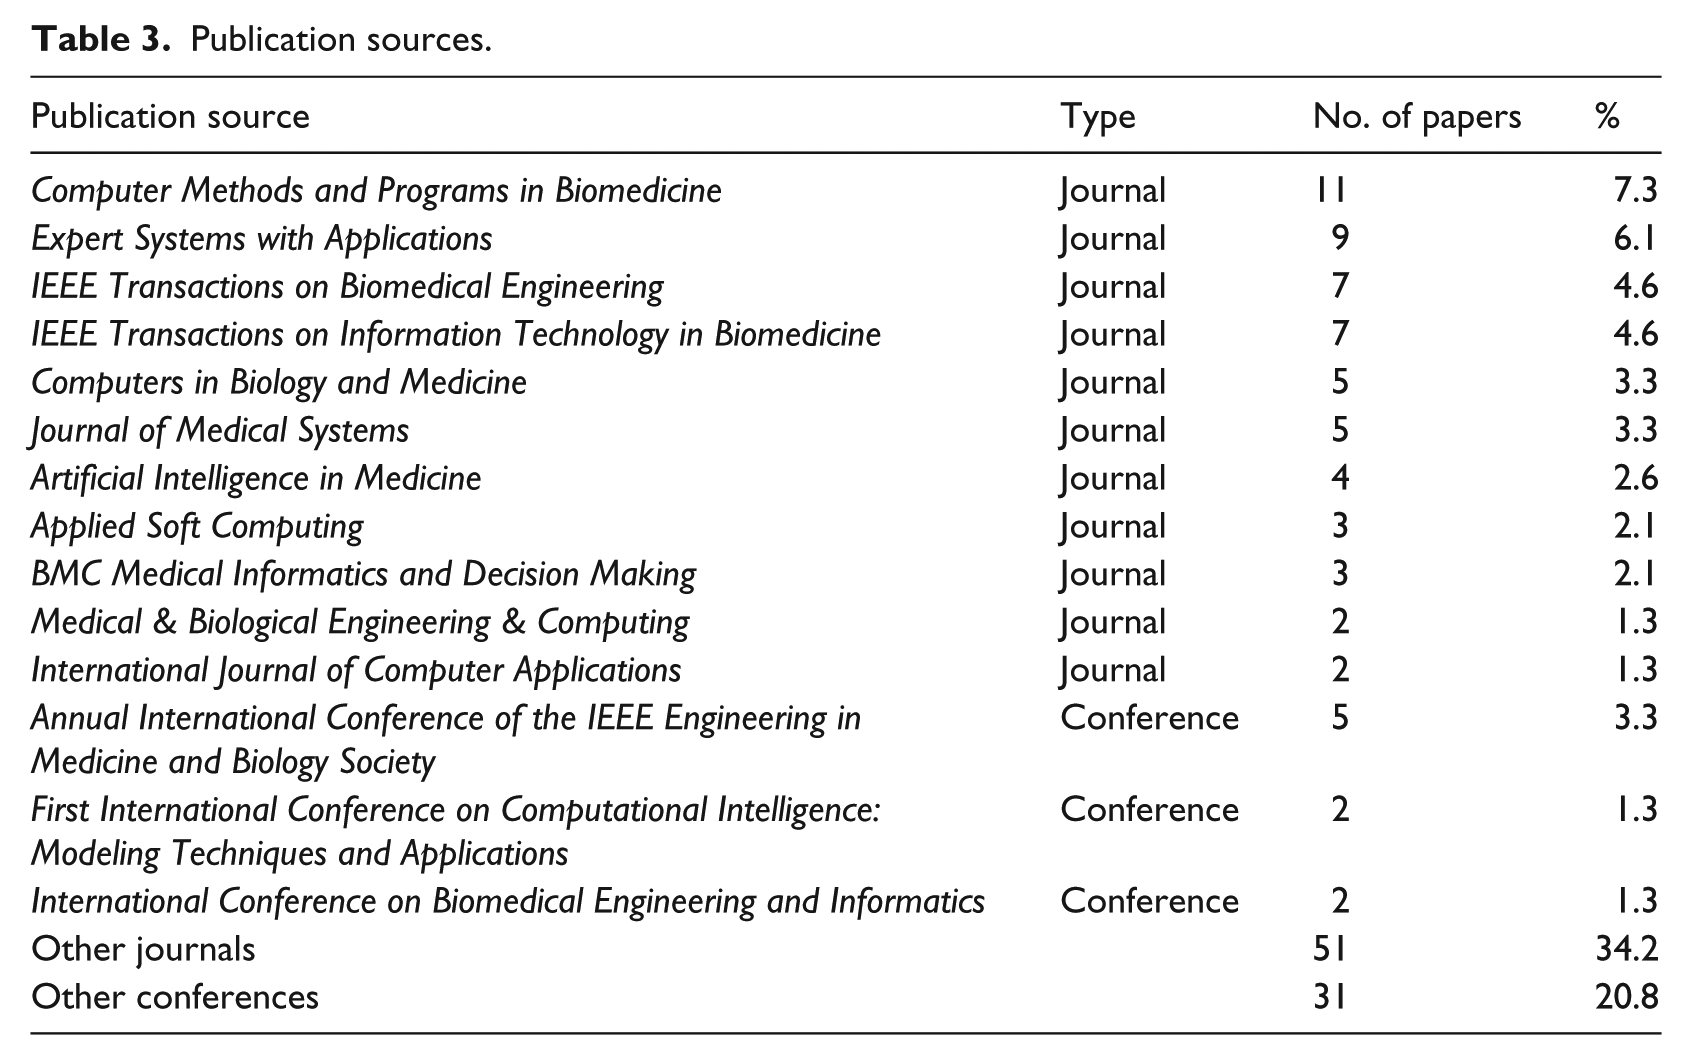
Figure 3 shows the distribution of the selected studies between 2000 and 2015. It will be observed that the number of papers increases during this period of time. In fact, the frequency of papers published per year has increased from one article in 2000 to 21 papers in 2015. Moreover, there is an outlier in the years 2012, 2013, 2014 and 2015 because 55 percent of the selected studies were published in these years. These outliers were identified on the basis of the number of publications that exceeded 12 publications per year. It will also be noted that the number of publications concerning the application of DM in cardiology was low between 2000 and 2006. However, since 2007, the number of publications has increased significantly, as 91 percent of the selected studies were published in the period between 2007 and 2015.
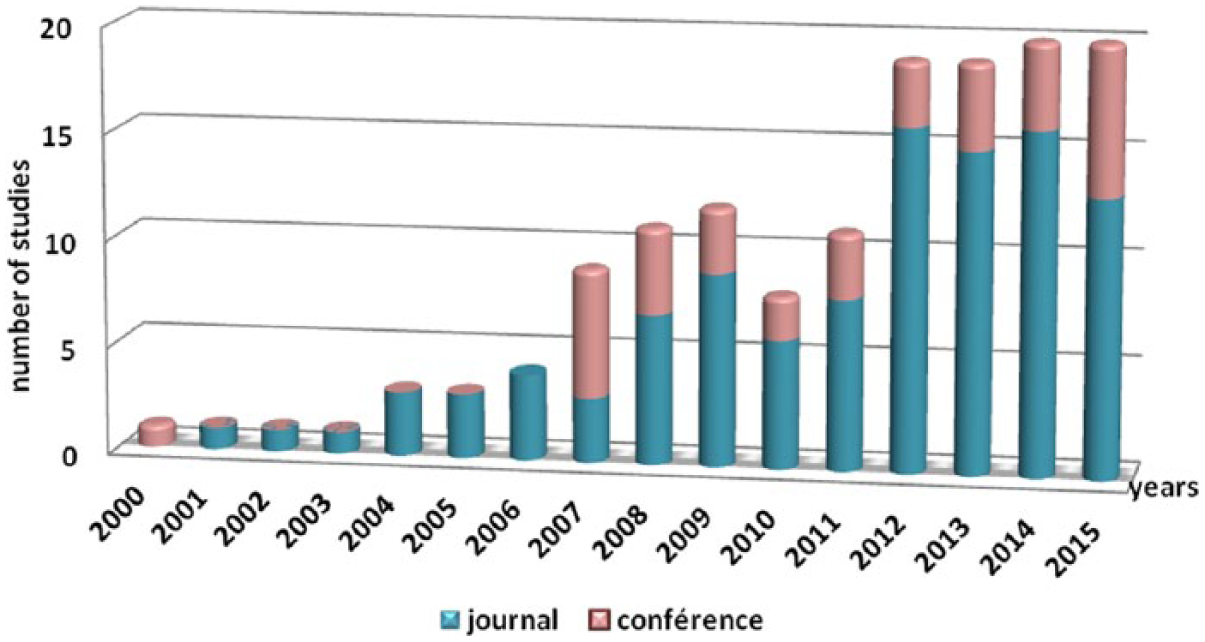
Number of papers published per year and publication channel.
RQ2: What types of investigations are carried out and published in cardiac DM studies?
The data extraction phase allowed us to identify three research types, namely, SP, ER and experience report. Of the selected studies, 25 percent were identified as SP papers, that is, papers that present new DM-based techniques to be applied in cardiology, and 10 percent belong to the ER type since they evaluate the performance of existing DM-based techniques in cardiology. Moreover, 63 percent of the selected articles were identified as being simultaneously SP and ER papers, and 2 percent of the selected studies were identified as EPs.
Figure 4 shows the evolution of the research types of the selected studies over time. In this chart, it will be noted that EPs have only begun to appear in the last few years. However, SP studies first appeared in 2000 and have increased over the years. Moreover, ER papers appeared 2 years after the appearance of SP papers and have also increased over the years.
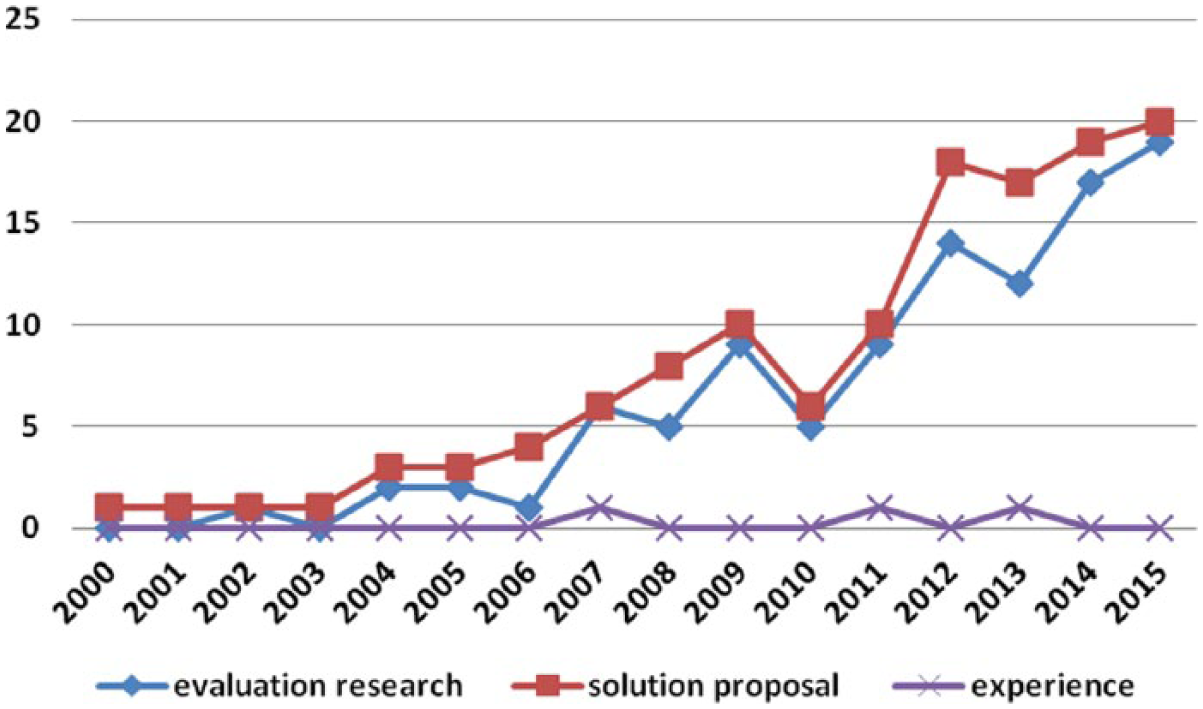
Evolution of research types identified over the years.
RQ3: What are the disciplines of cardiology in which DM techniques were applied?
All the activities in cardiology can be divided into six categories that are referred to as “medical tasks”: 3 screening, diagnosis, treatment, prognosis, monitoring and management. Figure 5 provides an overview of the frequency of the distribution of the selected studies as regards cardiology disciplines and DM objectives. Of the studies, 55 percent were dedicated to the diagnosis stage, 26 percent of the selected studies were related to a screening procedure which concerns cardiologists and 8 percent of the selected papers have applied DM techniques in monitoring. Nearly 7 percent of the studies were interested in prognosis procedures. With regard to the treatment phase, 2 percent of the selected studies were interested in this discipline, while only 2 percent of the papers carried out research for the management phase.
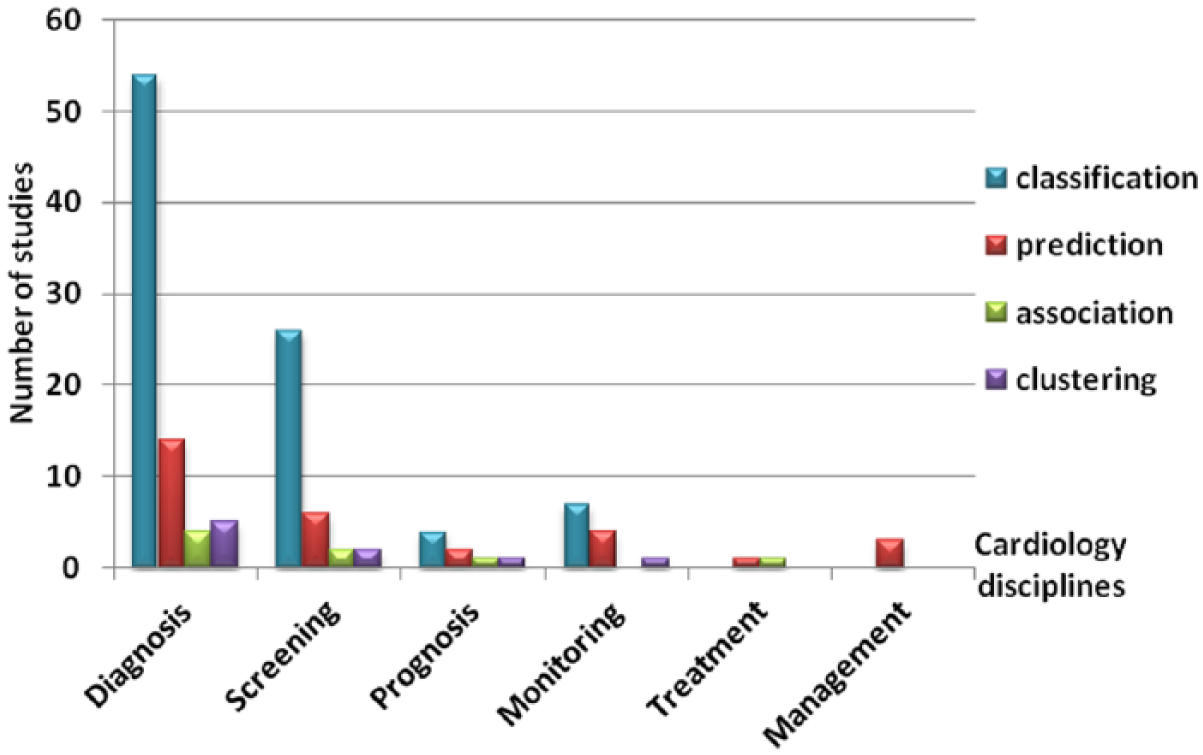
Frequency of medical tasks with DM objectives.
Figure 5 shows the frequency of published papers in six medical tasks. In each task, the frequency of DM objectives is presented. Classification algorithms were used in all cardiology disciplines with the exception of the management task. Classification algorithms would therefore appear to be those most frequently used in several tasks, and particularly, the diagnosis task in which 59 percent of the classification studies were performed. Prediction algorithms were also adopted by several researchers in all medical tasks; 47 percent of prediction-based studies were carried out for diagnosis tasks, while the remaining studies were distributed throughout the remaining medical tasks. Association rule–based studies were carried out only in diagnosis, screening, prognosis and treatment tasks and they were also more focused on diagnosis. Data clustering algorithms were used only in diagnosis, screening, prognosis and monitoring tasks and were interested in the diagnosis stage.
RQ4: What types of empirical studies were conducted when applying DM techniques in cardiology?
Figure 6 shows that all the papers were empirically evaluated using several empirical research types. Of the selected papers, 54 percent belong to the HBE type (77 of 142 papers) since they employed publicly available heart disease databases. Some of these studies are identified as being simultaneously SPs and ER papers, which is why they were double calculated in these two types of research; 57 percent of the papers using public data sets therefore proposed new solutions and 43 percent of them evaluated the models developed. Other researchers preferred to obtain the data set from care units at which they were able to carry out their experiments, and 43 percent of the selected studies (61 of 142 papers) were therefore empirically validated by means of case studies. This empirical type was used by researchers in their SPs (52 out of 90 papers), evaluations (38 out of 90 papers) or experience studies (2 out of 90 papers). Only 3 percent of the selected studies (4 out of 142 papers) were evaluated using surveys.
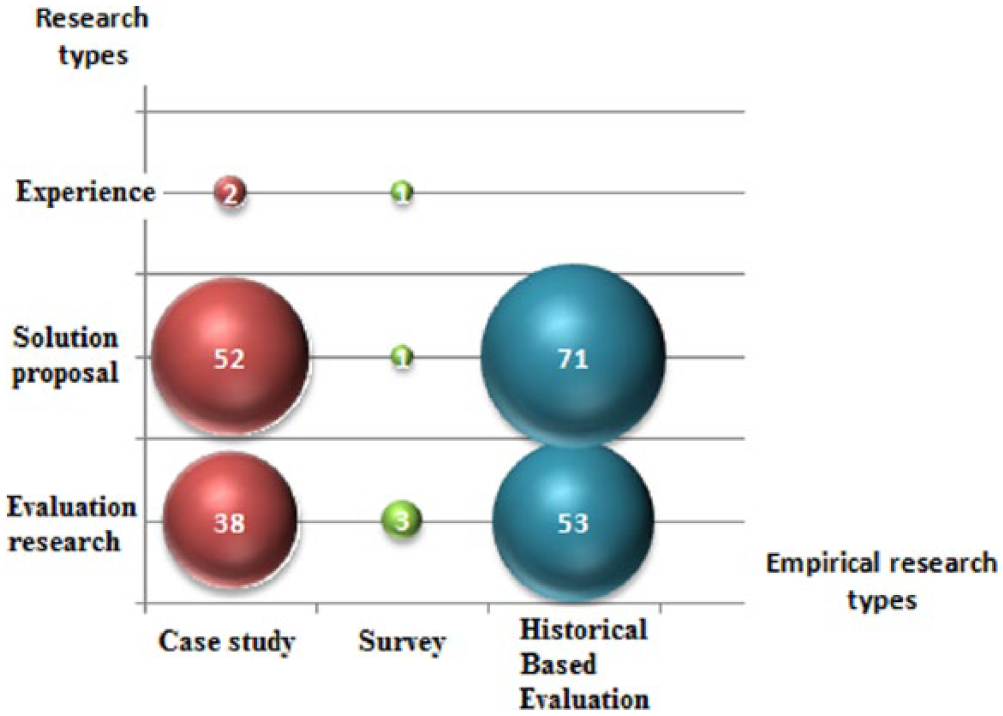
Distribution of research types and empirical types.
Several public cardiac data sets were used to construct and evaluate the studies selected in this study. Table 4 shows the most frequently used data sets with their relevant information. The relevant information includes the number and percentage of the selected studies using the data set, the number of instances included in the data set, the number of attributes and the source of the data set. The two databases most frequently used in the selected studies were the MIT-BIH Arrhythmia Databases and Cleveland Heart Disease Database, with percentages of 23 and 20 percent, respectively.
Data sets used in the selected studies.
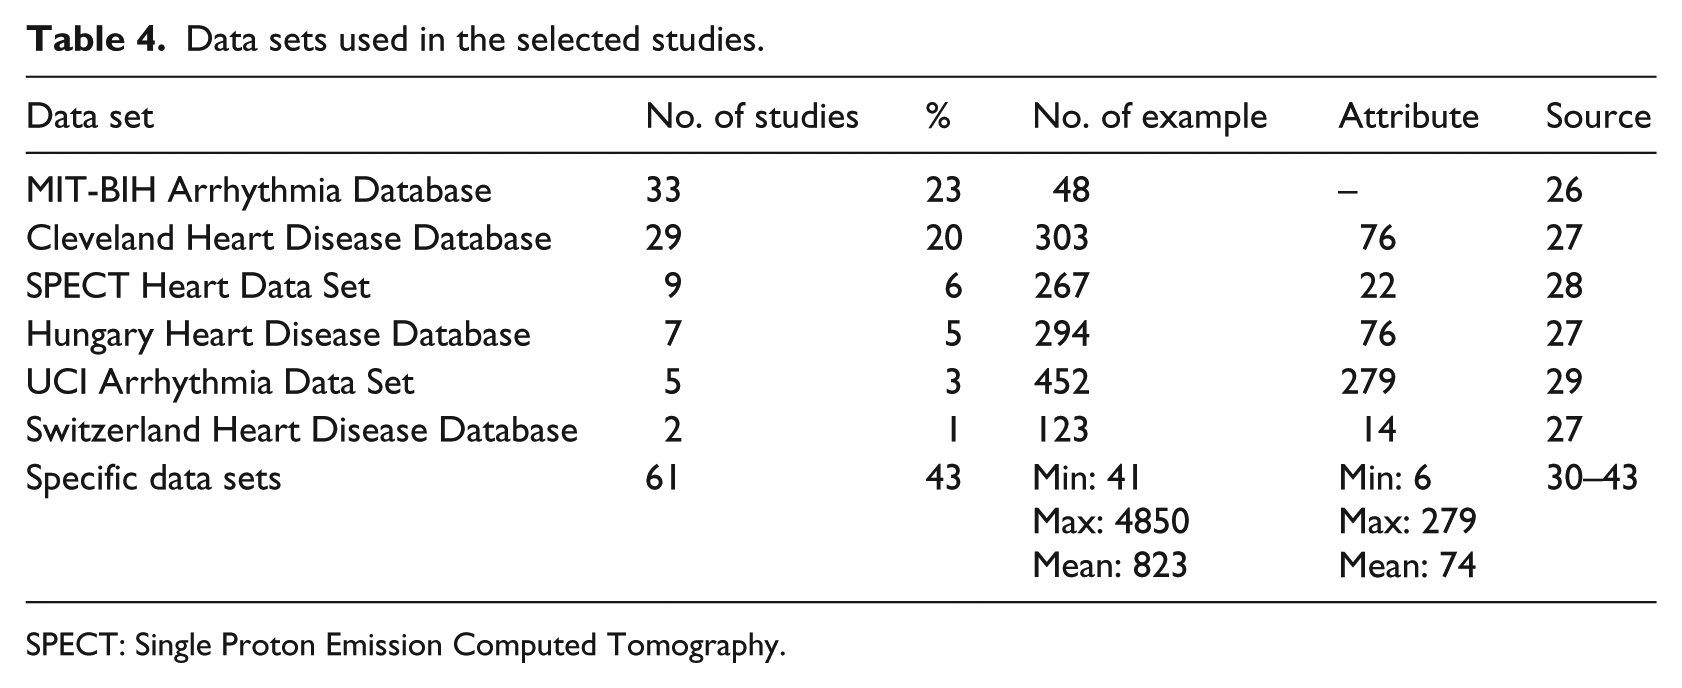
SPECT: Single Proton Emission Computed Tomography.
Moreover, 6 percent of the selected studies used the Single Proton Emission Computed Tomography (SPECT) heart data set, while the Hungarian heart disease database, the UCI Arrhythmia Data Set and the Switzerland Heart Disease Database were used in only 5, 3 and 1 percent, respectively, of the selected studies. All the aforementioned databases, with the exception of the MIT-BIH arrhythmia database, belong to the UCI Machine Learning Repository, which is a collection of databases, domain theories and data generators that are used by the machine learning community for the empirical analysis of machine learning algorithms. 27 Although public data sets were widely used, specific data sets were also adopted in several of the selected studies; 43 percent of the databases used were collected from hospital records or from observation per month of group of patients.
Discussion
The objective of this mapping study was to identify and analyze studies carried out on the application of DM techniques in cardiology, and 142 papers were therefore selected and analyzed from a total of 2392 studies. In this section, the principal findings of this SMS will be presented and discussed.
RQ1: In which sources and in which years were the selected studies on the application of DM techniques in cardiology published?
Table 3 shows the variety of publication sources, since 85 different sources in 142 articles were recorded, which demonstrates that there is no specialized source as regards the application of DM techniques in cardiology. In fact, these publication sources are specialized in computer science, the medical field and computer science applied to medicine. It is well known that these three research areas are very broad and encompass several research topics. There are also several publication channels that specialize in the aforementioned research areas, which is why a variety of publication sources have been recorded in this study. The publication channels selected were scored to measure their reputation, and the percentage of papers published in recognized sources is therefore quite good, at around 75 percent. However, 25 percent of the publication channels were not well recognized particularly in the case of conferences since only 21 out of 34 conferences were ranked. This can be explained by the fact that in computer science, the number of low-level conferences has undergone a tremendous growth. 44
Furthermore, Figure 3 shows the increasing number of papers since 2000, which can be explained by the fact that the research area regarding the application of DM techniques in cardiology has attracted the attention of researchers owing to its benefits. It will also be noted that the number of articles published in the period between 2000 and 2006 was low, which might be explained by the fact that the application of DM techniques in the medical field in general came to be of significantly more interest at the beginning of the last decade, although the number of publications in this context was even lower in the first 7 years of the last decade until 2007 when publications about the particular application of DM in cardiology made a significant appearance. Moreover, 91 percent of the selected studies were published in the period between 2007 and 2015, a period during which outliers were also identified because DM techniques were proven to be powerful tools that provide efficient solutions for the medical field in general 3 and the cardiac domain in particular. This encouraged researchers to carry out more research in this respect. Moreover, heart disease is considered to be one of the most high-risk diseases and therefore attracted more attention than other diseases, and this is reflected in the growing number of works performed at this level. 3 Nevertheless, it can be noted that the number of articles published in 2010 and 2011 have decreased due to the selection process adopted in this study. In fact, after applying the IC, several relevant studies published in 2010 and 2011 were selected. However, they were excluded after the application of QA which may explain the decrease of publications in 2010 and 2011.
What types of investigations are carried out and published in cardiac DM studies?
As can be seen in Figure 4, the first studies to appear were SP papers because researchers were more interested in applying DM techniques in cardiology, especially after the good results obtained when applying these techniques in other disciplines of medicine. 3 They therefore identified the needs of the cardiac area, where DM techniques could be perfectly applied and attempted to propose new solutions that would assist physicians.45,46 ER papers appeared 2 years later, which can be explained by the fact that researchers needed to evaluate the studies that were carried out so as to measure their performance and identify the gaps and limits in this respect. New ideas regarding those techniques that outperform others were also proposed, along with how the performance of the systems developed could be enhanced.47,48
Moreover, some selected studies were identified as being both SP papers and ER papers, which can be explained by the fact that some researchers preferred to provide the evaluation of their developed models in conjunction with the proposed solutions so as to prove their efficiency. Moreover, Figure 4 shows that SP and ER studies have increased over the years and are still published in a considerable number of journals each year. This is owing to the fact that the research area of cardiac DM has not yet reached the level of maturity, and it is therefore still necessary to carry out a considerable amount of research in order to fill the gaps identified. Of these gaps, we can mention the following: the small size of available data sets,32,49 the data incompleteness in databases 50 and the lack of real cases for validation purposes. 37
Furthermore, only 2 percent of the selected studies were identified as EPs, which may be explained by the fact that finding a real cardiac unit at which to test a DM model is not an easy task. It needs to be supervised by cardiologists to avoid any mistakes, which may not be always possible owing to their numerous commitments.
What are the disciplines of cardiology where DM techniques were applied?
Of all medical tasks, researchers were most interested in diagnosis. With regard to Figure 5, 55 percent of the studies were dedicated to the diagnosis stage, which can be explained by the importance of this procedure in medical activities. In fact, performing an efficient diagnosis allows cardiologists to select an appropriate treatment method and reduce the mortality rate of patients. This is why several researchers were interested in the diagnosis procedure in order to produce intelligent systems capable of helping cardiologists and providing an efficient and accurate diagnosis.48,51 Of the selected studies, 26 percent were related to screening procedures, which are of interest to cardiologists since they allow the disease to be detected at an early stage. In fact, researchers at this level were focused on studying heart rate variability (HRV) signals and applying DM techniques to them in order to identify arrhythmias.52,53
Of the selected studies, 8 percent were focused on the monitoring phase, which is owing to the importance of this stage for heart disease patients. In fact, the observation phase of the disease and the patient’s condition over time is an extremely significant process that enables a rapid response to take place in the case of an emergency. Moreover, the need to know the necessary and appropriate action to take at any time when an unusual emergency situation is occurring signifies that e-health services that improve the access, efficiency and quality of health care services are privileged. The rapid development of information and communication technologies therefore led to more studies regarding the development of home care systems being introduced.54–56 These systems aim to send the real-time monitoring of physical information to a central health management system, which would serve as a platform on which doctors could communicate with patients who need help.
Of the selected studies, 7 percent applied DM techniques at the prognosis stage so as to provide an efficient system that is capable of predicting the patient’s chances of recovery and the disease outcomes in terms of mortality and morbidity. 46 The treatment task was not adopted in several papers, which can be explained by the fact that treatment is known to be the most difficult task for automation because it is directly associated with human life. It is, moreover, relative to the diagnosis stage: the more the diagnosis is correct, the more the treatment is appropriate. Little work was carried out on management procedures which can be explained by the fact that cardiologists pay more attention to diagnosis and screening stages than other tasks. Researchers were therefore more interested in and concentrated on producing systems that provide efficient decision support systems for diagnosis and screening procedures.
What types of empirical studies were conducted when applying DM techniques in cardiology?
Of the selected papers, 54 percent belong to historical-based ER, which can be explained by the fact that several researchers used publicly available databases for heart disease in order to evaluate their DM models. It is also easier to obtain access to a public database than a real database from a hospital owing to confidentiality constraints. Some researchers therefore preferred to start testing and evaluating the models they developed by first using public data sets and then if possible using a real database. Asl et al. 57 presented an effective cardiac arrhythmia classifier using HRV signals. The proposed algorithm was implemented using the support vector machine (SVM) as a basis and was evaluated using the MIT-BIH Arrhythmia Database. 29 This database includes electrocardiogram (ECG) signals and is a standard reference for studies on the cardiac arrhythmia detection and classification problem. Other publicly available databases were adopted in the selected studies, as shown in Table 4. The Cleveland heart disease database was adopted in 20 percent of the studies that used public databases because it is considered to be the most complete data set when compared to other public data sets such as the Hungary and Switzerland Heart Disease Databases. 27
Other researchers preferred to obtain data sets from care units at which they could carry out their experiments. In fact, 43 percent of the selected studies were empirically validated using case studies based on the data sets collected from hospitals and care units. Researchers used this means in an attempt to extract knowledge from real data sets and identify gaps that might be encountered in such databases in order to develop a better model that reflects real life. Only 3 percent of the selected studies were identified as surveys. This may be explained by the fact that collecting information directly from patients is not a simple procedure. Moreover, the cardiac field is critical because any small error could be fatal, which is why relevance is highly recommended. However, surveys rely on users’ subjective memories and rating scales in questionnaires which may sometimes have an influence on the relevance of data filled out in these questionnaires. Moreover, the relevance of the information collected must be validated by expert cardiologists who may not always be available owing to their workload. A lot of time may therefore be wasted owing to the lack of collaboration between academics and doctors.
Implications for researchers
This section shows recommendations for researchers and guidelines for practitioners (cardiologists, care units, etc.). These implications will be categorized per RQ as follows:
RQ1: Although the majority of the selected studies were published in journals, many of them were published at conferences. However, they were discarded during different stages of the study selection process because of the lack of relevant content for our research into these studies. It is therefore recommended that researchers provide relevant and concise information in their studies even if it is not detailed because of the reduced number of pages included in the proceedings of conferences. This concise and brief information will avoid the exclusion of interesting papers presented at conferences in the selection process.
RQ2 and RQ4: Several databases were used to evaluate the DM models that were developed. Some of these data sets were publicly available while the others were extracted from heart patients’ records from various hospitals. However, most of these databases include a limited number of records. Researchers are therefore encouraged to use large data sets containing a sufficient number of records or attributes to evaluate and validate DM models. The use of large data sets is necessary since the medical database is considered to be one of the largest databases. The accuracy of the DM models developed should be tested and evaluated on large databases in order to rely on the efficiency of the systems implemented. Note that a slight medical error could lead to the loss of human lives.
RQ3: Of the six medical tasks, researchers were more interested in diagnosis and screening owing to their importance for heart disease. However, few works were carried out for the treatment and management tasks. Researchers are therefore encouraged to conduct more studies on treatment procedures because even if treatment might not appear to be the most difficult procedure, this is well-supported by physicians. It would also be possible for researchers to work on both medical tasks: diagnosis and treatment. This combination could provide a powerful system since it allows the diagnosis of heart disease and the proposal of a treatment according to the diagnosis established. Such a system could be of great help to cardiologists. However, specialists’ opinions will continue to be adopted because these systems only assist cardiologists to make better clinical decisions. 58
Conclusion
The growing number of heart disease patients has generated huge amounts of data which has encouraged researchers adopting DM techniques to handle these increasing volumes of data efficiently. Several DM models were developed in order to provide efficient solutions and help cardiologists and care stakeholders. These models were developed using various DM techniques and were applied in different disciplines of cardiology. Moreover, the developed models were evaluated using various evaluation methods and different types of cardiac databases.
This mapping study investigated the studies that were performed in cardiology using DM techniques. A total of 400 papers from between 2000 and 2015 were therefore identified. After applying our study selection process, 142 empirical studies were selected for this study in order to answer the RQs shown in Table 1. These answers permitted the findings to be classified according to the following criteria: year and channel of publication, research type, cardiac task and empirical type. The results obtained showed that the amount of studies conducted on cardiac DM has risen during the last decade. These papers were published in different journals and appeared at several conferences regarding computer science, the medical field and computer science applied to medicine. The majority of the selected articles were identified as SP and/or evaluation papers. The main empirical types found were HBE and case studies. Around half of the selected studies used historical data sets to evaluate the models developed. Diagnosis and screening were identified as the most frequent medical tasks for which studies were conducted, while less attention has been paid to the other tasks.
This study provides also recommendations for researchers and cardiologists. In the case of researchers, we recommend that more effort should be made as regards medical tasks other than diagnosis and screening, and particularly the treatment phase. Moreover, in order to validate the DM models, clinical validation should be performed to be able to ensure the efficiency of the model developed. As for the weakness of application of DM in cardiology, we should mention the lack of a standard concerning the overall knowledge extraction process from data gathering to knowledge evaluation. For instance, a standard could be imposed for the data pre-processing phase in order to produce knowledge, and a means could then be found to locate this knowledge in the cardiology process. This weakness is not limited to cardiology, since no such standard exists for the entire medical field. 3
Footnotes
Appendix A. Classification Results
Classification of the selected studies.
| Paper ID | Reference | RQ1 |
RQ2 | RQ3 | RQ4 | Quality assessement |
||||||||
|---|---|---|---|---|---|---|---|---|---|---|---|---|---|---|
| Channel | source | year | (a) | (b) | (c) | (d) | (e) | (f) | Score | |||||
| S1 | [23] | Journal | DBLP | 2012 | SP+ER | diagnosis | HBE | 1 | 1 | 1 | 0.5 | 0 | 0 | 3.5 |
| S2 | [24] | Journal | sciencedirect | 2012 | SP+ER | diagnosis | HBE | 1 | 1 | 1 | 0 | 0 | 1.5 | 4.5 |
| S3 | [25] | Journal | IEEE Xplore | 2006 | SP | screening | Case study | 1 | 1 | 1 | 1 | 0.5 | 1.5 | 6 |
| S4 | [26] | Journal | springerLink | 2013 | SP | diagnosis | HBE | 1 | 1 | 0 | 0 | 1 | 1 | 4 |
| S5 | [27] | Journal | ACM | 2010 | SP | diagnosis | HBE | 1 | 1 | 1 | 0 | 0.5 | 2 | 5.5 |
| S6 | [28] | Conference | IEEE Xplore | 2009 | ER | diagnosis | survey | 1 | 1 | 1 | 0 | 0 | 0.5 | 3.5 |
| S7 | [29] | Conference | sciencedirect | 2013 | SP | diagnosis | HBE | 1 | 1 | 1 | 0.5 | 0 | 0 | 3.5 |
| S8 | [30] | journal | springerLink | 2004 | SP | screening | HBE | 1 | 1 | 1 | 0 | 0.5 | 0 | 3.5 |
| S9 | [31] | Journal | sciencedirect | 2013 | SP | diagnosis | HBE | 1 | 1 | 1 | 1 | 0 | 0 | 4 |
| S10 | [32] | Journal | IEEE Xplore | 2013 | SP | prognosis | HBE | 1 | 0.5 | 1 | 1 | 1 | 0 | 4.5 |
| S11 | [33] | Journal | sciencedirect | 2011 | SP+ER | diagnosis | HBE | 1 | 1 | 1 | 1 | 0 | 0 | 4 |
| S12 | [34] | Conference | IEEE Xplore | 2014 | SP+ER | diagnosis | Case study | 1 | 1 | 1 | 1 | 0.5 | 0 | 4.5 |
| S13 | [35] | Journal | sciencedirect | 2012 | SP | diagnosis | Case study | 1 | 1 | 1 | 0 | 1 | 2 | 6 |
| S14 | [36] | Conference | DBLP | 2012 | SP+ER | prognosis | HBE | 1 | 1 | 1 | 1 | 0 | 0 | 4 |
| S15 | [37] | Journal | ACM | 2013 | SP | prognosis | HBE | 1 | 1 | 1 | 0 | 0.5 | 0 | 3.5 |
| S16 | [38] | Conference | springerLink | 2014 | ER | treatment | HBE | 1 | 1 | 1 | 0 | 0.5 | 1.5 | 5 |
| S17 | [39] | Journal | DBLP | 2008 | SP | screening | HBE | 1 | 1 | 1 | 1 | 0.5 | 1.5 | 6 |
| S18 | [40] | Journal | DBLP | 2012 | SP | screening | HBE | 1 | 1 | 1 | 1 | 0.5 | 2 | 6.5 |
| S19 | [41] | Journal | sciencedirect | 2005 | SP | diagnosis | HBE | 1 | 1 | 1 | 1 | 0 | 1 | 5 |
| S20 | [42] | journal | sciencedirect | 2010 | SP | screening | HBE | 1 | 1 | 1 | 0 | 0 | 1.5 | 4.5 |
| S21 | [43] | Conference | ACM | 2007 | SP+ER | diagnosis | Case study | 1 | 1 | 1 | 0.5 | 0 | 0 | 3.5 |
| S22 | [44] | Journal | IEEE Xplore | 2011 | SP | diagnosis | HBE | 1 | 1 | 1 | 0 | 0 | 2 | 5 |
| S23 | [45] | Journal | springerLink | 2012 | SP+ER | Screening | HBE | 1 | 1 | 1 | 1 | 0 | 1.5 | 5 |
| S24 | [46] | Conference | IEEE Xplore | 2013 | SP | prognosis | Case study | 1 | 1 | 1 | 0 | 0 | 0.5 | 3.5 |
| S25 | [47] | Conference | IEEE Xplore | 2009 | SP | monitoring | Case study | 1 | 1 | 1 | 1 | 0 | 1.5 | 5.5 |
| S26 | [48] | Conference | IEEE Xplore | 2007 | EXP | screening | Case study | 0 | 1 | 1 | 0.5 | 1 | 0 | 3.5 |
| S27 | [49] | Conference | IEEE Xplore | 2009 | SP | diagnosis | HBE | 1 | 1 | 1 | 1 | 0 | 0 | 4 |
| S28 | [50] | Conference | IEEE Xplore | 2012 | SP | diagnosis | HBE | 1 | 1 | 1 | 1 | 0 | 1.5 | 5.5 |
| S29 | [51] | Conference | IEEE Xplore | 2013 | EXP | prognosis | Case study | 1 | 1 | 1 | 0 | 0 | 0.5 | 3.5 |
| S30 | [52] | Conference | IEEE Xplore | 2010 | SP | diagnosis | Case study | 1 | 1 | 1 | 0.5 | 0 | 0 | 3.5 |
| S31 | [53] | Journal | springerLink | 2012 | SP+ER | diagnosis | HBE | 1 | 1 | 1 | 1 | 0 | 1.5 | 5.5 |
| S32 | [54] | Journal | springerLink | 2012 | SP | diagnosis | HBE | 1 | 1 | 1 | 1 | 0 | 1.5 | 5.5 |
| S33 | [55] | Conference | IEEE Xplore | 2012 | ER | monitoring | Case study | 1 | 1 | 1 | 1 | 1 | 0 | 5 |
| S34 | [56] | Conference | IEEE Xplore | 2011 | EXP | screening | survey | 1 | 1 | 1 | 0 | 1 | 0.5 | 4.5 |
| S35 | [57] | Conference | IEEE Xplore | 2011 | SP+ER | diagnosis | HBE | 1 | 1 | 1 | 0 | 0.5 | 0 | 3.5 |
| S36 | [58] | Journal | sciencedirect | 2009 | SP+ER | diagnosis | HBE | 1 | 1 | 1 | 1 | 0 | 1.5 | 5.5 |
| S37 | [59] | Journal | IEEE Xplore | 2008 | SP | diagnosis | Case study | 1 | 1 | 1 | 1 | 0.5 | 2 | 6.5 |
| S38 | [60] | Journal | IEEE Xplore | 2011 | ER | screening | Case study | 1 | 1 | 1 | 1 | 0.5 | 2 | 6.5 |
| S39 | [61] | Conference | IEEE Xplore | 2008 | ER | management | Case study | 1 | 1 | 1 | 0 | 0 | 1.5 | 4.5 |
| S40 | [62] | Journal | sciencedirect | 2012 | SP+ER | prognosis | Case study | 1 | 1 | 1 | 1 | 0 | 0 | 4 |
| S41 | [63] | Journal | sciencedirect | 2010 | ER | diagnosis | HBE | 1 | 1 | 1 | 1 | 0 | 2 | 6 |
| S42 | [64] | Journal | sciencedirect | 2012 | SP+ER | diagnosis | HBE | 1 | 1 | 1 | 1 | 0 | 1.5 | 5.5 |
| S43 | [65] | Conference | IEEE Xplore | 2013 | ER | monitoring | HBE | 1 | 1 | 1 | 0 | 0 | 0.5 | 3.5 |
| S44 | [75] | Conference | springerLink | 2007 | ER | diagnosis | survey | 1 | 1 | 1 | 1 | 0 | 0.5 | 4.5 |
| S45 | [76] | Conference | ACM | 2011 | SP+ER | diagnosis | HBE | 1 | 1 | 1 | 1 | 0 | 0 | 4 |
| S46 | [77] | Journal | DBLP | 2009 | SP | diagnosis | Case study | 1 | 1 | 1 | 0 | 0 | 1 | 4 |
| S47 | [78] | Journal | springerLink | 2009 | SP+ER | diagnosis | Case study | 1 | 1 | 1 | 1 | 0 | 1 | 5 |
| S48 | [79] | Journal | sciencedirect | 2013 | SP+ER | screening | HBE | 1 | 1 | 1 | 0 | 0 | 1.5 | 4.5 |
| S49 | [80] | Journal | sciencedirect | 2009 | ER | screening | Case study | 1 | 1 | 1 | 0 | 0 | 1.5 | 4.5 |
| S50 | [81] | Journal | sciencedirect | 2008 | ER | diagnosis | Case study | 1 | 1 | 1 | 0 | 0 | 1.5 | 4.5 |
| S51 | [82] | Journal | sciencedirect | 2012 | SP+ER | monitoring | HBE | 1 | 1 | 1 | 1 | 0 | 1.5 | 5.5 |
| S52 | [83] | journal | IEEE Xplore | 2008 | SP | monitoring | Case study | 1 | 1 | 1 | 0 | 0 | 1.5 | 4.5 |
| S53 | [84] | Journal | sciencedirect | 2010 | ER | diagnosis | Case study | 1 | 1 | 1 | 0 | 0 | 1.5 | 4.5 |
| S54 | [85] | Conference | IEEE Xplore | 2008 | SP | diagnosis | Case study | 1 | 1 | 1 | 1 | 0 | 0 | 4 |
| S55 | [87] | Journal | sciencedirect | 2009 | SP+ER | screening | Case study | 1 | 1 | 1 | 1 | 1 | 2 | 7 |
| S56 | [88] | Journal | sciencedirect | 2007 | SP | diagnosis | HBE | 1 | 1 | 1 | 1 | 0 | 1.5 | 5.5 |
| S57 | [89] | Journal | DBLP | 2011 | SP+ER | diagnosis | HBE | 1 | 1 | 1 | 0 | 1 | 0 | 4 |
| S58 | [90] | Journal | DBLP | 2012 | SP+ER | diagnosis | Case study | 1 | 1 | 1 | 1 | 0 | 0 | 4 |
| S59 | [91] | Journal | sciencdirect | 2013 | SP+ER | diagnosis | Case study | 1 | 1 | 1 | 1 | 0 | 2 | 6 |
| S60 | [92] | conference | IEEE Xplore | 2008 | SP+ER | diagnosis | HBE | 1 | 1 | 1 | 0 | 1 | 0.5 | 4.5 |
| S61 | [93] | Journal | DBLP | 2009 | SP+ER | screening | Case study | 1 | 1 | 1 | 0 | 0 | 2 | 5 |
| S62 | [94] | Journal | springerLink | 2011 | SP+ER | treatment | survey | 1 | 1 | 1 | 1 | 1 | 0 | 5 |
| S63 | [95] | Journal | IEEE Xplore | 2006 | SP | diagnosis | Case study | 1 | 1 | 1 | 0 | 0 | 2 | 5 |
| S64 | [96] | Journal | springerLink | 2014 | SP+ER | screening | Case study | 1 | 1 | 1 | 1 | 0.5 | 1 | 5.5 |
| S65 | [97] | Journal | sciencedirect | 2009 | SP+ER | diagnosis | Case study | 1 | 1 | 1 | 1 | 0 | 2 | 6 |
| S66 | [98] | Journal | DBLP | 2012 | SP | diagnosis | Case study | 1 | 1 | 1 | 1 | 0 | 0 | 4 |
| S67 | [99] | Journal | sciencedirect | 2005 | ER | diagnosis | Case study | 0 | 1 | 1 | 1 | 0 | 2 | 5 |
| S68 | [100] | Journal | IEEE Xplore | 2011 | SP+ER | monitoring | HBE | 1 | 1 | 1 | 1 | 0 | 1.5 | 5.5 |
| S69 | [101] | Journal | springerLink | 2010 | ER | diagnosis | Case study | 1 | 1 | 1 | 1 | 0 | 1.5 | 5.5 |
| S70 | [102] | Journal | springerLink | 2007 | SP | prognosis | HBE | 1 | 1 | 1 | 1 | 0 | 0 | 4 |
| S71 | [103] | Conference | IEEE Xplore | 2008 | SP | screening | HBE | 1 | 1 | 1 | 1 | 0 | 0 | 4 |
| S72 | [106] | Journal | sciencedirect | 2014 | SP+ER | diagnosis | Case study | 0 | 1 | 1 | 1 | 0.5 | 2 | 5.5 |
| S73 | [107] | Journal | sciencedirect | 2003 | SP | diagnosis | HBE | 1 | 1 | 1 | 0 | 0 | 2 | 5 |
| S74 | [108] | Journal | sciencedirect | 2014 | SP+ER | screening | HBE | 1 | 1 | 1 | 0 | 0 | 1 | 4 |
| S75 | [115] | Journal | ACM | 2014 | SP+ER | screening | HBE | 1 | 1 | 1 | 1 | 0 | 1 | 5 |
| S76 | [116] | Journal | sciencedirect | 2014 | SP+ER | monitoring | HBE | 1 | 1 | 1 | 1 | 0 | 1 | 5 |
| S77 | [117] | Journal | sciencedirect | 2014 | SP+ER | diagnosis | Case study | 0 | 1 | 1 | 1 | 0.5 | 2 | 5.5 |
| S78 | [118] | Journal | sciencedirect | 2014 | SP | screening | HBE | 1 | 1 | 1 | 1 | 0 | 1 | 5 |
| S79 | [119] | Journal | IEEE Xplore | 2014 | SP+ER | screening | HBE | 1 | 1 | 1 | 1 | 1 | 1.5 | 6.5 |
| S80 | [120] | Journal | sciencedirect | 2014 | SP+ER | monitoring | HBE | 1 | 1 | 1 | 1 | 0 | 1 | 5 |
| S81 | [121] | Journal | DBLP | 2014 | SP | treatment | Case study | 0 | 1 | 1 | 1 | 0.5 | 0 | 3.5 |
| S82 | [122] | Journal | sciencedirect | 2014 | SP+ER | diagnosis | HBE | 1 | 1 | 1 | 1 | 0.5 | 2 | 6.5 |
| S83 | [123] | Conference | DBLP | 2014 | SP | management | Case study | 1 | 1 | 0.5 | 0 | 0.5 | 0.5 | 3.5 |
| S84 | [124] | Journal | springerLink | 2014 | SP+ER | diagnosis | Case study | 0 | 1 | 1 | 1 | 0.5 | 1 | 4.5 |
| S85 | [125] | Journal | sciencedirect | 2013 | SP+ER | diagnosis | HBE | 1 | 1 | 1 | 1 | 0.5 | 2 | 6.5 |
| S86 | [126] | Journal | sciencedirect | 2014 | SP+ER | screening | HBE | 1 | 1 | 1 | 0 | 1 | 1 | 5 |
| S87 | [133] | Conference | IEEEXplore | 2015 | SP+ER | screening | Case study | 1 | 1 | 1 | 1 | 0 | 0.5 | 4.5 |
| S88 | [134] | Journal | springerLink | 2015 | SP+ER | diagnosis | Case study | 1 | 1 | 1 | 0 | 1 | 2 | 6 |
| S89 | [135] | Journal | ACM | 2015 | SP+ER | screening | Case study | 1 | 1 | 1 | 1 | 0 | 1.5 | 5.5 |
| S90 | [136] | Journal | sciencedirect | 2015 | SP+ER | screening | HBE | 1 | 1 | 1 | 1 | 0 | 2 | 6 |
| S91 | [137] | Journal | springerLink | 2015 | SP+ER | diagnosis | HBE | 1 | 1 | 1 | 1 | 0 | 1 | 5 |
| S92 | [138] | Conference | IEEEXplore | 2015 | SP+ER | diagnosis | HBE | 1 | 1 | 1 | 1 | 0.5 | 0.5 | 5 |
| S93 | [139] | Journal | sciencedirect | 2015 | SP+ER | diagnosis | HBE | 1 | 1 | 1 | 1 | 0 | 1 | 5 |
| S94 | [140] | Conference | IEEE Xplore | 2015 | SP+ER | screening | Case study | 1 | 1 | 1 | 1 | 0 | 0.5 | 4.5 |
| S95 | [141] | Conference | IEEE Xplore | 2015 | SP+ER | monitoring | Case study | 1 | 1 | 0 | 1 | 0.5 | 0.5 | 4 |
| S96 | [70] | Conference | IEEE Xplore | 2015 | SP+ER | diagnosis | HBE | 1 | 1 | 1 | 1 | 0 | 0 | 4 |
| S97 | [71] | Conference | IEEE Xplore | 2015 | SP+ER | diagnosis | HBE | 1 | 1 | 1 | 1 | 0 | 0 | 4 |
| S98 | [1] | Conference | IEEE Xplore | 2015 | SP+ER | diagnosis | HBE | 1 | 1 | 1 | 1 | 0 | 0.5 | 4.5 |
| S99 | [2] | Journal | springerLink | 2015 | SP+ER | diagnosis | HBE | 1 | 1 | 1 | 1 | 0.5 | 1 | 5.5 |
| S100 | [3] | Journal | springerLink | 2015 | SP+ER | diagnosis | Case study | 1 | 1 | 1 | 1 | 1 | 0 | 5 |
| S101 | [142] | Journal | PubMED | 2015 | SP+ER | diagnosis | Case study | 0 | 1 | 1 | 1 | 0.5 | 0 | 3.5 |
| S102 | [143] | Journal | PubMED | 2015 | SP+ER | diagnosis | HBE | 1 | 1 | 0.5 | 1 | 0 | 1.5 | 5 |
| S103 | [144] | Journal | PubMED | 2015 | SP+ER | diagnosis | HBE | 1 | 1 | 1 | 1 | 0 | 0 | 4 |
| S104 | [146] | Journal | PubMED | 2013 | SP+ER | management | Case study | 0 | 1 | 1 | 1 | 0.5 | 0 | 3.5 |
| S105 | [147] | Journal | PubMED | 2014 | SP+ER | diagnosis | HBE | 1 | 1 | 1 | 1 | 0 | 1 | 5 |
| S106 | [148] | Journal | PubMED | 2013 | SP+ER | diagnosis | Case study | 0 | 1 | 1 | 1 | 0.5 | 2 | 5.5 |
| S107 | [149] | Journal | PubMED | 2012 | SP+ER | prognosis | Case study | 0 | 0.5 | 0.5 | 1 | 0.5 | 1.5 | 4 |
| S108 | [150] | Journal | PubMED | 2002 | SP+ER | screening | Case study | 0 | 1 | 1 | 1 | 0 | 1.5 | 4.5 |
| S109 | [151] | Journal | PubMED | 2004 | SP+ER | diagnosis | Case study | 0 | 1 | 1 | 1 | 0 | 1.5 | 4.5 |
| S110 | [152] | Conference | PubMED | 2014 | SP+ER | screening | HBE | 1 | 1 | 1 | 1 | 0.5 | 0.5 | 5 |
| S111 | [153] | Journal | PubMED | 2013 | SP+ER | screening | HBE | 1 | 1 | 1 | 1 | 0 | 2 | 6 |
| S112 | [154] | Journal | PubMED | 2013 | SP+ER | diagnosis | HBE | 1 | 1 | 1 | 1 | 0.5 | 2 | 6.5 |
| S113 | [155] | Journal | PubMED | 2012 | SP+ER | screening | HBE | 1 | 1 | 1 | 1 | 0.5 | 1 | 5.5 |
| S114 | [156] | Conference | PubMED | 2007 | SP+ER | screening | HBE | 1 | 1 | 1 | 1 | 0 | 0.5 | 4.5 |
| S115 | [157] | Conference | PubMED | 2007 | ER | diagnosis | HBE | 1 | 1 | 1 | 1 | 0 | 0.5 | 4.5 |
| S116 | [158] | Journal | PubMED | 2006 | SP+ER | screening | Case study | 0 | 1 | 1 | 1 | 0 | 1.5 | 4.5 |
| S117 | [159] | Journal | PubMED | 2004 | SP+ER | diagnosis | HBE | 1 | 1 | 1 | 1 | 0 | 1.5 | 5.5 |
| S118 | [160] | Journal | PubMED | 2001 | SP | screening | HBE | 1 | 0.5 | 1 | 1 | 0 | 1.5 | 5 |
| S119 | [161] | Journal | PubMED | 2014 | SP+ER | diagnosis | Case study | 0 | 1 | 1 | 1 | 0 | 1.5 | 4.5 |
| S120 | [162] | Journal | PubMED | 2015 | SP+ER | monitoring | Case study | 0 | 1 | 1 | 1 | 0.5 | 2 | 5.5 |
| S121 | [163] | Journal | PubMED | 2010 | SP+ER | diagnosis | Case study | 0 | 1 | 1 | 1 | 0 | 2 | 5 |
| S122 | [164] | Journal | Embase | 2013 | SP+ER | diagnosis | Case study | 0 | 1 | 1 | 1 | 0 | 2 | 5 |
| S123 | [165] | Journal | Embase | 2009 | SP+ER | prognosis | Case study | 0 | 1 | 1 | 1 | 0 | 1 | 4 |
| S124 | [166] | Journal | Embase | 2005 | SP+ER | diagnosis | Case study | 0 | 1 | 1 | 1 | 0 | 2 | 5 |
| S125 | [167] | Journal | Embase | 2007 | SP+ER | screening | Case study | 0 | 1 | 1 | 1 | 0 | 1 | 4 |
| S126 | [168] | Conference | Embase | 2000 | SP | screening | HBE | 1 | 1 | 1 | 1 | 0 | 1.5 | 5.5 |
| S127 | [169] | Journal | Embase | 2015 | SP+ER | diagnosis | Case study | 0 | 1 | 1 | 1 | 0.5 | 1 | 4.5 |
| S128 | [170] | Journal | Embase | 2014 | SP+ER | prognosis | HBE | 1 | 1 | 1 | 1 | 0.5 | 1 | 5.5 |
| S129 | [171] | Journal | Embase | 2013 | SP+ER | diagnosis | HBE | 1 | 1 | 1 | 1 | 0 | 1.5 | 5.5 |
| S130 | [172] | Journal | Embase | 2013 | SP+ER | diagnosis | Case study | 0 | 1 | 1 | 1 | 0.5 | 2 | 5.5 |
| S131 | [173] | Journal | Embase | 2013 | ER | prognosis | Case study | 0 | 1 | 1 | 1 | 0.5 | 2 | 5.5 |
| S132 | [174] | Journal | Embase | 2009 | SP+ER | screening | HBE | 1 | 1 | 1 | 1 | 0.5 | 1 | 5.5 |
| S133 | [175] | Journal | Embase | 2008 | SP+ER | diagnosis | HBE | 1 | 1 | 1 | 1 | 0.5 | 2 | 6.5 |
| S134 | [176] | Journal | Embase | 2008 | SP+ER | diagnosis | HBE | 1 | 1 | 1 | 1 | 0 | 1.5 | 5.5 |
| S135 | [177] | Journal | Embase | 2007 | SP+ER | monitoring | Case study | 0 | 1 | 1 | 1 | 0 | 1 | 4 |
| S136 | [178] | Journal | Embase | 2006 | SP+ER | prognosis | HBE | 1 | 1 | 1 | 1 | 0.5 | 2 | 6.5 |
| S137 | [179] | Journal | Embase | 2015 | SP+ER | diagnosis | HBE | 1 | 1 | 1 | 1 | 0.5 | 1 | 5.5 |
| S138 | [180] | Journal | Embase | 2011 | SP+ER | diagnosis | HBE | 1 | 1 | 1 | 1 | 0 | 2 | 6 |
| S139 | [181] | Conference | Embase | 2010 | SP+ER | screening | HBE | 1 | 1 | 1 | 1 | 0 | 0.5 | 4.5 |
| S140 | [182] | Journal | Embase | 2012 | SP+ER | diagnosis | Case study | 0 | 1 | 1 | 1 | 0 | 1.5 | 4.5 |
| S141 | [127] | Journal | Embase | 2012 | SP+ER | screening | Case study | 0 | 1 | 1 | 1 | 0 | 1.5 | 4.5 |
| S142 | [13] | Journal | Embase | 2011 | SP+ER | diagnosis | HBE | 1 | 1 | 1 | 1 | 0 | 1 | 5 |
Declaration of conflicting interests
The author(s) declared no potential conflicts of interest with respect to the research, authorship and/or publication of this article.
Funding
The author(s) disclosed receipt of the following financial support for the research, authorship and/or publication of this article: This research is part of the mPHR project in Morocco financed by the Ministry of Higher Education and Scientific Research in Morocco 2015–2018 (PPR1-15-17) and part of the project GINSENG (TIN2015-70259-C2-2-R) supported by the Spanish Ministry of Economy and Competitiveness and European FEDER funds.