
Abstract
Patient data completeness is an important characteristic in maintaining accurate health records and providing the highest standard of care. Furthermore, finding discrepancies in care based on different subpopulation parameters is important to identify areas of underlying systemic issues in order to address concerns and alleviate those discrepancies. In this project, the investigators use the Data Completeness Analysis Package to find trends in patient record completeness using Healthcare Cost and Utilization Project’s State Inpatient Database for the state of Florida, specifically focusing on finding discrepancies among subpopulations along the variables of age, race, and gender. The results from testing Data Completeness Analysis Package with State Inpatient Database show a variety of patterns that provides insights to the health care delivery in Florida.
Introduction
An important area of focus in current health care research involves understanding disparities in care and figuring out how to solve them. These disparities manifest themselves in various forms ranging from provider bias to the actual care or treatment provided. 1 Disparities occur across various subpopulation axes such as race, ethnicity, socioeconomic status, 2 and primary language, 3 insurance status, 4 age, 5 and gender. 6 Furthermore, while the issue of health care disparity is extensively documented, there are still limitations in disparity identification and actually addressing the underlying issues. 7
While the problem of health care disparity has been analyzed from a perspective of treatment provided and qualitative analysis of care, this article seeks to integrate the issue of disparity with a quantitative analysis of electronic health care records. As electronic health care records grow in usage and importance, 8 it is important to ensure the completeness and validity of patient data. Contextualizing this issue within health care disparity, the following question is raised: “Are certain patient subpopulation’s health care records more vulnerable to incompleteness or inaccuracy?”
Based on this overarching question, this article investigates subpopulation record keeping vulnerability based on age, gender, and race. First, a null hypothesis that all subpopulations are equal in their vulnerability in record completeness is established to base analysis from. The Data Completeness Analysis Package (DCAP) is used on patient data from the Healthcare Cost and Utilization Project (HCUP). 9
Disparities in health care have been well documented. For example, the Department of Health and Human Services (DHHS) has found overwhelming evidence of health care disparity in minority groups, including disparities in care for cancer, cardiac disease, AIDS, asthma, and other illnesses. 10 Research further shows that “racial and ethnic disparities in health care exist even when insurance status, income, age, and severity of conditions are comparable.” 1 There is also evidence in health care decision-making at multiple levels of bias against individuals based on age, 5 creating health care disparity for the elderly. From a gender perspective, differences in health care expenditures and resource utilization lead to better quality of care among females. 11
While the identification of health care disparities can often be objectively displayed, the underlying sources for these disparities are harder to identify. 7 For example, a physician’s assumption of literacy among patients disproportionately impacts minority patients, becoming a factor leading to disparity in care. 12 Research also points to social sources outside of interactions within the health care provider environment (such as neighborhood pressures, socioeconomic circumstances, education, segregation, impact on income, violence, and impact of segregation) contributing to real disparities in health care provided to minorities. 13 These factors, often embedded and persistent historically, complicate the ability to determine tangible sources of disparities, ability to measure these sources’ effects, and ability to create effective solutions to these sources of disparities. 13 Within the provider context, “barriers in the patient–physician relationship contribute to racial disparities in the experience of health care.” 14 Furthermore, prejudice, clinical uncertainty (e.g. different interpretations of symptoms from minority patients), and stereotyping contribute as sources of health care disparity within the medical environment. 15
After identifying health care disparities and the underlying sources, efforts must be undertaken to solve them but may however come with limitations. Fiscella et al.
7
argue that
… disparities represent a significant quality problem; current data collection efforts are inadequate to identify and address disparities; clinical performance measures should be stratified by race/ethnicity and socioeconomic position for public reporting; population-wide monitoring should incorporate adjustment for race/ethnicity and socioeconomic position; and strategies to adjust payment for race/ethnicity and socioeconomic position should be considered to reflect the known effects of both on morbidity.
From a racial/ethnic health care disparity perspective, the framework of cultural competence has been described and expanded upon as a solution to address disparities that are anticipated to increase with changes in demographics. 16 Research has also found that access to insurance and its corresponding coverage can explain a sizable proportion of health care disparities. 17
In terms of research on electronic health records, there does exist work and literature on the topics of data completeness and accuracy. Majeed et al. 18 investigate this issue and note sources of errors in completeness and accuracy in patient records, as well as problems in obtaining patient data quality. Some of these issues are addressed in subsequent research which undertakes additional literature review and focuses on providing a generic framework of procedures to improve data quality, including “(a) the prevention of insufficient data quality, (b) the detection of imperfect data and their causes, and (c) actions to be taken/corrections.” 19 Prior research in finding disparities in health care record keeping is sparser. One study has found that certain races are at disparity in care based on patient self-usage of Personal Health Records (PHR). 20
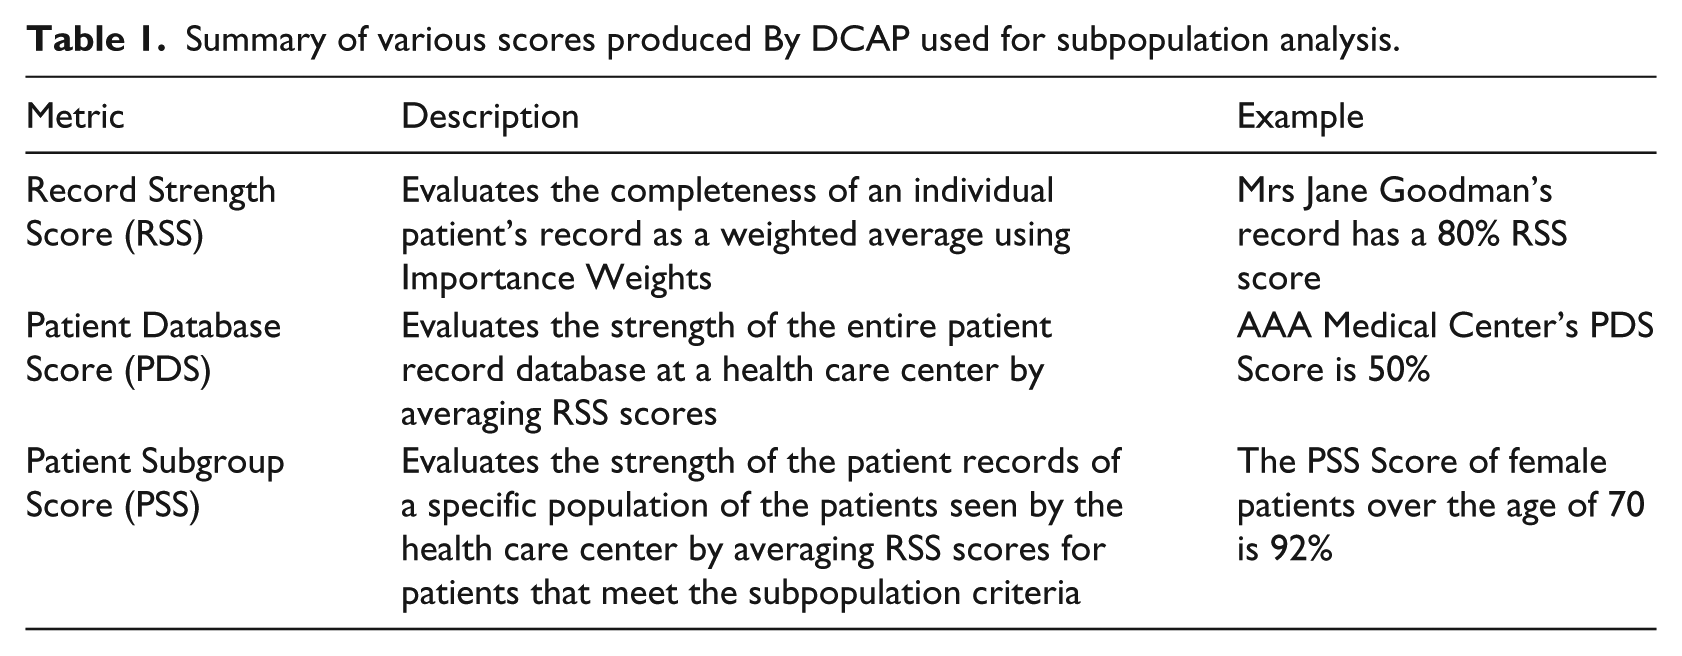
The research discussed previously (especially projects concerning patient data analysis) contributed in developing the DCAP research project. 9 That research developed both the software needed to analyze the data and a framework through which to understand results. DCAP examines native patient data with a master map indicating Importance Weights (IWs—indicates the relative importance of a specific data field’s completeness versus other data fields on a scale from 0 to 100). DCAP bases program files in comma-separated values (CSV) and based on the master map, IWs, and patient data outputs the results. The Record Strength Score (RSS) measures the completeness of an individual patient’s record as a weighted average using the IWs provided. The Patient Database Score (PDS) measures the strength of the entire patient record database at a health care center by averaging RSS scores. The Patient Subgroup Score (PSS) measures the strength of the patient records of a specific population of the patients seen by the health care center by averaging RSS scores for patients that meet the subpopulation criteria. Table 1 provides a brief summary of the metrics used within the DCAP framework of understanding and comparing record completeness.
Summary of various scores produced By DCAP used for subpopulation analysis.
The research paper was developed with the following objectives:
Use an existing tool, the DCAP, to find trends in patient record completeness using HCUP’s State Inpatient Database (SID) for the state of Florida from 2004 to 2012.
Analyze the patient data completeness from a subpopulation perspective, aiming to find statistically significant and practically meaningful differences in data completeness along the axes of age, race, and gender.
Further the development of DCAP by creating a subpopulation network that can handle completeness data analysis for complex, layered subpopulations.
Methods
This article focuses on analyzing HCUP 21 data, specifically the SID 22 with data from Florida from 2004 to 2012. Since the database contains millions of patient records within any given year, the data were sampled for 100,000 records per year to run into DCAP. In setting the IWs, it should be noted that many fields were used to handle excess information (e.g. there are 31 fields for up to 31 diagnoses, but having a blank in those fields was not actually resultant of missing information and thus IWs were adjusted to 0). Otherwise, IWs were set first to Importance Weight Balanced (leading to IWB results) and then based on general view of importance (Importance Weight Unbalanced (IWUB)). These “unbalanced” weights are discussed further in the “Discussion” section. Due to the large number of data variables contained in the HCUP data, the IWs for both balanced and unbalanced results are included in the online Appendix. Furthermore, the results from the IWUB analysis are also included in the online Appendix, with the main results focusing on IWB analysis. Deviations in results between IWB and IWUB analyses, however, are highlighted.
In order to analyze meaningful information within the data, some baseline statistical assumptions had to be made. The analysis assumes the normality of RSS within the database population in each year. Based on this assumption and the 100,000 patient record sample size, it is further assumed that the samples tested in DCAP should produce a normal distribution of RSS with both balanced and unbalanced IWs (an assumption which is tested in the results section). Furthermore, the subsequent subpopulation analysis should also follow a normal distribution given the relatively large sample sizes. The sample data were also obtained randomly from within the larger HCUP SID for each year.
This combination of normality, sample size (in both the sample database and within subpopulations), and variables allows us to determine 23 the use of both one-sided analysis of variance (ANOVA) testing 24 using F statistics 24 and then further t-test-based statistical analysis to determine discrepancies in patient data completeness among subpopulations and among different years.25,26 The ANOVA testing is covered in the online Appendix and provides the foundation for conducting two sample t-tests (results are provided in the online Appendix) that are discussed in further sections. The ANOVA tests are used to determine whether a statistically significant deviation exists within subgroup data, and then t-test-based analysis is used to delve into determining trends.
In terms of subpopulations, this article focuses on age, race, and gender. For age, five different age “baskets” are used. Gender is divided between male and female (as reported within the HCUP SID data). Race is divided based on the defined groups in the HCUP SID database. Given these subpopulations and having datasets for different years, the following null and alternative hypotheses were constructed:
H01: PDS and PSS overall and by subgroup stay consistent over time


HA1: PDS and PSS scores do not stay consistent over time


H02: PDS and PSS scores stay consistent between different subgroups/between subgroups and the sample database average


HA2: PDS and PSS scores do not stay consistent between different subgroups/between subgroups and the sample database


Alongside this analysis of sample HCUP SID data, this article also seeks to improve DCAP by creating a function through which the user can examine more complex, layered subpopulations, such as Race Black Males Ages 20–40.
Results
Study sample
To ensure the data were being properly analyzed through t-tests, normality of RSS scores needed to be confirmed. Figure 1 shows the distribution of RSS scores in each sample database for each year for IWB RSS. While there is movement in the probability mass function between years, each year confirms normally distributed sample data. This distribution along with random selection allowed for statistical hypothesis testing through the two-sample t-test.
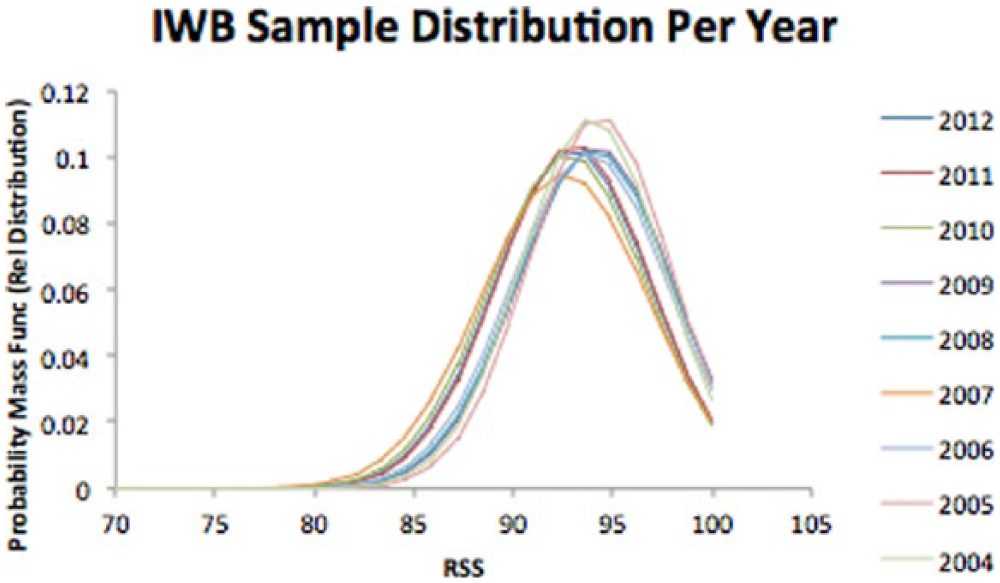
IWB RSS score distribution for each year.
Noticing the movement of the mean between different years within IWB RSS data, the next step involved analysis of the database mean and standard deviation.
For IWB and IWUB data, Figure 2 shows the PDS for each year with standard deviation error bars for context. From a simple visual analysis, one can note significant movement in PDS in each year with a general decline from 2004 to 2012. The standard deviation error bars show that a roughly 4-point movement in RSS is within one standard deviation of the sample population in any given year. The IWUB dataset highlights a similar pattern, albeit at a lower PDS score (with the average fluctuation in PDS at around 2 points). This difference between IWB PDS and IWUB PDS is discussed further in the “Discussion” section. Also of relative interest was the spike in standard deviation that coincided with the drop in PDS, specifically in 2007, for both IWB and IWUB. Upon further correlation analysis, however, this relationship proved tenuous at best (at the database level, the correlation between PDS and PDS standard deviation was 0.47 for both IWB 0.42 for IWUB).
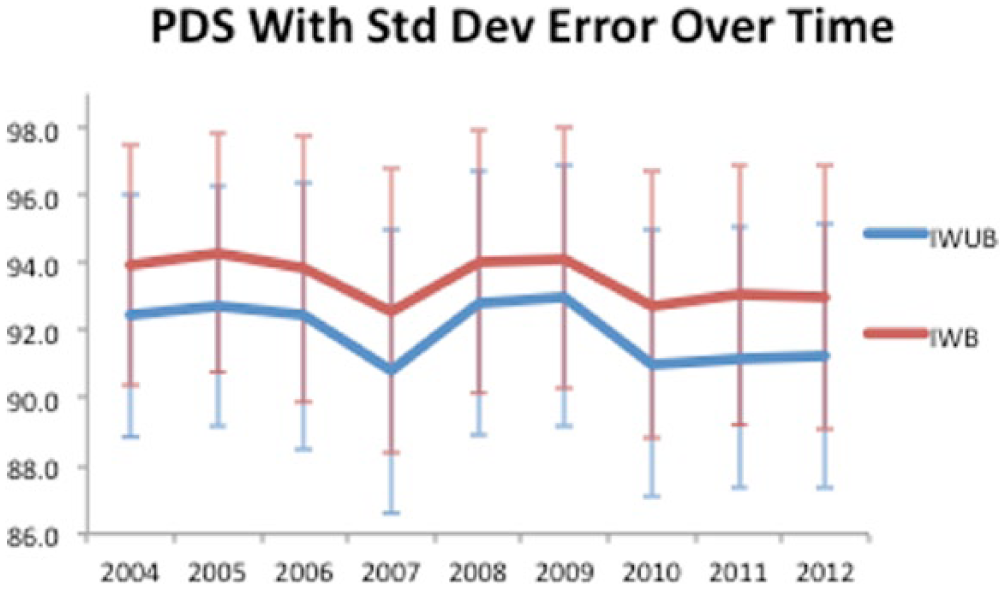
PDS with one standard deviation error over time for IWB and IWUB.
In order to determine the statistical significance of the difference between two data years, two sample t-tests needed to be analyzed in reference to the first null hypothesis and its corresponding alternative hypothesis. Based on these hypotheses, the two-sided t-test was conducted (the results for all t-tests are included in the online Appendix). For both IWB PDS and IWUB PDS, it is immediately clear that virtually all movements in PDS are statistically significant. For example, for a 1 year lag from each year, every year from IWB and almost every year from IWUB (except 2011–2012) show significance at the alpha = 0.01 level. Furthermore, both IWB and IWUB show statistical significance over the course of the samples from 2004 to 2012 (2004 with 8 year lagged comparative sample). These two sample t-tests provide ample evidence in favor for the alternative hypothesis in that there is statistically significant difference in PDS between different years of the database sample. However, this statistically significant difference may not be practically significant, a matter further discussed in the “Discussion” section.
Sample subpopulation analysis—foundation
In terms of confirmation of normality within subpopulations, since the sample size of each subpopulation was sufficiently large and the database from which the subpopulations were drawn from were shown to be normally distributed, it could be reasonably assumed that the subpopulation data were also normally distributed. This distribution along with random selection allowed for statistical hypothesis testing through the two-sample t-test. It is also important to note that the relative sizes of the subpopulation studies (along the axes of age, race, and gender) remained stable and showed little to no shift between different years.
Sample subpopulation analysis—age
Having established the conditions for normality, randomness, and consistency in subpopulation sample size, the analysis continued onto comparing different subpopulations with the database and their direct comparatives. Figure 3 shows PSS for different age subpopulations based on the IWB dataset. Upon visual inspection, it is clear that the age 0–20 subgroup tails significantly lower from the database and other age subgroups, consistently at the bottom of PSS scores. At the top, the age 20–40 subgroup starts with the highest PSS score but exchanges position with age 60–80 after 2008. From a standard deviation perspective, ages 40–60 have a much larger PSS standard deviation than the database and other subgroups. All other age subgroup standard deviations fall below the database standard deviation. This analysis was repeated for the IWUB dataset, showing a similar trend as pointed out in the IWB analysis. One important distinction to note, however, is that in comparing standard deviations, IWUB shows the age 0–20 subgroup having the largest standard deviation among subgroups.
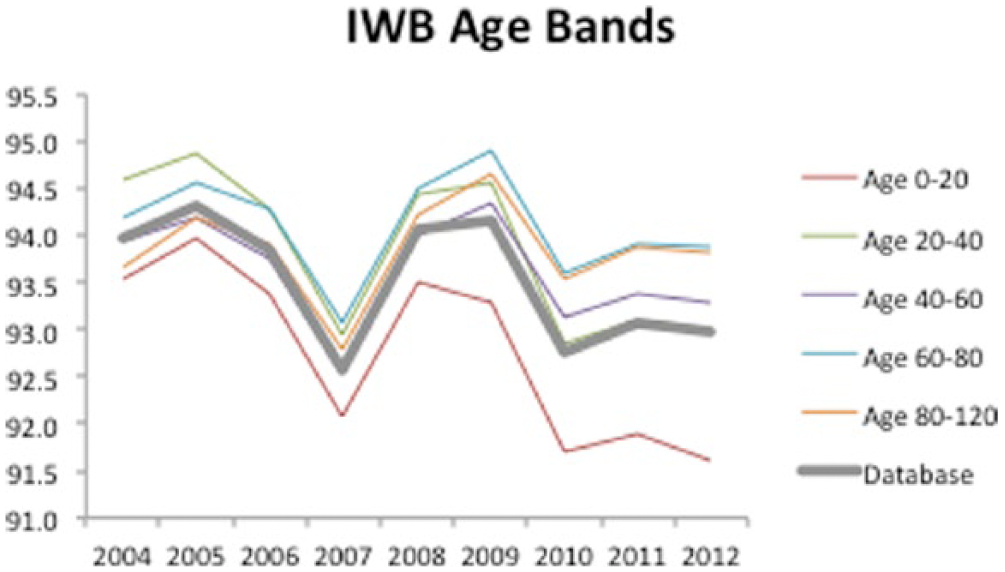
IWB PSS per year based on age subgroups.
Upon analyzing two sample t-test results, it is clear that the same pattern of statistical significance exists year to year as it did for the sample database (namely, that virtually every year PSS movement is statistically significant). In terms of significance in difference between the sample database, the only group to not show it in every year was the age 40–60 basket. Analyzing the magnitude of t-scores, however, it becomes clear that the age 0–20 subgroup has a significant difference in PSS in a negative way and the age 60–80 subgroup has a positive significant difference in PSS. The two sampled t-tests support the alternate hypothesis in both comparisons over time for the different age categories and between the different age categories, most notably in terms of a lower PSS for age 0–20 and a higher PSS for age 60–80.
Sample subpopulation analysis—gender
Figure 4 shows the gender data for IWB for PSS. In both cases (IWB and IWUB), there is minimal difference in RSS between genders, with the female subgroup having the slight edge. The two sample t-tests confirm the same result over time as shown in the sample database test, but show little to no significance in comparison between the two genders. This allows us to accept the first alternate hypothesis and the second null hypothesis with regard to gender.
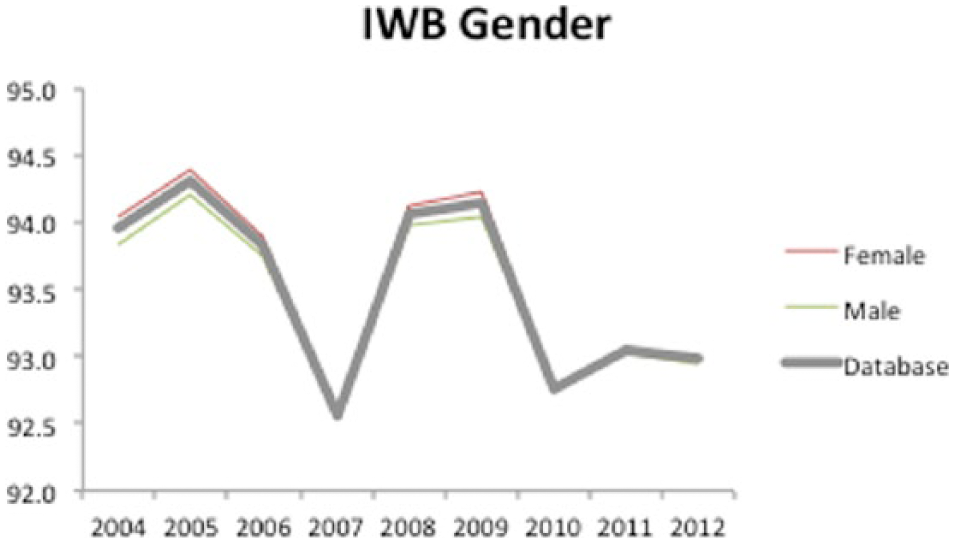
IWB PSS per year based on gender subgroups.
Sample subpopulation analysis—race
Figure 5 shows the race PSS data from the IWB dataset. In terms of major trends, the White subpopulation is consistently above the sample database and all other race subgroups. Conversely, all other race subpopulations fall below the sample database trend, with the Native American subgroup falling significantly below the other subpopulations. In terms of standard deviation, Native Americans and the Other subgroup have higher standard deviations, while the White subgroup and the Asian/Pacific Islander subgroup have lower standard deviations. These trends are mirrored in the IWUB dataset. From the two sample t-tests, the same trend over time is noted as is seen in the other subgroup and sample database analysis. Comparing different subpopulations, however, the t-tests show statistically significant difference between the White subgroup and other subgroups/the sample database, indicating sustained positive PSS within that group. The two-sided t-test also shows negative significant difference among the Black and Hispanic subgroups, and in recent years (2010–2012) negative difference in Asian/Pacific Islander, Native American, and Other. These results are also supported in the IWUB two-sided t-test.
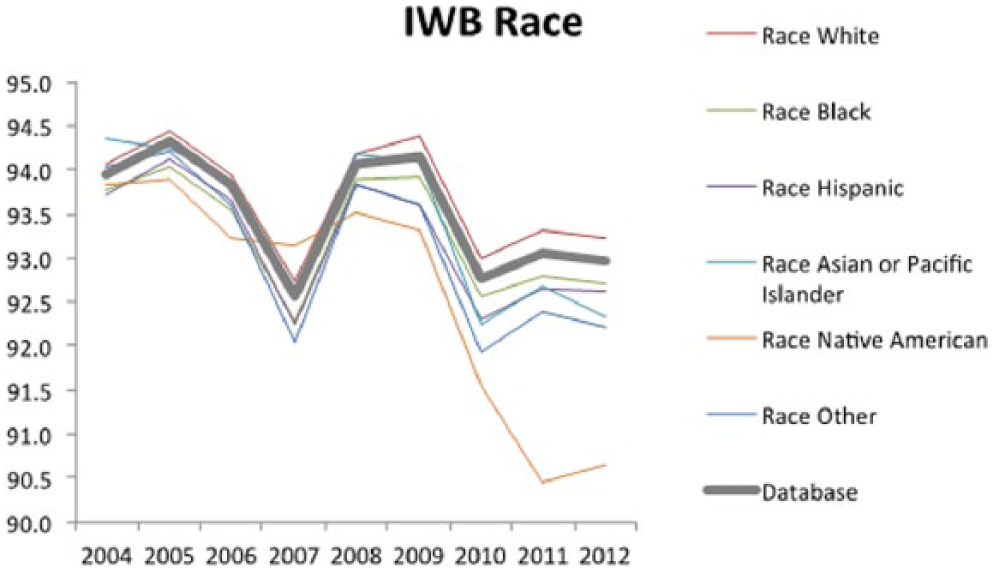
IWB PSS per year based on race subgroups.
Sample subpopulation analysis—correlation analysis
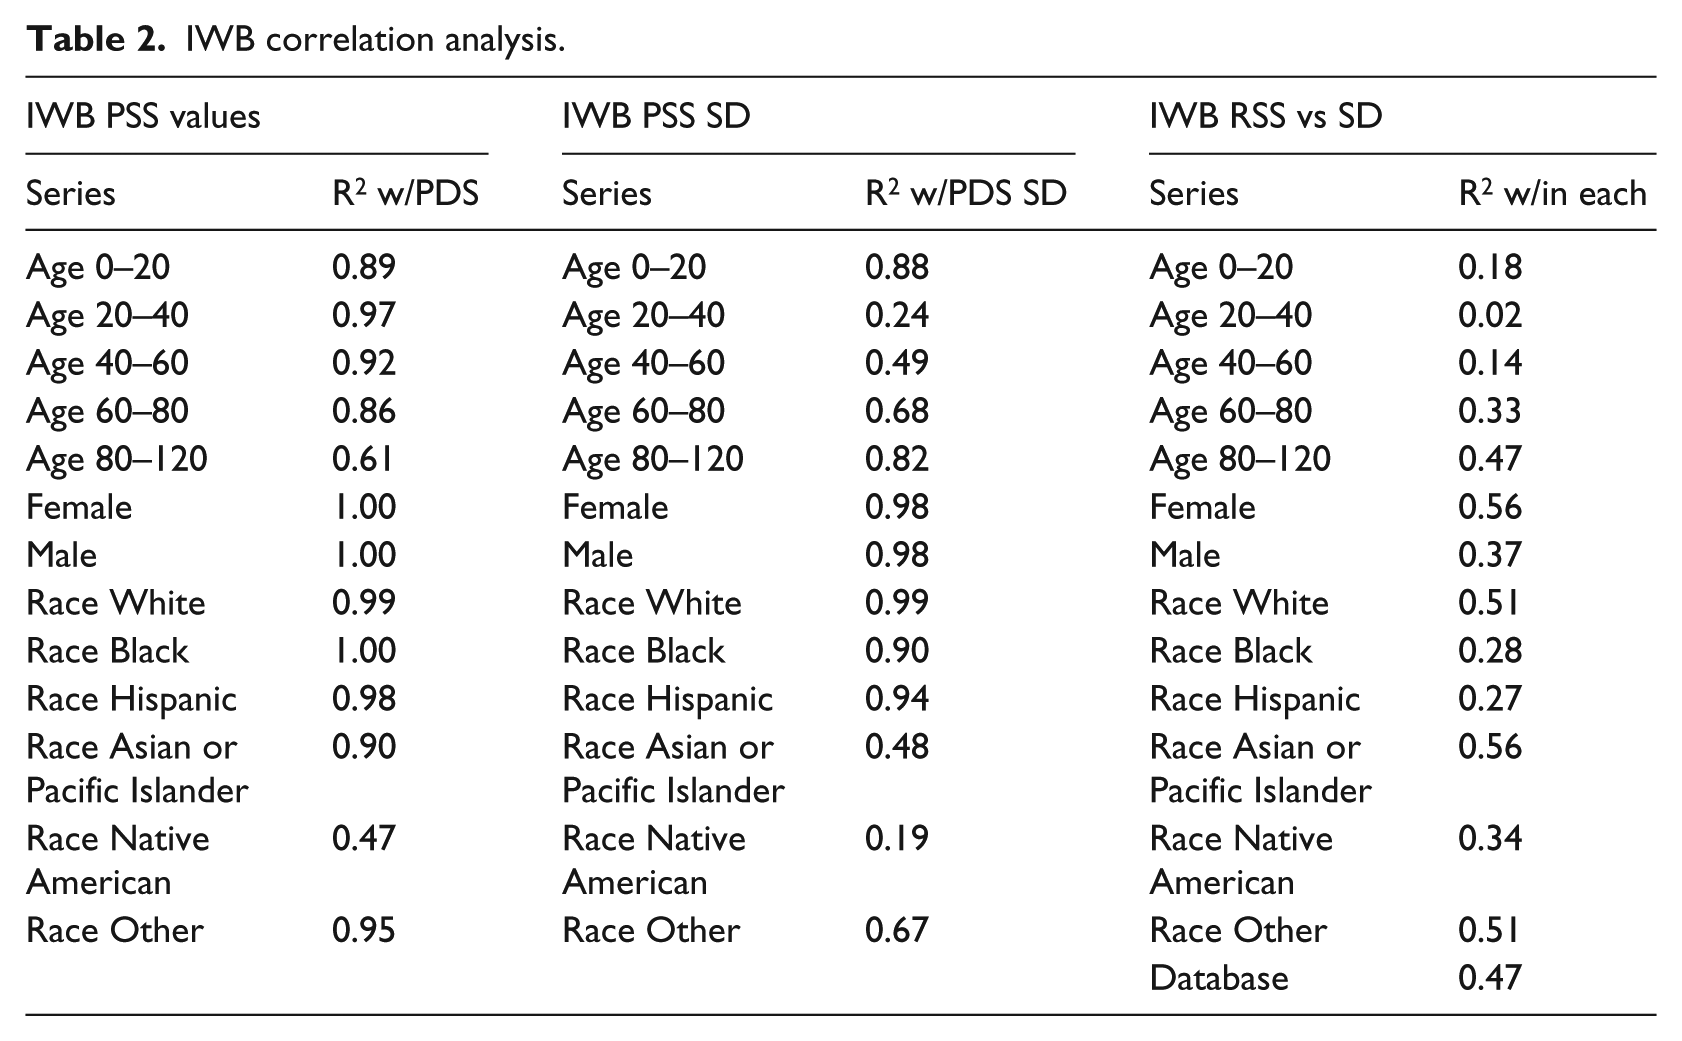
Along with the descriptive analysis and t-test analysis, correlation analysis was used to see the strength of relationship among different elements. Table 2 shows these correlation analyses for IWB. The first column, tracking the movement of subpopulation PSS trend with the sample database PDS, shows significant strength in correlation, indicating a relationship with the trend of the database to the trend of various subpopulations (with notable exceptions being the Native American subgroup and the ages 80–120 subgroup). The second column shows correlation in standard deviation between the subgroups and the sample database. While about half of subgroups have a strong correlation in this category, the other half shows moderate to weak correlation. The third column shows the correlation within each subgroup/sample database between the score trend and the standard deviation trend, showing little to no correlation.
IWB correlation analysis.
DCAP complex subpopulation function and decision tree analysis
Alongside analyzing the sample database and subpopulation data, this article aimed to enhance DCAP by adding a facility to analyze more complex, tiered subpopulations. Previously, one could find completeness data for a certain age group or a certain race independently, but could not combine the groups into a smaller subset. Figure 6 shows a sample complex subpopulation tree created from the results of this new DCAP facility. Note that due to the number of total possible complex subpopulations in this three-tiered dataset (age, gender, and race totaling 72 different complex subpopulations), the figure shown is abridged and traced to a sample complex subpopulation of interest (specifically analyzing Hispanic females ages 40–60 from 2008 IWB data). The different branches of this subpopulation tree, however, show the statistics that can be used to compare different complex subpopulations or complex subpopulations to larger, less complex populations.
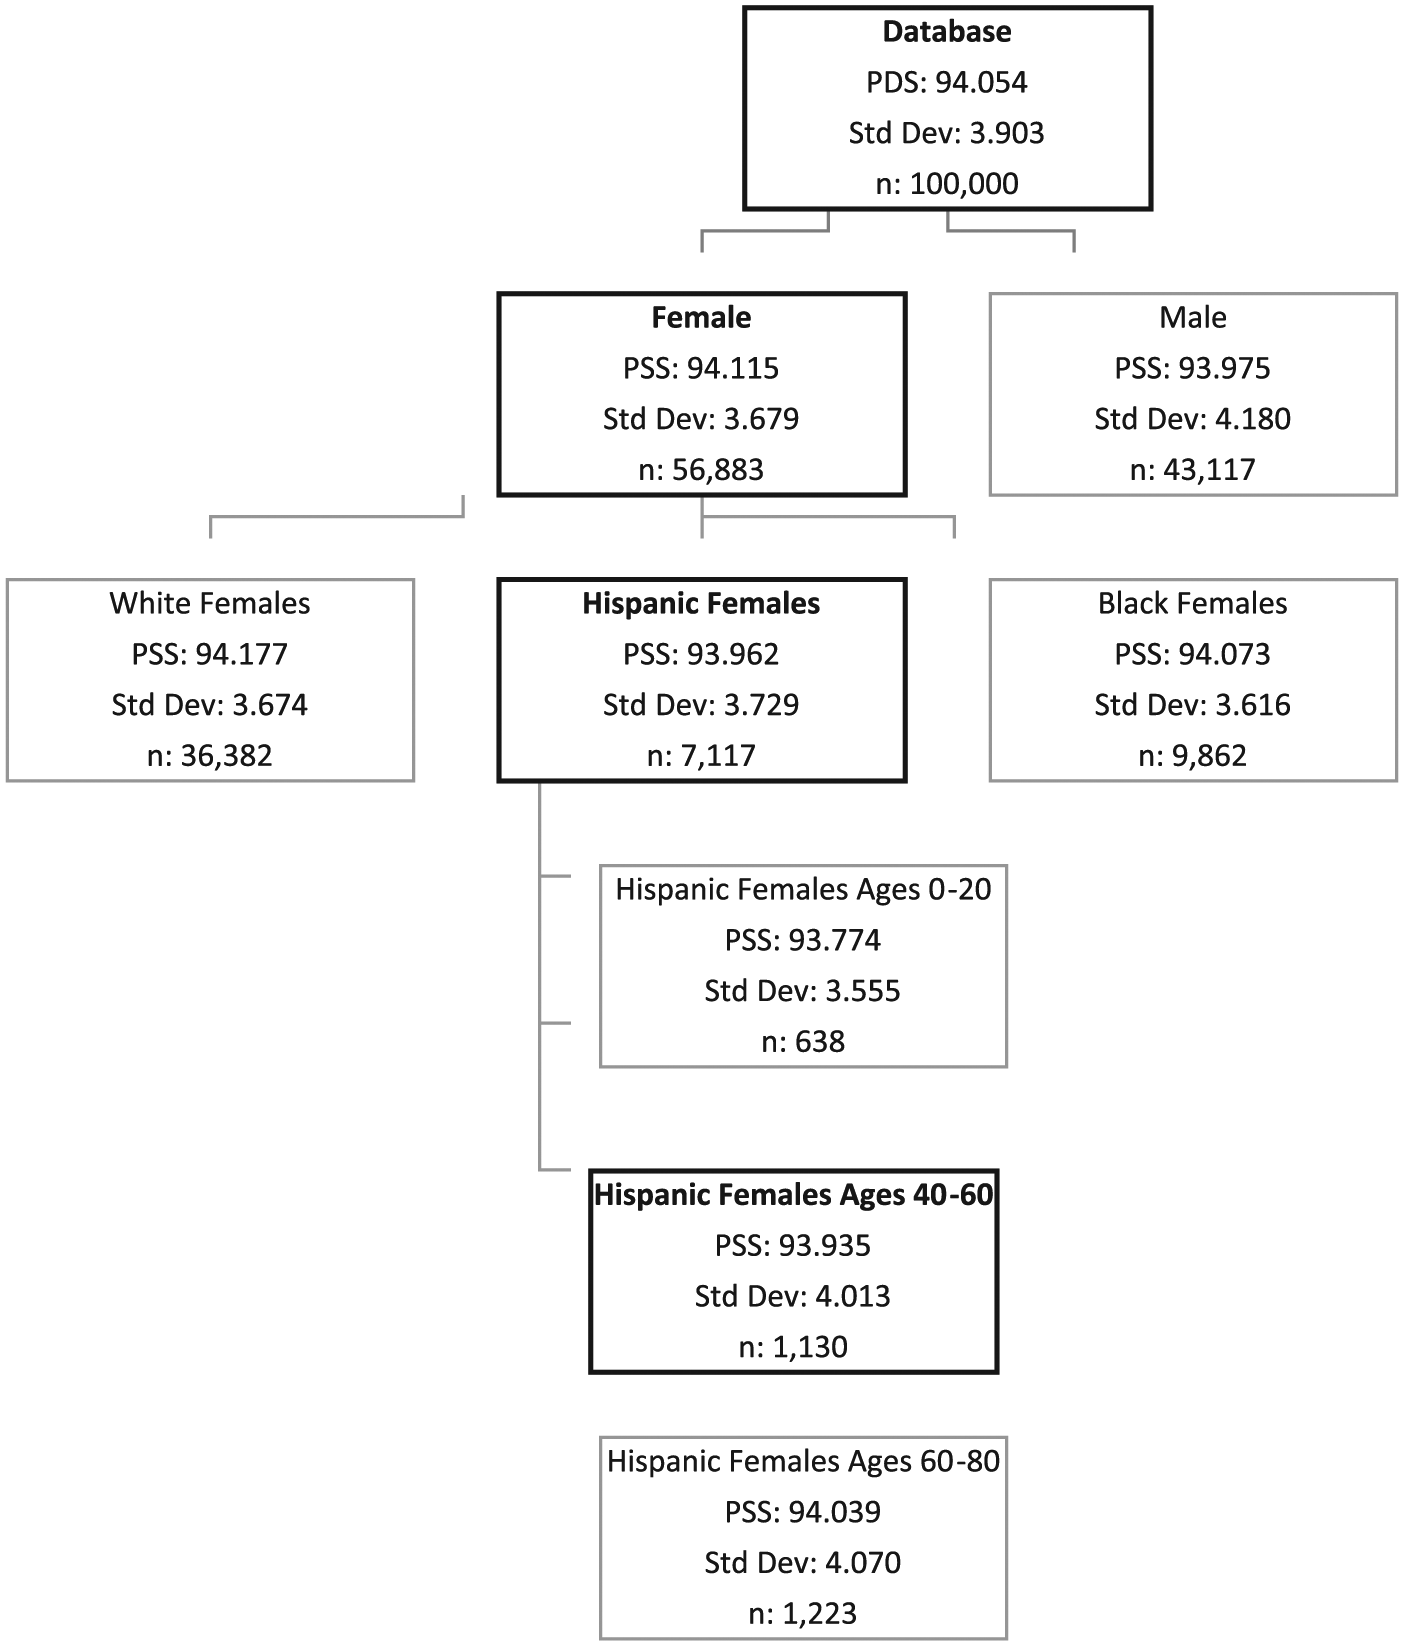
Example of complex subpopulation facility analyzing Hispanic females ages 40–60 from HCUP SID Florida 2008, IWB data.
Having this facility allows for the use of decision trees in conducting complex subpopulation analysis. This can help determine important trends of interest that occur in subpopulations bound by multiple constraints but may not be obvious when comparing between subpopulations bound by one variable. Note that the facility can handle complex requests in any order, and of any subpopulation parameter (both text bound and numerically bound). This facility also allows for organization and integration of data to be used by more complex analytical tools, such as DTREG, 27 that can use this data to build accurate predictive models that can help better uncover important underlying issues in data completeness.
To develop a basic framework for this complex subpopulation analysis, Figure 7 shows PSS over time for the database (highlighted in black) and all complex subgroups over time for the IWB dataset (with IWUB data covered in the online Appendix). As seen in the graph, most complex subgroups cluster around the database, both in absolute PSS score per year and the trend over time. However, there are some complex subgroups that deviate significantly. In preliminary analysis, it appears that Native American Males and Females Ages 40–60, Asian/Pacific Islander Males and Females Ages 0–20, and Black Males Ages 0–20 deviate most significantly below database average in their PSS values (calculated as average difference between the complex subgroup PSS and the database over time), indicating that these complex subpopulations are at high risk for having incomplete data. Asian/Pacific Islander Males Ages 60–80 and White Males and Females Ages 0–20 are among the groups that deviate most significantly above the database values, indicating more completeness among those complex subgroups.
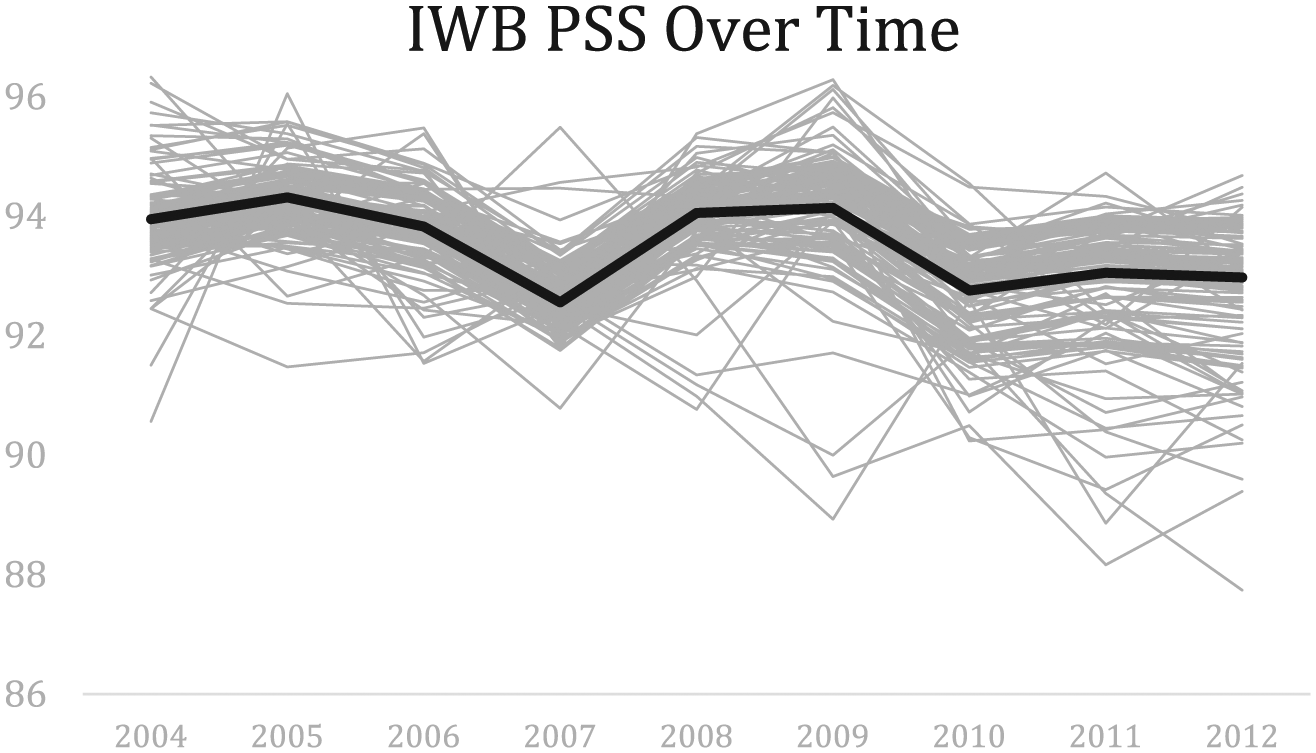
IWB PSS per year based on all complex subgroups (database highlighted in black).
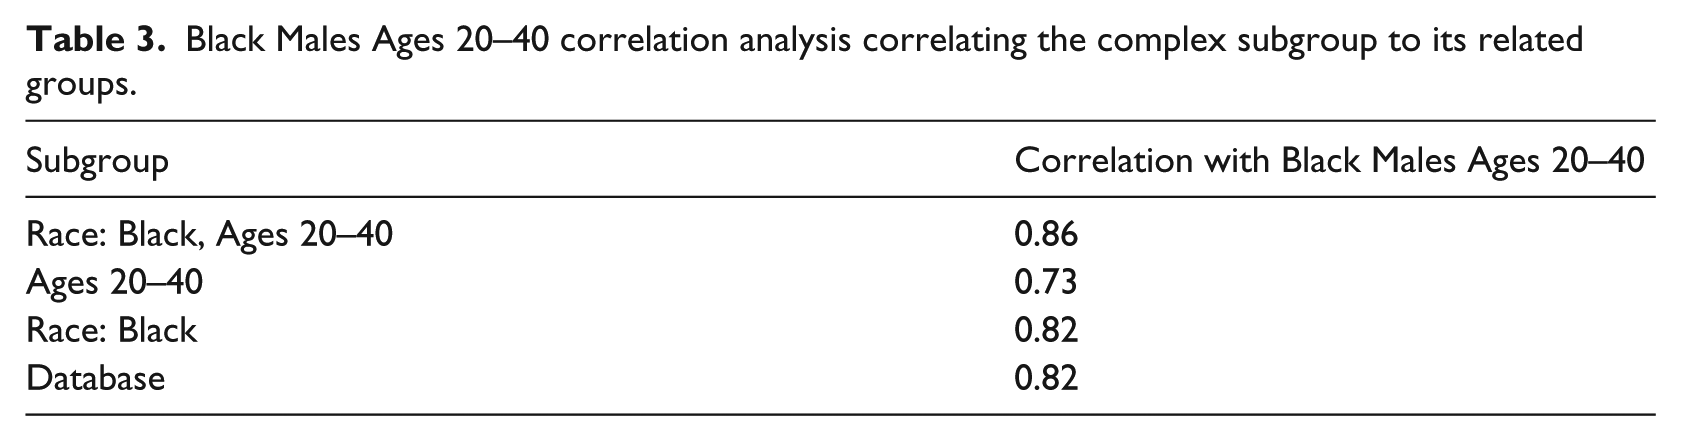
However, one important facet of using complex subpopulation analysis is to see what happens when the different subgroup categories interact. For example, if one subgroup category trends above the database over time and another category trends below, where does the complex subgroup that belongs to both of these subgroups have RSS values relative to the database? To illustrate this analysis, we use Figure 8 to examine Black Males Ages 20–40, comparing them over time to the database, Black patients, patients ages 20–40, and Black patients ages 20–40 of both genders. This graph shows that over time, patients ages 20–40 tend to be above the database value for completeness. However, Black patients tend to be below the database, as well as Black Males Ages 20–40 who trend even further below. To confirm this analysis, Table 3 shows a comparison of correlation values between the complex subgroup (Black Males Ages 20–40) and the respective subgroups it belongs to. Based on the graph and correlations, it appears that this complex subgroup aligns more with its Race subgroup and less with its Age subgroup. It also shows strong correlation between genders within the subgroup of Black Males and Females Ages 20–40, indicating gender has a relatively negligible impact in this complex subgroup analysis as well. This analysis is important since examining age in this case alone may have ignored the systemic underlying issue within this subgroup that trends consistently below other members of its age subgroup, as well as the database as a whole.
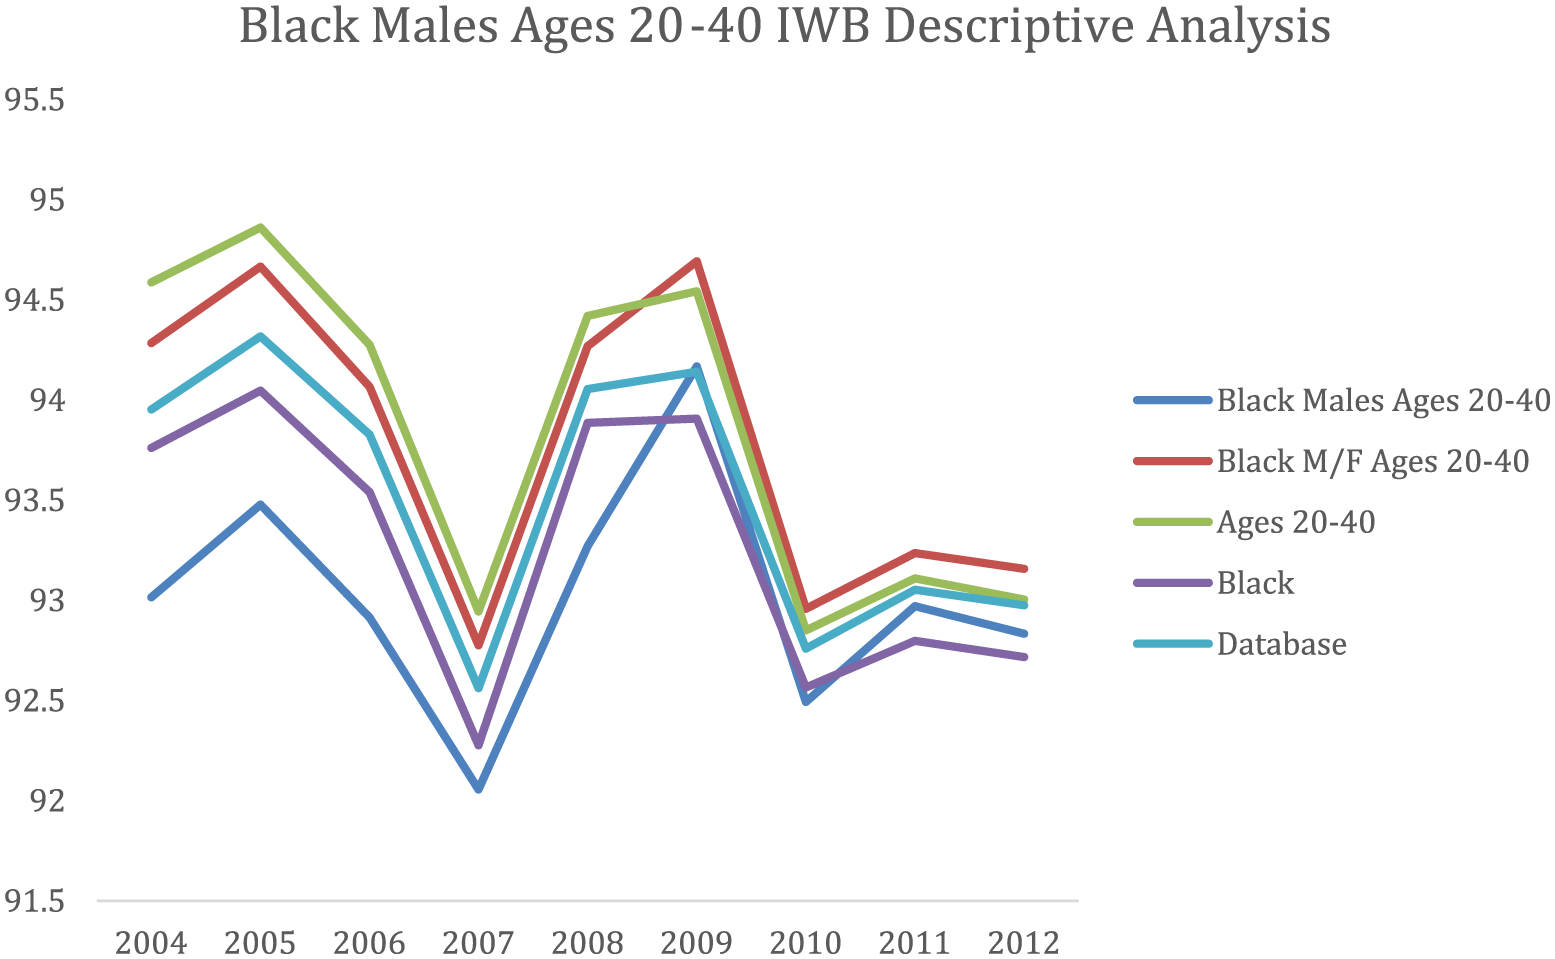
Black Males Ages 20–40 IWB descriptive analysis showing PSS scores over time for related subgroups.
Black Males Ages 20–40 correlation analysis correlating the complex subgroup to its related groups.
This complex subgroup analysis is vital to better understanding trends and underlying issues regarding health care data management for different patient populations. Further rigorous analysis and testing (such as inferential statistical testing, regression analysis, and other modes of analysis) is also required to better understand the role of subgroup interactions as it relates to data completeness in complex subgroups. Given the depth of this complex research and the analysis required, this analysis is left as an area for further research and discussed in the corresponding section.
Results summary
Based on the analysis detailed in the previous section, the following results can be summarized:
The sample database has statistically significant movement in PDS between years, causing the rejection of the first null hypothesis.
There is a statistically significant gap between IWB (higher) and IWUB (lower) completeness scores (among the sample database and different subpopulations)
The age 0–20 subgroup is statistically significantly below the rest of the sample database and other age-based subpopulations while the age 60–80 subgroup is higher. Each of these specific subgroups rejects the second null hypothesis.
There is negligible difference between the gender-based subgroups, allowing for the acceptance of the second null hypothesis for gender.
The White race subgroup is statistically significantly above the rest of the sample database and other race-based subpopulations, while the Black, Hispanic, and Native American race-based subgroups are significantly below. Each of these specific subgroups rejects the second null hypothesis.
There is a strong correlation between subpopulation PSS over time and sample database PDS over time with the exception of the Native American race-based subgroup and the age 80–120 subgroup.
There is moderate correlation between different subgroup scores’ standard deviations with the standard deviation of the sample database score each year, and little to no correlation between a subgroup/sample database score and standard deviation.
Discussion
Limitations
During the course of this article, various important limitations were encountered that we hope can be addressed in subsequent work on the topic of health care record strength and subpopulation analysis.
One important limitation of DCAP is its ability to only monitor patient record completeness and not veracity. While determining completeness within patient data is important, being able to verify that the data are accurate is an important step forward in building stronger patient data systems. Having the capacity to find erroneous data can help correct possible errors in data collection and can improve the health care provided to patients.
Another important limitation is the difficulty in ascertaining “live” data in practicing health care settings. Obtaining data from health care service centers and putting it into a uniform file across various database software packages is a difficult task with various obstacles. The willingness of health care service centers is vital, with patient–doctor confidentiality and Health Insurance Portability and Accountability Act (HIPAA) regulations limiting access to data. Limitations of staff at health centers also create difficulty in excising data (since very few private practices have on-site data technicians able to export fully de-identified and HIPAA compliant data). It should also be noted that even when data are obtained, such as the HCUP data, there are still some degree of manual data handling to make it compatible for use with DCAP (ex. correct file format, understanding what an incomplete variable means per data element, etc.).
The use of statistical methods also implies limitations in the analysis of results. For example, the use of the two-paired t-tests, even under the proper conditions as specified in the assumptions needed for the analysis, carries inherent error. There is also an important distinction between statistically significant results and practically significant results that can only be analyzed through further work.
Areas of further exploration
These limitations discussed above lead in to areas of further exploration that subsequent research might delve to learn more about. For example,
Further work should focus on clarifying differences between statistically significant differences in RSS scores and practically significant differences. One way this can be accomplished is through analysis of linking RSS scores to discrete health care outcomes, such as length of care and diagnoses codes.
While this research paper focused on HCUP SID data for Florida from 2004 to 2012, the data can be widened to other states and can also benefit greatly from other data sources, especially from practicing health centers.
The IWUB analysis provided in this research was cursory in order to show how imbalance in data fields can affect results. For more meaningful information, however, further work should consider developing a framework from the proper authorities that can determine numerical weights to common medical database data fields.
While this article added a complex subpopulation facility to DCAP and discusses preliminary work briefly, future work can focus on analyzing complex subpopulations to uncover trends in completeness. There are important trends to be uncovered among comparisons between complex subpopulations that belong to multiple subgroups in terms of age, gender, race, and other variables. Finding these trends and analyzing specific discrepancies can be useful for a variety of research inquiries and can use techniques such as predictor tree analysis (such as DTREG 27 ), inferential statistics, and regression analysis to account for the complex nature of the subpopulations.
Currently, DCAP uses CSV files and has limited parameters for input data. Future work can focus on expanding the capabilities of DCAP to handle a variety of data formats. Furthermore, DCAP can also be restructured to handle larger datasets and eliminate the need for sampling.
Future work should also focus on integrating veracity capabilities to DCAP. For example, the issue of automated veracity could be investigated through common data heuristics, through communication with a central database as a cross reference, or by tracking data in records to specific sources that can be checked against. Special attention needs to be paid to free-text data variables and the statistical measurement of veracity as opposed to completeness.
Focusing on solutions involving using new software packages and database standards that integrate lessons learned in maintaining complete and accurate data. 28 This includes topics such as data entry control, use of contextual information, incentive alignment, user requirement analysis, measurement of improvement, data entry checks, enhanced data analysis, and creating strong networks among disparate databases to cross-check information.
Conclusion
The core contributions of this article are as follows:
Uncovering of trends in data completeness within HCUP SID data for the state of Florida from 2004 to 2012, with special focus with regard to subpopulations based on age, gender, and race.
The development of a complex subpopulation facility within DCAP to analyze layered subgroups and provide a platform for future analysis.
The foundation for future work that can focus on a variety of areas within patient data integrity and determination of subpopulation vulnerabilities through suggestions such as automated veracity, linking RSS scores to discrete health outcomes, and expansion of DCAP (in both its data handling and data analysis).
In terms of hypothesis testing, the following conclusions were reached:
The first null hypothesis (H01: PDS and PSS overall and by subgroup stay consistent over time) was rejected since there was statistically significant difference in completeness over time.
The second null hypothesis (H02: PDS and PSS scores stay consistent between different subgroups/between subgroups and the sample database average) was rejected in certain instances and accepted in others based on the subgroups compared.
More details regarding the testing of these hypotheses can be found in the “Results” section.
Based on the original objectives mentioned in the “Introduction” section, this research paper has proved successful in analyzing the HCUP SID data to uncover trends at both the database and subpopulation level, as well as added to DCAP through creation of the complex subpopulation facility. While limitations such as determining data veracity and analysis of results within a practical framework exist, the foundation for future work has been built. Overall, this article provides a step forward in uncovering patient data vulnerabilities, especially along subpopulation lines, and provides promising areas for future research.29–32
Clinical relevance statement
The use of DCAP to evaluate the HCUP SID data in terms of variance between subgroups is important clinically in order to determine areas of incomplete information and finding asymmetries that can be attributed due to disparities in delivery of care. Current systems in place do not address the collection and maintenance of health care data with regard to identifying underlying disparities among various subpopulations, such as those based on age, gender, and race. The use of DCAP with an objective of highlighting disparities in care helps provide a useful foundation of evidence upon which further exploration could be done to identify and correct the underlying systemic issues that can alleviate these disparities.
Involvement of human subjects
The investigators have conducted the experiment after getting appropriate approval from the Institutional Review Board (IRB) of the institution (IRB Exempt). Therefore, all the required ethics and standards have been followed.
Footnotes
Declaration of conflicting interests
The author(s) declared no potential conflicts of interest with respect to the research, authorship, and/or publication of this article.
Funding
The author(s) received no financial support for the research, authorship, and/or publication of this article.
References
Supplementary Material
Please find the following supplemental material available below.
For Open Access articles published under a Creative Commons License, all supplemental material carries the same license as the article it is associated with.
For non-Open Access articles published, all supplemental material carries a non-exclusive license, and permission requests for re-use of supplemental material or any part of supplemental material shall be sent directly to the copyright owner as specified in the copyright notice associated with the article.