
Abstract
This study investigates some of the data quality challenges facing the HIV surveillance system in the United States. Using the content analysis method, Center for Disease Control annual HIV surveillance reports (1982–2014) are systematically reviewed and evaluated against relevant data quality metrics from previous literature. Center for Disease Control HIV surveillance system has made several key achievements in the last decade. However, there are several outstanding challenges that need to be addressed. The data are unrepresentative, incomplete, inaccurate, and lacks the required granularity limiting its usage. These shortcomings weaken the country’s ability to track, report, and respond to the new HIV epidemiological trends. Furthermore, the problems deter the country from properly identifying and targeting the key subpopulations that need the highest resources by virtue of being at the highest risk of HIV infection. Several recommendations are suggested to address these issues.
Keywords
Introduction
The purpose of evaluating public heath surveillance systems is to ensure that problems of health importance are being monitored efficiently, effectively, and regularly.1–4 Public health surveillance systems provide data that can be used for several purposes. In particular, the analysis and interpretation of data from HIV/AIDS surveillance systems plays a critical role in observing emerging trends and making intervention decisions.5–8 HIV Surveillance data in the United States are used “to monitor the spread of HIV infection, to target HIV prevention programs and health-care services, and to allocate funding for HIV prevention and care.” 7
HIV/AIDS continues being a key challenge in the public health arena in the United States. At the end of 2012, 1.2 million people were living with HIV/AIDS in the United States 9 with 70.2 percent receiving antiretrovirals (ARVs) in 2015. 10 About 658,507 people in the United States with an AIDS diagnosis have died by 2012. 9 Furthermore, HIV/AIDS interventions continue to consume a considerable portion of the nation’s budget. For example, President Obama’s fiscal year 2014 federal budget request included a US$29.7 billion for HIV/AIDS funding. 11
Even more worrying is the direction that the prevalence rates are taking. While new infection rates are declining globally by 19 percent, and in 22 sub-Saharan Africa countries by 25 percent during 1990–2009, 12 the US diagnosis of new infections has increased by 8 percent during 2005–2008. 13 In the District of Columbia at the end of 2006, at least 3 percent of residents had HIV or AIDS with the rate reaching almost 6.5 percent among African American men. 14 This represents a 22 percent increase in HIV and AIDS cases over the previous data period. 14 These rates are higher than those of some countries in West Africa and at par with the rates in some parts of Eastern Africa. 12 These facts suggest a critical need for increased surveillance of HIV/AIDS epidemiological trends to identify the key subpopulations that need resources most.
This study contributes to research by evaluating the “quality of data” from the CDC HIV Surveillance Systems in the United States. We start by describing how the CDC system work followed by the methodological approach and evaluation criteria for HIV surveillance systems from previous literature. After that, we comment on current HIV surveillance system’s data in light of the emerging epidemiological trends at the national levels and the shortcomings identified. Finally, we conclude with a few recommendations. In order to do so, it is necessary to understand the current US Center for Disease Control and Prevention (CDC) HIV/AIDs surveillance system (Figure 1).
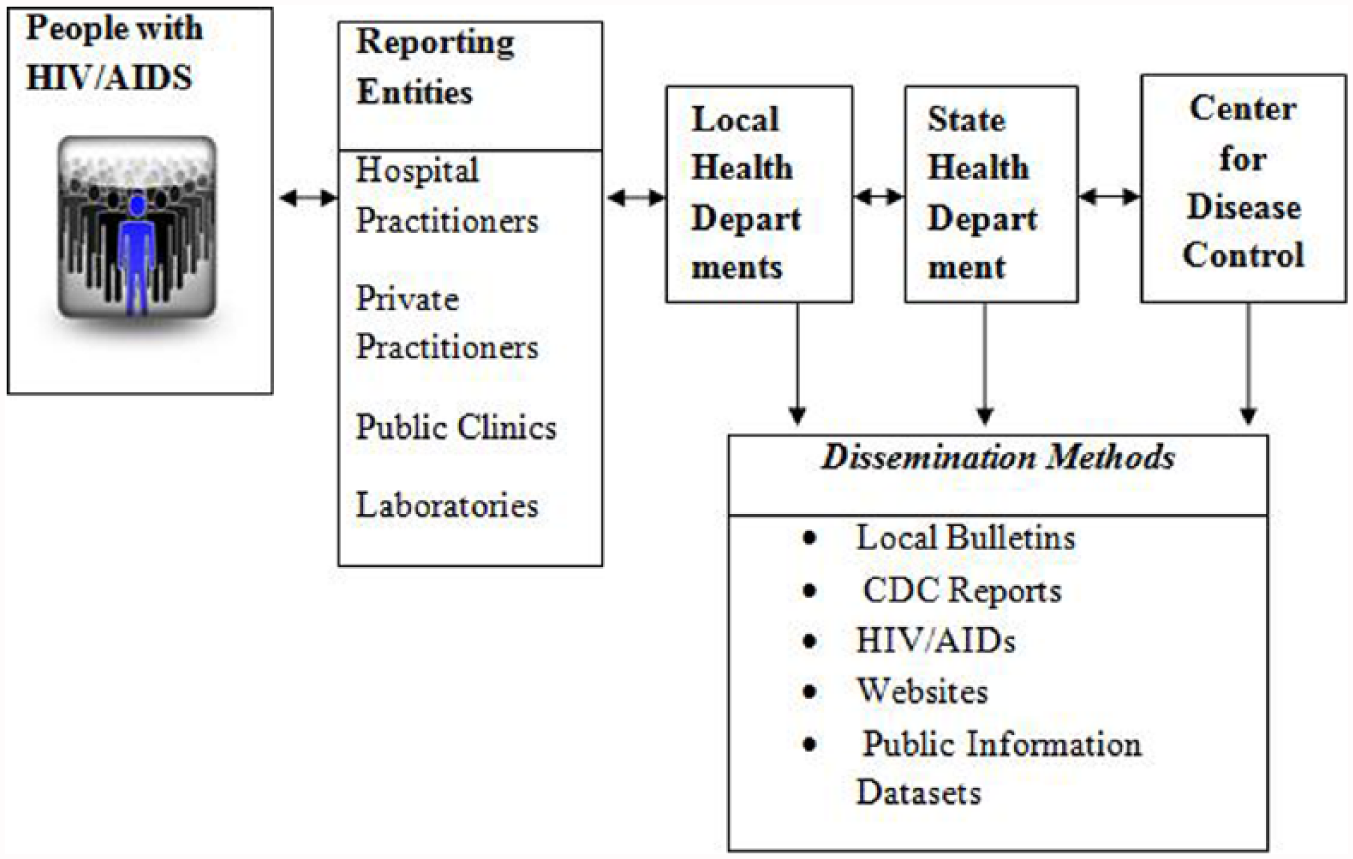
How the CDC HIV/AIDS surveillance system works. 15
As shown, CDC employs both passive and active strategies in collecting national HIV/AIDS surveillance data. In the passive strategy, physicians and related laboratory sends a positive test result to the state’s department of health as per national guidelines (Center for Disease Control and Prevention, 2006). In active surveillance, the local health department personnel actively solicit for information by contacting healthcare practitioners and reviewing medical records in hospitals and clinics to ensure data accuracy and completeness. The local health department then reports this information to the state health department who in turn transmit the information to the national center for disease control after removing the duplicates.
However, little is known about the quality of data from the current HIV surveillance systems, hence the importance of this study. We evaluate the data quality using relevant frameworks from the fields of information quality16–19 and healthcare data quality.1,20–22 Previous work in the information quality field 16 has suggested a standard framework for evaluating the quality of data from any system which includes 12 data metrics namely: Accuracy, Objectivity, Believability, Reputation, Value-added, Relevancy, Timeliness, Completeness, Appropriateness, Interpretability, Ease of understanding, and Representativeness. The healthcare field has suggested an additional metric of granularity. 20
This study will demonstrate that the current US HIV surveillance data has shortcomings with representativeness, completeness, accuracy, and granularity.
Representativeness measures the extent to which the surveillance systems data is a true reflection of the general population distribution. 2 For example, representativeness can measure how well the different demographics are represented by the HIV surveillance system. Completeness refers to the “extent to which data is of sufficient breadth, depth and scope for the task” at hand. 17 This is applicable in this study because the stakeholders will need a complete picture of the HIV menace to structure effective counterprograms among others. Accuracy refers to “the extent to which data is correct, reliable, and certified free of error.” 17 Data accuracy is the foundation dimension of data quality because all the other dimensions matters little if the data are not accurate. 23 Data Granularity refers to the “level of detail at which the attributes and values of healthcare data are defined.” 20 Different data usage may require different levels of granularity. Most important, Data must be “fit to use” to be of high quality. 19 In line with this paradigm, the HIV surveillance data must be granular enough to fit the various usage identified in the beginning of this section.
Method
We used the content analysis method to systematically evaluate the data quality of HIV surveillance annual statistics reports (1982–2014) published on CDC website. These reports are published by the CDC every year usually with a 2-year lag in the data report year publication to allow the data to stabilize. Content analysis is a “technique for making inferences by objectively and systematically identifying specified characteristics of messages.” 24 We have extracted data from each of the 30 reports on the following parameters: age, gender, race/ethnicity, HIV or AIDS, residency by state and District of Columbia, number of states reporting HIV, number of states reporting AIDS, modes of transmission, incidence HIV, prevalence HIV, incidence AIDS, prevalence AIDS, and number of deaths as shown in Online Appendix 1. We summarize the milestones, strengths, and shortcomings of the national HIV surveillance data from the above evaluation and then make recommendations on how the shortcomings can be mitigated.
Results and discussion
Notable HIV surveillance data quality achievements
The analysis of the HIV reports demonstrate the CDC HIV surveillance system’s data has played a crucial role in helping the government monitor, control, and publicize the HIV pandemic. CDC has taken several bold measures, which have resulted in key improvements in the quality of the data. The first measure concerns integrating different data sources. CDC, working with state and other government agencies, planned for a National Electronic Disease Surveillance System (NEDSS). The primary goal of the system was to connect different states surveillance systems, expand, and allow the government to respond more quickly to public health threats. 25 The base module is already working allowing states to manage more than 140 diseases and conditions. 25 This has significantly improved the timeliness of the data at the national level. For example, a specific input at one corner of the country is quickly reflected at the national level. This has helped address the previous lack of integration among the different systems.
The second measure involves creation of HIV/AIDS definition guideline. Different physicians/hospitals were using different criteria to determine who has HIV-AIDs; hence, there was a need for the US government to give a common criterion to be used to determine who was eligible for US government assistance benefits. CDC came up with a definition criterion that stated that a person has AIDs if they are diagnosed with one or more of the “AIDS indicators” diseases or be HIV-positive with a CD4 T-lymphocyte count of less than 200 cells/mL as defined by the CDC guidelines. 26 This has created a uniform baseline for determining the qualifying cases for all the physicians.
Third, CDC has moved to HIV-based reporting 26 rather than reporting based on previous AIDS infections guidelines. 27 The use of ARV medicines has slowed down the progression of HIV to AIDS meaning AIDS-based reporting can no longer be relied upon to give updated disease trends which is required for timely response. 7 Thus, HIV-based reporting gives a more complete picture of the HIV/AIDS pandemic and can help predict the expected level of AIDS in the future based on the average progression rates.
Fourth, as of April 2008, CDC requires that all the 50 states and the 5 dependent areas report the HIV/AIDS cases by individual names which are kept confidential by CDC. 28 This gives higher accuracy and is easy to compare with other related name-based infections.
Fifth, since January 2008, CDC is encouraging and funding states to use the latest technology to estimate the infection time for all the HIV cases being detected. 25 This is because a new HIV diagnosis incident does not necessarily mean that the infection is recent. The person could have been with HIV for several years undetected. A significant number of people with HIV in the United States have never been tested. A previous study noted that there are 25 percent of people with undiagnosed HIV who are responsible for 54–70 percent of new infections. 29 More recent data show that about 14 percent of those living with HIV nationally are undiagnosed and varies from a low of 77 percent in Louisiana to over 90 percent in New York. 30
The recommended testing method developed by CDC is called Serologic Testing Algorithm for recent HIV Seroconversion. 31 This method uses two enzyme immunoassays (EIAs) with different sensitivities to the levels of HIV antibodies. A specimen reaction to the standard EIA, but not to the less sensitive EIA, suggests a new infection. 32 This measure will give more accurate infection data and hence lead to better evaluation of the HIV incidence. In summary, data from the HIV/AIDS surveillance systems have helped achieve several notable successes that should be recognized.
HIV surveillance system data quality outstanding shortcomings
The analysis of the CDC reports reveals four major shortcomings with the quality of data from the HIV reporting and surveillance systems in the United States. The data are unrepresentative, incomplete, inaccurate, and lacks the required granularity, thus limiting its usage.
The first shortcoming is that the data are not representative of the general population. Current US HIV/AIDS surveillance data are based on estimates. 33 The data only include the cases of those individuals who have been tested. 15 There are various reasons why an individual may not have been tested for HIV: it could simply be that the individual is healthy and has not had a reason for being tested. Other reasons include structural barriers to healthcare access such as lack of health insurance, lack of information about availability of testing, cost of testing, and confidentiality of results, stigma, and misconceptions.34–37 The health provider may also not have recommended a test. For example, in Washington DC while in a 2006–2007 survey 79.7 percent said they had seen a healthcare provider, only 49.4 percent were offered a test. 38 More recently, of 3,343,633 CDC-funded HIV tests completed in 2013 in over 23 testing site types by 61 health departments and 151 CDC-funded community-based organizations, none of the sites met the primary goal of the National HIV/AIDS Strategy to link 85 percent of all new HIV positives to medical care within 90 days of diagnosis. 39
Despite the fact that CDC now recommend routine testing for all patients aged 13–64 years, 40 nationally only about 53 percent of the population above 18 years report having been tested in 2009. 37 Public awareness of HIV is also going down. For example, the share of those reporting seeing advertisement and hearing about the domestic HIV epidemic today has declined to about half that of 5 years ago. 37 This would suggest that there is need for more awareness campaigns to increase the number of people being tested which studies show can result in reduced new infections 41 and is cost-effective.42,43
The second shortcoming is that the data are incomplete. CDC advised states to move from code-based to name-based HIV case reporting in 1999 which was later strengthened to a recommendation in 2005 and into a requirement in 2008 26 following stoppage in October 2006 of Ryan White Care Act funding to states not reporting by name. 44 One unintended consequence is that the CDC directive resulted at least in the short term in incomplete data. We will use the state of California to demonstrate this point. California was using a code-based reporting method from 1983 but changed to the name-based system in 2006. However, as of April 2009, only about 36,000 cases of HIV had been reported by local health departments to the state by name despite the fact it was estimated in 2008 that California had between 68,000 and 106,000 HIV cases. 45 This suggests that more than half of the HIV cases were yet to be captured by the name-based reporting system making the current figures incomplete. This may result in California getting less state funding which is based on the number of reported name-based HIV cases. 46 Thus, the incompleteness of the system may skew the allocation of resources and may weaken the nation’s capability of predicting new disease trends.
Furthermore, starting to report the data using confidential name reporting does not guarantee inclusion of all the data either. Rather, there is a delay period because CDC requires that states must have been in the confidential name-based reporting for 2–3 years before the data are considered stable enough to be included in the national data reports. 13 As of the 2010 report, only 37 states and 5 dependent areas had been doing confidential name-based reporting long enough to be considered stable as per this requirement. 13 This means that the data from the remaining 13 states are missing which adds to the incompleteness of the current national data. This represents approximately 32 percent of the data 13 which is substantial by any count. Additionally, CDC expects that the name-based reporting system matures in 4 years when trends could be regarded as reliable. 47
The third shortcoming is that the data are inaccurate. While the CDC reports 1.2 million people are living with HIV/AIDS, 9 two recent studies show these figures to be overestimated. The landmark Global Burden of Disease (GBD) 10 Study puts the figure at 833,000 in 2014 based on mixed methods data collection, whereas another study finds the figure to be 819,200 in 2011 based on laboratory reporting. 48 CDC 49 estimates of newly diagnosed (44,073) in 2014 were twice as high compared to those (23,040) of the GBD. 10 Further inaccuracy may result from adjustments in data reported to the CDC and to the Health Resources Services Administration (HRSA) based on gaps in code-based and name-based reporting. HRSA continually monitors the care and treatment of groups and areas funded under the Ryan White. As the main instrument of federal funding for HIV countrywide, under the 1987 Ryan White Act, living non-AIDS cases reported directly to the HRSA from the eligible code-based reporting areas are adjusted by 5 percent to cater for duplicative reporting. 46 The rule is applied unevenly—it is not applied to areas with name-based reporting which affect the tallying of cases and resulting accuracy. This can affect funding levels which are based on these numbers; all other factors like politics being held constant.
The fourth and most critical shortcoming is that the data are not granular enough to help focus resources on the subpopulations at the highest risk of infection.50,51 First, in terms of mode of transmission, the reports do not distinguish between homosexual and bisexual contact, despite the fact that these represent different transmission patterns within a population as shown in Online Appendix 1. The percentage of the people diagnosed with HIV infection attributed to male-to-male sexual contact increased from 60 percent in 2010 to 67 percent in 2014. 49 These are key subpopulations that need to be targeted with resources.
Second, in terms of racial categorization, the reports only consider six different racial categories (Asian and Pacific Islander were only separated in 2007) which is not granular enough to reveal the racial subpopulations needing the most resources. Over the years, the percentage of AIDS diagnosis in adults and adolescent whites has decreased while the percentage of same in Blacks/African Americans and Hispanics/Latinos has increased. 52 In 2008, 52 percent of the Americans diagnosed with HIV were Blacks/African American despite the fact that they only consist of 12 percent of the US population. 13 In 2010, the percentage of Blacks/African American came down slightly to 48 percent but this is still about half of the whole HIV/AIDs diagnosed population. 52 The same report shows that the estimated rate of new “HIV among black/African American males (116.0) was more than 7.5 times as high as the rate for whites (15.3) and more than 2.5 times as high as the rate (44.7) for Hispanics/Latinos.” 52
The latest statistics shows that from 2010 through 2014, Blacks/African Americans had a HIV diagnosis of 44 percent. 49 Thus, the percentage of Blacks/African American came down slightly, but this is still about half of the whole HIV/AIDS diagnosed population. Even worse, approximately two-thirds (63%) of diagnosed HIV infections attributed to heterosexual contact were among Blacks/African Americans. 49
To be fair, CDC has been working with various groups on several initiatives to combat HIV especially among African Americans. 53 The doubling by CDC of its investment in 2008 to US$70 million to increase HIV testing among African Americans and the launching of a US$10 million “Act against AIDS campaign” with 14 of the nation’s leading African American organizations are two examples of such initiatives. 54 However, these pale especially when calculated as a fraction of the whole CDC budget of US$515 Billion allocated for HIV prevention to the 50 states and dependent areas for the 2008 fiscal year. 55 While we acknowledge the political nature of resource allocation, this suggests that the HIV data have not helped as much as it should in focusing resources on the community at the highest risk of infection, a matter that is the focus of a recent modeling exercise for more efficient resource allocation. 56
Furthermore, CDC uses “Black/African American” to include all people Black, as does the recently released National HIV Strategy. 57 This classification fails to recognize the diversity of the Blacks/African American label and may be missing some important pockets of these subpopulations. This fact was recently demonstrated by studies done by analyzing HIV data in states with high African-born communities.58,59 One of these focusing on California, Georgia, Massachusetts, Minnesota, and New Jersey and in King County, Washington, New York City and the portion of Virginia included in the Washington, DC, metropolitan area found that African-born individuals accounted for only 0.6 percent of the population yet had 3.8 percent of the HIV cases diagnosed in the participating areas. 59 Even more alarming, they consisted up to 50 percent of the HIV cases diagnosed in Blacks in some areas like Minnesota, where cases for 2009–2011 in females born in Africa remained the majority. 60
In another example, immigrants and refugees born outside the US compromise 20 percent of the total population of Massachusetts residents living with HIV/AIDS yet they only consist of 12 percent of Massachusetts general population. 61 The report further indicates that the infection rate of the non-US-born population rose from 19 percent in 1999 to 34 percent in 2007 showing that the infection rate in this section of the population is rising rapidly. The largest proportion (34%) of the non-US-born population diagnosed with HIV/AIDS within the 3-year period 2005–2007 was from sub-Saharan Africa. It is highly likely that HIV prevalence for the immigrants from these countries follow them as they come in and settle in their specific preferred neighborhoods. 62
Immigration will likely play a factor in future new HIV patterns especially following the removal of the ban in 2009 in which an estimated 1073–6409 HIV-infected immigrants will be granted legal permanent residency resulting in 170–1014 new infections in the host population. 63 Hence, studying immigration patterns and behavior of immigrants from high-risk countries would be a key step in understanding and overcoming the spread of infection among these groups 64 and lead to a more effective and responsive surveillance system. These cases also suggest that classifying HIV cases occurring in African-born population as “African American” or “black” can be misleading and could lead to neglecting critical subpopulations in the allocation of resources. Thus, the HIV surveillance data are not “fit-for use” when evaluated against this expected usage.
Conclusion and recommendations
This study assessed the data from current HIV surveillance system in the United States on the basis of prior established criteria for evaluating public heath surveillance systems.2,17 Data and sources of data are of critical importance in measuring the HIV/AIDS epidemic. 5 We assessed the quality of the current US HIV/AIDS data and its fitness for use. The results suggest that the system has achieved certain worthy goals. For example, the system has integrated different data sources at the national and state levels. Furthermore, a standardized HIV case definition, testing, and reporting guideline has been established, thus improving surveillance.13,31,33
However, there are several shortcomings with the current surveillance system primarily due to the type of methods used to collect the data and the sources of that data. First, the data are not representative of the general population but rather only reflect the population that has undergone testing. We recommend increasing HIV/AIDS awareness that encourage early testing through campaigns and strengthening of the HIV/AIDS services systems to link testing to care which is vital.
Second, the data are incomplete due to exclusion of states that do not meet certain stability requirement and use of name-based reporting. 48 This can lead to unfair resource distribution based on the incomplete numbers. We recommend the continued use of existing resource allocation percentages until the data stabilize on a state-by-state level.
Third, data are inaccurate with CDC data being highly overestimated in some cases, which can also lead to inaccurate resource allocation. We join other scholars in recommending that comprehensive HIV laboratory reporting be used to estimate national and local data. 48 Without reliable and timely estimates of incident HIV achieving the national and global goals of ending the epidemic will not be possible and makes for an urgent call. 65
Fourth, the systems lack the required granularity especially because of the usage of “catchall labels” like “Blacks” without inclusion of country of origin or other unique identifiers leading to overgeneralization. We recommend that certain changes be made to bolster the usefulness of the data. As HIV transitions into a more heterosexual transmission, 13 with the lifetime risk of infection66,67 reaching 1 in 64 Americans (1 in 20 among Black men and 1 in 48 among Black women compared to 1 in 132 and 1 in 880 white men and women, respectively); more specification in population-based capture and reporting, not less, will be needed. Reporting by the current racial groups does not adequately capture the increasingly complex transmission risks due to the cultural and ethnic diversity.58,59 We recommend that future strategies should not just be race-based but also include country-of-birth-based reporting to account for the role of migration in transmission.58,59 In addition, research methods like targeted surveys that aim at hard-to-reach 68 subpopulations can be used to supplement the CDC reports in getting more data on the subpopulations at risk. We admit that including all these additional details may make the database complex. However, CDC can use emerging ways of organizing and reporting data to automate some of this work. For example, a new semantic framework for global disease surveillance 69 has been suggested that will make automation of surveillance report easier and make it easy for machine-to-machine communication of disease surveillance entry attributes. These recommendations will help to boost the successful implementation of the National HIV/AIDS Strategy 57 now updated to 2020, whose focus is reducing new infections, improving access to care, reducing disparities, and achieving a more coordinated national response to the HIV epidemic.70,71
Footnotes
Declaration of Conflicting Interests
The author(s) declared no potential conflicts of interest with respect to the research, authorship, and/or publication of this article.
Funding
The author(s) received no financial support for the research, authorship, and/or publication of this article.