
Abstract
Previous literature on the impact of scribe programs varies and has mostly been reported from academic institutions or other clinics. We report the implementation of the scribe program in the emergency room of a community hospital and its impact on patient throughput, physician productivity, and patient satisfaction. We performed a quasi-experimental, before-and-after study measuring patient throughput metrics, physician productivity, and patient satisfaction. The intervention measuring the scribe implementation was divided into pre- and post-implementation periods. Patient throughput metrics were (1) door-to-room time, (2) room-to-doc time, (3) door-to-doc time, (4) doc-to-disposition time, and (5) length of stay for discharged/admitted patients. Our secondary outcome was physician productivity, which was calculated by measuring total patients seen per hour and work relative value units per hour. Additionally, we calculated the time-motion analysis in minutes to measure the emergency department physician’s efficiency by recording the following: (1) chart preparation, (2) chart review, (3) doctor–patient interaction, (4) physical examination, and (5) post-visit documentation. Finally, we measured patient satisfaction as provided by Press Ganey surveys. Data analysis was conducted in 12,721 patient encounters in the pre-scribe cohort, and 13,598 patient encounters in the post-scribe cohort. All the patient throughput metrics were statistically significant (p < 0.0001). The patients per hour increased from 2.3 ± 0.3 pre-scribe to 3.2 ± 0.6 post-scribe cohorts (p < 0.001). Total work relative value units per hour increased from 241(3.1 ± 1.5 per hour) pre-scribe cohort to 336 (5.2 ± 1.4 per hour) post-scribe cohort (p < 0.001). The pre-scribe patient satisfaction was high and remained high in the post-scribe cohort. There was a significant increase in the clinician providing satisfactory feedback from the pre-scribe (3.9 ± 0.3) to the post-scribe (4.7 ± 0.1) cohorts (p < 0.01). We describe a prospective trial of medical scribe use in the emergency department setting to improve patient throughput, physician productivity, and patient satisfaction. We illustrate that scribe use in community emergency department is feasible and results in improvement in all three metrics
Introduction
The practice of emergency medicine (EM) has seen its fair share of growing pains and transitions throughout its advancement and ongoing development. One of the most important and historic transitions came back in 2006 when the Institute of Medicine recognized handwritten reports or notes to be detrimental to the standard of patient care. They identified that manual order entries, poor legibility, and nonstandard abbreviations lead to medical errors and as a result caused harm.1,2 The offered solution was the advent of electronic health records (EHRs) and computerized physician order entry (CPOE) 3 to equip the fast-paced practice of EM with the necessary tools to deliver optimal patient care to its growing and aging patient population while minimizing/eliminating medical errors. However, the implementation of EHRs did not come without its fair share of criticism.4–7 Previous literature illustrates 25–33 percent drop in physician productivity,8,9 decreased patient satisfaction,8,10 and physician concern over an increased amount of time doing computer tasks to go along with other concerns such as poor usability, time-consuming data entry, less time for face-to-face patient care, learning billable coding, and degradation of clinical documentation by trying to force it into structured fields.8,11–13 To address some of these validated concerns, the industry of medical scribes has emerged nationally to reduce data-entry burden for clinicians, improve throughput efficiency, improve quality of patient care, and enhance revenue cycle. Even though community hospitals outnumber academic institutions, 14 most data on how the implementation of medical scribe services impacts EM come from academic institutions.15,16 We conducted a prospective study in a community emergency department (ED) setting to illustrate the impact of medical scribes on patient throughput, physician productivity, and patient satisfaction.
Materials and methods
Study design
We performed an uncontrolled before-and-after study. This study was performed in accordance with national regulations and was deemed exempt from institutional review board approval for human subjects.
Study setting and population
This study was carried out from July 2015 through February 2016 at a suburban non-academic community ED, treating approximately 80,000 visits annually, which included both adults and pediatrics. The ED is an American College of Surgeons Level II Trauma Center. Providers seeing patients include physicians, nurse practitioners, and physician assistants. The study, however, only included data recorded on physicians. Other providers were not included in this study. There were no staff changes during the study period.
Study protocol
We measured the before-and-after metrics of patient throughput in the ED. The intervention measuring the scribe implementation was divided into pre- and post-implementation periods. The pre-implementation period started with baseline data collection for 90 days beginning 1 July 2015 through 30 September 2015. This was followed by a washout period of 2 months during which the scribe program was phased in and fully operational. The post-implementation data collection lasted for 90 days starting from 1 December 2015 to 28 February 2016.
Intervention
A scribe system operating company in the private sector implemented the program and provided ongoing program management. There were no financial arrangements between company and any of the authors. In the medical scribe system model, scribes mostly are college students or recent college graduates interested in medical science careers. They receive on-job training and are considered proficient after 20 shifts and skilled after 40 shifts. Depending on the numbers of physicians in the ED, there are 3–4 scribes available at all times. One assigned to each physician. All scribe charts are forwarded to the physician to review, amend, and sign.
Measures
ED throughput data were collected using quality assurance reports produced by the EHR system. The objective was to measure the effect of scribes on ED patient throughput as quantified by the changes between cohorts such as:
Door-to-room time—time when patient arrives in ED to patient shifted into a room;
Room-to-doc time—time when patient placed in a room to when an ED physician sign-up for the patient;
Door-to-doc time—time patient arrives in ED to when an ED physician sign-up for a patient;
Doc-to-disposition time—time ED physician sign-up for a patient to time the patient is discharged or admitted;
Length of stay (LOS) for admitted/discharged patients in the before-and-after studies.
The metrics of physician productivity was calculated by measuring total patients seen per hour and work relative value units (wRVUs) per hour. The wRVUs is a measure of value used in the US Medicare reimbursement formula for physician services. The wRVUs depended on the level of service for each patient visit and was reviewed by coders who ensured that the documentation justified the level of service. Additionally, we calculated the time-motion analysis in minutes to measure the ED physician’s efficiency by recording the following: (1) chart preparation, (2) chart review, (3) doctor–patient interaction, (4) physical exam, and (5) post-visit documentation (time it took to complete patient chart after examining the patient).
Patients completed a standard patient satisfaction survey in which they were asked to rate their ED visit and their satisfaction with the clinician as follows: (1) doctor carefully listened to your concerns, (2) provided satisfactory feedback to your questions, (3) doctor explained things in a way you can understand, (4) meticulousness of the examination, (5) doctors’ instructions concerning follow-up care, and (6) was the doctor courteous. All patient responses were graded using a five-point Likert-type scale 17 with the following categories: excellent (5), very good (4), good (3), fair (2), and poor (1).
Data analysis
Patient throughput was analyzed using descriptive statistics because the generalizability and increased power afforded using means and the standard t-test to assess for significance outweighed the possible skewness of the data typical of administrative throughput research. However, the productivity measures, and patient satisfaction scores, were calculated and reported as mean ± standard deviation. p-values were calculated using unpaired t-tests. p-values <0.05 were considered significant. All data were derived from our IT data warehouse.
Results
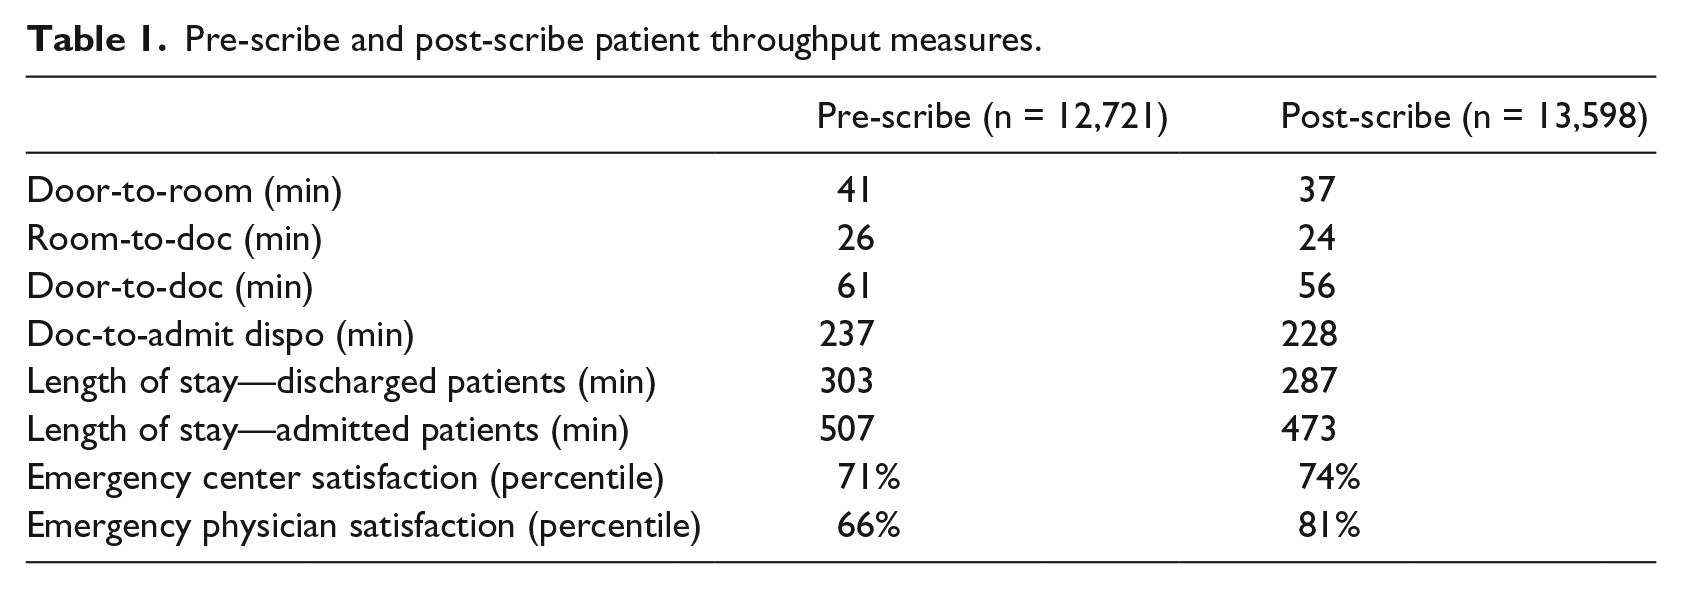
Data analysis was conducted in 12,721 patient encounters in the pre-scribe cohort and 13,598 patient encounters in the post-scribe cohort. Given the large sample size in each cohort, all variations were statistically significant (p < 0.0001). There was a 2-min improvement in the time it took for an ED physician to sign-up for a patient once patient was placed in a room from the pre-scribe to the post-scribe cohort (p < 0.0001). After the scribe program was integrated, all patient throughput metrics improved. This improvement occurred despite additional 877 patient visits in the post-scribe cohort. Subsequently, the overall door-to-doc time improved from 61 min pre-scribe to 56 min post-scribe. Additionally, both door-to-room and doc-to-admit disposition times improved by 4 min (p < 0.0001) and 9 min (p < 0.0001), respectively. ED physician satisfaction increased 15 percent from pre- to post-scribe (Table 1).
Pre-scribe and post-scribe patient throughput measures.
A 24-h patient care was provided in pre- and post-scribe days. Physician productivity metrics are shown in Figure 1. Average direct wRVUs generated per patient in pre-scribe (2.57 ± 0.84) and post-scribe (2.74 ± 0.54) cohort were similar (p = 0.88). The patients per hour increased from 2.3 ± 0.3 pre-scribe to 3.2 ± 0.6 post-scribe cohorts (p < 0.001). Total wRVUs per hour increased from 241 (3.1 ± 1.5 per hour) pre-scribe cohort to 336 (5.2 ± 1.4 per hour) post-scribe cohort (p < 0.001). Table 2 illustrates the mean time spent performing various patient tasks. Figure 2 illustrates this data in a visual timeline. An average visit lasted 25.9 min in the pre-scribe cohort, and post-scribe visits averaged 23.2 min. Mean time required to complete a post-scribe visit (including documentation) was 31 percent shorter in duration than that seen in the pre-scribe cohort. Chart review and post-visit documentation times were all significantly lower (<0.01) in the post-scribe cohort. The time spent in direct patient interaction was twofold greater in the post-scribe cohort.
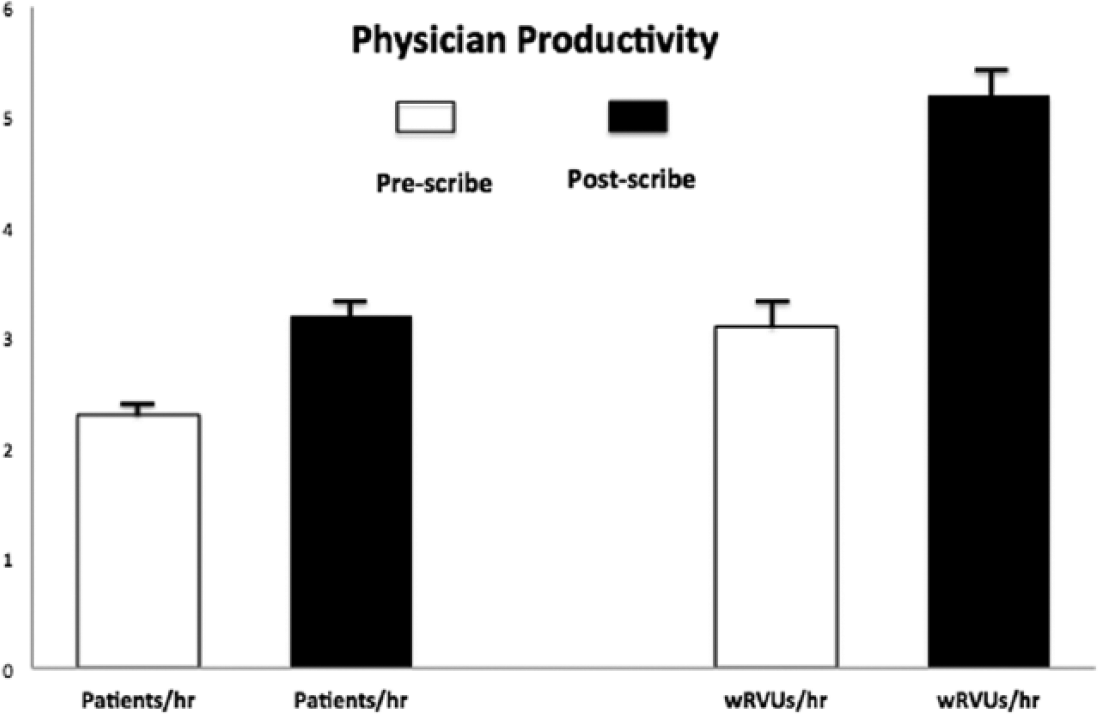
Productivity metrics in total patients seen per hour and total wRVUs generated per hour on pre- and post-scribe cohorts.
Time–motion analysis of physician activities.
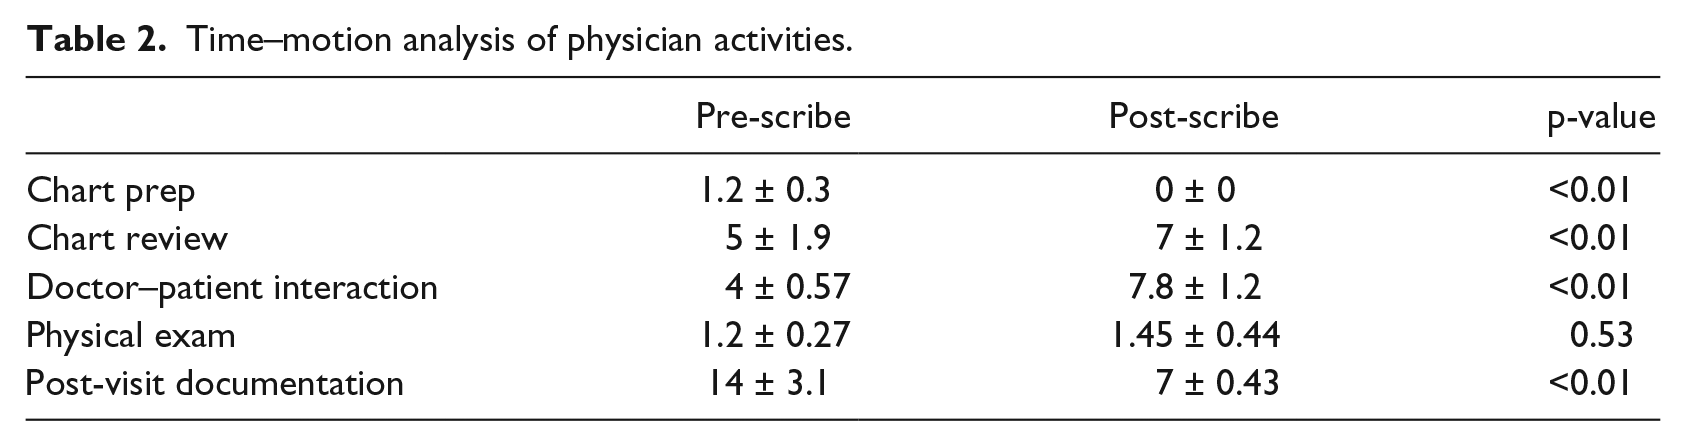
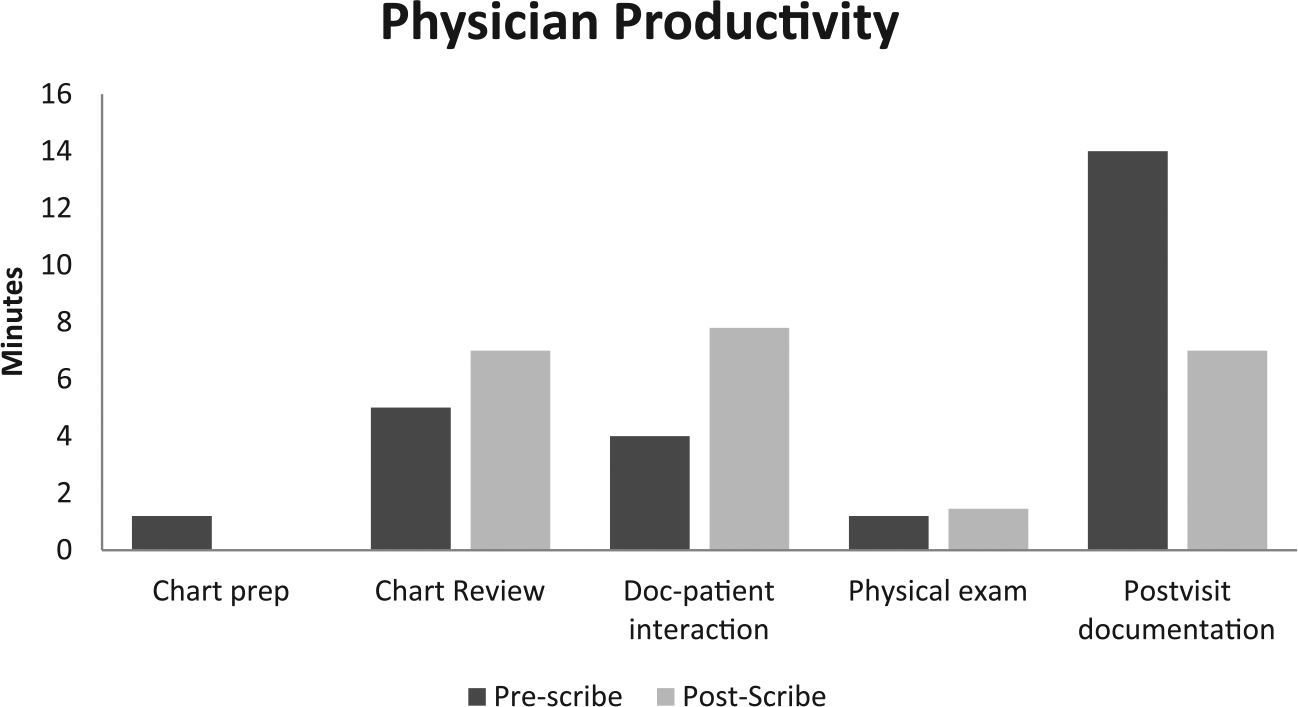
Time–motion analysis in pre- and post-scribe cohorts.
Patient satisfaction data was collected for the six questions and is presented in Figure 3. The pre-scribe patient satisfaction was high and remained high in the post-scribe cohort. There was a significant increase in the clinician providing satisfactory feedback from the pre-scribe (3.9 ± 0.3) to the post-scribe (4.7 ± 0.1) cohort (p < 0.01).
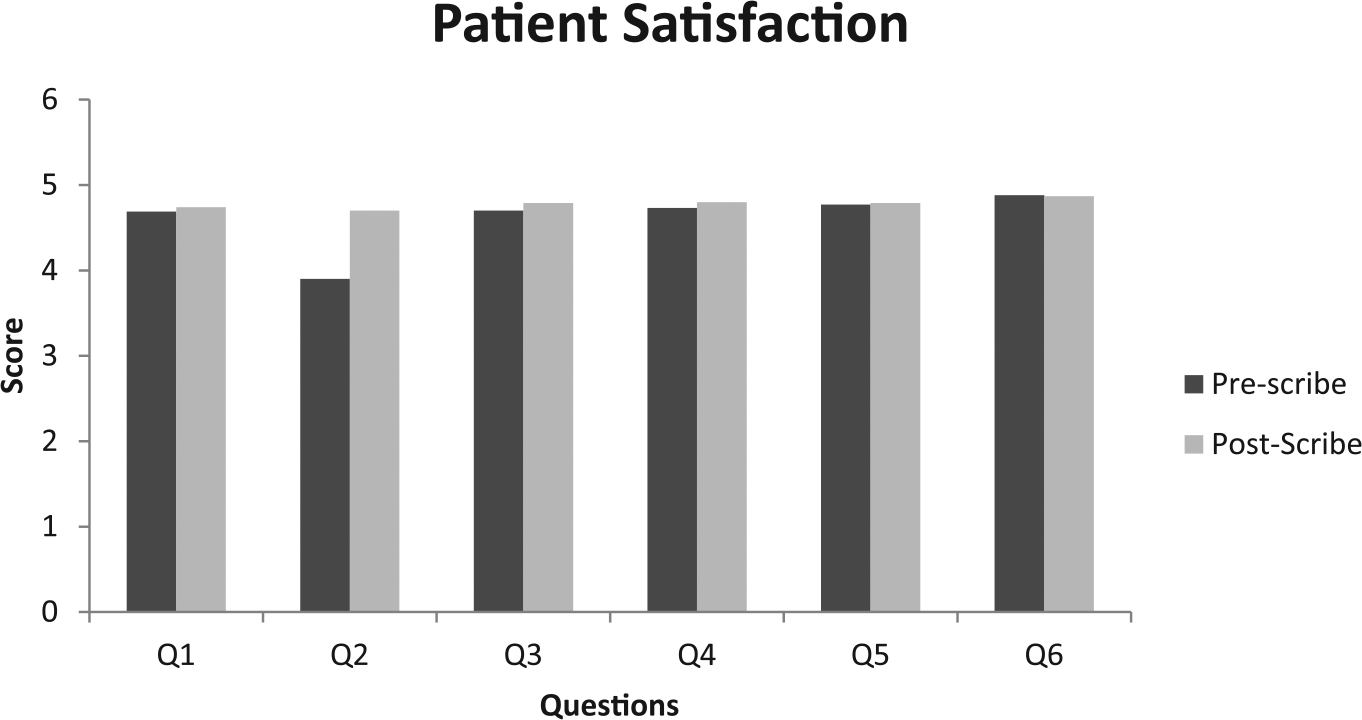
Patient satisfaction metrics as measured by questionnaire in pre- and post-scribe cohorts.
Discussion
The use of medical scribes is gradually becoming prevalent in the contemporary healthcare environment as organizations search methods to improve clinician efficiency and productivity.18–20 Traditionally, scribes assisted with documentation allowed clinicians to focus on billable services. In the current medical era—with the adoption of EHRs—the role of the medical scribe has developed and there is increased awareness about the impact scribes have on patient throughput.19,21,22 Ample literature in various patient settings including the ED illustrates an increase in patient throughput after the implementation of medical scribes into the workflow.14,23–26 In a pilot study with a total of 12,609 patients, Bastani et al. 14 describe that the time it took for patient to be seen and evaluated by a physician is 74 min pre-scribe and 61 min post-scribe, respectively, and the overall LOS significantly improved after the implementation of medical scribes. Our study, which included 13,598 patients, resonates with the findings of Bastani et al. We found that the overall door-to-doc time improved from 61 min pre-scribe to 56 min post-scribe. Additionally, both door-to-room and doc-to-admit disposition times improved by 4 min (p < 0.0001) and 9 min (p < 0.0001), respectively. These are important throughput metrics in a community-based ED where there are no residents to decrease the documentation burden which ultimately falls on the physicians which we suspect is one of the many causes of decreased patient throughput metrics. It is important to mention a counterargument by Heaton et al., 27 who found that scribes failed to improve patient-specific throughput metrics in the first few months post-implementation in a tertiary academic ED with both an adult and pediatric ED. We feel this might be the result of having resident physicians carrying a large documentation workload given the academic settings of the study. Additionally, it would also be prudent to provide a time–motion analysis in between the pediatric and adult population along with patient acuity to understand the difference in the academic and the community setting.
In a retrospective study conducted in an academic setting, Arya et al. 21 concluded that ED physician’s use of a medical scribe correlates with improved productivity as measured by wRVU/hour and patient/hour. Both of the metrics in this cohort were statistically significant (p = 0.0011 and p = 0.0024, respectively). Our results that are based out of a community ED resonate with these findings as the patients per hour increased from pre-scribe to post-scribe cohorts (p < 0.001), and the total wRVUs/hour increased from pre-scribe cohort to post-scribe cohort (p < 0.001). An important mention here is that we try matching ED physicians with medical scribes of their choosing—if schedule permitting—to allow the physician more autonomy which literature shows improves the physician productivity and in return managerial financial bottom-line.28,29 Scribes can also influence the physician’s productivity by checking back with the physician, when lab or imaging results are back or when a patient bed is ready. This allows the physician to maintain a consistent workflow without jumping back and forth between patient charts. In a meta-analysis, Heaton et al. describe a small increase in the number of patients seen per hour when using scribes. While this may be correct, there are two important facts, which must not be overlooked. First, just as physicians take time to familiarize with and obtain optimal benefit from EHRs, the same transitions would apply with scribes. Second, in our cohort, we had a washout period of 2 months during which the scribe program was phased in and became fully operational. This allowed time to make adjustments and work on the logistics of optimal use of the scribe service.
Patient–doctor communication has an important effect on medication adherence, conflict resolution, patient satisfaction, and clinical outcomes. ED physicians have voiced concern over the use of an EHR, which results in fewer psychosocial discussions, less attention to the patient’s agenda, a shift from a conversational to a blocked style of communication. 30 EHRs force ED physicians to spend more time documenting and less time with patients. This lack of interaction greatly affects patients’ perception on the quality of their care and the overall experience. Using the medical scribe services, these issues can be addressed, and allow ED physicians to refocus on patient care. Previous literature states improved patient satisfaction using medical scribe services.14,23,27,31 Our cohort showed that there was a significant increase in the clinician providing satisfactory feedback from the pre-scribe (3.9 ± 0.3) to the post-scribe (4.7 ± 0.1) cohort (p < 0.01). It should be duly noted that patient satisfaction in our cohort was high on both pre- and post-scribe days. Based on verbal and written feedback, vast majority of patients were either neutral or liked the scribe system. Few patients with previous ED visits gave verbal feedback to staff about having the ED physician’s full attention and staying with them longer to address their concern.
Limitations
Our cohort has a few limitations. The pre- and post-scribe design of the cohort limits our capacity to make causal claims regarding the results. This is a common critique of cohorts where randomization is impractical. However, important steps were taken to limit the impact of any unforeseen factors to our results. We did not make any changes in our staffing models in both the pre- and post-scribe cohorts. We also eliminated any experimenter’s bias by collecting the data from our data warehouse and blinding the ED staff to the study. Given the number of patient encounters in this cohort, we believe it has a good generalizability. Further research on tracking the success of the aforementioned metrics in the longer run is important to monitor any incline or decline in the metrics and measure various components which may be playing an important underlying role.
Conclusion
We describe a prospective trial of medical scribe use in the ED setting to improve patient throughput, physician productivity, and patient satisfaction. We illustrate that scribe use in community ED is feasible and results in improvement in all three metrics. Reaching optimal levels in all parameters ultimately helps improve patient care, the staff morale, and the administrative financial bottom-line.
Footnotes
Declaration of conflicting interests
The author(s) declared no potential conflicts of interest with respect to the research, authorship, and/or publication of this article.
Funding
The author(s) received no financial support for the research, authorship, and/or publication of this article.