
Abstract
This paper presents a new study based on a machine learning technique, specifically an artificial neural network, for predicting systolic blood pressure through the correlation of variables (age, BMI, exercise level, alcohol consumption level, smoking status, stress level, and salt intake level). The study was carried out using a database containing a variety of variables/factors. Each database of raw data was split into two parts: one part for training the neural network and the remaining part for testing the performance of the network. Two neural network algorithms, back-propagation and radial basis function, were used to construct and validate the prediction system. According to the experiment, the accuracy of our predictions of systolic blood pressure values exceeded 90%. Our experimental results show that artificial neural networks are suitable for modeling and predicting systolic blood pressure. This new method of predicting systolic blood pressure helps to give an early warning to adults, who may not get regular blood pressure measurements that their blood pressure might be at an unhealthy level. Also, because an isolated measurement of blood pressure is not always very accurate due to daily fluctuations, our predictor can provide the predicted value as another figure for medical staff to refer to.
Keywords
Introduction
Hypertension is a major global public health issue. According to the National Institutes of Health (NIH), around one in three adults in the United States has hypertension. 1 It is a chronic medical condition characterized by persistent high blood pressure (BP) with systolic blood pressure (SBP) and diastolic BP readings of higher than 140 and 90 mmHg, respectively. 2
Health consequences
Untreated high BP or hypertension may damage major organs of the body, including the heart, kidneys, and brain. Recent studies have shown that hypertension is related to many diseases, such as stroke, loss of consciousness, memory loss, heart disease, cardiovascular disease, and damage to eyes and kidneys.3–8 Another study has also shown that people who have consistent high blood pressure in their 20s are more likely to develop atherosclerosis by the time they reach middle age. 9 Most people with high blood pressure or hypertension often have no signs or symptoms, even if their blood pressure readings have already reached an emergent level. Thus, they may notice nothing for years, even as their heart, blood vessels, kidneys, brain, or other body parts are damaged by high blood pressure. The early detection or prediction of consistently high blood pressure to minimize the risk of hypertension and its complications is the first step in hypertension care. However, the fact is that many people, especially young and middle-aged adults, do not undergo regular monitoring of their blood pressure in order to prevent hypertension.
Factors associated with high BP
According to the World Health Organization, 1 high blood pressure is very often associated with health factors such as old age, tobacco use, stress, a lack of physical activity, the harmful use of alcohol, and obesity. The following is a discussion of the factors associated with high blood pressure.
Age
Sparrow et al. 10 used multiple linear regression analyses to show that the SBP of a person aged over 50 years increases more rapidly than that of someone between the ages of 20 and 39 years.
Male/female
According to a survey, 11 the blood pressure of men is usually higher than that of women of the same age. In fact, men are at a higher risk of developing hypertension and cardiovascular disease than premenopausal women of the same age.
Body mass index
Obesity, as indicated by body mass index (BMI), has become a serious public health issue all over the world. Golino et al. 12 carried out a study to predict blood pressure by the machine learning method and concluded that BMI, waist circumference, and waist–hip ratio have a relationship of correlation with heart diseases such as hypertension, shock, and cardiovascular diseases.
Alcohol consumption
According to Criqui et al., 13 alcohol consumption seems to be significantly related to SBP and diastolic blood pressure for both men and women. Hartung et al. 14 obtained a similar result, concluding that both males and females’ blood pressure readings are related to alcohol consumption. They also found that the blood pressure of a regular consumer of medium quantities of alcohol is much lower than that of one who drinks excessive amounts daily, which shows that the relationship between blood pressure and alcohol intake quantity is not a linear one.
Exercise level
Many studies 14 have shown that a person’s blood pressure drops in response to heightened physical activity. A lack of physical activity also increases a person’s risk of becoming overweight, raising the likelihood that the individual will develop hypertension.
Stress level
The American Heart Association (AHA) has pointed out that although stress is not a confirmed risk factor for high blood pressure, many studies on the subject are currently being carried out. In a stressful situation, people’s bodies react by releasing stress hormones into the blood, which raises their blood pressure. 15
Salt intake level
A study by Denton et al. 16 showed that eating too much salt contributes to a significant rise in both SBP and diastolic blood pressure.
Smoke status
Tobacco and exposure to secondhand smoke have a significant effect on blood pressure. Experiments have shown that a person’s blood pressure will temporarily increase a few minutes after that person starts smoking.17,18
Model to predict blood pressure
In this article, a new model for predicting blood pressure is presented. It will allow health service providers to predict a person’s blood pressure based on that person’s health-related information. This prediction model is not meant for patients who are undergoing treatment, as such patients would already be having their blood pressure measured using standard equipment. The model is designed for people who are not getting regular blood pressure measurements. For example, in a telemedicine consultation, the doctor may want to predict whether a person is at risk of high blood pressure. The information on that person, together with this model, would provide a prediction of that person’s blood pressure before an actual measurement is made. In another situation, a person may want to review his or her health status using an online computer program such as an expert system. The expert system would gather all of the relevant data and health-related information on that person under consultation and give predictions on the person’s potential risk of developing various conditions, including high blood pressure. The model in this article would be a valuable tool for such predictions, as it provides a preliminary assessment of a person’s blood pressure.
Some studies19,20 have indicated that there are people who are at risk of developing hypertension, yet do not get their blood pressure checked regularly. Therefore, it is desirable to develop a method that can predict blood pressure using factors relating to a person’s age and lifestyle (BMI, exercise level, alcohol consumption level, smoking status, stress level, and salt intake level). The method discussed in this article is a method for predicting the SBP of a person when given factors associated with blood pressure. It is not intended to replace actual measurements, but simply to provide an early warning of an individual’s risk of developing hypertension and cardiovascular diseases.
Literature review
This article proposes a new model that will allow health personnel or doctors to know the predicted value of an individual’s blood pressure based on that person’s health-related information, obtained through the use of a neural network. Conway et al. 7 proposed a blood plasma model to evaluate the relationship between the magnesium ions present in a person’s blood plasma and that person’s SBP using an artificial neural network (ANN). Their result showed that the neural network can uncover the complexity of the relationship between the input variables and help the researcher to understand the role of magnesium in SBP and glucose. However, the objective of their study was to determine the relationship between the magnesium ions in blood plasma and SBP, which differs from the aim in our article.
Golino et al. 12 carried out a study to predict a person’s blood pressure using a classification tree, which is a machine learning technique. The variables used for the prediction were physical conditions, such as BMI, waist and hip circumference, and waist-to-hip ratio. The machine learning technique that they used differs from the technique used in this article, which is the ANN. Also, they only used the physical condition of a person to predict that person’s blood pressure, whereas we also apply some health-related information of a person (e.g. age, stress, and exercise levels) in the prediction.
Kupusinac et al. 21 presented a study using an ANN to estimate a person’s cardio-metabolic risk (CMR), with the aim of achieving early prevention of atherosclerosis and cardiovascular diseases. No prediction of blood pressure was carried out. They used gender, age, waist-to-height ratio, BMI, and blood pressure as the primary risk factors and high-density lipoprotein (HDL)-, low-density lipoprotein (LDL)-, and total cholesterol levels; triglycerides; glycemia; fibrinogen; and uric acid as the secondary risk factors. The output CMR-coefficient is a relative measure of CMR in the interval [0, 1]. They obtained a result by estimating CMR with a best accuracy of 82.76 percent after analyzing different parameters of the ANN. In their experiment, they tested the trained ANN using a training dataset and an unknown dataset. However, the goal of their research was to estimate a value that would indicate a person’s risk of developing cardio-metabolic disease, which is different from the objective in this article of predicting the SBP.
A review of the impact of telemonitoring blood pressure on hypertension outcomes was given in AbuDagga et al. 19 Directly measuring BP at home or in the office is crucial for controlling and managing BP. For patients with diabetes, monitoring blood pressure and blood glucose at home is mandatory for self-managing the disease. 20 As discussed in Koopman et al., 20 this may appear to be a simple process in daily life, but in practice there could be all kinds of obstacles and complications involved in uploading the readings from the measurement device. However, this article focuses on the indirect gathering of information on BP by predictions based on other physical attributes of the patient.
A thorough review indicated that no studies have been carried out based on the same idea as that in our model. Hence, the concept presented in this article is a new one in the field of telemedicine. As a tool for predicting blood pressure, it can be used as a component of an expert system related to medical consultations.
Clinical relevance
It must be noted that a person’s normal blood pressure range should correspond to that person’s age group. 10 It is well known that blood pressure has a daily pattern that can vary across several BP readings within a day. Blood pressure is usually lower when a person is asleep, rising during the day and reaching a peak in mid-afternoon. Blood pressure values then begin to drop again and during sleep can be 20 percent lower than during the day.
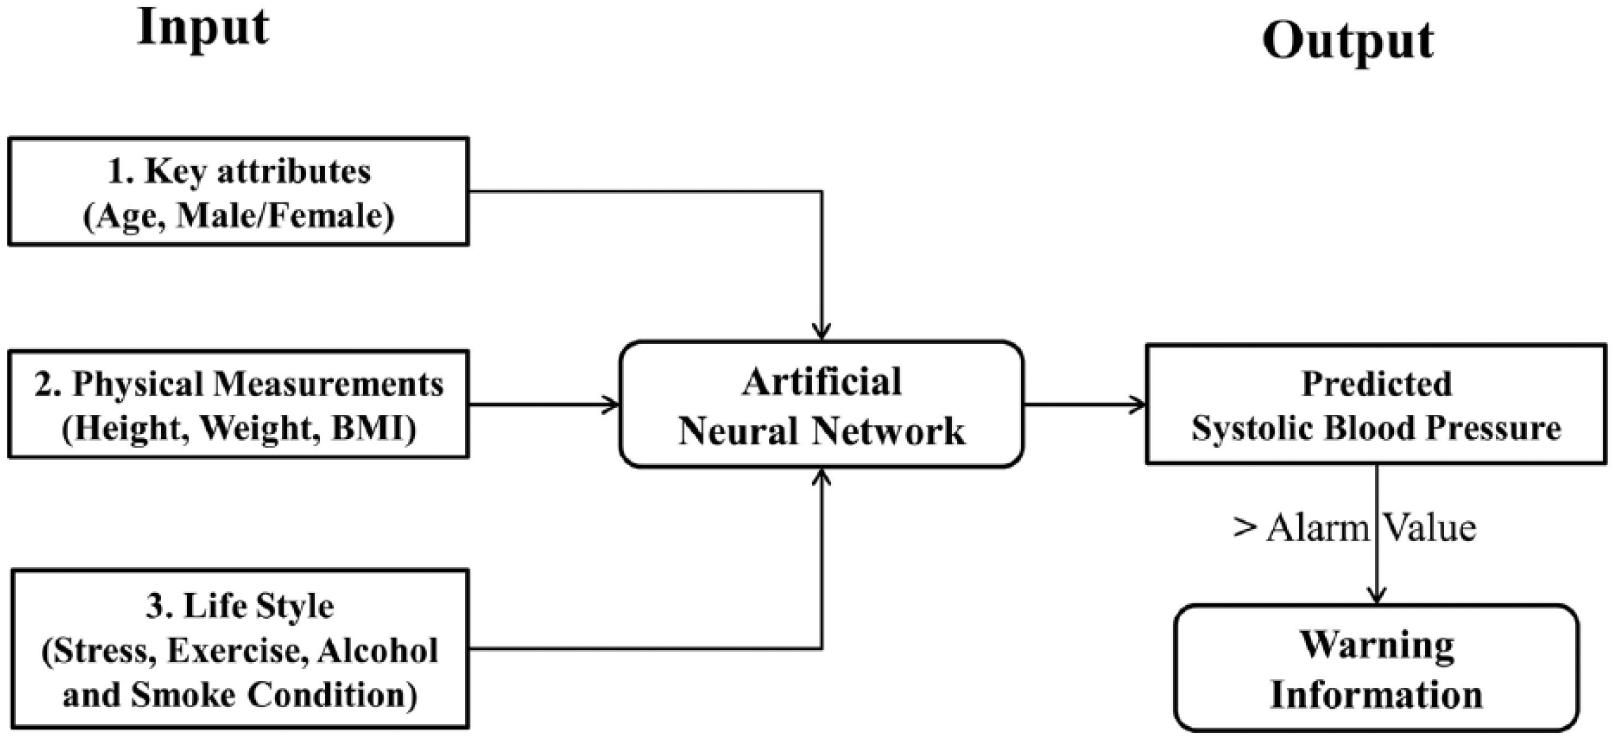
The clinical relevance of the method developed in this article is explained as follows. Suppose the blood pressure of a person is not available or the person is at a remote location. Figure 1 shows an ANN that can be used to predict the SBP of a person based on a database used in this study. In this example, the person has to input some values related to age, gender, height, weight, stress, and exercise levels. The neural network will give a prediction of that person’s SBP. Assuming that the predicted value is larger than the hypertension alarm value, the user should be given a warning. For example, if the predicted value is 150 mmHg, which is more than the SBP of 142 mmHg for a person aged 52 years, the user should receive an alert.
Predicting without measuring.
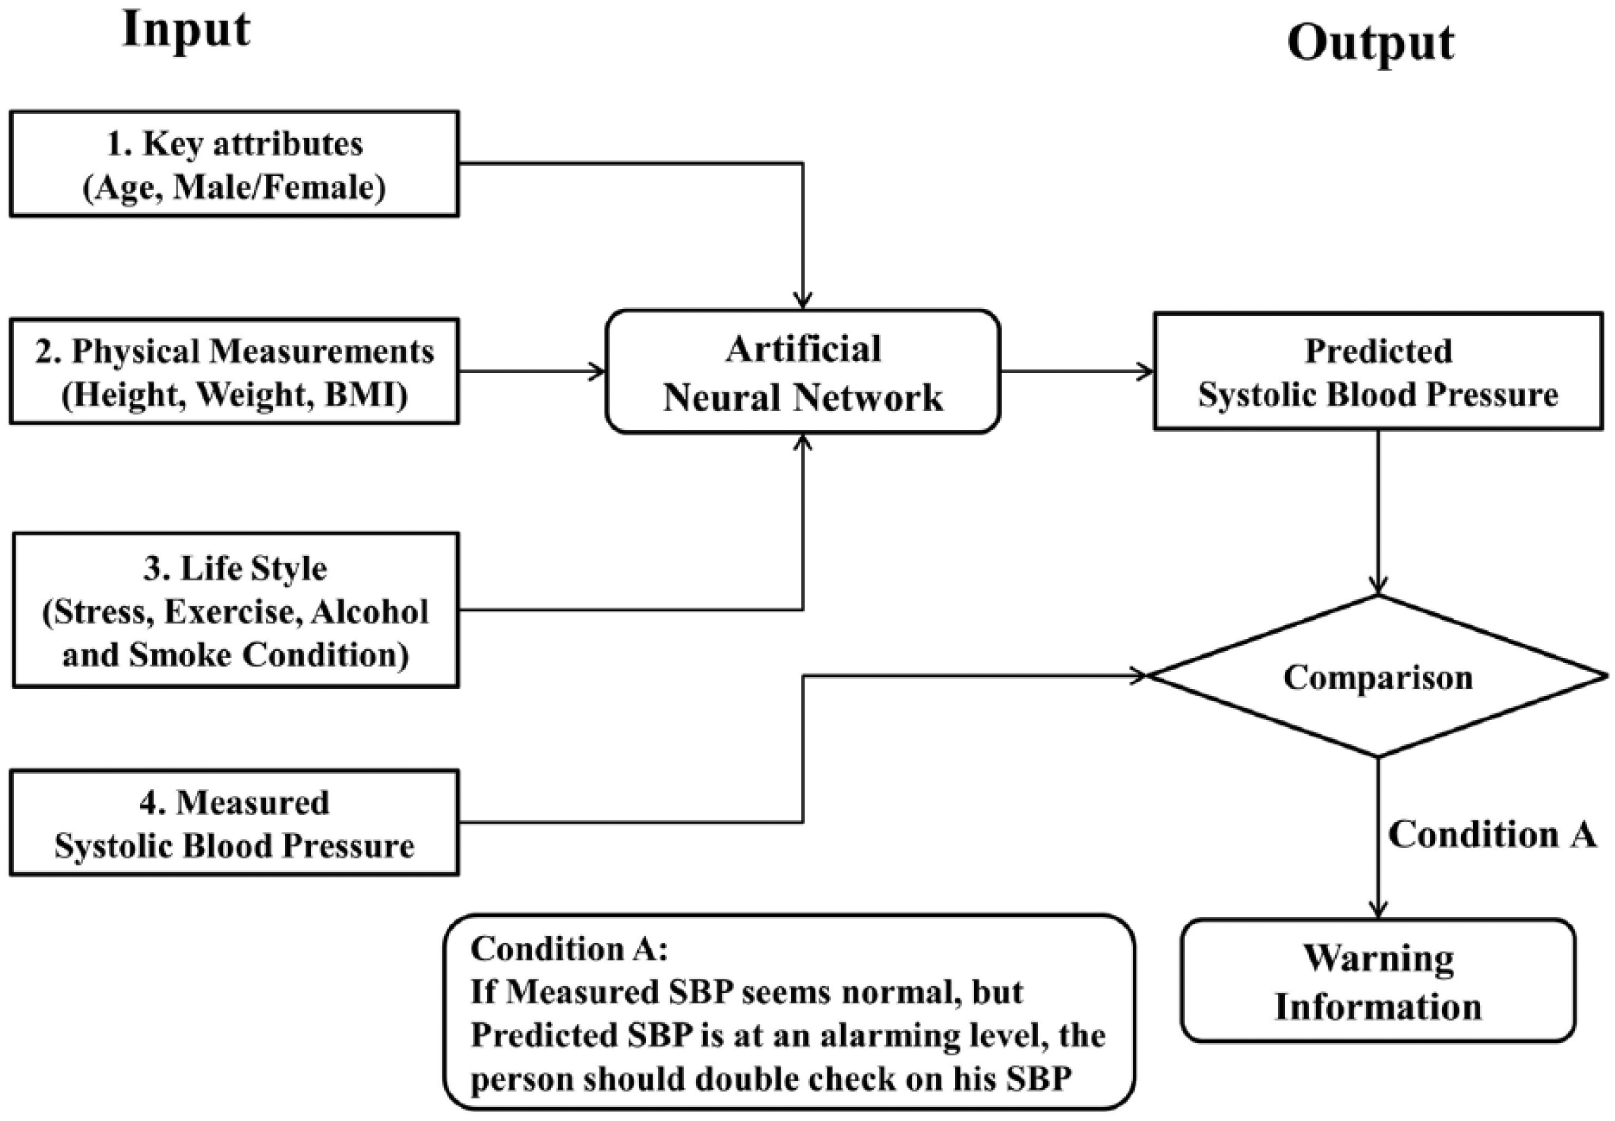
Another scenario on the usefulness of the blood pressure predictor is as follows. A person provides all of the relevant information for the neural-network-based blood pressure predictor, and his blood pressure measurement is also taken (Figure 2). Suppose that the measured value seems normal, but the predicted value is alarming. A recommendation would then be given to the person to double-check his blood pressure. For example, if the measured value was 138 mmHg for a person aged 52 years but the predictor gives a value of 150 mmHg, the relatively low value of his SBP measurement could be inaccurate. In such a situation, the person is advised to have further measurements of his blood pressure taken.
Predicting with measurement.
In this article, the machine learning method of an ANN is used to determine the relationship between the correlated variables (age, gender, BMI, stress level, exercise level, alcohol consumption level, smoking status, and salt intake level) and the SBP value. A trained neural network would then be used to predict the SBP when the input variables are provided.
Materials and methods
ANN
The ANN is based on an intelligent computational model and uses a computer network system to simulate the biological neural network. It consists of an input layer of source information, at least one middle or hidden layer of computational neurons and an output layer of computational neurons.22–24 The ANN has the ability to discover the existence of a nonlinear relationship between its inputs and outputs. It has played a major role in many scientific and industrial applications, such as time series prediction, pattern recognition, decision making, load forecasting, and event prediction.19,25–29 In this article, we aim to use neural networks to determine the correlation between the input variables and the output, which is SBP. Essentially, we would like to use an ANN as a tool to predict the value of a person’s blood pressure, given some health-related measurements and personal data.
For example, Figure 3 shows ANN structures using different databases in this study. Based on the database, an ANN structure with seven inputs (age, BMI, stress level, exercise level, alcohol consumption level, smoking status, and salt intake level) and four hidden nodes is shown in Figure 3. The common objective of this structure is to predict SBP based on the different input variables.
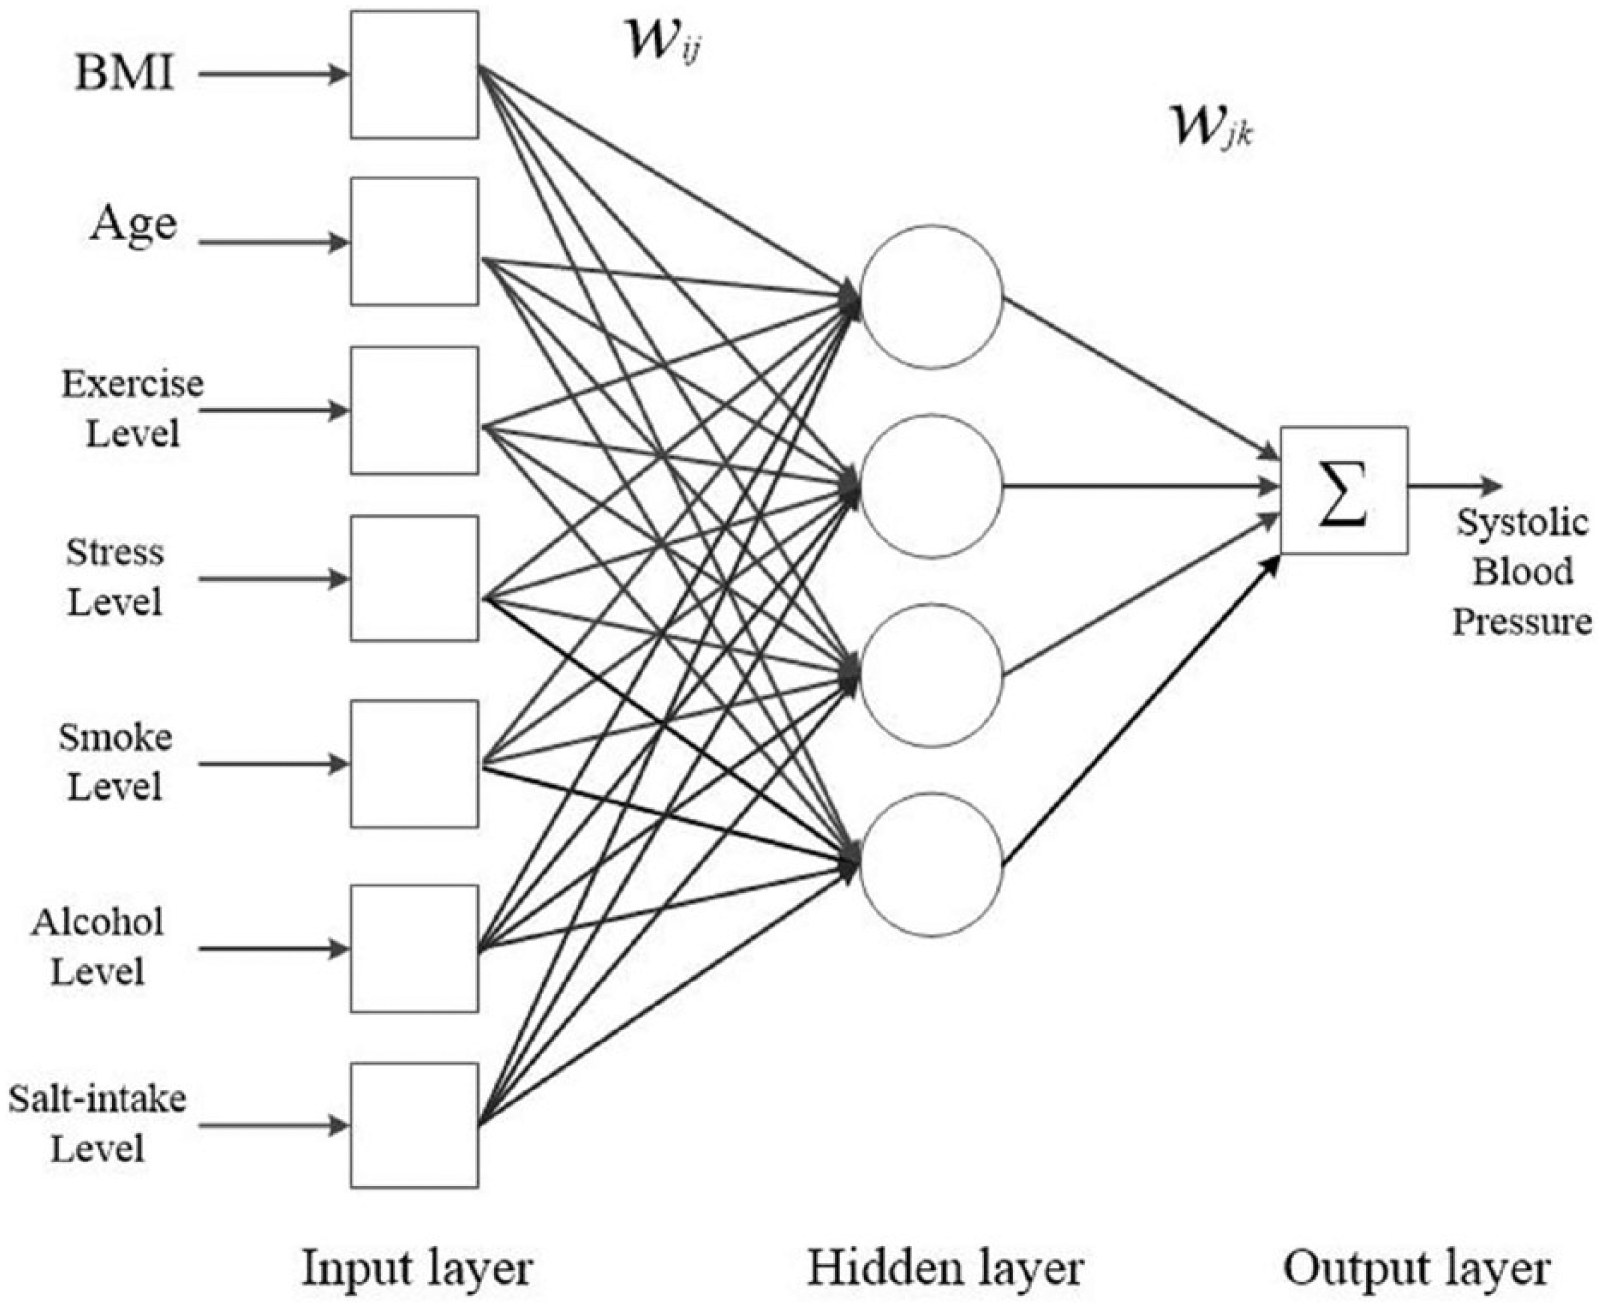
Structure of an artificial neural network.
The strength of a neural network is its learning capability. A problem can be solved by first training the neural network using some training examples or instances of input–output pairs. Two well-known algorithms for the training of neural networks are the Back Propagation algorithm and the radial basis function (RBF) network. The interconnection weights between the different layers in an ANN will be obtained at the end of the training session.
Back-propagation neural network
The Back Propagation neural network is a typical architecture of a multi-layered feed-forward neural network.22,23,30–32 A typical Back Propagation neural network usually consists of layers of neurons, and the objective is to train the network weights so as to minimize the mean-square error of the network output. Figure 3 shows the architecture of a typical Back Propagation neural network with seven inputs, one hidden layer with four hidden nodes, and one output value.
RBF neural network
Our RBF neural network is composed of one hidden layer.33,34 In an RBF network, the hidden layer can implement better nonlinear mapping from the data space to the feature space. The most common basis function chosen is a Gaussian function, which means that the closer the input is to the center of the Gaussian function, the larger will be the response of the node. In stage 1 of the training of the RBF network, the self-organizing feature map (SOFM) was used as a clustering algorithm to determine the weights between the input and the hidden layer. At each hidden node, the basis function used was a Gaussian function. In the second stage, the weights between the hidden and output layer were determined by a least-mean-square (LMS) algorithm.
Statistics
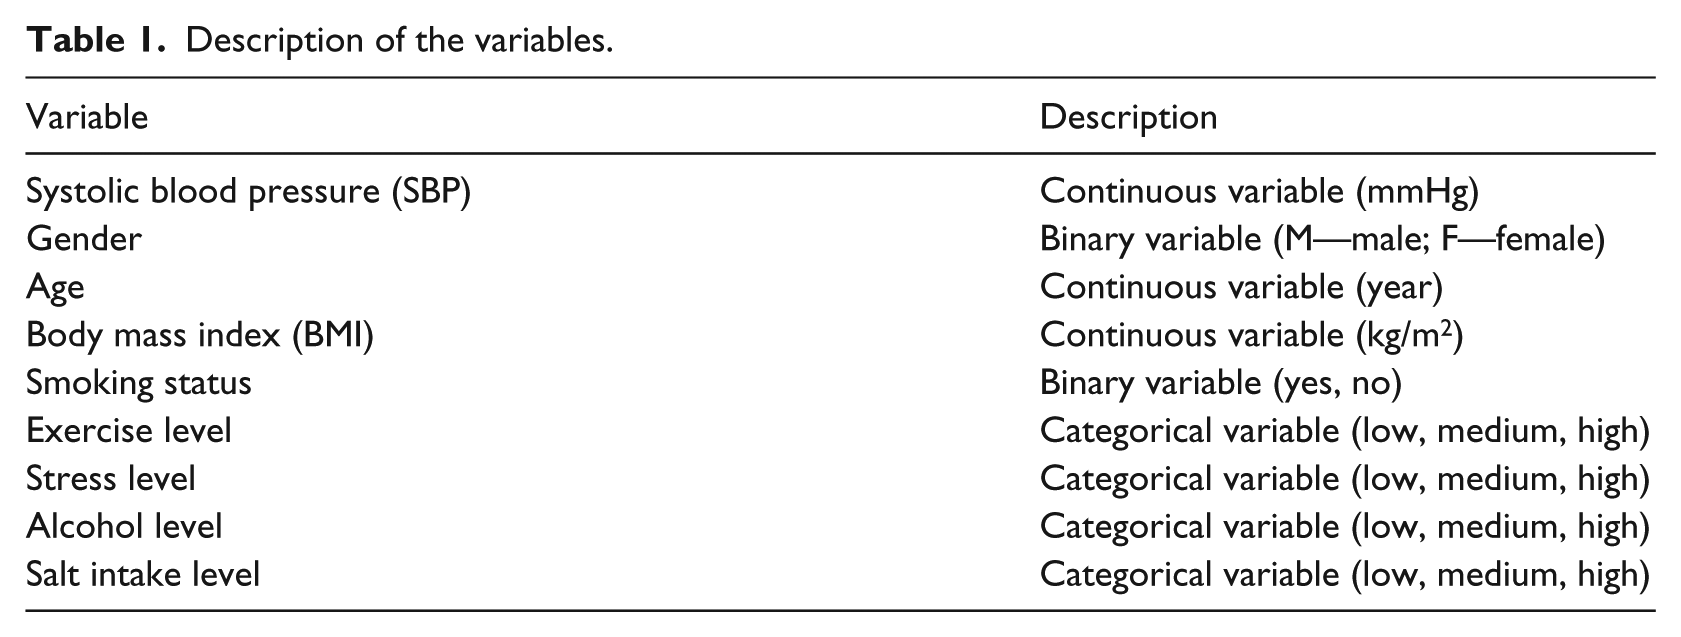
The data were collected from the health and body conditions of 498 people and included SBP, gender, age, BMI, smoking status, exercise level, alcohol consumption level, stress level, and salt intake level. 35 These variables are believed to be correlated with a person’s blood pressure reading. The descriptions of the variables are shown in Table 1. Among the 498 cases, 236 were male, accounting for 47 percent of the data, while the remaining 262 cases were female. Due to the obvious influence of gender difference, the author split the data into male and female sets, respectively.
Description of the variables.
Results
The experiments were carried out by two different algorithms of ANNs: Back Propagation and RBF. The Back Propagation algorithm was first used for the training of an ANN. The output was the predicted value of the SBP. The inputs were the factors used for the prediction (age, gender, BMI, stress level, exercise level, alcohol consumption level, smoking status, salt intake level), and the number of hidden nodes varied from 1 to 10.
The RBF algorithm was also used for the training of an ANN, which mapped the relationships between SBP and the input variables belonging to different clusters. The number of naturally formed clusters was determined, and these then provided the weights between the input and hidden layers. The maximum number of clusters varied from 1 to 10. In the second stage, the weights were determined by an iterative LMS algorithm.
The flowchart of the algorithm is shown in Figure 4. The experiment was carried out and repeated 50 times for each problem instance, and the average value of the results was presented. To evaluate the ANN with different hidden nodes/clusters, the algorithm varied the number of nodes/clusters from 1 to 10.
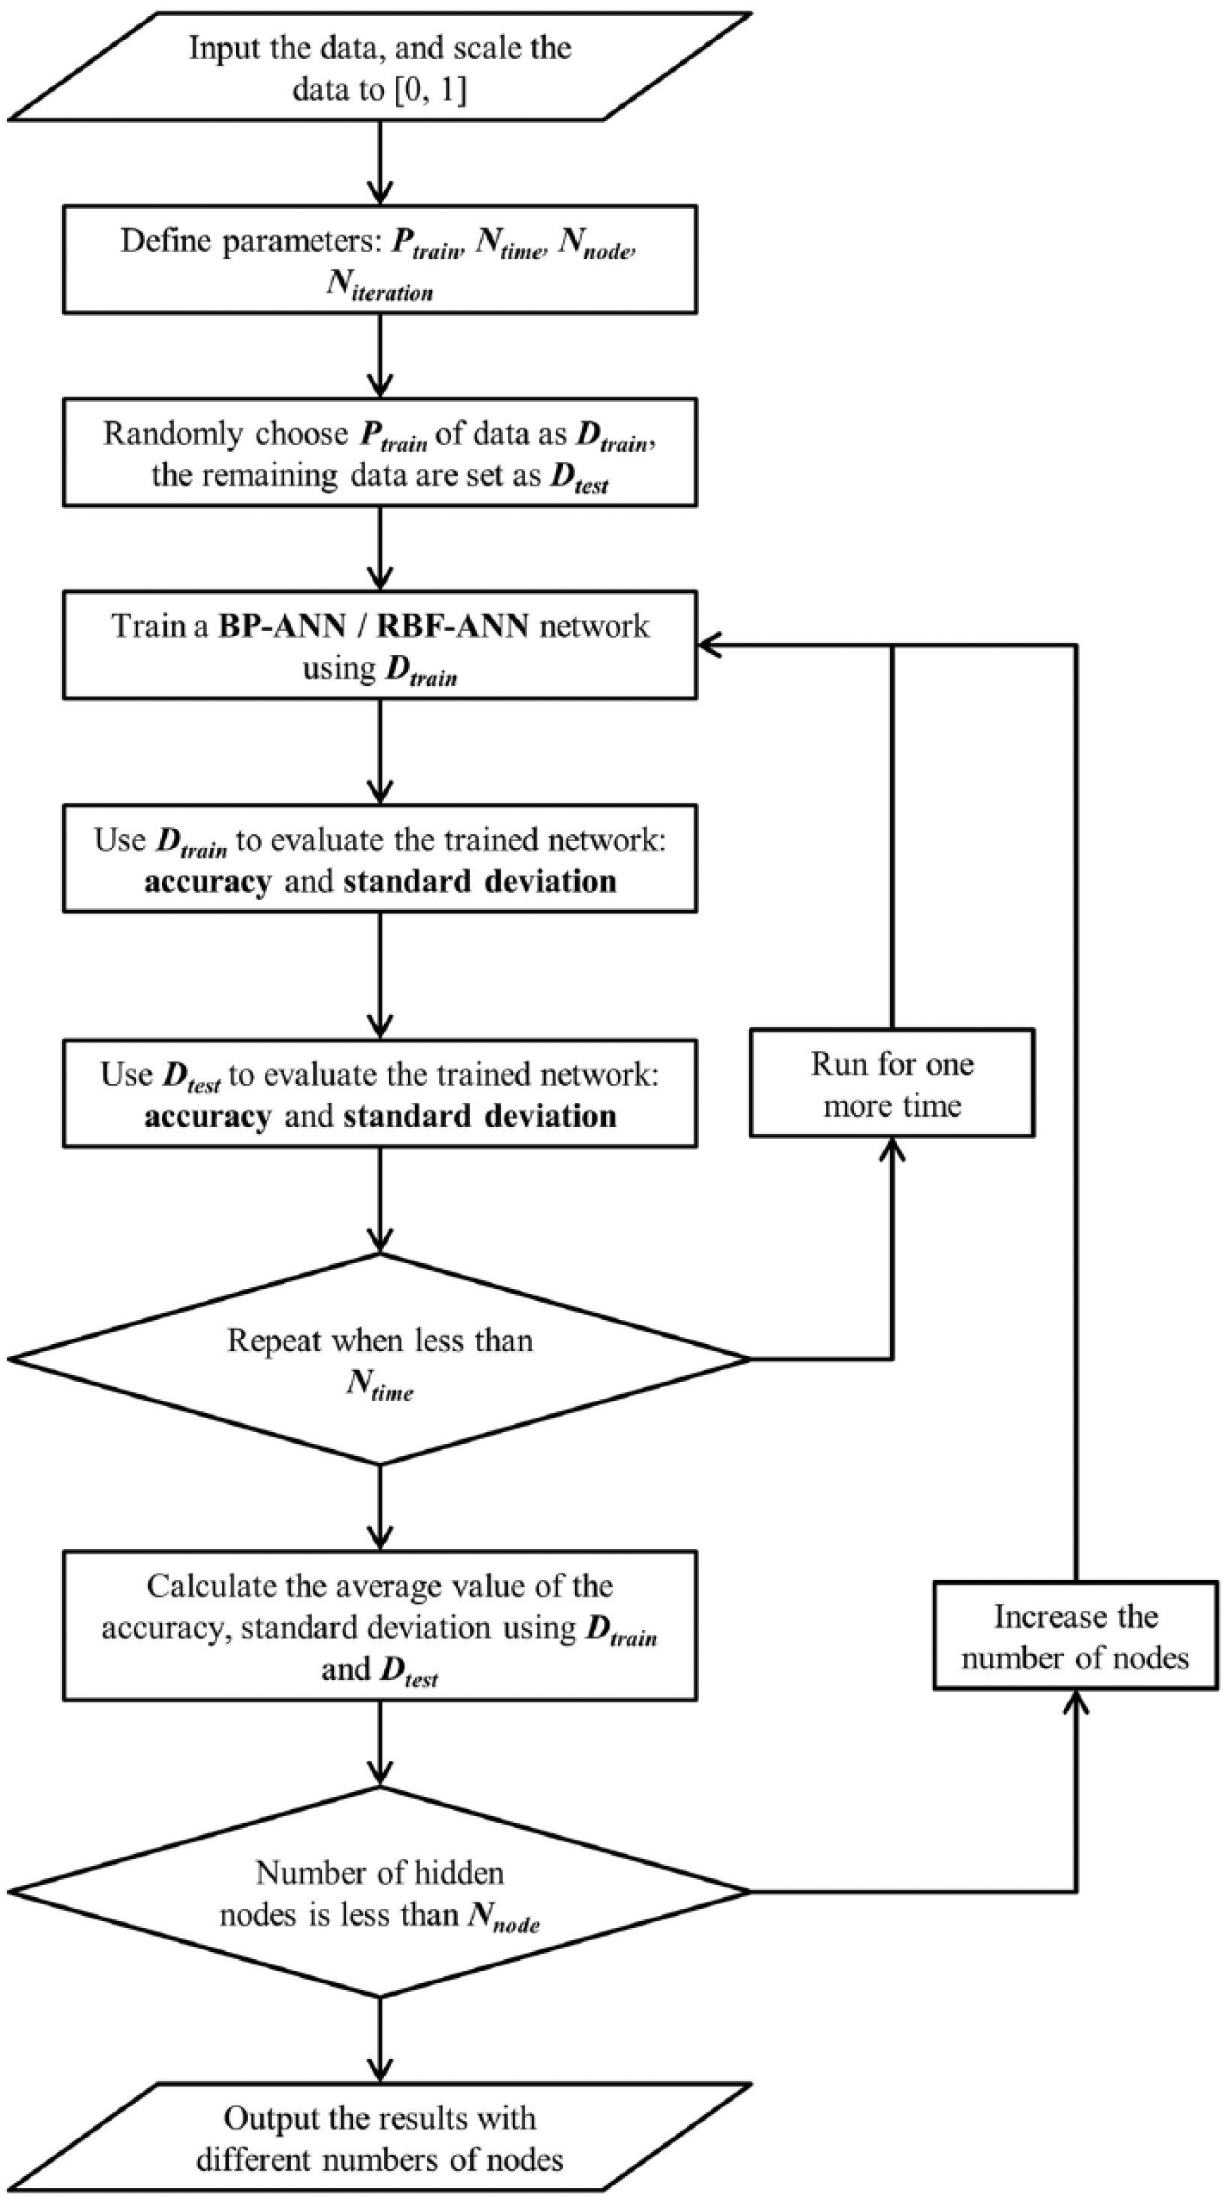
Flowchart of the ANN algorithm.
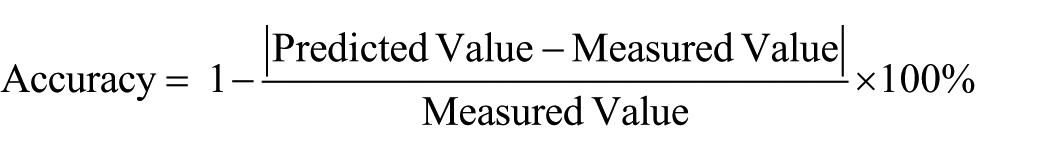
It is very important to emphasize that the testing data were kept separate from the training data. A certain percentage (60%, 70%, 80%, or 90%) of the data from the database was used for training, and the rest was used for testing the performance of the trained neural network. The predicted SBP value from the neural network was compared with the value in the database. The average accuracy, defined below, was recorded, and the standard deviation was also obtained
The blood pressure prediction model was coded in MATLAB R2014b and run on an Intel Core 2 Quad 2.83 GHz PC with 8 GB of RAM. The computation times of the experiments are presented in the following parts.
Back-propagation ANN
In our experiment, we have already investigated the parameters relating to the performance of the neural network, such as different hidden neurons of ANN and different proportions for training and testing. The experiment was repeated 50 times, and the average of the results on accuracy and standard deviation was obtained. The trained neural network was tested by two sets of data: the first set was the data used to train the ANN, and the second set was the data reserved for testing. The experiment was carried out using the MATLAB neural network toolbox. The algorithm of the toolbox was set to trainlm, and the learning rate of toolbox was defined as 0.3. One hidden layer of neurons was used initially in the Back Propagation algorithm, and an architecture of two hidden layers was also examined later. We examined the issue of the maximum number of iterations in the training of the Back Propagation network. We found that the training settled down within 200 iterations. Two typical performance graphs are shown in Figure 5. In our experiment, we allowed the maximum number of iterations to reach 200.
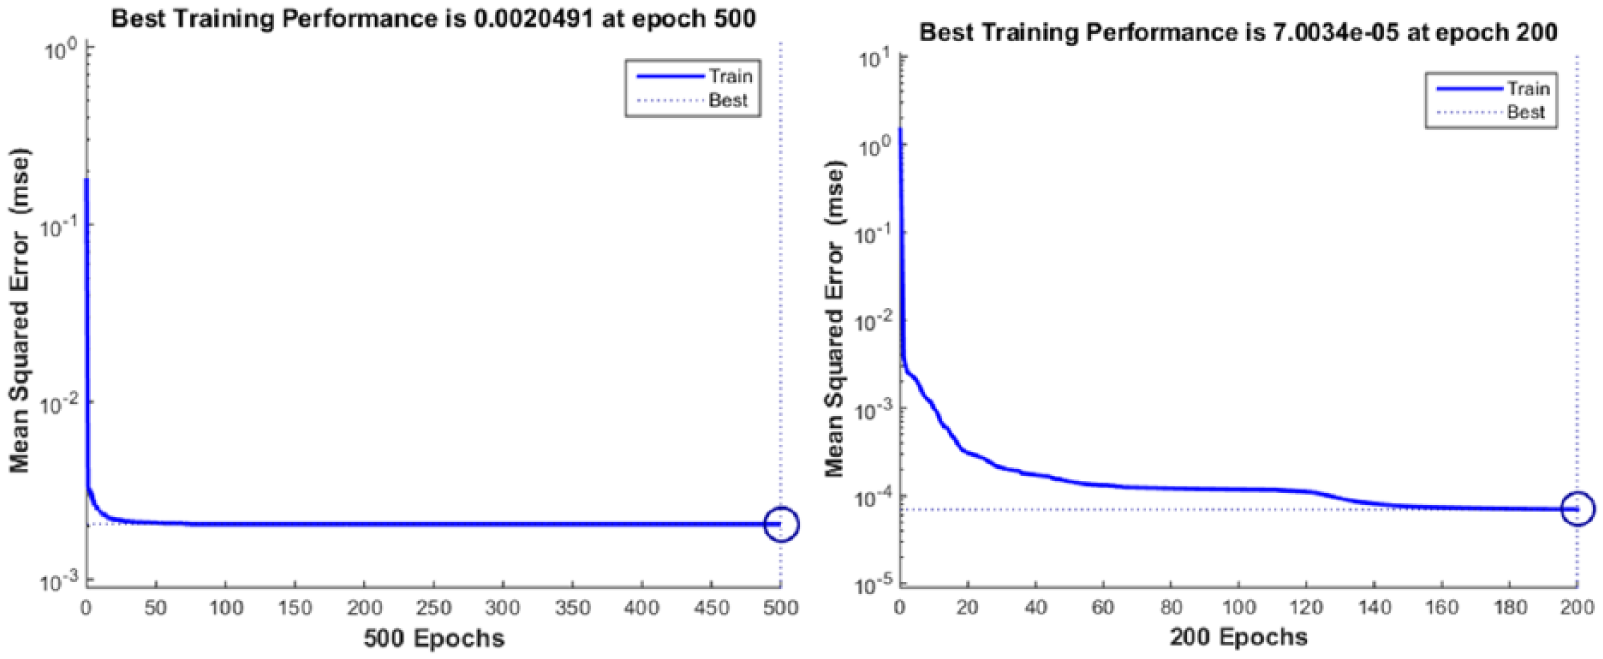
Two performance graphs of convergence obtained by Back Propagation ANN.
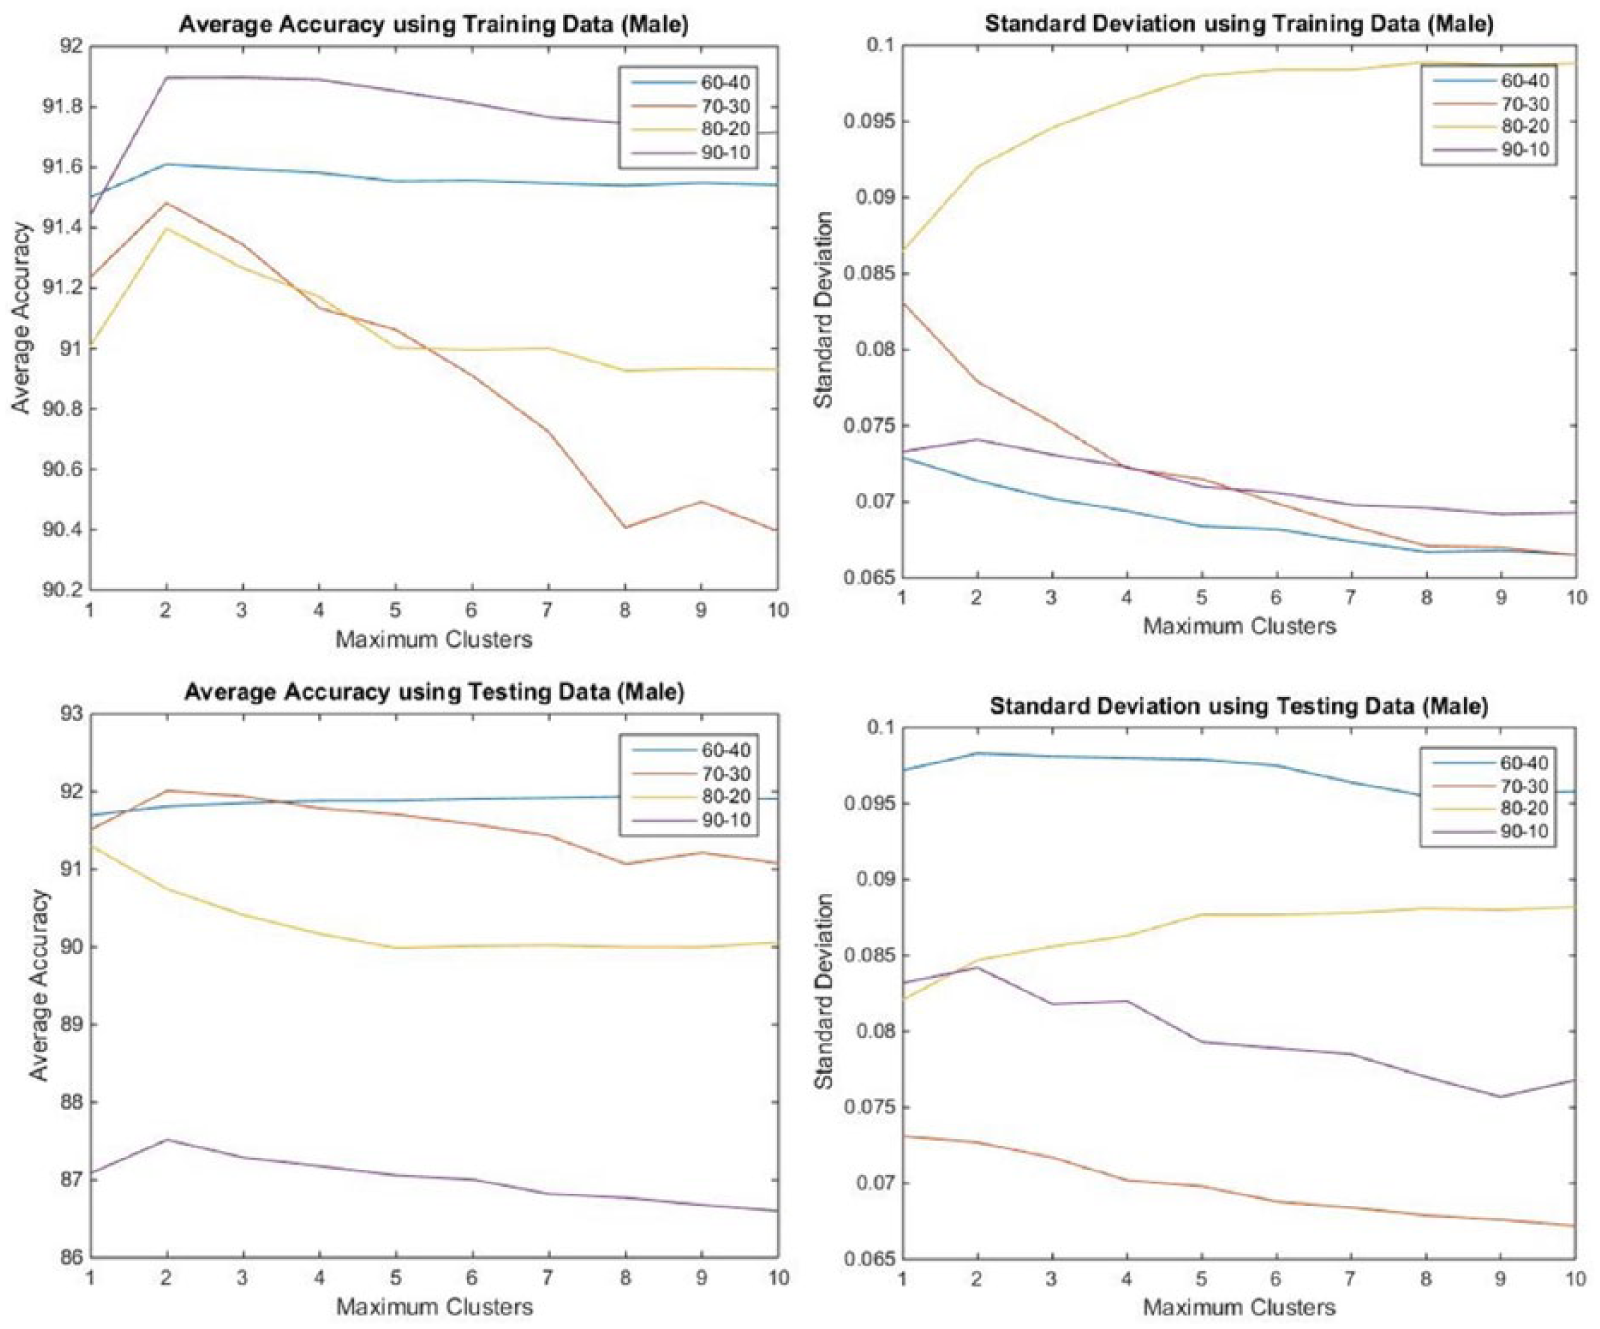
Results based on males
The ANN used one hidden layer at the beginning of this experiment. Different percentages of the database were used for the training of the Back Propagation ANN. As shown in Figure 6, lines of different color stand for different proportions (60–40, 70–30, 80–20, and 90–10) of training and testing from the dataset. Based on the testing data, it is obvious that the best result was obtained when 80 percent was used for training and the remaining 20 percent for testing the performance of the ANN. As the number of hidden nodes increased (from 1 to 10), the performance achieved using the training data kept improving, while the results based on the testing data got worse. This is because when the number of hidden nodes increased, the neural network had a greater degree of freedom to learn the relationship between the inputs and the output based on the training data. Hence, the accuracies based on the training data improved as the number of hidden nodes increased. On the other hand, the use of more hidden nodes decreased the generalization capability of the neural network. When the unseen testing data was presented to the neural network, the prediction accuracies appeared to decrease as the number of hidden nodes increased. Taking the two graphs on accuracy into consideration, we found that using four hidden nodes gives the best overall result when their averages are calculated.
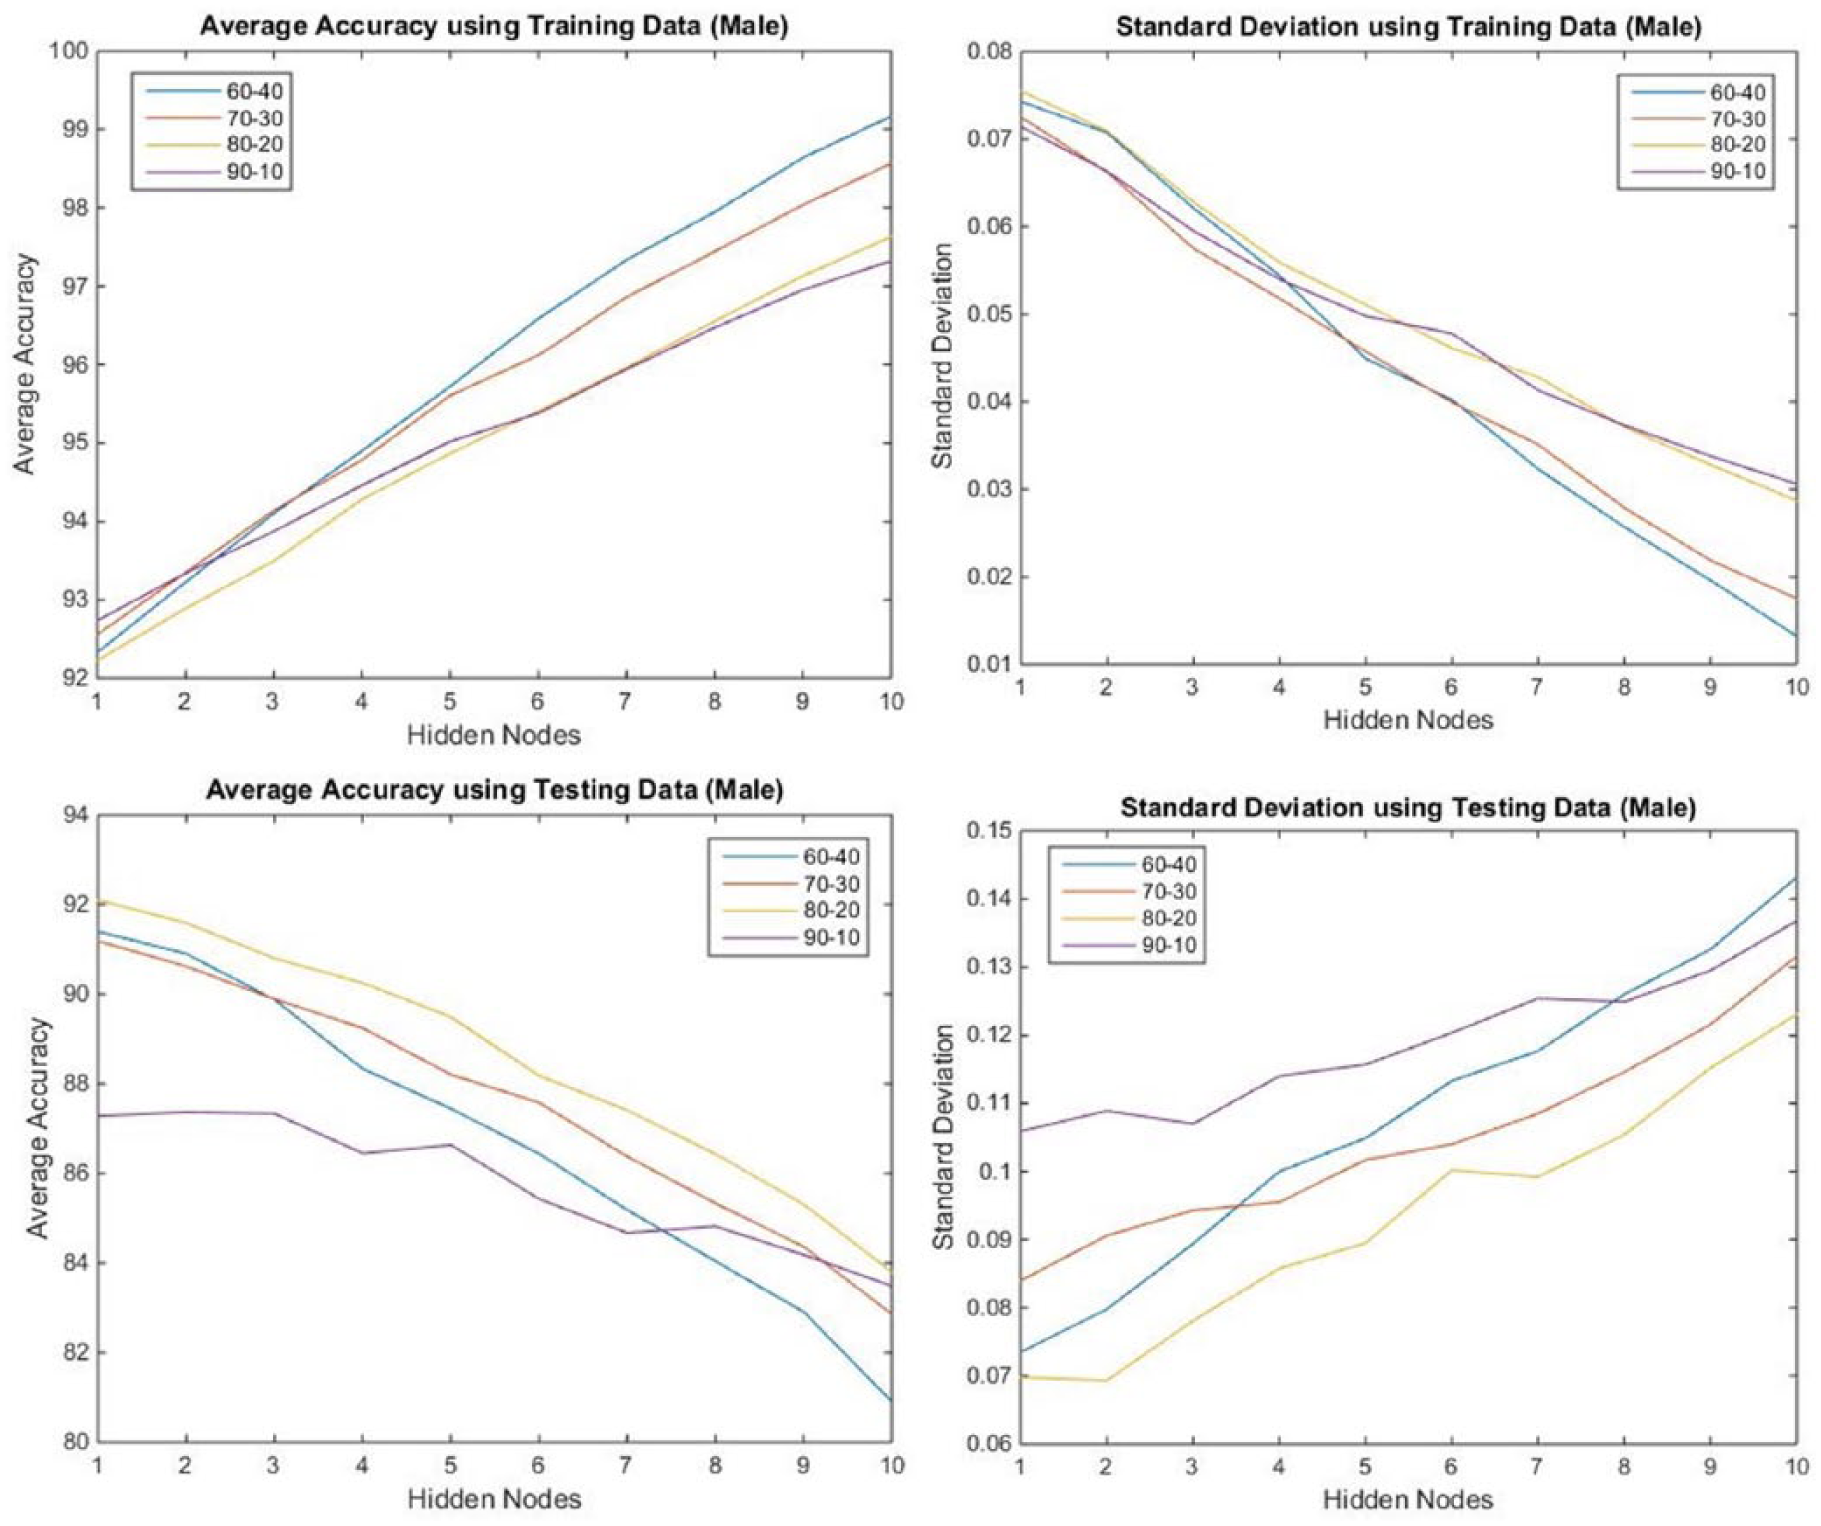
Performance of trained Back Propagation ANN using the male data (one hidden layer).
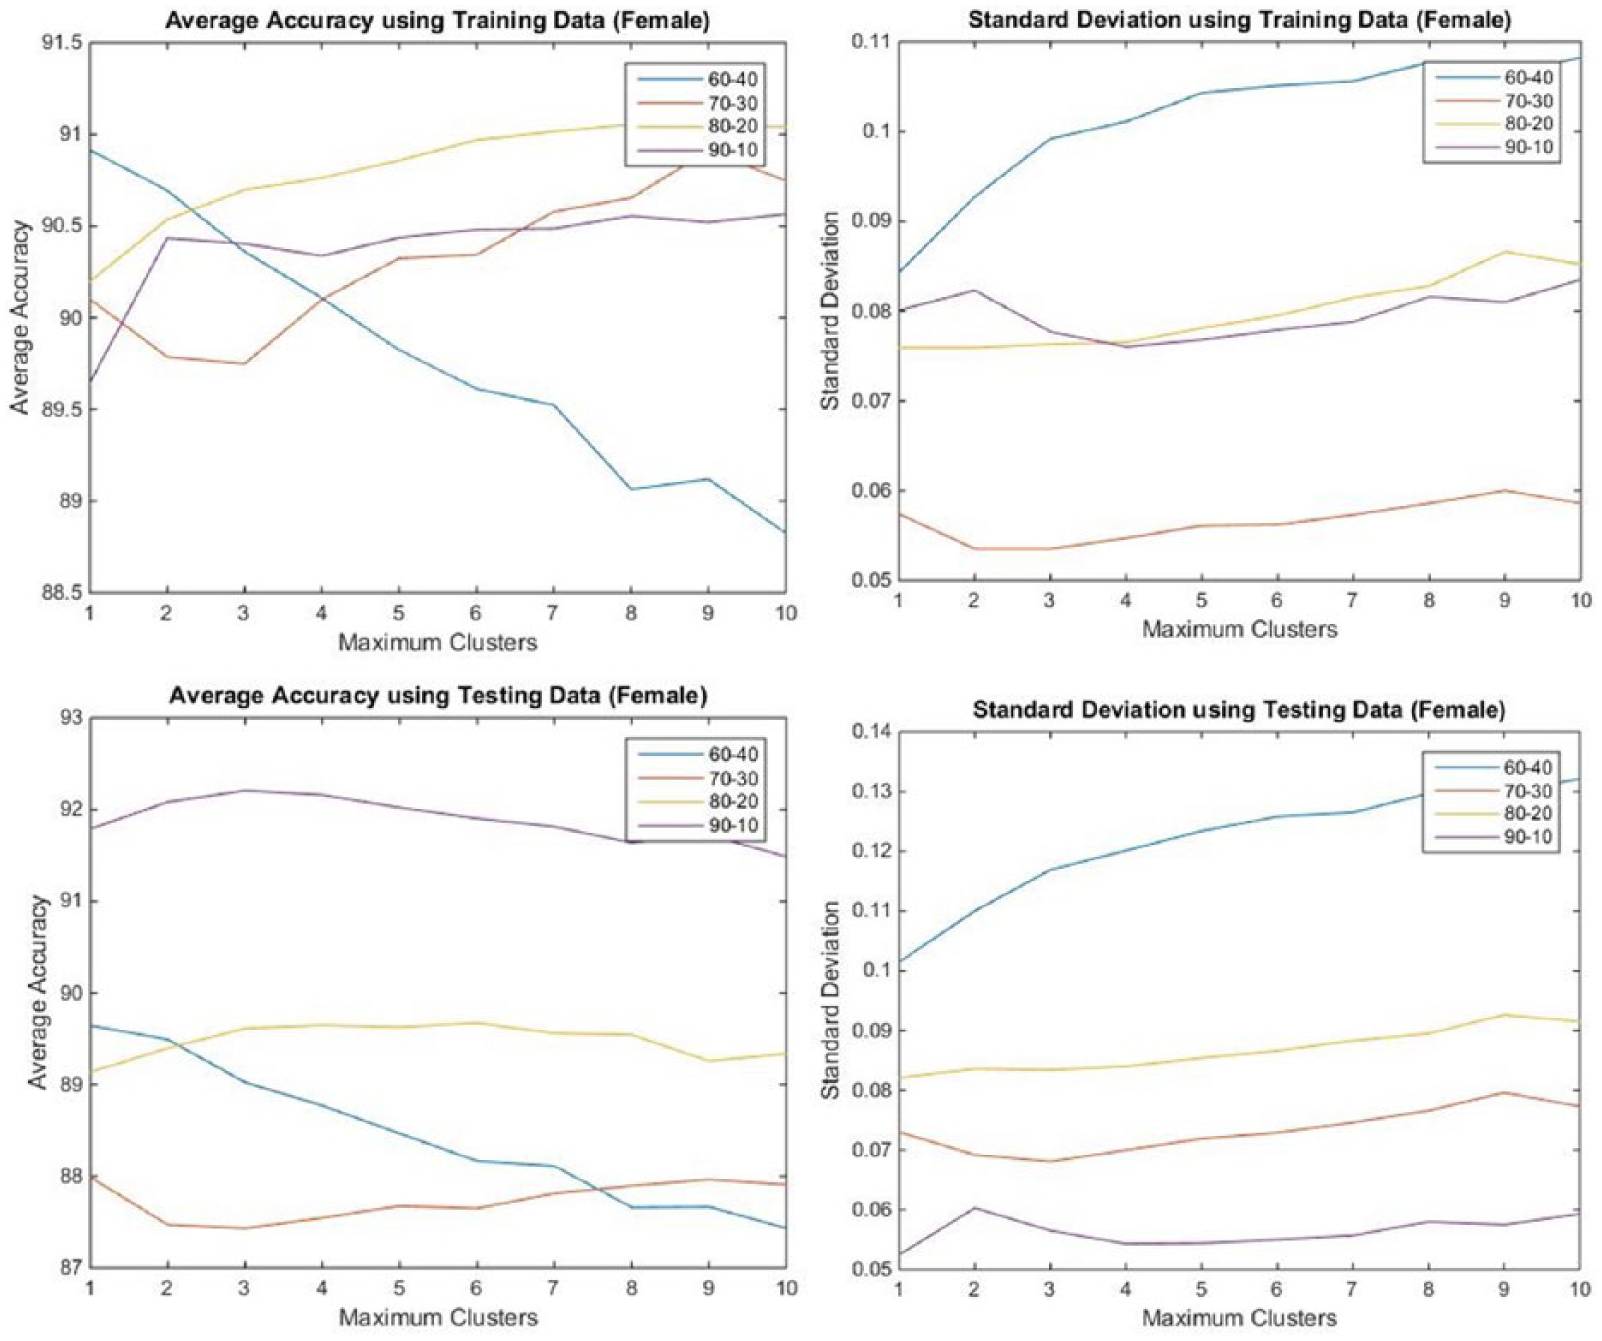
Results based on females
A similar experiment was carried out for the female cases in the dataset. Referring to the different proportions on the use of data (Figure 7), and on the accuracy of predictions using the testing data, the use of 80 percent data for training gave the “best” result. Again, it seemed that more hidden nodes would give better results when using the training data, which means that the ANN had already learned the corresponding relationship of the training data well. However, the trained ANN with more hidden nodes did not perform well when using the testing data. Taking the average of the two results into consideration, the use of four hidden nodes gave the best result.
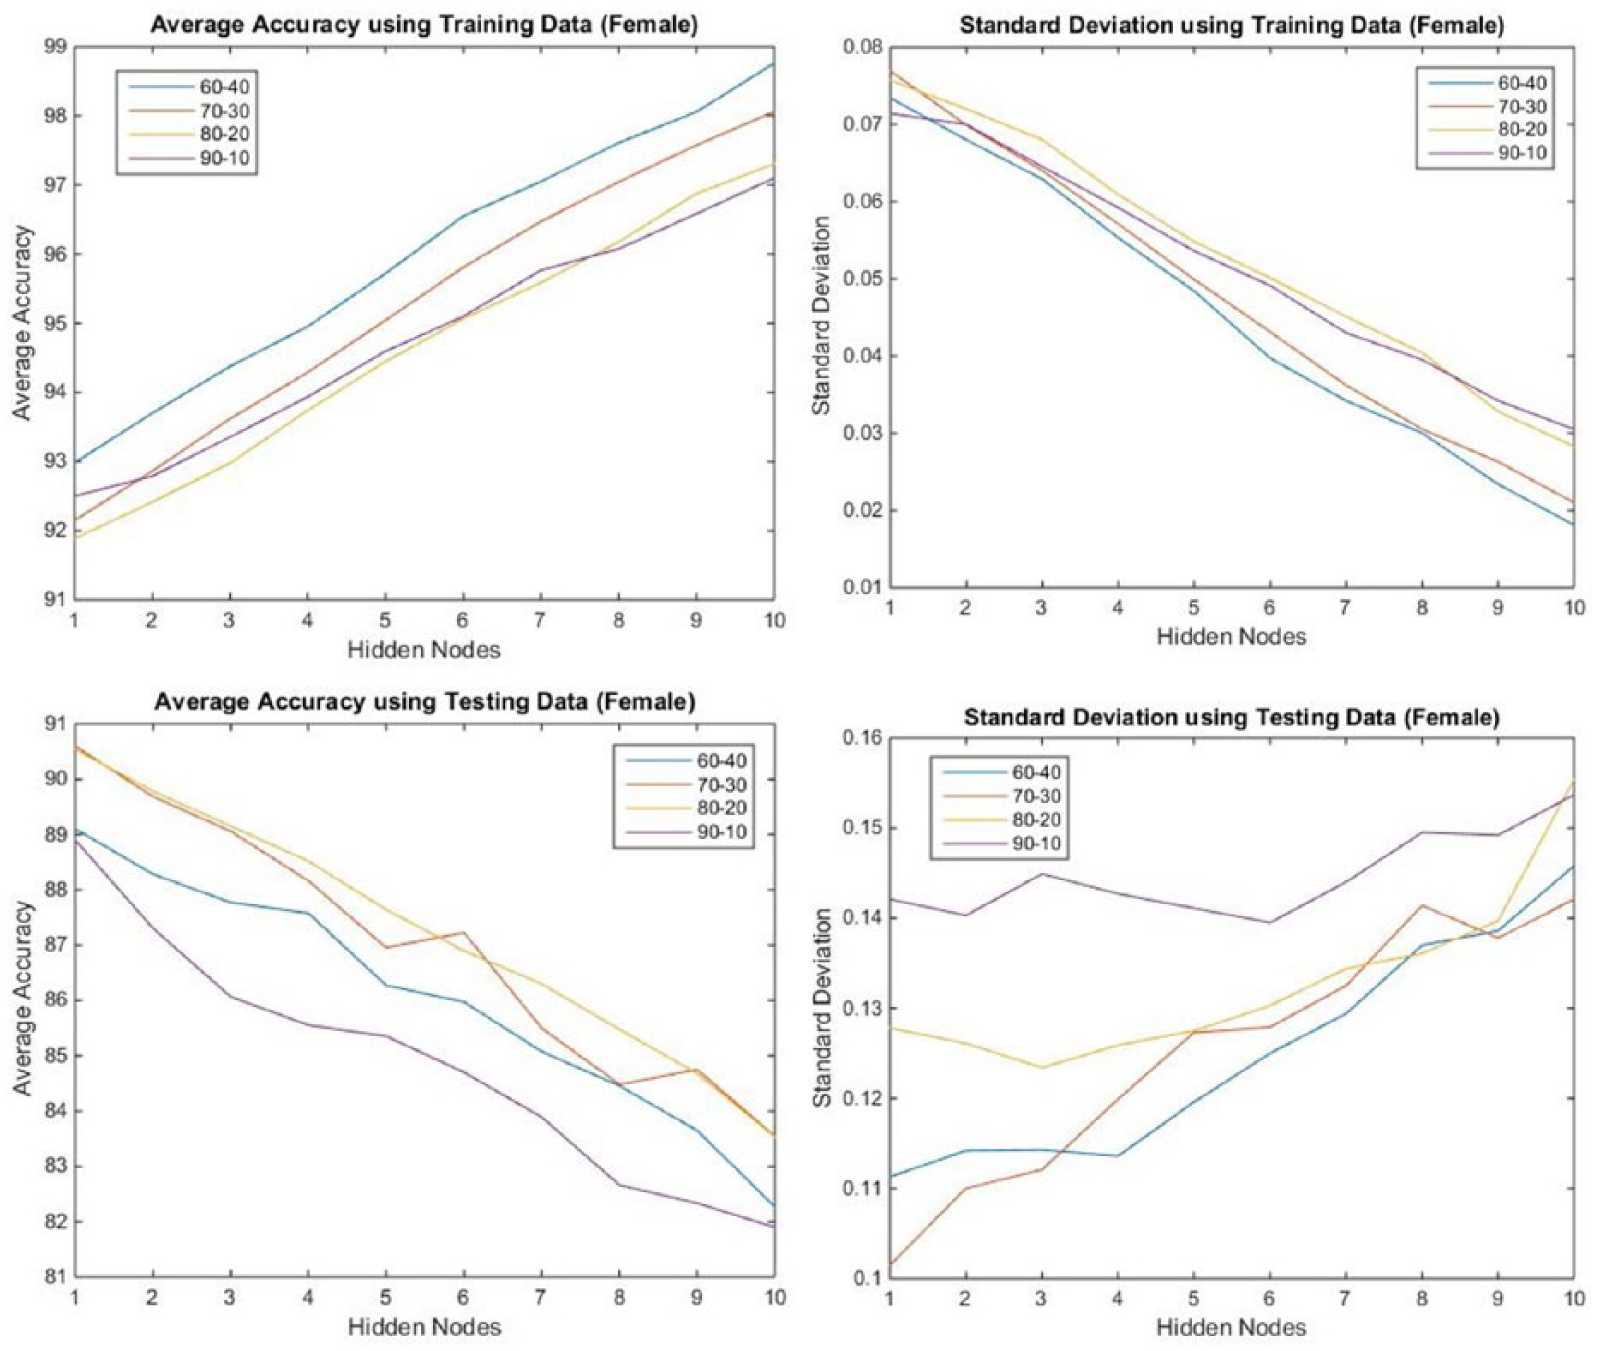
Performance of trained Back Propagation ANN using the female data.
Results based on both genders
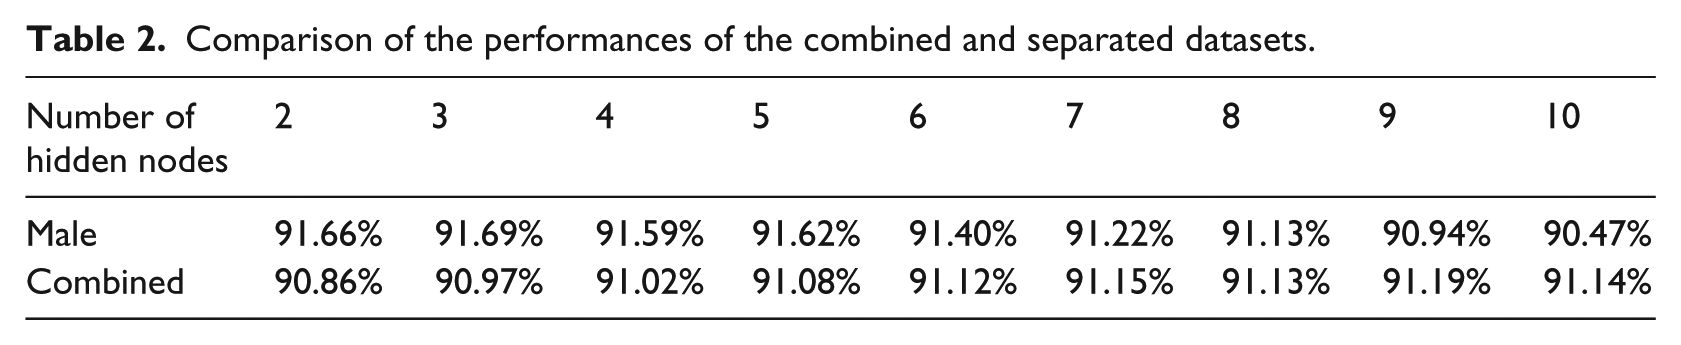
A case combining the male and female datasets was carried out in this section. The experiment was run and repeated 50 times, after which the average accuracy was calculated. The number of hidden nodes varied from 2 to 10. In the case combining both genders, the gender information of each sample was defined as another input in the ANN. In Table 2, the performance of this case was compared with those of cases of datasets separated by gender. The last row shows that the prediction accuracy with a combined gender dataset is lower than that with male cases.
Comparison of the performances of the combined and separated datasets.
Results based on two hidden layers
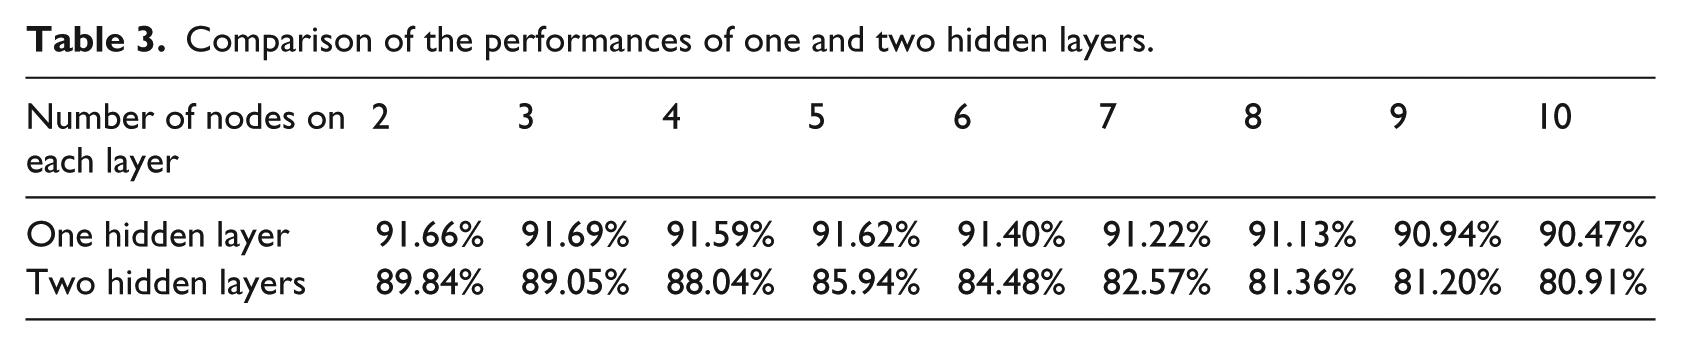
In this part, a Back Propagation ANN with two hidden layers was used to obtain the prediction value of the blood pressure. To test the performance of the network, the results were compared with the experiment using male data with one hidden layer. In this test, 80 percent of the data were used for training, with the remainder being used for testing. Each experiment was also repeated 50 times, and then, the average result was calculated. In the network with two hidden layers, the number of hidden nodes for each layer varied from 2 to 10. As shown in Table 3, the average accuracy using the network with one hidden layer was always higher than the network with two hidden layers. Hence, having two hidden layers did not help the Back Propagation ANN to obtain a predicted blood pressure value in this problem.
Comparison of the performances of one and two hidden layers.
RBF network
In this experiment, some related parameters were investigated to test the performance of the RBF neural network. As shown in Figure 3, the RBF network in this article is a two-layer network whose output forms a linear combination of the basis function computed by the hidden units. The basis functions in the hidden layer produce a localized response to the input, and each hidden unit has a localized receptive field.
Let X and Y be the set of the input and output data, respectively. Let (xi, yi), i = 1, 2, 3,…, NumT be such a training sample, where NumT is the number of training data. Let C be the set of centers/clusters. The algorithm of the RBF network used in this article is summarized into three steps:
Step 1: weight initialization. The weights in the hidden layer are determined by a clustering algorithm, and the weights in the output layer are initialized to small random values.
Step 2: calculation of activation. The activation level hj of the hidden unit j is calculated by
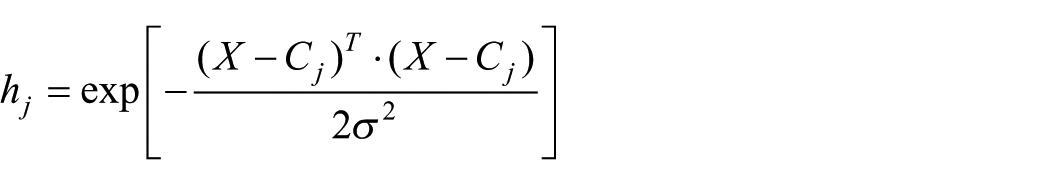
The activation level nj of an output unit is determined by

Step 3: weight calculations. In the hidden layer, the SOFM clustering algorithm is used to update the weights. In the output layer, the weight is learned by a LMS algorithm. The weights are adjusted by

where Wij(t) is the weight from the unit i to unit j at the tth iteration and ΔWij is the weight adjustment.
The weight change is computed by

where η is a trial-independent learning rate and δj is the error at the unit j

where dj is the desired output activation and nj is the actual output at the output unit j.
Similar to the Back Propagation ANN, different proportions were used for training and different numbers of clusters were carried out in the experiment. However, the RBF helps the kernel function of ANN rather than the optimization algorithm. The experiment was repeated 50 times, and the average of the results in terms of accuracy and standard deviation was calculated. Again, the trained network was tested based on two sets of data: data used to train the ANN and data reserved for testing. The learning rate of this algorithm was set to 0.3 and the maximum iteration was set to 100. The network had already settled down with 100 iterations, and there was no advantage to having more iterations.
Results based on males
In this case of RBF NN, Figure 8 shows that having more clusters did nothing to improve performance. Our experiment found that five clusters were enough for the problem. Different percentages of the database were used for the training of the RBF ANN. In Figure 8, lines of different colors stand for different proportions (60–40, 70–30, 80–20, and 90–10) of training and testing data from the dataset. Based on the testing data, it seems that the best result was obtained when 70 percent was used for training and the remaining 30 percent for testing the performance of the ANN.
Performance of trained RBF ANN using the male data.
Results based on females
A similar experiment was carried out for the female cases as shown in Figure 9. Again different percentages (60%, 70%, 80%, and 90%) of the database were used for the training of the RBF ANN. Based on the testing data, it seems that the best result is obtained when 90 percent is used for training and the remaining 10 percent for testing the performance of the ANN.
Performance of trained RBF ANN using the female data.
Summary of the results
The computation times of the experiments are summarized in Table 4. In the experiment, the neural network was tested by the number of hidden nodes/clusters from 1 to 10. Also, each case of experiment was run 50 times to calculate the average accuracy. The average computation time of the ANN was calculated with different proportions of training and testing data. The results showed that the RBF ANN runs faster than the Back Propagation ANN in obtaining the predicted BP value.
Average computation time.
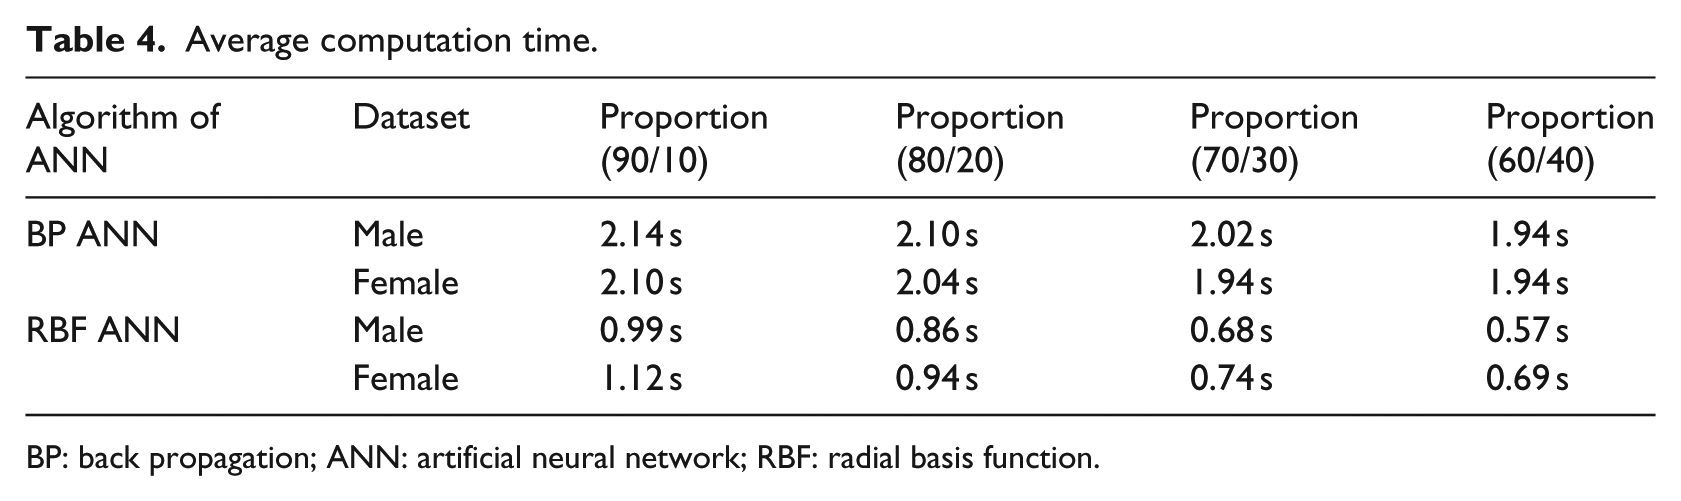
BP: back propagation; ANN: artificial neural network; RBF: radial basis function.
A summary of the major results is shown in Table 5. It can be seen that the accuracy was around 90 percent for both male and female cases. The number of nodes used in the middle layer of the neural network was also comparable.
Experimental results.
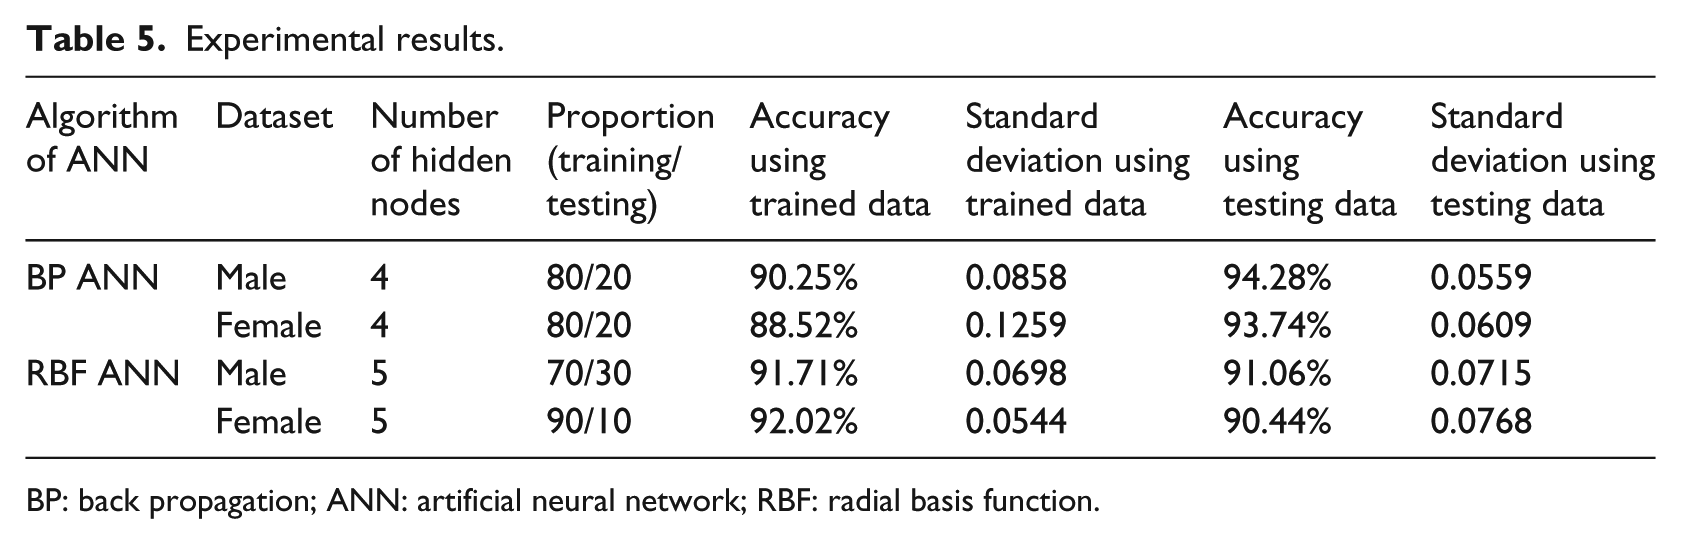
BP: back propagation; ANN: artificial neural network; RBF: radial basis function.
Discussion
Gender is the only constant factor among the input variables. Other variables, such as BMI and smoking status, change according to a person’s lifestyle. Also, using a separated ANN for male cases was shown to lead to better results than using a combined dataset. The database showed that the subjects ranged in age from 18 to 64 years, with 236 male and 262 female cases. Many of the results have been presented in the previous section. The reliability of the proposed approach was evaluated by comparing the ANN-predicted SBP value against the data used for both training and testing. The main criterion for evaluation should be the result obtained based on the testing data, and accuracy of over 90 percent was obtained.
Both of the ANNs studied in this article had a structure with only one hidden layer. In fact, the use of two hidden layers did not produce better results than the use of one hidden layer. It is also understood in the field of ANN that one hidden layer is sufficient to represent any nonlinear function, provided that enough hidden nodes are used.
We also found that using four hidden nodes in the Back Propagation ANN was sufficient for good performance. We attempted to use more hidden nodes in the training of both the Back Propagation and RBF networks, but the performance of the prediction was no better than when just a few hidden nodes were used. This observation is not surprising, as it is well known that using more hidden nodes merely introduces more parameters into the predictor (ANN). The neural network tries to “memorize” the training cases rather than to generalize and strengthen its learning capability. This issue of over-training should be avoided; the use of just a few hidden nodes has verified that our approach is correct.
The results suggest that the Back Propagation and RBF networks in the current study are comparable. The Back Propagation structure provides a default ANN configuration, and the learning effort goes into the training to find the interconnection weights between the layers. However, the RBF is a more refined structure, and the neural network is trying to turn the training data into clusters. In general, the time required for training is faster for an RBF network than for a Back Propagation network.
Limitations of the study
This study has several limitations. First, the size of the database used in the experiments was not very large. In order to obtain better predictions, the database should contain more samples for the training of ANN. Second, some attributes provided in the database, such as stress, exercise, alcohol, and smoking status, were subjective values without detailed and clearer information. With the use of telemedicine technology, 36 many attributes and health-related data, including the patient’s BP, can be gathered online. These would form a valuable database for predicting BP. To conclude, further studies using a larger database should be carried out, along with the use of more input variables for the neural network.
Conclusion
This article has proposed a machine learning method to predict SBP using the back-propagation (Back Propagation) neural network and the RBF network. The results from this article indicate that a blood pressure predictor can be developed based on the ANN models that were proposed. The average accuracy of the prediction is over 90 percent. The results obtained from the Back Propagation neural network and RBF network are in agreement.
Our results indicate that the machine learning technique can be an efficient tool for analyzing the relationship between a person’s SBP and his age and lifestyle factors (BMI, exercise level, alcohol consumption level, smoking status, stress level, and salt intake level). It must be emphasized that this method does not aim to replace the direct measurement of a person’s blood pressure. However, the method provides an estimated value in a telemedicine or expert system consultation. It also provides a reference value to compare with the measured value if a measurement is taken. This can contribute to the development of an SBP predictor, which can provide early warnings of the risks of hypertension and cardiovascular disease.
Footnotes
Declaration of Conflicting Interests
The author(s) declared no potential conflicts of interest with respect to the research, authorship, and/or publication of this article.
Funding
The author(s) received no financial support for the research, authorship, and/or publication of this article.