
Abstract
The left ventricular ejection fraction value is an important prognostic indicator of cardiovascular outcomes including morbidity and mortality and is often used clinically to indicate severity of heart disease. However, it is usually reported in free-text echocardiography reports. We developed and validated a computerized algorithm to extract ejection fraction values from echocardiography reports and applied the algorithm to a large volume of unstructured echocardiography reports between 1995 and 2011 in a large health maintenance organization. A total of 621,856 echocardiography reports with a description of ejection fraction values or systolic functions were identified, of which 70 percent contained numeric ejection fraction values and the rest (30%) were text descriptions explicitly indicating the systolic left ventricular function. The 12.1 percent (16.0% for male and 8.4% for female) of these extracted ejection fraction values are <45 percent. Validation conducted based on a random sample of 200 reports yielded 95.0 percent sensitivity and 96.9 percent positive predictive value.
Keywords
Introduction
Electronic medical record (EMR) systems, mandated by the federal government, are being increasingly used to improve care quality and patient safety. 1 EMR systems often capture rich clinical information such as signs, symptoms, severity, and disease onset, many of which are only available in unstructured data. A number of natural language processing (NLP) systems have been successfully developed in various clinical domains with varying focuses.2–9 For example, the Clinical Text Analysis and Knowledge Extraction System handles general clinical documents. 2 It processes clinical notes to identify and annotate various clinical named entities including drugs, diseases/disorders, signs/symptoms, anatomical sites, and procedures. The Cancer Text Information Extraction System identifies potential cancer cases based on pathology reports. 3 The Unified Medical Language System 4 provides a mapping structure among the vocabularies in biomedical sciences and also provides a comprehensive thesaurus and ontology of biomedical concepts to facilitate NLP. The Medical Language Extraction and Encoding System was initially designed to process the radiology reports, and then subsequently extended to other biomedical domains such as mammography reports and discharge summaries. 5 Other examples include the application peFinder for document-level classification of computed tomography (CT) pulmonary angiography reports, 6 the NegEx for identifying negated findings, 7 and the applications for radiology reports and other clinical notes.8,9 These systems provide good frameworks for the biomedical research community to process various unstructured text data.
Left ventricular ejection fraction (LVEF) is an important diagnostic measure of overall cardiac health and is one of the most powerful prognostic indicators in patients with cardiovascular diseases.10–18 An ejection fraction (EF) measure represents the percentage of blood ejected from the left ventricle with each systole. Healthy individuals typically have EF measures between 50 and 70 percent. An abnormal EF may be an early or late manifestation of cardiac diseases, but its presence invariably portends an unfavorable prognosis, regardless of whether the underlying cause is coronary, valvular, infectious, inflammatory, systemic (e.g. hypertension), idiopathic, or any other etiology. A reduced EF indicates impaired systolic function, which is likely to occur after myocardial infarction, obstructive or regurgitant valvular heart disease, myocarditis, chronic hypertension, and many other conditions.10–14 EF values <45 percent are associated with higher cardiovascular risk and mortality.13,14 In many cases, an improvement of EF through therapy is associated with improvements in symptoms and prognosis. Practice guidelines include EF in the treatment decision tree for many conditions.15,16 For example, in patients with asymptomatic aortic or mitral regurgitation, the patient’s EF is a major determinant of the timing of surgical valve repair or prosthetic valve replacement. Beyond its immediate clinical utility, the EF is central to many regulatory agencies’ decision for reimbursement or quality of care assessment. For instance, the use of implantable cardioverter-defibrillators for the primary prevention of sudden cardiac death is reimbursable by the Center for Medicare and Medicaid Services only for patients with EFs below a certain value (usually 30%–35%, depending on the substrate). 17 Because of the importance of EF in many cardiac conditions, a wide range of prospective clinical trials and retrospective cohort studies involving cardiac maladies list EF values among the basic and essential characteristics of the cohort.18,19 Although several other imaging modalities may be used to assess LVEF, including radiocontrast LV angiogram, radionuclide gated-averaged or first-pass angiogram, and magnetic resonance imaging, transthoracic echocardiography (TTE) accounts for the vast majority of clinically measured EF values. 20
The digital records of individual patient studies have been available to practitioners for over a decade within Kaiser Permanente Southern California (KPSC) medical system, long before the full-blown EMR system was implemented in mid-2000s. However, there have been only a few registry-type structured databases that were collected for patient care purposes that may have included EF as part of the “case-report form.” Majority of EF values can only be found in unstructured echocardiography (ECHO) reports. If one needs to identify patients who had a myocardial infarction in the last 5 years whose EF was 30 percent or less, manual review of all the patients’ transthoracic echocardiographic reports is necessary. A systematic and reliable method of extracting EF values of large cohorts or population has major beneficial implications and utilities. Recently, an NLP application called CUIMANDREef was developed to classify patients with EF <40 versus >40 percent based on a sample of 765 ECHO reports of seven Veteran Affairs (VA) medical centers. 21 The authors developed a set of regular expression rules to extract EF concept and value from the ECHO reports and assigned a score to determine the classification of EF. (A patient whose ECHO report that was assigned a score > 0 was classified as EF >40% while as a patient whose report with a score <0 indicated EF <40%.) The actual values of EF were not reported by the CUIMANDREef. The purpose of this study is to develop a computerized NLP algorithm to extract the numeric EF values or text descriptions from the unstructured ECHO reports in a more general and diversity population within a large healthcare maintenance organization. We will also validate the performance of the algorithm and report the distribution of EF values by patient characteristics.
Methods
KPSC is an integrated large health maintenance organization (HMO) that provides services to over 4.0 million members in 14 hospitals and 214 medical offices located in 10 counties of Southern California. Members are insured under employer-sponsored plans, individually purchased plans, and Medicare or state-subsidized programs for the indigent. 22 Members’ medical and demographic information is captured in a complete EMR system containing the free-text clinical notes (e.g. ECHO reports, hospital discharge summaries, and outpatient progress notes). This study included the ECHO reports stored in the EMR system that dated back to 1995. The study was approved by our Institutional Review Board.
Types of ECHO reports
The electronic ECHO reports were extracted from the data repository of our EMR system for the period between 1 January 1995 and 31 December 2011. The predominant types of ECHO performed and documented within the EMR system were standard two-dimensional TTE, TTE with treadmill or dobutamine stress, transesophageal echocardiography (TEE), and fetal ECHO. The standard measure of EF is with the modified Simpson’s rule, also known as the stacked-disc method. During the acquisition of the images, the sonographer traces the LV endocardial borders in two planes (biplane) in diastole and again in systole. The difference between the two phases yields the EF. Although visually estimated EF values may be reported for all these studies, the protocol to ascertain EF is consistently used only for TTE studies. Therefore, we excluded the following types of ECHO. First, we excluded TEE reports, because the EF values obtained from transesophageal views are not directly comparable to those of standard transthoracic method and protocol. Furthermore, TEEs do not typically show the entire LV so global EF cannot be accurately estimated. Second, stress ECHOs, including dobutamine stress and treadmill stress testing, were excluded because they focus on the detection of subtle wall motion abnormalities and use a different protocol. LV function is estimated visually rather than using the modified Simpson’s method. The numerical EF values are not routinely reported with stress ECHOs. Finally, fetal ECHOs were removed because they are used to evaluate the baby’s heart for problems during the second trimester of pregnancy. Other uncommon cardiac studies using ultrasound such as intracardiac ECHO 23 and intravascular ultrasound 24 do not assess EF, and therefore were purposely excluded.
EF extraction algorithm
The EF values in ECHO reports are not uniformly written. Extracting and formatting the data presents big challenges due to the following reasons. First, the EF function may be reported as a numeric value (for example, 35% or 55%) or described by a text string such as “normal,” “reduced,” or “severe.” Second, variations exist in the documentation of EF numeric values or text descriptions associated with the keywords or phrases of our interest (e.g. EF, LVEF, cardiac function). For example, EF values may be reported as “EF was only 30%,” “EF = 24%,” “LVEF: 55%,” or “estimated EF of 40%.” Third, some of the EF numeric values or text descriptions that are mentioned in the study ECHO reports refer to historical ECHO reports either inside or outside of our health system. These values need to be removed because they do not represent the actual EF values at the time the ECHO was performed. Finally, there are occasions in which a report contained conflict information on the EF values or text descriptions indicating systolic LV functions. The process to extract the EF values/text descriptions from the ECHO reports is listed below and also shown in Figure 1.
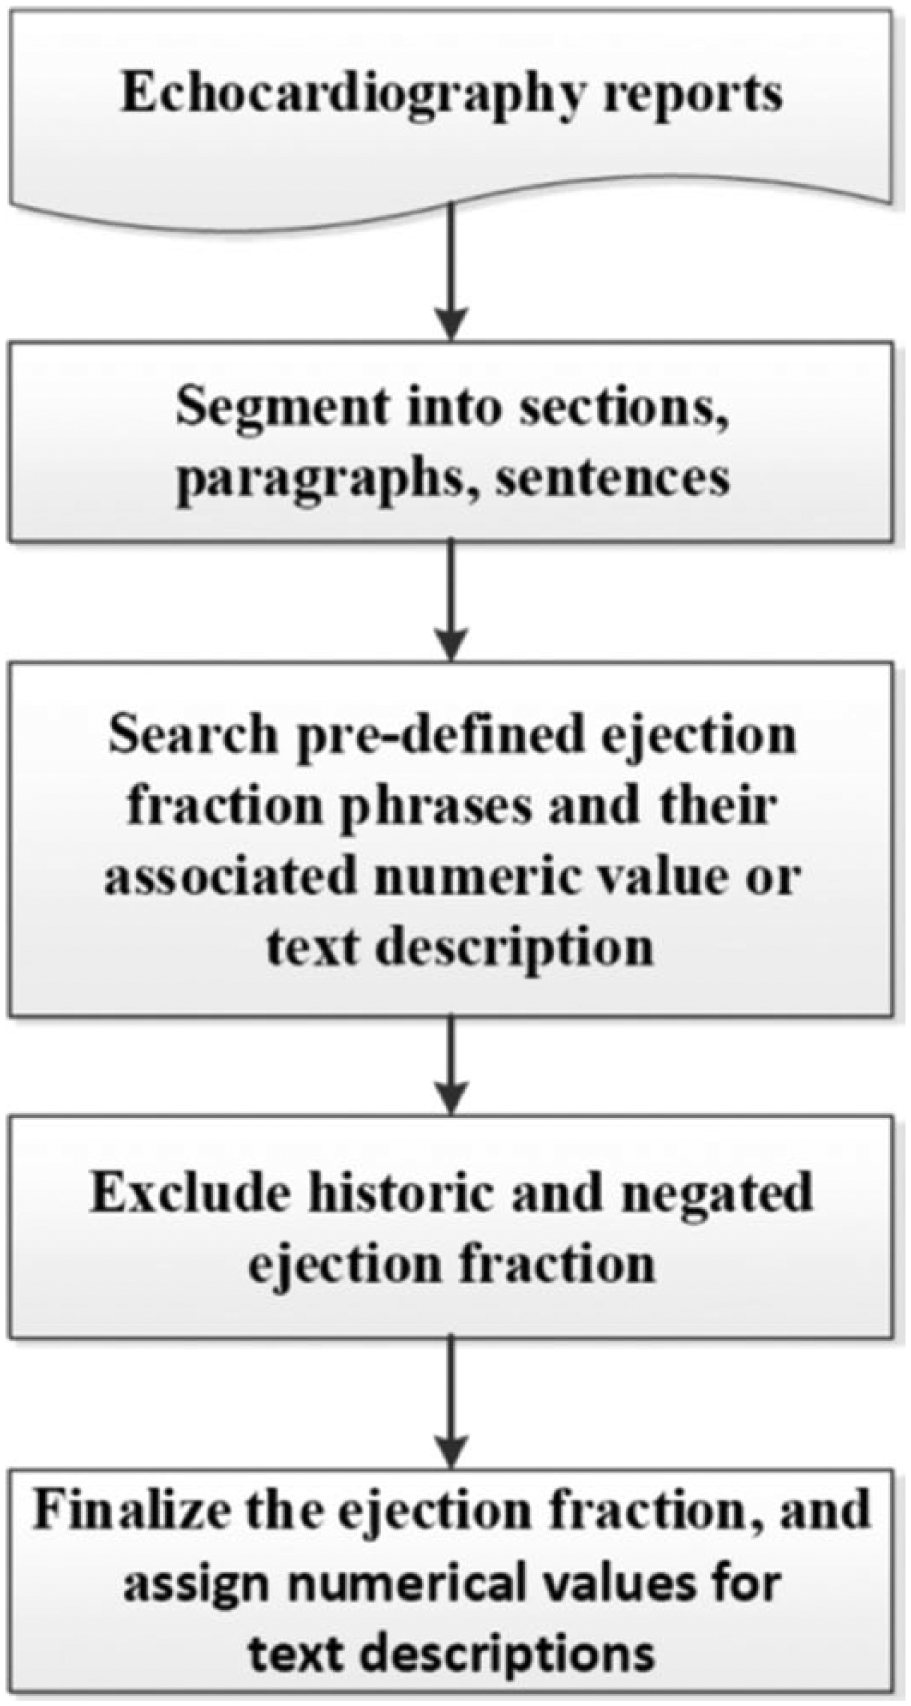
Ejection fraction value retrieval process.
Step 1: segment the reports
This step segmented the ECHO reports into sections, paragraphs, and then to sentences.
Step 2: retrieve EF values or text descriptions
A list of predefined EF keywords or phrases (see Appendix 1 for details) was identified based on ECHO practice guidance 25 and knowledge of conventional usage of an experienced clinical cardiologist. For a specific report, an EF value or text description could appear either prior to or following the predefined keywords or phrases, and thus the searching algorithm could be tedious. First, the keywords or phrases were searched within each segmented sentence in the report. If one of the predefined keywords was identified in a sentence, the numeric values associated with the keyword would be first searched backward and forward within the same sentence starting from the position where the predefined keyword was found. If a numeric value was not found, the algorithm started to search for predefined text description such as “normal,” “poor,” or “severe” (see Appendix 2(1) and (2)) associated with the keyword. The EF value or text description closest to the predefined keyword was selected if multiple values or text descriptions were found.
Step 3: exclude historic and negated EF values or text descriptions
As mentioned earlier, some ECHO reports include patients’ previous EF values or text descriptions indicating systolic LV functions. Therefore, efforts were made to exclude historical results. This was performed by searching each sentence to examine whether or not historical phrases such as “previous” and “history” (see Appendix 2(3)) were associated with the defined keywords listed in Appendix 1. A simple negation algorithm was also applied to each sentence to rule out the negation associated with these EF keywords (see Appendix 2(4)).
Step 4: finalize the EF value for each report
If multiple EF values or text descriptions were found in a report, the final value is determined using the following rules. The values or text descriptions that explicitly describe EF or LV function had the highest priority, followed by those of generic ventricular or cardiac function or contractility. The values or text descriptions pertaining to dysfunction had the lowest priority (see Appendix 1 for details). If multiple EF values or text descriptions had the same priority, the one indicting the worse EF function was selected. For example, if both “moderate” and “severe” descriptions were found to be associated with a keyword listed in Appendix 1, the “severe” one was selected. Finally, the text descriptions of EF were transformed into numerical EF values (see Appendix 3 for details) according to the cardiologist’ guidance to facilitate data analysis or reporting. If the original reported EF value was a range, the mid-point of the range was used.
Validation sample
A sample of 200 ECHO reports were randomly selected from the entire ECHO reports included in the study. An experienced clinical cardiologist reviewed each report to abstract the EF value or the text description indicating systolic LV functions and documented the specific comments if the EF description was not available. The results served as the “gold standard” to be compared with the results from the computerized algorithm. The measures of accuracy, including sensitivity and positive predictive value (PPV), were calculated. Sensitivity was defined as the number of reports in which EF values or text descriptions were correctly extracted by the computerized algorithm divided by the total number of reports in which EF values or text descriptions were retrieved by the cardiologist. PPV was the defined as the number of reports in which EF values or text descriptions were correctly extracted by the computerized algorithm divided by the total of number of EF values or text descriptions extracted by the computerized algorithm.
Results
The EF numeric values or text descriptions were successfully retrieved from a total of 621,856 ECHO reports between 1995 and 2011 via the developed computerized algorithm. Of these EF results, nearly 70 percent were numeric values while the rest were text descriptions. After these text descriptions were converted into the numerical values using the rules specified in Appendix 3, the distribution of EF values by age and gender is shown in Table 1. The overall number of subjects with EF values was similar between male (49.5%) and female (50.5%). The distribution of EF values among gender was significantly different (p < 0.01). Compared to females, males were more likely to have EF values <45 percent (16.0% for male and 8.4% for female). The distribution of EF values by age group was also significantly different (p < 0.01). Patients aged 45 years or older had higher percentage with EF values <45 percent compared to patients aged younger than 45 years (13.0% versus 7.5%).
The distribution of retrieved ejection fraction values by gender and age group.
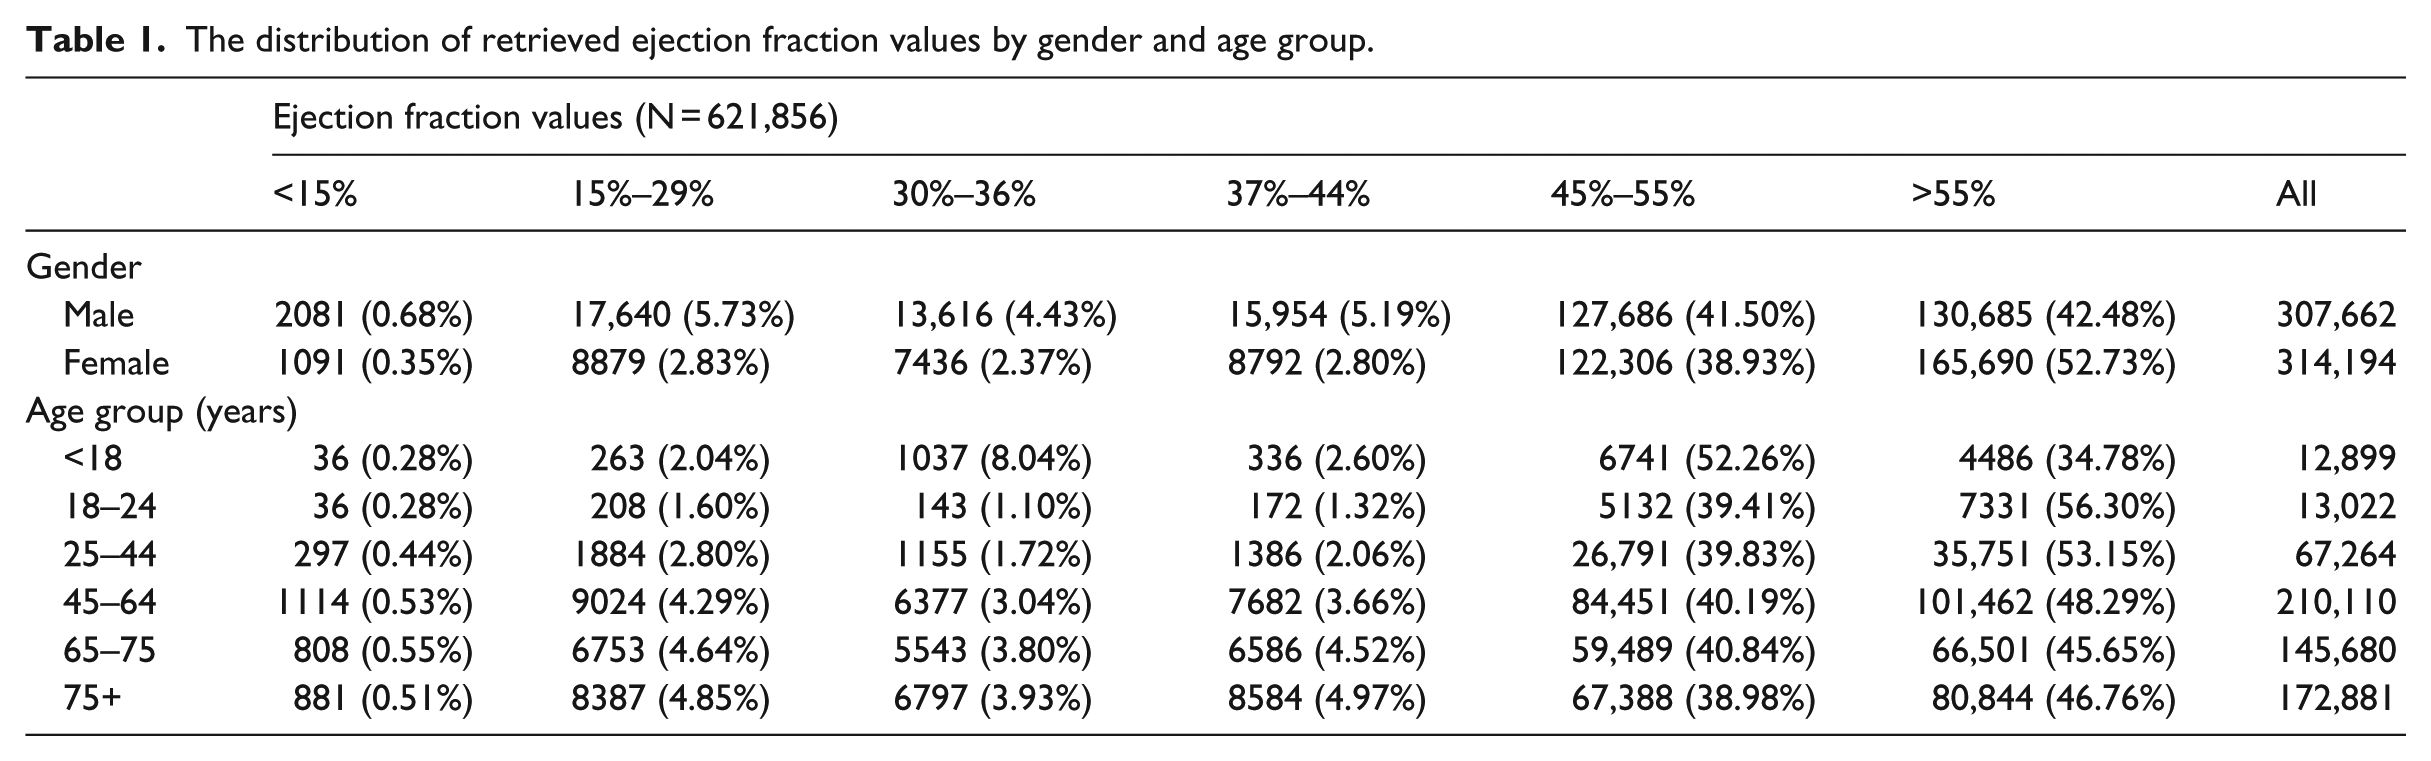
Table 2 shows the comparison of the computerized results versus the manual results retrieved from the 200 randomly selected ECHO reports. The computerized algorithm achieved very high accuracy (sensitivity = 95.0% and PPV = 96.9%).
Performance of the natural language processing algorithm for ejection fraction extraction.
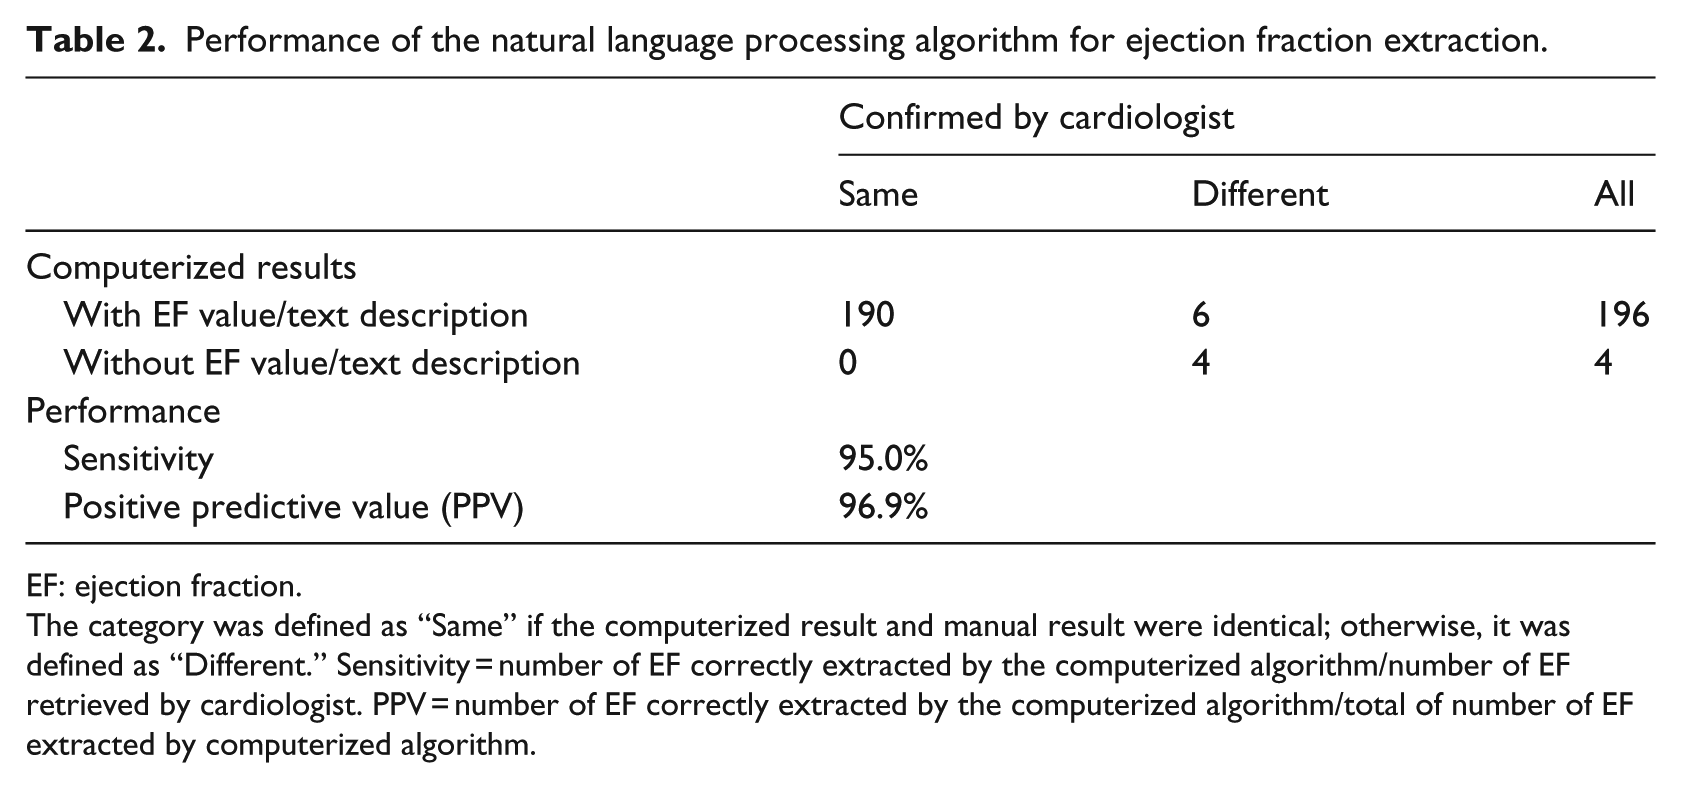
EF: ejection fraction.
The category was defined as “Same” if the computerized result and manual result were identical; otherwise, it was defined as “Different.” Sensitivity = number of EF correctly extracted by the computerized algorithm/number of EF retrieved by cardiologist. PPV = number of EF correctly extracted by the computerized algorithm/total of number of EF extracted by computerized algorithm.
Discussions
TTEs are among the most commonly obtained imaging studies for hospitalized patients. The primary indication for TTE is to assess LV function, specifically LVEF. Most patients suspected of having a significant cardiac pathology will have undergone a transthoracic echocardiographic study. 20 In many large cohorts of cardiac patients, a significant proportion would have had a TTE in the past. But these values usually were reported in the free-text ECHO reports and unable to be used directly. We developed and implemented a computerized text processing algorithm to extract EF (numerical value or text description if the numerical value was not available) from the unstructured ECHO reports in a large HMO. Compared to the manual chart review results, these computerized extracted EF values or text descriptions achieved a high level of performance (sensitivity (recall) 95.0% and PPV (precision) 96.9%), which were comparable to the sensitivity of 88.9 percent and PPV of 95.0 percent at the concept-level classification of EF of <40 percent in the study conducted at VA. 21 The small percentage (~5%) error rate (either false-positive or false-negative) in our study was caused by either failure to select the correct EF value when multiple EF values appeared in the same report or the unsuccessful efforts to pick up the EF value when the text descriptions of EF mingled with text for multiple things. For example, in the sentence “The LV and RV are normal in size and function,” “LV” and “function” are separated by other words, and therefore was not identified as a predefined phrase, although the word “normal” is part of the sentence.
To our knowledge, the vast majority of ECHO reports anywhere in the United States are employed by either case report forms, whereby the values are filled in predefined boxes such as LV size, EF, mitral gradient, aortic gradient and pulmonary artery pressure, or dictated reports (the ones being used in this study). For case report forms, it can easily locate the EF value as long as they are reported while there has not been any systematic and automatic way to retrieve the EF value from the dictated report other than reading the report. Therefore, the computerized algorithm developed in our study should be able to apply for any ECHO reports that are narrated and transcribed although the development was based on ECHO reports within our healthcare organization.
The computational time to process ECHO reports depends on the software and hardware configurations such as number and processing power of central processing unit (CPU) and memory. In our study, the algorithm was implemented through Perl scripts and processed on a high-performance Unix server. With CPU of 2.9 GHz and 128G RAM, 70k ECHO reports were processed within 1 h by a single processing job. Our algorithm can also be easily implemented by other programming languages such as Python. With minor modification, the algorithm can also be integrated into other note processing tools.
We acknowledge several potential limitations of this study. First, integration of our study computerized algorithm into the other tools or implementation of this computerized algorithm in other settings may yield some variable results due to the variation in format and presentation of clinical reports, but the accuracy should not be essentially different because the keywords or concepts used for EF extraction are not specified or limited to any fixed/strict formatted ECHO reports. Second, compared to the NegEx algorithm, 7 our study applied a simple rule of the description of negation and the description of history terms to exclude both negation and history conditions in ECHO reports. Despite these limitations, our study developed a computerized algorithm to retrieve EF values from the ECHO reports in a systematic and automated way. This computerized algorithm produced high accuracy and can provide great potential values for improving patient care managements, such as congestive heart failure and other implications. Our algorithm can serve as a starting point for the creation of a more general or global approach. Integration of the algorithm to general NLP tools could yield a more robust and reliable algorithm. Additionally, the incorporation of the knowledge of health professionals allows for a more sophisticated methodology.
Footnotes
Keywords or phrases used to search the description of ejection fraction and the selected priority in the searching algorithm
Keywords used to search for ejection fraction conditions
Conversion of text description of ejection fraction into numeric value
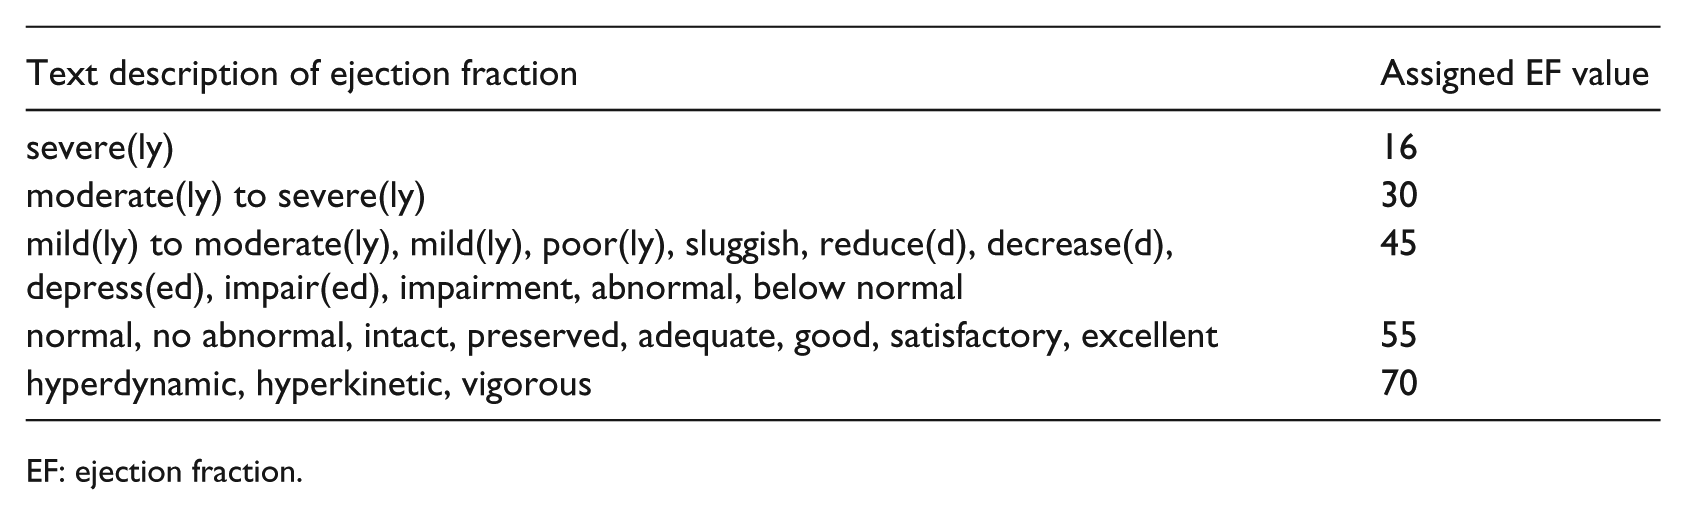
| Text description of ejection fraction | Assigned EF value |
|---|---|
| severe(ly) | 16 |
| moderate(ly) to severe(ly) | 30 |
| mild(ly) to moderate(ly), mild(ly), poor(ly), sluggish, reduce(d), decrease(d), depress(ed), impair(ed), impairment, abnormal, below normal | 45 |
| normal, no abnormal, intact, preserved, adequate, good, satisfactory, excellent | 55 |
| hyperdynamic, hyperkinetic, vigorous | 70 |
EF: ejection fraction.
Funding
The author(s) received no financial support for the research, authorship, and/or publication of this article.