
Abstract
Evaluation of an eHealth platform, Intelligent Research and Intervention Software was undertaken via cross-sectional survey of staff users and application performance monitoring. The platform is used to deliver psychosocial interventions across a range of clinical contexts, project scopes, and delivery modalities (e.g. hybrid telehealth, fully online self-managed, randomized control trials, and clinical service delivery). Intelligent Research and Intervention Software supports persuasive technology elements (e.g. tailoring, reminders, and personalization) as well as staff management tools. Results from the System Usability Scale involving 30 Staff and Administrative users across multiple projects were positive with overall mean score of 70 (“Acceptable”). The mean score for “Usability” sub-scale was 82 and for “Learnability” sub-scale 61. There were no significant differences in perceptions of usability across user groups or levels of experience. Application performance management analytics (e.g. Application Performance Index scores) across two test sites indicate the software platform is robust and reliable when compared to industry standards. Intelligent Research and Intervention Software is successfully operating as a flexible platform for creating, delivering, and evaluating eHealth interventions.
Introduction
Many eHealth interventions are developed in academic settings, unaffiliated with existing health care delivery systems. When research funding expires, the interventions are no longer supported. 1 Furthermore, costs to develop software and/or platforms to support eHealth intervention delivery are often prohibitive for researchers.2,3 Thus, to date, many eHealth interventions are infrequently evaluated in trials 4 or are evaluated without sufficient knowledge of their feasibility or scalability in the health care delivery system they were intended for. 5
A small but promising literature has emerged for eHealth delivery platforms that can be configured to deliver concurrent interventions. Such platforms can introduce economies of scale by reducing the need for start-up costs for individual platforms per health care intervention. For example, an open-source platform LifeGuide 6 and BeHealth Solutions/Manager 7 have been used to deliver multiple self-managed eHealth interventions from varying clinical contexts (i.e. diabetes, insomnia, and alcohol exposure during pregnancy). To date, however, there are no published reports evaluating these platforms for software performance (i.e. reliability, responsiveness to usage demands) or usability evaluations of those administering the eHealth interventions via the platform. These are two critical dimensions of technology implementation that could negatively affect wider adoption and uptake. Scalability is highly dependent on reliable technology and user satisfaction, but staff usability evaluations are often not systematically reviewed or reported.8,9
This article presents preliminary system performance results of an eHealth platform: Intelligent Research and Intervention Software (IRIS). This article addresses a gap in the literature by providing evidence of key eHealth platform performance indicators and usability assessments for different eHealth professional and administrative staff users.
IRIS platform overview
IRIS was developed as a generalizable platform initially deployed to support “Strongest Families Finland Canada” program (Canadian Institutes of Health Research; ClinicalTrials.gov no. NCT01750996) with the objective of providing participants with a secure, personalized website to access resources, complete interactive practice activities, and communicate directly with coaches. Additional partnerships were secured and multiple funded clinical trials assessing the effect of other IRIS powered interventions are currently underway. The not-for-profit Strongest Families Institute (SFI) currently uses the platform to help deliver health services at a distance to more than 2000 families. 10 IRIS is currently used in 11 different applications (see Table 1) in three countries/languages 11 and is running on Version 4.4.10.
Focus of IRIS projects since beta development.
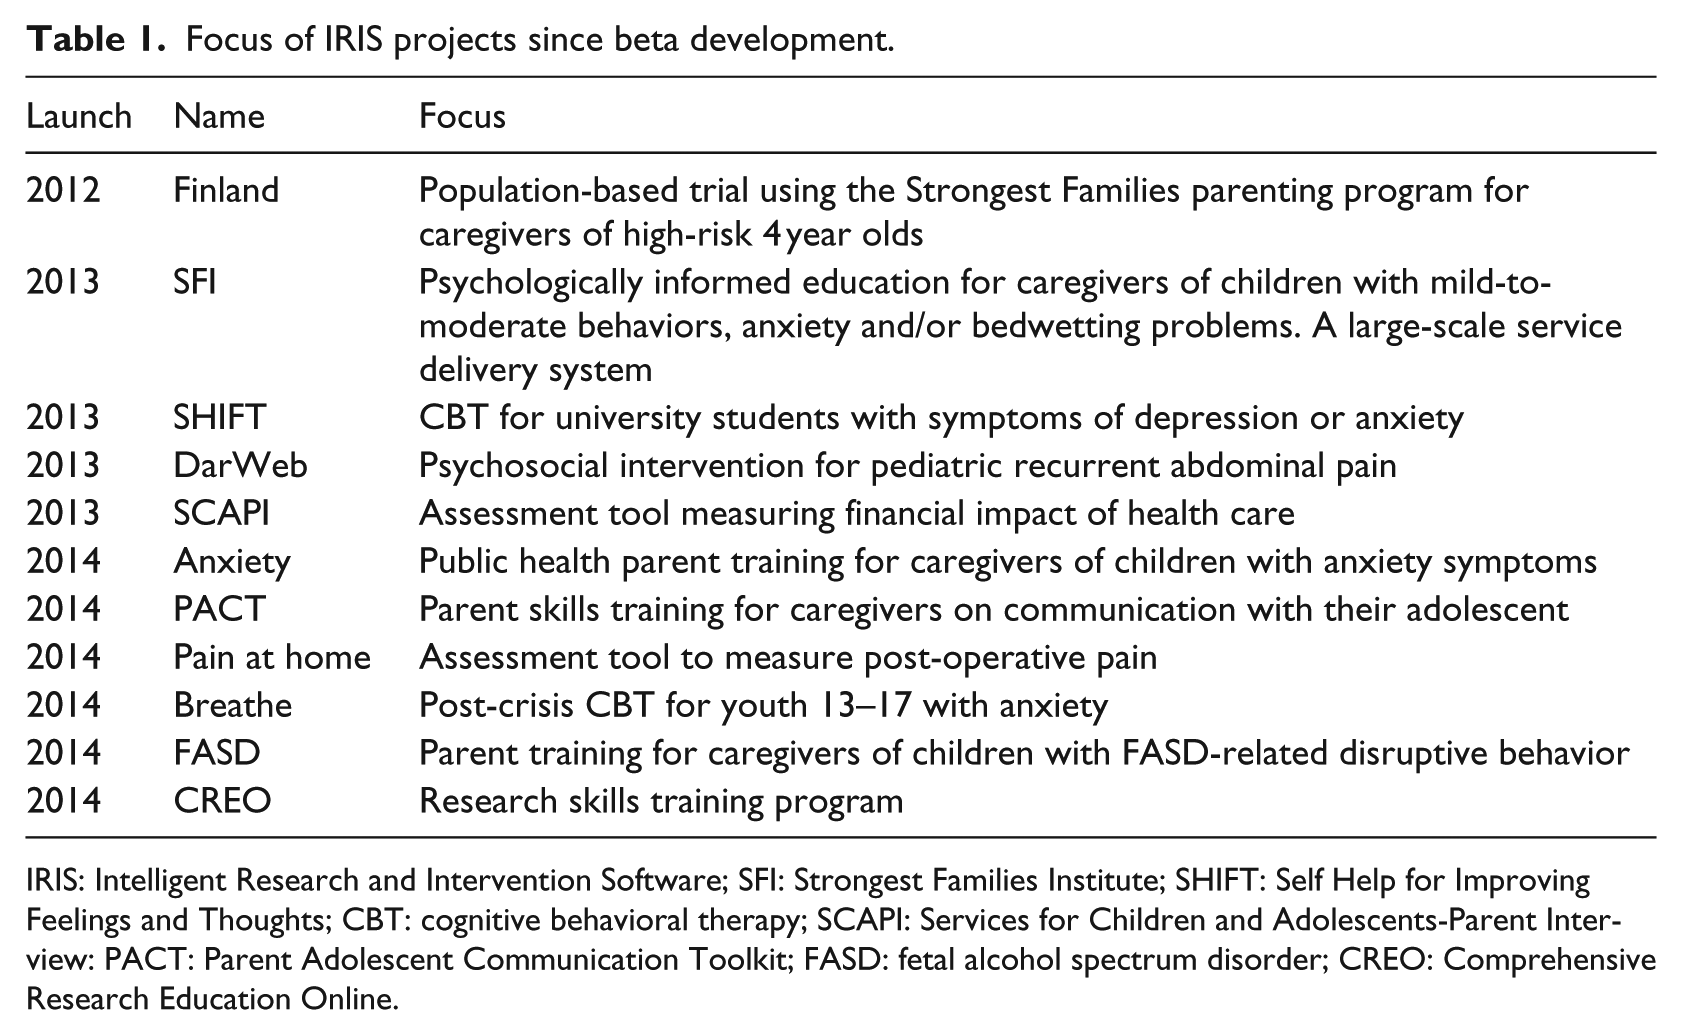
IRIS: Intelligent Research and Intervention Software; SFI: Strongest Families Institute; SHIFT: Self Help for Improving Feelings and Thoughts; CBT: cognitive behavioral therapy; SCAPI: Services for Children and Adolescents-Parent Interview: PACT: Parent Adolescent Communication Toolkit; FASD: fetal alcohol spectrum disorder; CREO: Comprehensive Research Education Online.
IRIS leverages open-source web technologies like Django and Backbone.js and is distributed as a Linux-based virtual appliance (VA), allowing it to be more easily deployed and maintained within different IT environments. The platform supports three major user types, each with a user interface (UI) or “view.” Participants (patients, clients) interact with intervention content through the Participant View, while staff (researchers, coaches, and clinicians) monitors participant progress through the Staff View. Technical staff accesses the site administrative controls and intervention authoring tools through the Administrative View. Intervention curriculum is organized into session folders and then each web page is sequenced and styled (see Figure 1).
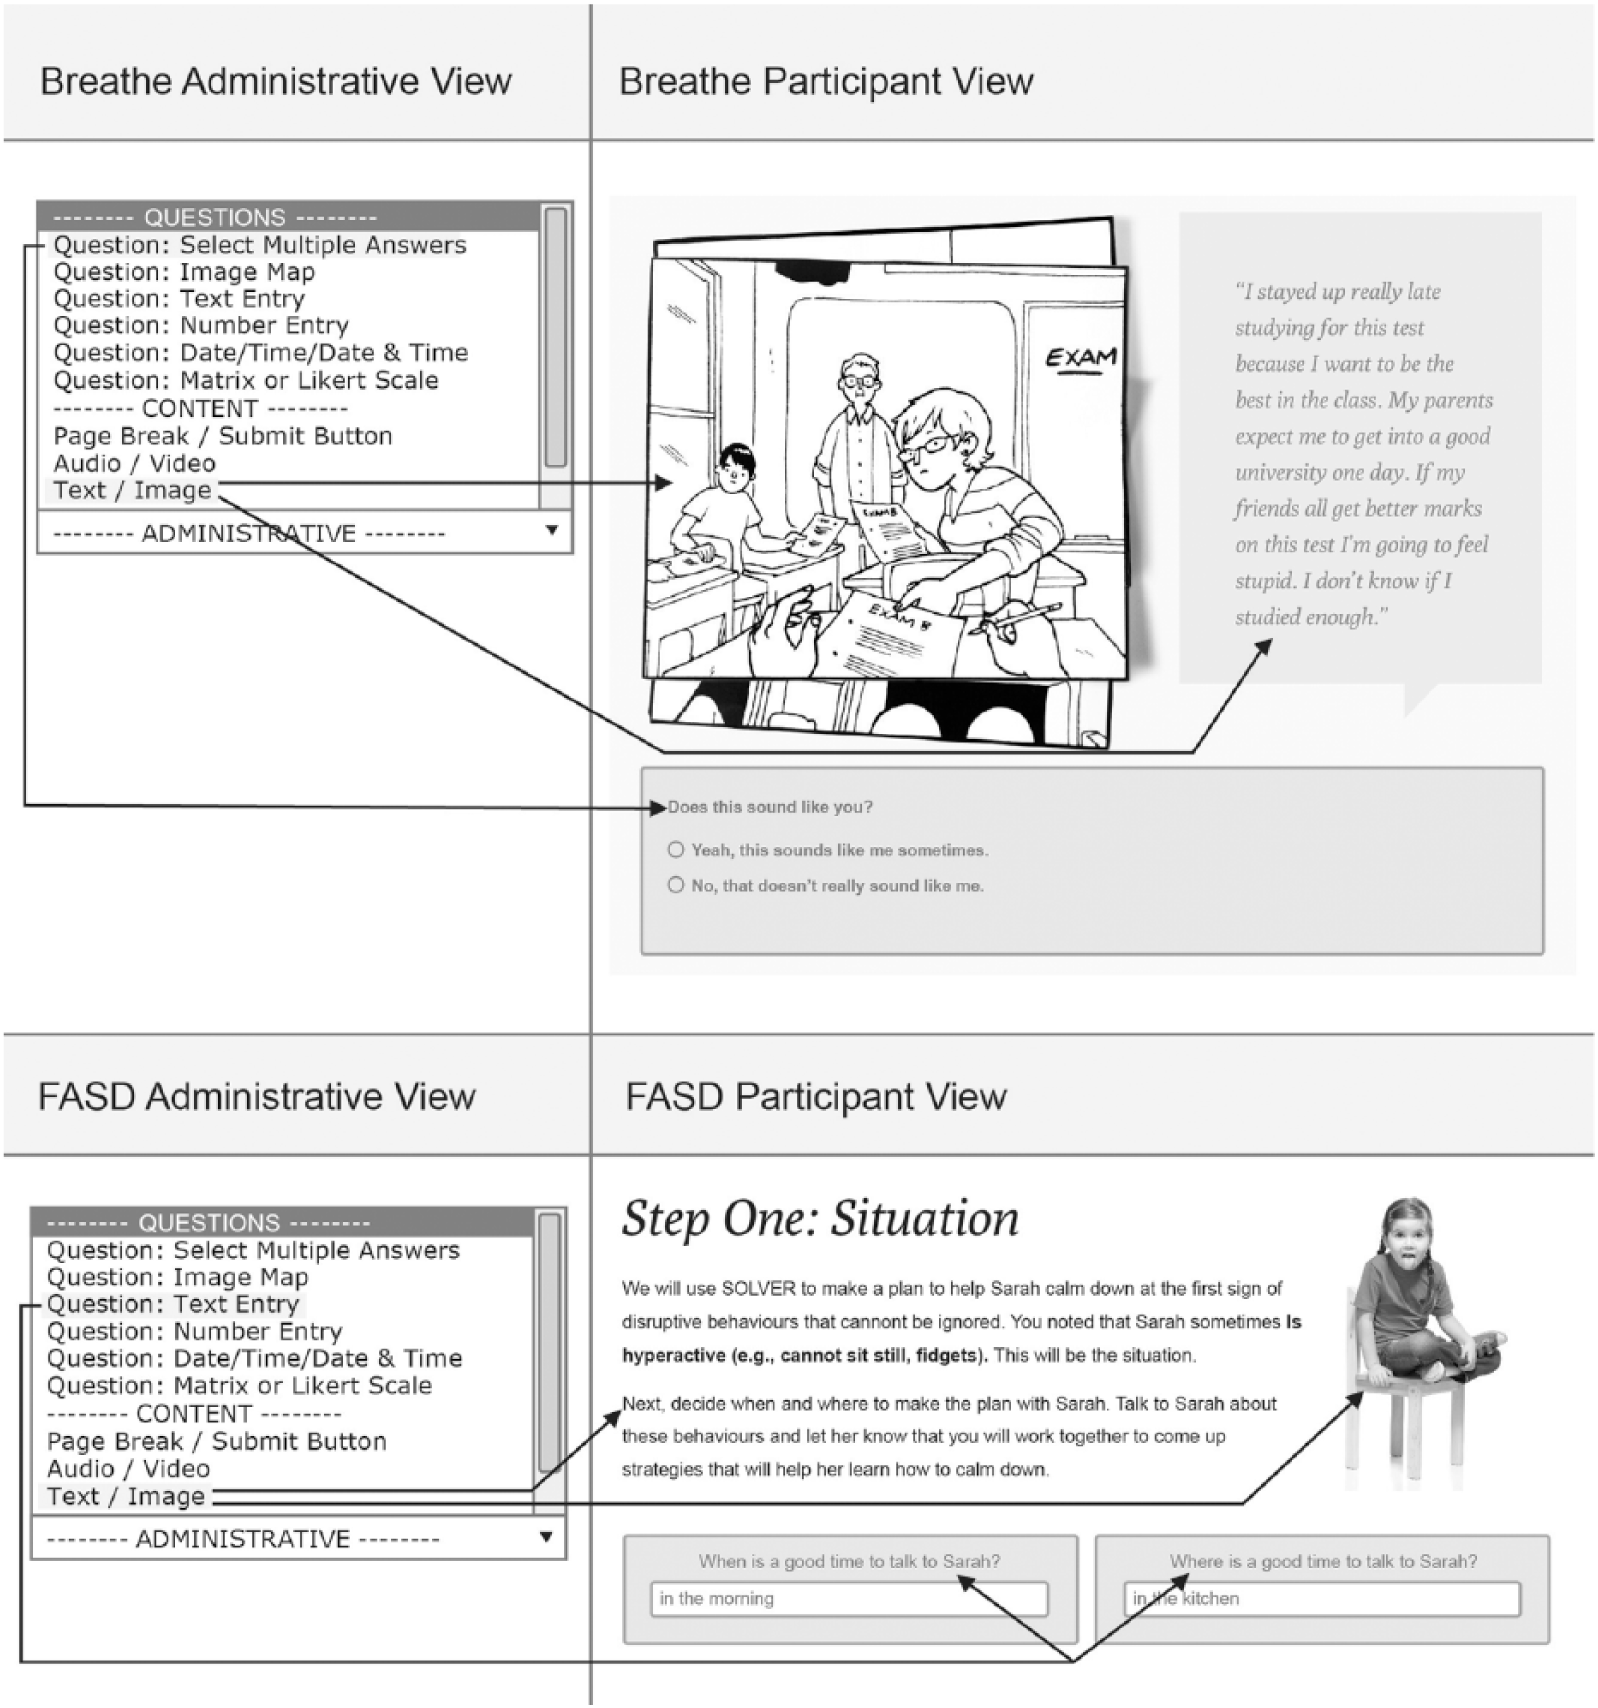
Examples of how two different IRIS Projects (Breathe and FASD) customized page layouts and styling through tools in the Administrative View.
IRIS supports the use of text, image, audio, video, image mapping, and a range of question/answer styles (e.g. multiple choice, true/false, and open-ended text boxes) to enable an interactive intervention curriculum. Additional features available include the following: automated, sequential participant ID number assignment; customizable “dashboards” that support information management for staff to view summary information quickly; automated task generation; and custom report generation with filtering capability.
Access to IRIS is password protected. Passwords are salted and hashed before being stored to ensure only authorized access. All web traffic is encrypted using Transport Layer Security/Secure Socket Layer (TLS/SSL). The IRIS VA is also protected with a software firewall with remote access possible only by authorized persons using the Secure Shell (SSH) protocol. The platform timestamps all account activity, which allows for comprehensive auditing. IRIS has been reviewed for compliance with personal health information (e.g. Personal Health Information Act (PHIA) in Nova Scotia, Personal Information Protection and Electronic Documents Act (PIPEDA) in Canada) regulations and intervention studies conducted via IRIS have been formally approved by the institutional Research Ethics Board for each IRIS application/project.
Persuasive technology capabilities of the platform
As research has consistently demonstrated that persuasive technology (e.g. tailoring)12–15 outperforms static health information delivery strategies for a variety of clinical contexts.16–18 IRIS was designed with a range of interactive capabilities related to task support, dialogue and communication, and social support (see Table 2 for detailed list).
Persuasive technology capabilities supported by IRIS platform.
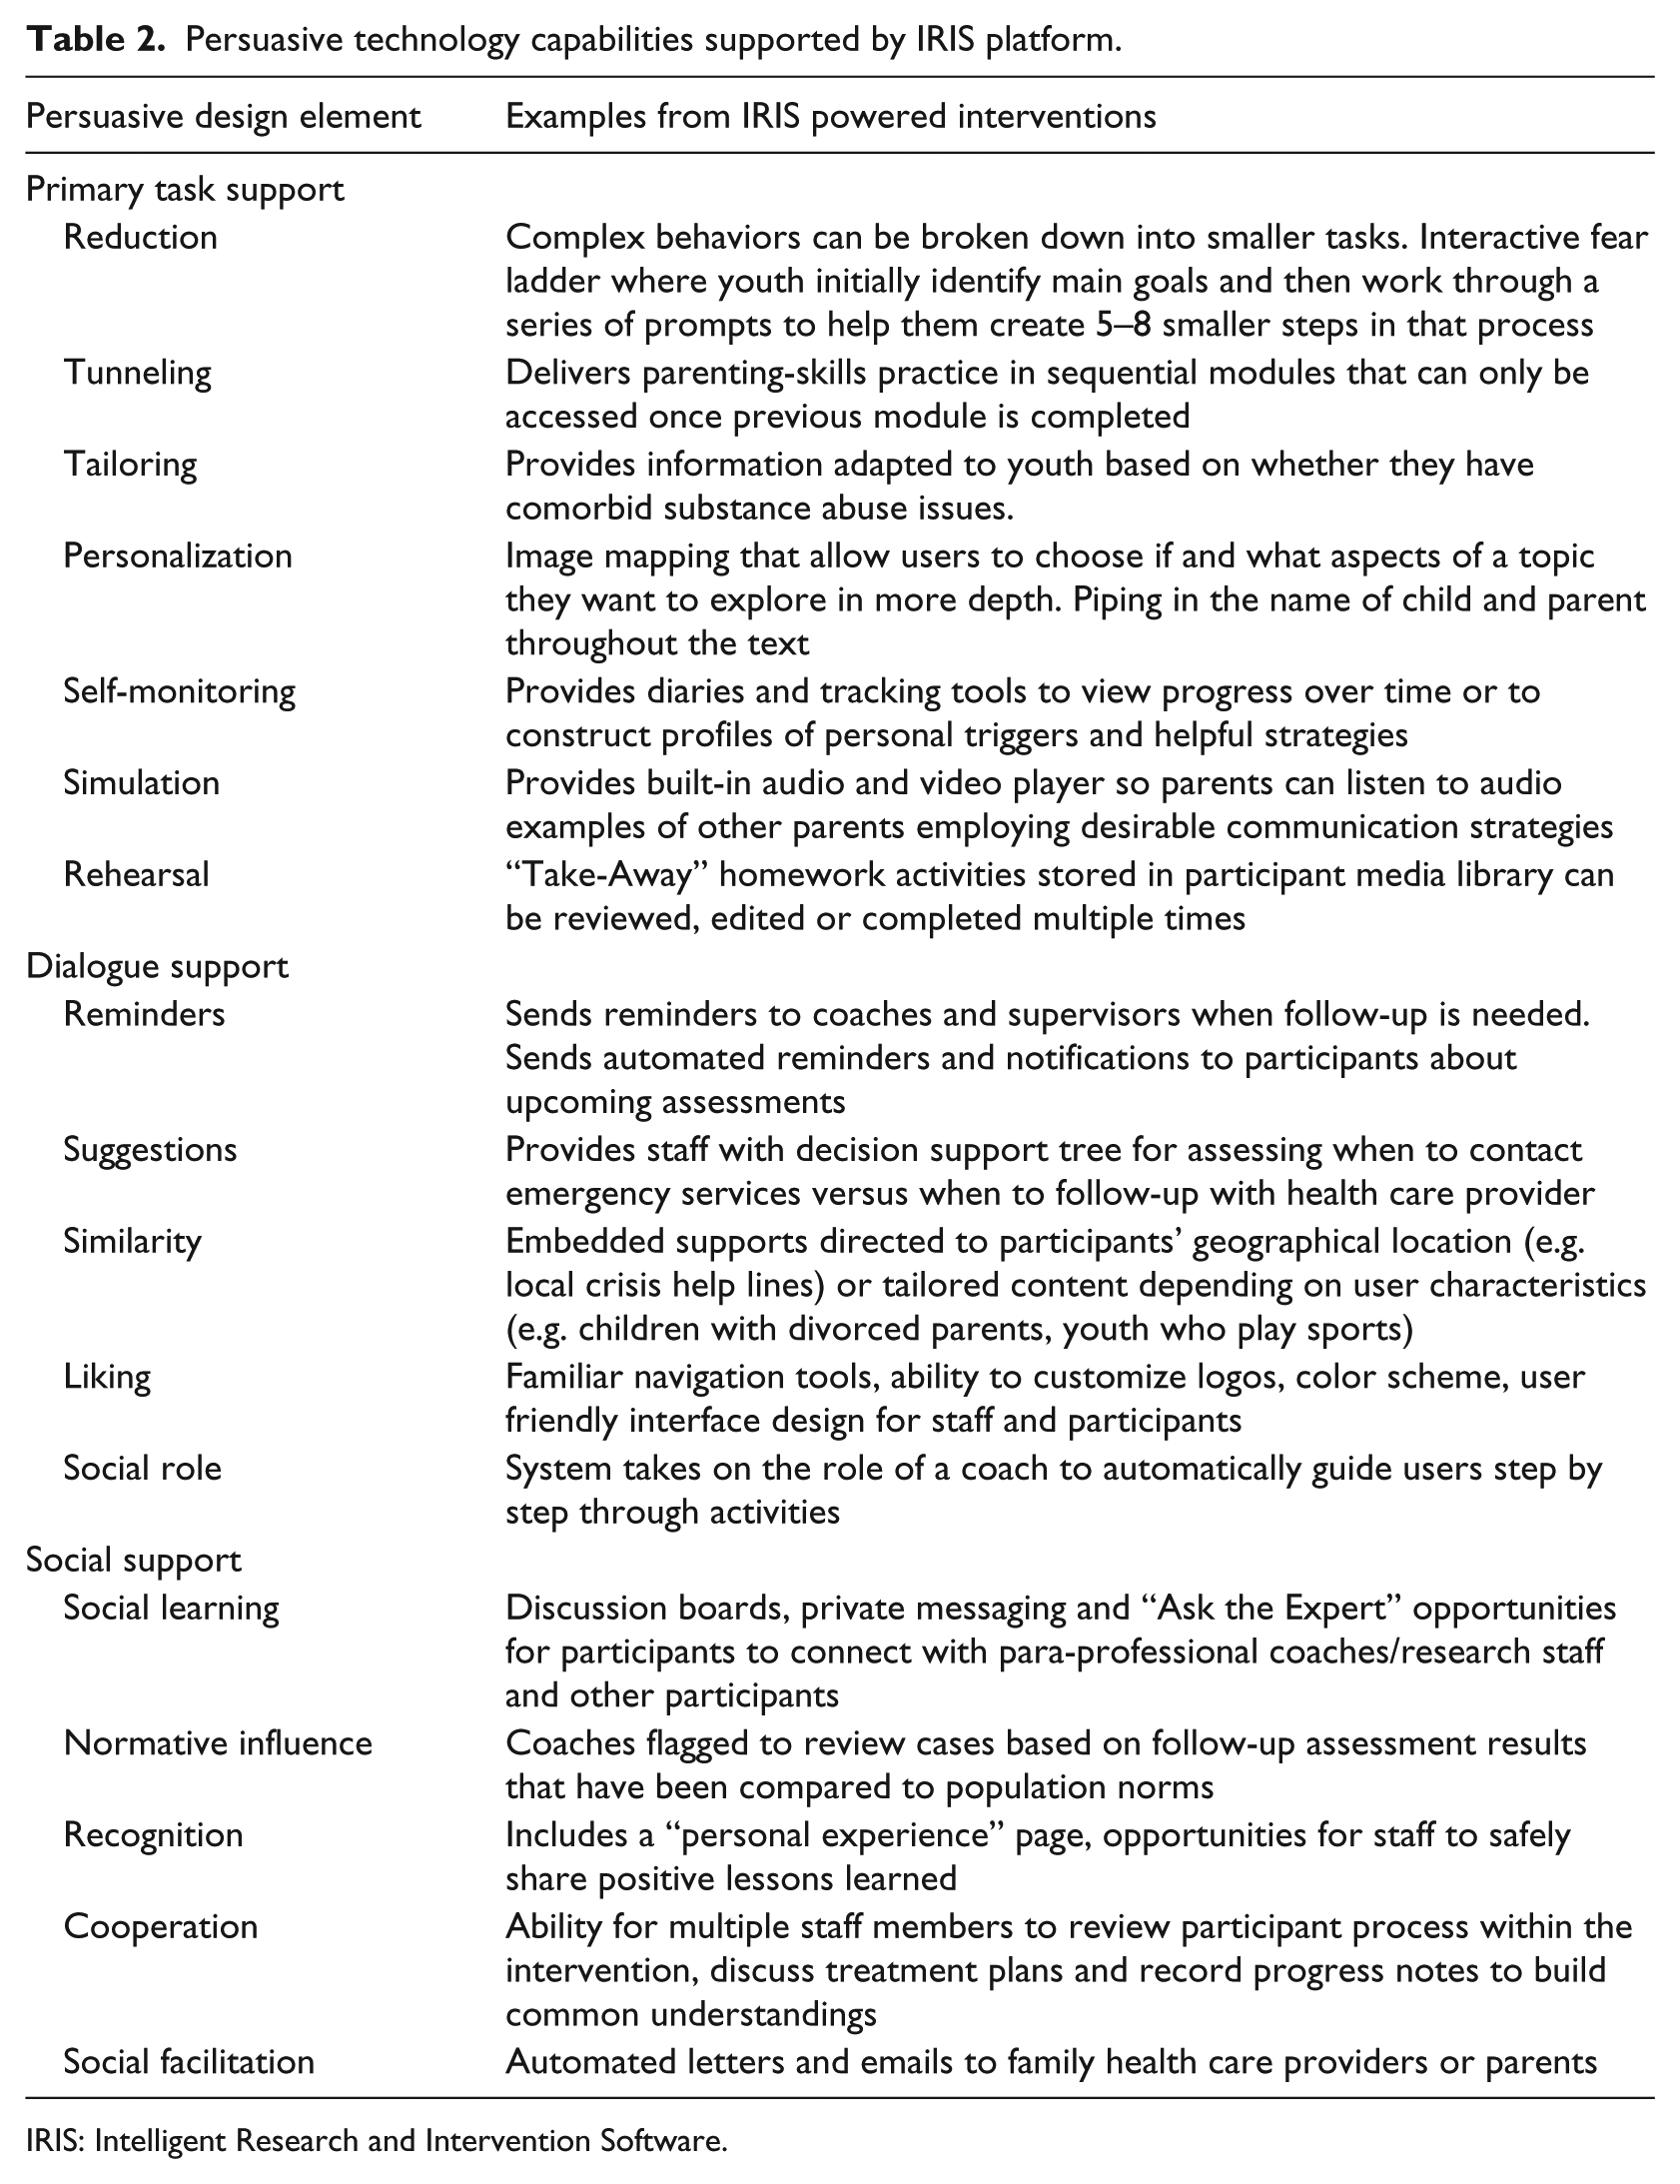
IRIS: Intelligent Research and Intervention Software.
Each IRIS powered intervention/project can define how best to support their own population and staff needs. Task workflow design can be tailored to meet the objectives of the study/intervention program. For example, study group allocation processes (i.e. treatment/control groups) are designed in advance to securely regulate access to specific trial arm processes and task completion. Additionally, the system can be programmed to allow participants to modify information using an embedded inline editor (see Figure 2) or generate personalized and customized examples or skill demonstration media by “piping” information throughout program content (see Figure 3).
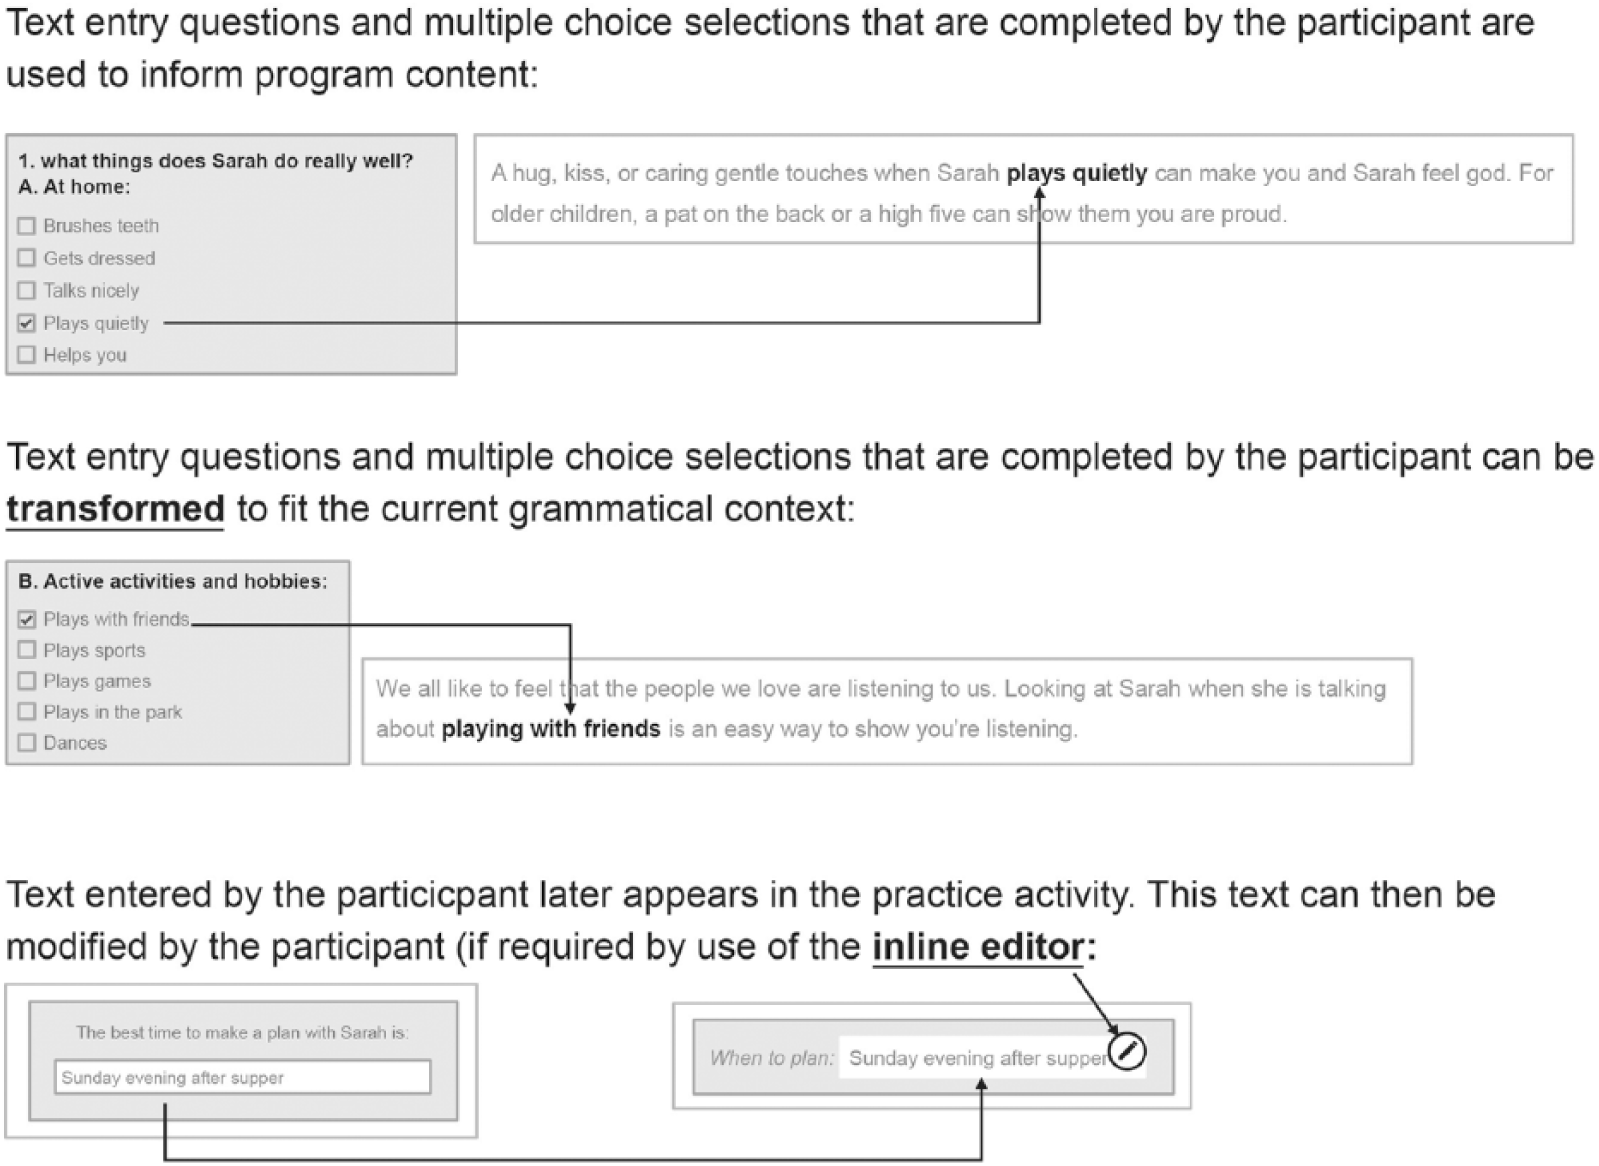
Example of piping and transformational piping in IRIS. End user input and answers are piped into coaching scripts or later aspects of the workflow.
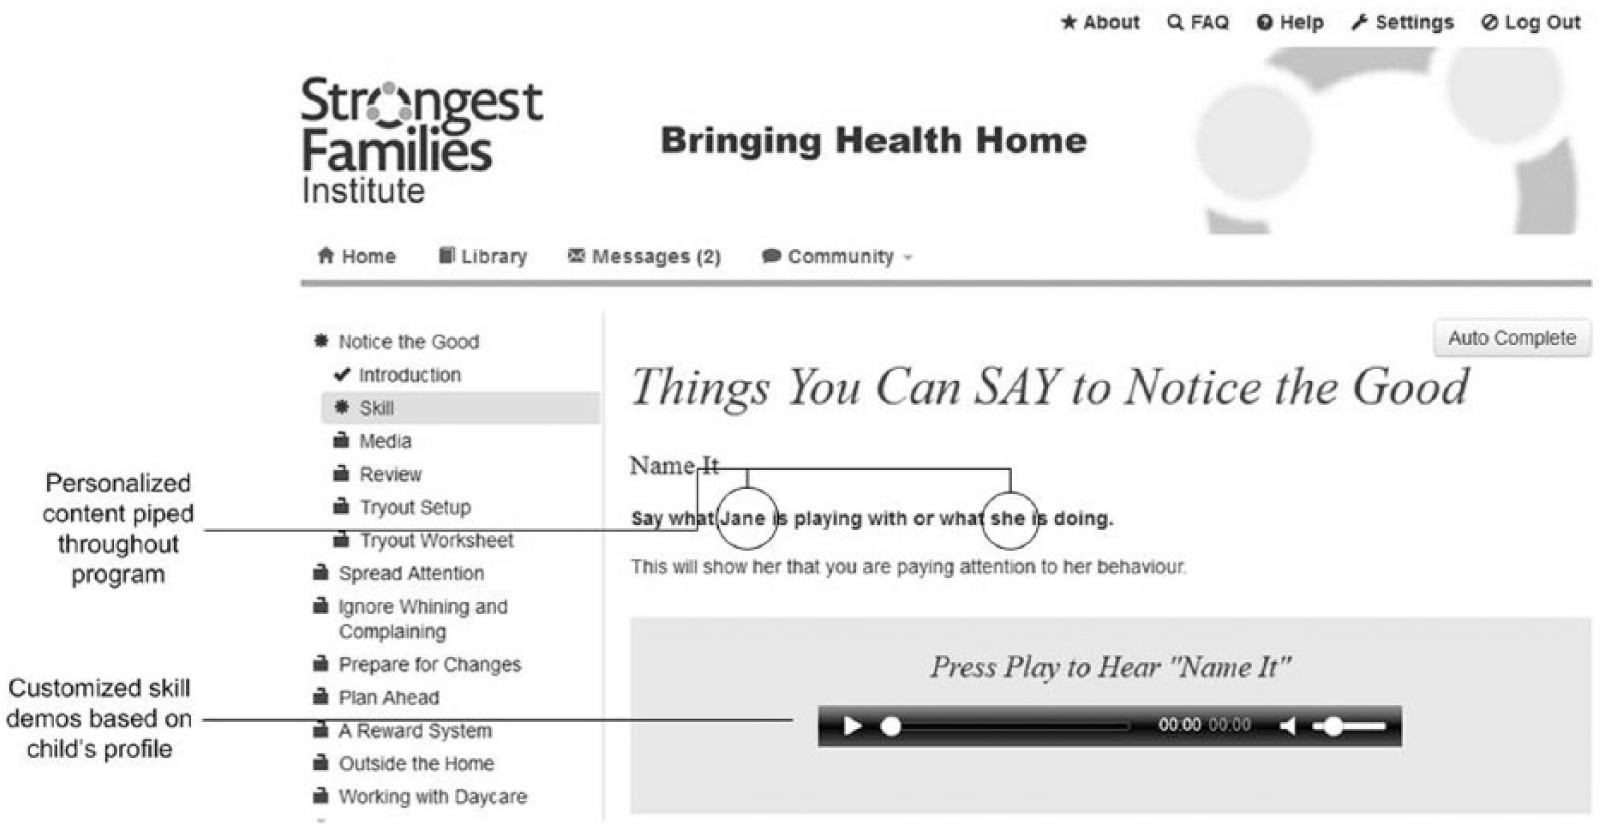
Example of piping in personalized skill demonstration media throughout program content.
The platform captures a log of all activity (e.g. number of attempts at practice activities, time on task, and frequency of staff/participant contact) not just overall site analytics. This information can be fed back through the platform in real-time to adaptively support improved user engagement, both for participants and staff. Figure 4 provides an example of a real-time report that can quickly summarize participant progress and support staff task management.
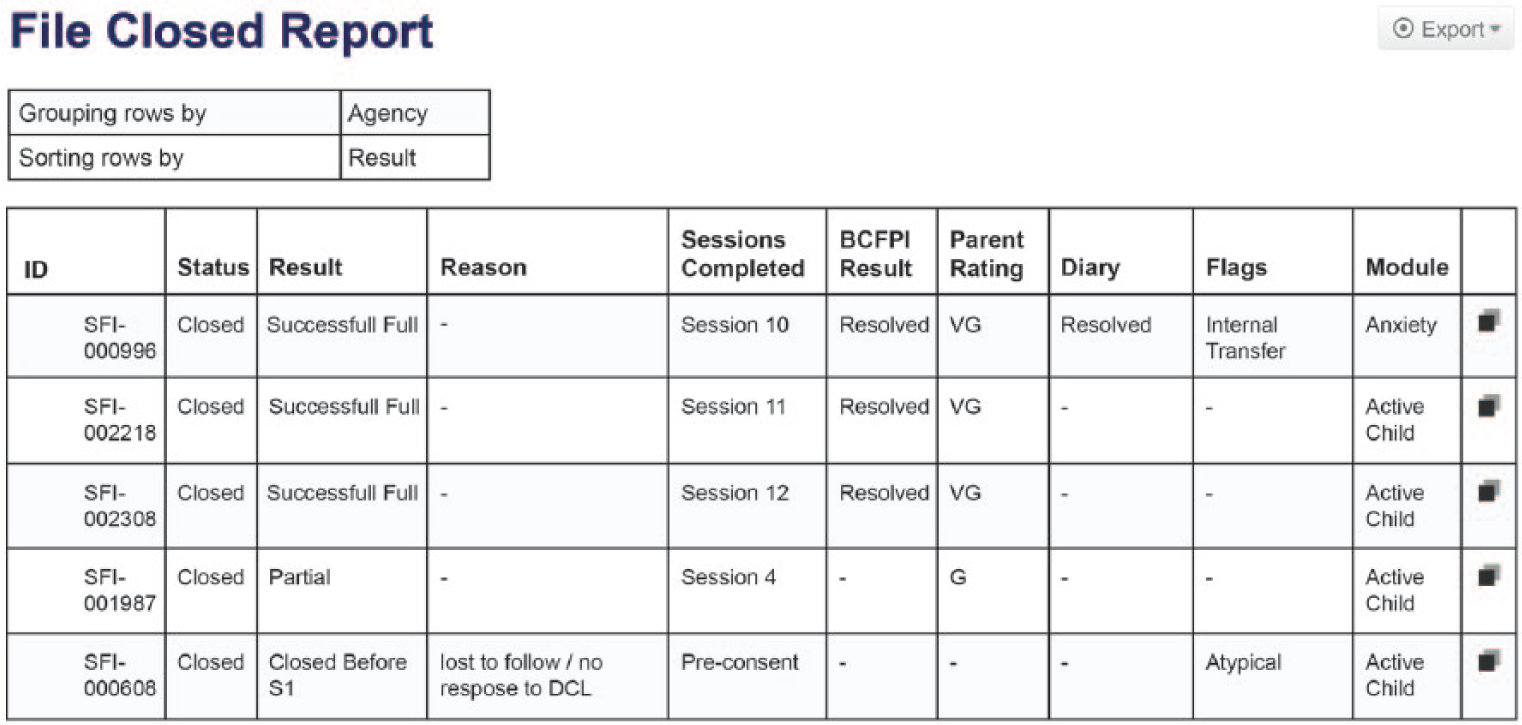
Example of a SFI care delivery staff report. A combination of participant and staff data was fed into a summary report template to help identify where participants and staff need additional support or where treatment fidelity or adherence issues are arising.
Reminders, notifications, tailored suggestions, and automated prompts can be configured to help users stay on track. Each project can assign participant and staff access rights to specific advanced communication features (e.g. file sharing, discussion boards, and “ask the expert”). Staff users can query information, generate custom reports (see Figure 3), and create personalized emails and letters. Selected datasets can be exported via standard comma-separated values (CSV) file format for additional analysis.
Objectives
Each IRIS powered project conducts usability testing relevant to their unique delivery context and end user participant population. 19 To evaluate the platform globally as part of an internal quality control processes, 20 we pursued four key performance questions: (1) How “usable” and “learnable” is IRIS for Staff and Administrator users? (usability/satisfaction) (2) Do Staff and Administrative user groups differ in their perceptions of IRIS’ usability and learnability? (3) How much site downtime do IRIS users encounter and how quickly does the software recover (availability)? and (4) How often do IRIS users experience lagging and slow response times when visiting IRIS powered sites (responsiveness)?
Methods
A combination of system performance monitoring and cross-sectional survey design 21 were employed to develop a more comprehensive view of platform stakeholders needs and focus on aspects of the platform that could be enhanced during future development. 22
Measures
The System Usability Scale
The System Usability Scale (SUS) is a highly reliable tool23,24 designed to solicit subjective feedback on overall usability and user satisfaction. The questionnaire provides 5-point Likert scale response options from 1 (Strongly disagree) to 5 (Strongly agree) for 10 items. Items 1, 3, 5, 7, and 9 are positively worded and items 2, 4, 6, 8, and 10 are negatively worded. The SUS has been demonstrated to be effective in discriminating good and bad usability features even with small sample sizes (<10). Rating categories for SUS scores are as follows: 0–64 is unacceptable, 65–84 is acceptable, 85–100 is excellent, with a score of 82 representing the likelihood to recommend (LTR) threshold Promoters (i.e. people likely to recommend your product) have an average SUS score of 82, whereas Detractors (i.e. people who would not recommend a product) have an average SUS score of 67. 25 Factor analysis of SUS item structure supports extracting additional information through two sub-scales: an 8-item “Usability” and 2-item “Learnability” scale. 26
Application performance management (APM).
New Relic is a software-as-a-service (SaaS) third-party plugin that can be integrated into a web application to monitor key application performance metrics.27–29 New Relic (Lite Tier) tracked the following performance indicators:
Availability (i.e. % of time the IRIS applications were able to be accessed; also known as “uptime”),
Load time (i.e. the average amount of time (in seconds) it takes a page to load on the site, from initiation of the page view (e.g. click on a page link) to load completion in the browser), and
Application Performance Index (Apdex). 30 Apdex is an open standard 31 for reporting and comparing the performance of software applications. The Apdex converts raw use data into a uniform metric to help analyze the degree to which the software’s performance meets user expectations. The Apdex target time [T] was set at the industry standard 5 s where all response times that took less than the target 5 s were considered “satisfactory” to the user (i.e. (Satisfied Count + Tolerating Count/2)/Total Samples). Based on research, users will tolerate response times that are up to 4 times the target time. Thus, response times greater than 5 s but less than 20 s were considered “tolerated” by users, and those greater than 20 s were considered “frustrating” to users. Apdex scores are assigned the following ratings: a score of 0.94–1.00 = excellent, 0.85–0.93 = good, 0.70–0.84 = fair, 0.50–0.69 = poor, and 0.00–0.49 = unacceptable. 32
Procedures
SUS
Criterion sampling, 33 a purposive sampling strategy frequency used in quality assurance evaluations was used to identify a pool of potential respondents. The criterion for inclusion was that respondents had to have used IRIS as a Staff or Administrative user within the previous 6 months (May 2014–October 2014). A total of 44 users were identified and asked to complete the SUS online via SelectSurvey as well as project-based questions. The two user groups were included because they perform different roles within each IRIS intervention and interact with the platform differently. Administrators author and configure intervention workflow prior to deployment while Staff (researchers, coaches, and clinicians) monitor treatment progress and manage staff tasks during intervention delivery. Using a modified Dillman 34 protocol, all potential respondents were emailed a link to the questionnaire and asked to complete the survey within 1 week. An email reminder was sent 2 days before the deadline.
Application performance management (APM)
Two of the 11 IRIS sites were purposively selected for application performance monitoring via New Relic. These two test sites (see Table 1), Breathe and fetal alcohol spectrum disorder (FASD)), were selected because (1) they were the most recently deployed sites on IRIS Version 4.0.1, (2) they incorporated more persuasive technology features than other sites (i.e. more complex tasks would be performed), and (3) were expected to have the highest number of active users (i.e. higher site traffic) during the testing period. Results from the two selected sites would provide the most conservative estimate of how IRIS was performing under the heaviest expected workload. There are no established recommendations for establishing performance baseline of network and software although the common practice is to review metrics at least over a 7-day period. 35 The authors agreed that 3 weeks per month of continuous monitoring provided a more robust analysis of performance over time—particularly since test case sites were only recently deployed and levels of use were expected to vary. New Relic (Lite Tier) was installed on both sites providing continuous monitoring of the application between 8th September and 5th October 2014. Detailed weekly analytics summaries were provided for free by New Relic.
Analysis
Descriptive analysis of demographic and individual SUS questionnaire items were conducted in SPSS (Version 21) to examine measures of central tendency and variability across user groups (i.e. Staff and Administration) and level of use (e.g. frequent users and infrequent users). Individual participant’s responses were converted to 0–100 percentiles as per SUS guidelines 36 and scored by comparing them to standard rating scales. 37 The mean SUS score for all participants was calculated. LTR was determined by comparing overall mean SUS score to industry thresholds (e.g. a SUS of 80 represents the “likelihood to recommend” threshold). Weekly performance analytics provided by New Relic were compiled in SPSS and examined for variability.
Results
Demographics
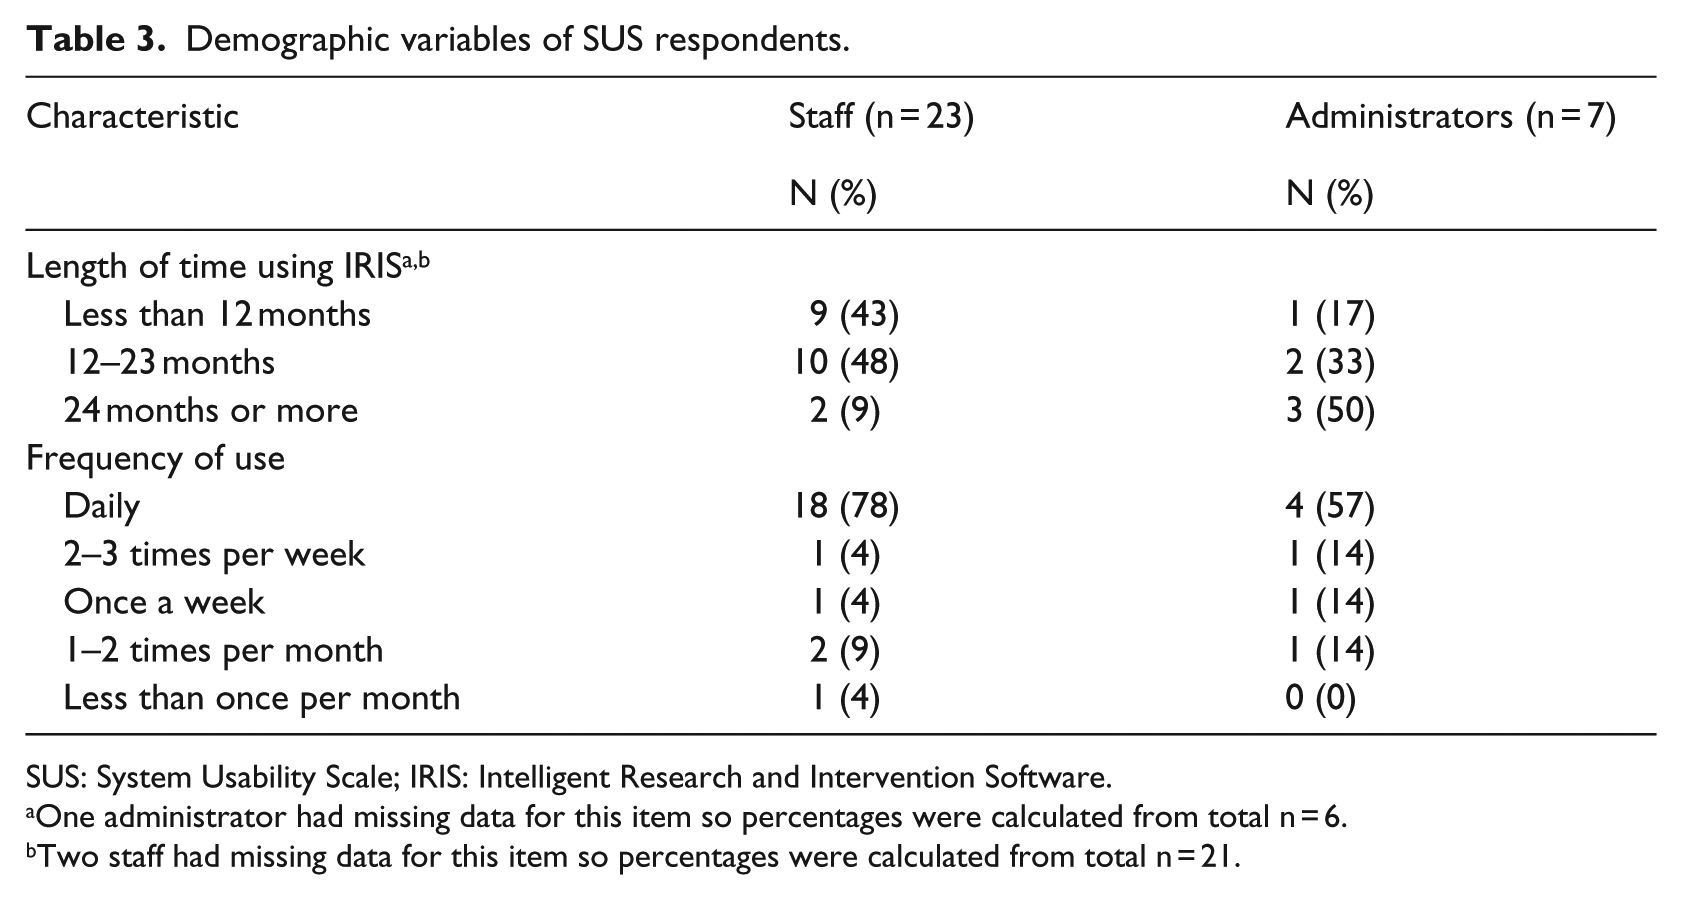
A total of 33 Staff and Administration users completed the SUS questionnaire (response rate: 61%). Three respondents who each had 1 item with missing data on the SUS portion of the survey were excluded from analysis. In all, 23 percent of included respondents (n = 7) were identified as “Administrators” and 77 percent (n = 23) as “Staff” (see Table 3). There was large variability in the length of time respondents had been using IRIS. The mean number of months using the platform was 15.67 (standard deviation (SD) = 10.94; 95% confidence interval (CI): 11.34–20.00, n = 27). Two respondents had only been using the system for 3 months while four others had been using the system for 30 months or more. The sample was also diverse in terms of the frequency with which users interacted with IRIS. In all, 73 percent (n = 22) of the participants reported using IRIS “daily” and 13 percent (n = 4) used it less than once a week.
Demographic variables of SUS respondents.
SUS: System Usability Scale; IRIS: Intelligent Research and Intervention Software.
One administrator had missing data for this item so percentages were calculated from total n = 6.
Two staff had missing data for this item so percentages were calculated from total n = 21.
System usability and satisfaction
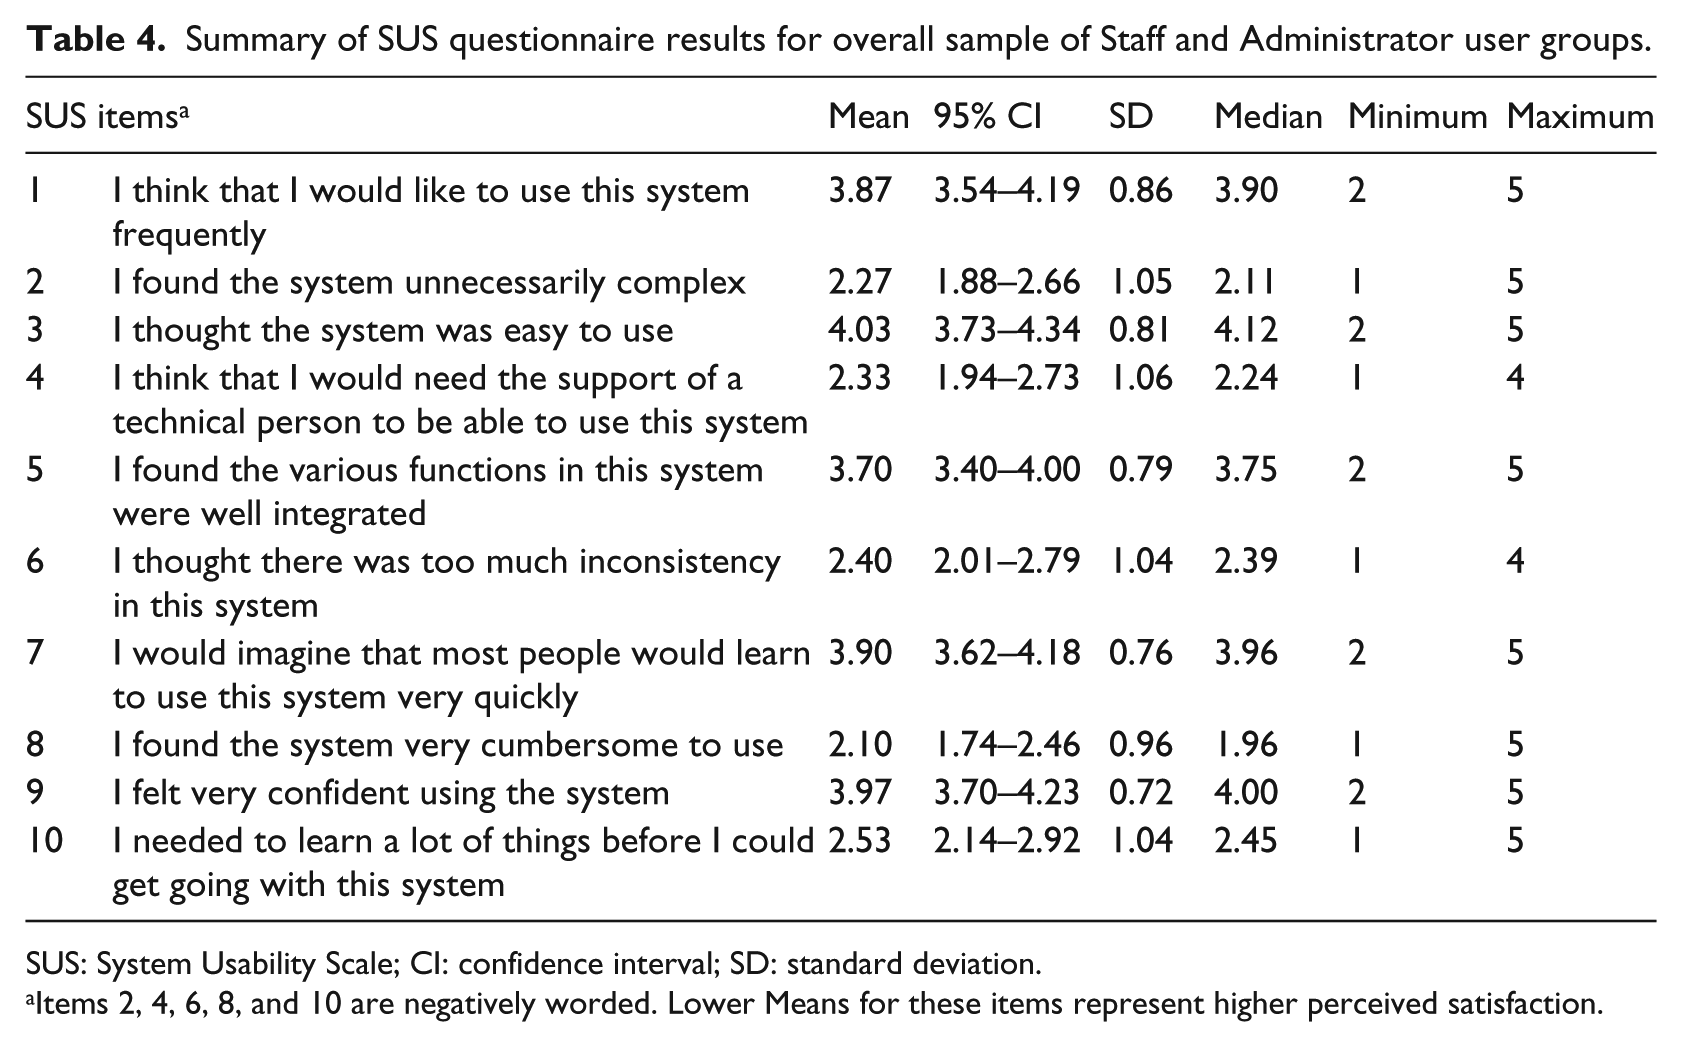
Overall, Staff and Administration users felt IRIS performed well. The group mean for overall SUS score was 70 an “Acceptable” rating based on standard SUS. 38 The industry benchmark SUS score of 80 for users to more likely be “promoters” of your product was not met. The mean score for the “Usability” sub-scale was 82 and the mean score for the “Learnability” sub-scale was 61. Individual item means are reported in Table 4. The majority of users had a favorable opinion about IRIS in terms of how confident they felt using the system (Item 9) and ease of use (Items 3 and 7). The need for technical support (Item 4) and the need to learn a lot of things before using the system (Item 10) were two items in which respondents indicated concern. Independent samples t-tests were conducted to compare individual SUS scores for Staff and Administrator groups and for users with less than 12 months experiencing using IRIS and those with more 12 months or more. There was no significant difference in SUS scores for Staff (M = 70.2, SD = 15.2) and Administrator (M = 67.5, SD = 20.5) user groups; p = 0.705. There was no significant difference in SUS scores for those using IRIS for less than 12 months (M = 72.5, SD = 16.8) and those using it for 12 months or more (M = 68.1, SD = 16.1); p = 0.496.
Summary of SUS questionnaire results for overall sample of Staff and Administrator user groups.
SUS: System Usability Scale; CI: confidence interval; SD: standard deviation.
Items 2, 4, 6, 8, and 10 are negatively worded. Lower Means for these items represent higher perceived satisfaction.
Performance monitoring
IRIS availability experienced by users was high with the sites being available 98.85 percent (Site 1) and 97.06 percent (Site 2) of the time during the testing phase. Overall performance measures are summarized in Table 5. Weekly averages for Load times never exceeded 1.61 s. Weekly Apdex scores (efficiency) ranged from 0.99 to 1.00 (“Excellent” rating) indicating the application responded to users within 5 s 99–100 percent of the time. These threshold response times did not vary significantly across sites, with the widest weekly discrepancy between Sites 1 and 2 being only 0.86 s. Apdex ratings were consistent across 3 weeks of the testing period confirming reliability over time.
Results of performance monitoring metrics for two IRIS sites over 3 week testing.
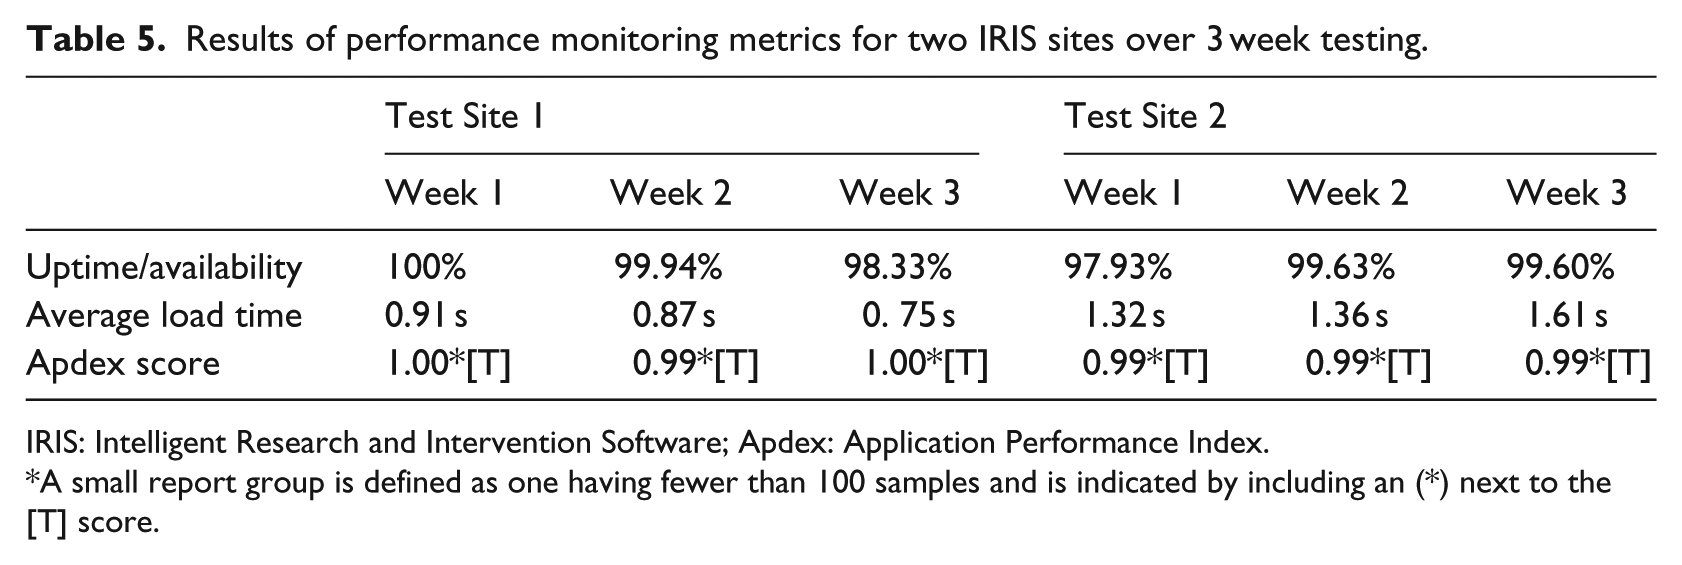
IRIS: Intelligent Research and Intervention Software; Apdex: Application Performance Index.
A small report group is defined as one having fewer than 100 samples and is indicated by including an (*) next to the [T] score.
Discussion
Performance problems and perceived eHealth platform barriers need to be addressed before they threaten an interventions viability and scalability. 38 The average overall SUS score across Staff and Administration participants in this study was positive (an average SUS score of 70), but slightly below the “likely to recommend” threshold. However, sub-scale analysis revealed a significant difference in overall perceptions of “Usability” (mean score of 82) compared to overall perceptions of “Learnability” (mean score of 61). This suggests that while usability perceptions were quite good, more diagnostic analysis of Staff and Administrative user training and technical support needs is warranted.
Although research has consistently shown that SUS scores are correlated to length of time using a product, our study did not find any significant differences related to length of time using IRIS. The SUS provides a reliable rating of general usability and user satisfaction but is not a diagnostic tool for identifying specific product improvements to be undertaken. As Administrators and Staff use IRIS differently in each project, we will need to balance these global findings with project-specific variables that may affect usability assessments. While the generalizability of these findings may be limited to the specialized audience of IRIS projects, they do point to needed future work in exploring learnability and training factors that are a function of both the platform and implementation context.
Examining standard web-performance metrics for eHealth interventions needs to be a routine part of usability testing. The public’s high expectations for fast and engaging web experiences are becoming critical factors for positive health intervention outcomes39,40 but are underreported and overlooked measures in the majority of eHealth intervention research. Our preliminary examination of technical performance across two test sites indicated that IRIS is a responsive, efficient and reliable platform for end users. The advanced data analytics tools provide important data about what users experience in eHealth interventions from a technical standpoint and how that can be mitigated so as not to interfere with treatment adherence, outcomes and long-term sustainability. 41
Although the SUS is reliable even with small sample sizes, not all IRIS Staff and Administrators who have worked on the platform responded to requests for feedback, introducing greater potential for rater bias. 42 By including multiple user groups with a range of experience with IRIS, we believe the sample is still representative. Finally, performance monitoring involved a cross-sectional snapshot of only two test sites over a 3-week period. Although this time period met recommendations we feel concurrent, longitudinal analysis over multiple IRIS sites will help us better understand how the system performs under different conditions and usage loads. We plan to use these results to develop an ongoing performance monitoring plan for testing IRIS under different conditions. The free version of New Relic used in this analysis did not allow us to parse out the causes of downtimes (i.e. network failure vs server failure vs software failure) 43 but those analytics are available for subscribed users. Performance monitoring will be incorporated into IRIS site usability analysis moving forward.
Conclusion
Preliminary evaluations of IRIS through performance monitoring and usability analysis suggest it is a reliable and learnable environment for staff and administrator users where eHealth interventions can be deployed with minimal software performance errors. Many IRIS powered interventions have only recently been deployed promising greater capacity in the future to examine usability across interventions and clinical populations. Future interdisciplinary work should focus on the intersection of traditional usability and human factors research with best-practices for software performance monitoring. The “dependability” and “usability” of systems are not isolated constructs. A clearer picture of how these core attributes are dynamically related remains a vital area of future research.
Footnotes
Declaration of conflicting interests
The author(s) declared the following potential conflicts of interest with respect to the research, authorship, and/or publication of this article: Drs. McGrath and Lingley-Pottie may incorporate the IRIS platform in the future.
Funding
The author(s) disclosed receipt of the following financial support for the research, authorship, and/or publication of this article: This project is funded by an operating grant from the Canadian Institutes of Health Research (CIHR No.103146) and an Innovacorp Early Stage Commercialization Fund grant. Dr Amanda Newton holds a CIHR New Investigator Award. Dr Patrick McGrath holds a Canada Research Chair (Tier 1) in pediatric pain.