
Abstract
This article presents a systematic review of the literature on information visualization for making sense of personal health information. Based on this review, five application themes were identified: treatment planning, examination of patients’ medical records, representation of pedigrees and family history, communication and shared decision making, and life management and health monitoring. While there are recognized design challenges associated with each of these themes, such as how best to represent data visually and integrate qualitative and quantitative information, other challenges and opportunities have received little attention to date. In this article, we highlight, in particular, the opportunities for supporting people in better understanding their own illnesses and making sense of their health conditions in order to manage them more effectively.
Introduction
When dealing with patients’ data, medical practitioners may be faced with a large amount of diverse information, such as examination results, conditions as reported by patients, treatment plans, and protocols. Making sense of all this information is a challenging process. The same applies to people as they are becoming more aware of and taking greater responsibility for their own health. People diagnosed with particular conditions need to make sense of and understand these in order to manage and improve their health and quality of life. They also need to understand their conditions in order to better communicate with their medical practitioners. In many countries, people are becoming more in control and in touch with their health records and are being encouraged to do so by health-care services (e.g. “no decision about me without me” 1 ). There is great potential for information visualization tools to assist both practitioners and patients to make sense of such data. Information visualizations are interactive visual externalizations of abstract data 2 that can assist users in making sense of large amount of information because they exploit people’s natural perceptual abilities.
Information visualization tools represent rich, complex information relating to a patient’s health in ways that support clinicians’ and patients’ sensemaking. These visualizations may represent relationships between factors, such as risk profiling for breast cancer patients 3 or variations over time (as is common in health charts that record changes in one or more variables over time); for example, pregnant women are often encouraged to maintain a kick chart to monitor their baby’s activity; one web site for mothers notes that “After a few days you will begin to notice a pattern of movements that you can share with your doctor, and that will alert you if something is wrong.” 4 In this article, we review the state of the art in information visualizations to support people (practitioners and patients) making sense of personal health information. The reported research draws from the areas of information visualization, Human Computer Interaction (HCI), health psychology, and medicine. The following application themes have been identified and reported: treatment planning, the examination of medical records, the representation of pedigrees and family trees, communication and shared decision making, and life management and health monitoring. These themes are arranged and discussed from the perspective of two dimensions: intended users and research challenges. From the literature, we were able to identify that there are three main user categories, namely, practitioners, practitioners with patients, and patients, and three research focus categories, namely, data visualization, capturing lifestyle, and goals and tasks. Examples from the literature will be used to illustrate each of the themes. By locating the themes on these two dimensions, we have highlighted a gap in the literature, namely, the application of information visualization to assist people in perceiving and making sense of their medical conditions. For patients, sensemaking is related not only to the medical data but also to their overall life experiences. Patients live with their illnesses and conditions. The challenge becomes how can we incorporate these experiences into the design of information visualization tools? The review highlights this as a fruitful area for further research.
Background
This article is a systematic review of the application of information visualization to making sense of personal health. To contextualize this review within the wider research space, we give an overview of the domains of information visualization and sensemaking, both established research areas. We also specify what we mean by personal health in the context of this article, in order to set boundaries and avoid ambiguity.
Information visualization
Information visualization is a part of an overall visualization field that incorporates both information and scientific visualization. Debates are going on whether these two should be merged or defined separately. 5 For the purpose of this review, we consider them to be different and focus on information visualization rather than scientific visualization.
Scientific visualizations are technologies that visually represent scientific concepts such as molecules, parts of the human body, the earth’s properties, or natural phenomena, 6 mostly in three dimensions (3D). These visualizations are sometimes referred to as confirmatory analysis visualizations 7 due to their goal, that is, the confirmation or rejection of a particular hypothesis. Information visualizations, sometimes referred to as abstract visualizations, 8 are visualization tools to visually represent abstract concepts that are not inherently spatial, since the associated data have no clear physical representation. The represented data may highlight visual patterns, such as clusters, which reveal concepts extracted from the data. Keim 7 classifies these visualizations as exploratory analysis visualizations, the goal being to assist the user in identifying a hypothesis. The power of these tools derives from their ability to represent a large body of information at once, including properties and internal relations. For example, a patient has a particular disease (e.g. circulatory system disease, hematologic disease, infectious disease) and is either male or female; both the disease and the gender can be encoded visually, for example, by using color and shape. This information can be gained at a glance due to people’s natural perceptual abilities. These tools are used by people ranging from trained professionals, such as medical practitioners, to nonspecialist users, such as people trying to manage and make sense of a health condition.
One of the most commonly used definitions is that information visualization is the interactive visual representation of data on computer-supported tools. 6 Spence 2 defines this as the externalization of the data. The opposite of externalization is internalization. It results from users’ interaction with the external representations: users make sense of the represented concepts and hence build internal models of the domain. 9 Recognizing the cognitive dimension, Spence 2 defines visualization as a cognitive activity that involves the formation of mental images, and Card et al. 6 refer to visualization as an “amplifying cognition.” This is part of a process known as sensemaking.
Making sense through information visualization
Sensemaking is the process of finding meaning from information. 10 Pirolli and Card 11 present sensemaking as being organized into two interconnected loops: the information foraging loop and the sensemaking loop. The foraging loop involves seeking, filtering, and extracting information, while the sensemaking loop involves an iterative process in which a conceptualization that best fits the evidence at hand is developed. Klein et al. 12 explain this process in terms of a data–frame theory. According to this theory, when engaged in sensemaking, people explain elements by fitting them into a structure that links them to other elements that have resulted from their past experiences. These representations, whether referred to as frames 12 or schemas, 13 are subjective lenses through which people view, filter, and structure the data. Sensemaking is recognized as a complex activity: for example, in 2009, a workshop was organized in association with the conference on Human Factors in Computing Systems (CHI) to discuss how people make sense of complex sets of information. 14 Making sense of personal health, the focus of this article, has received little attention in the sensemaking literature. It is a compound process that takes into account various interconnected components ranging from medical readings to the surrounding environment and associated lifestyle.
Application domain: making sense of personal health
This review does not cover visualizations of scientific processes such as the ones revealed by medical imaging or representations of the human body.15,16 It is concerned with neither the information visualization tools for management aspects of health care, such as managing resource consumption, 17 nor the analysis of medical data. 18 Rather, it focuses on visualizations of information relevant to a patient’s condition, which covers activities such as managing, understanding, and communicating about a patient’s medical problems. Prior to discussing the themes and associated design challenges that we identified from the literature, we present an overview of the systematic review methodology followed.
Review methodology
The objective of this review was to identify the research themes and associated design challenges related to the application of information visualization to personal health. We conducted a systematic literature review across the areas of health psychology, computing, HCI, information visualization, and medicine. What follows is an overview of the information sources, search terms, and selection criteria used. In addition, we give an overview of the review process itself.
We adopted an iterative search strategy. To identify relevant literature, we relied on both nonspecific search engines, such as Google Scholar, and scientific libraries, such as the ACM Digital Library, the Web of Science, Medline, and Science Direct. We started this review by relying on keyword-based search results; as relevant literature emerged, we were able to identify additional information such as key publication venues. For example, two of the most relevant sources were the journals of Artificial Intelligence in Medicine and the Conference on Human Factors in Computing Systems. We therefore also searched these venues for additional literature.
Apart from relying on keyword-based searches, we also used forward and backward citation searches, that is, reviewing the references cited in articles identified earlier in the review process and searching for publications that cited identified articles. In addition, we also looked at publications by seminal authors. At the beginning of the review, a combination of very high-level keywords was searched for in the information sources discussed earlier. These keywords were divided into two categories: technology-oriented and domain-related keywords. The technology-oriented keywords were “information visualization,” “visualization,” “sensemaking,” and “making sense”; the domain-related keywords were “medicine,” “personal health,” “health care,” and “patients.” The search strings used in our search comprised a combination of the two categories. Examples of search strings are “information visualization and medicine,” “information visualization and patient health,” and “visualization and health care.” As the systematic review continued, the search terms became more specific, particularly in relation to the application domain. Keywords such as “pedigrees,” “health management,” and “electronic health records” were used. All identified research themes are discussed in detail in the following section.
The selection criterion for whether to include a study in this review was whether it discussed the use of visualization technology to assist patients or practitioners in making sense of and managing patients’ medical data. No year limit was set for inclusion. Studies that discuss people’s overall healthy lifestyles, such as exercise and diet, were not included. Similarly, studies that discuss the representation of medical images were not included. In particular, what we were looking for when selecting studies to include in the review were ones where the focus was on making sense of patients’ abstract data. As the process went on, various research categories started to emerge. The process continued until a saturation point was reached, where we were able to categorize the existing research into the five themes reported next.
Information visualization applications to personal health
Through the literature review, we identified five main research trends: treatment planning, examination of patients’ medical records and experiences, representation of pedigrees and family history, communication and shared decision making, and life management and health monitoring. These themes are arranged across two dimensions: users and research challenges, as shown in Table 1.
Theme categorization across two dimensions: users and research challenges.
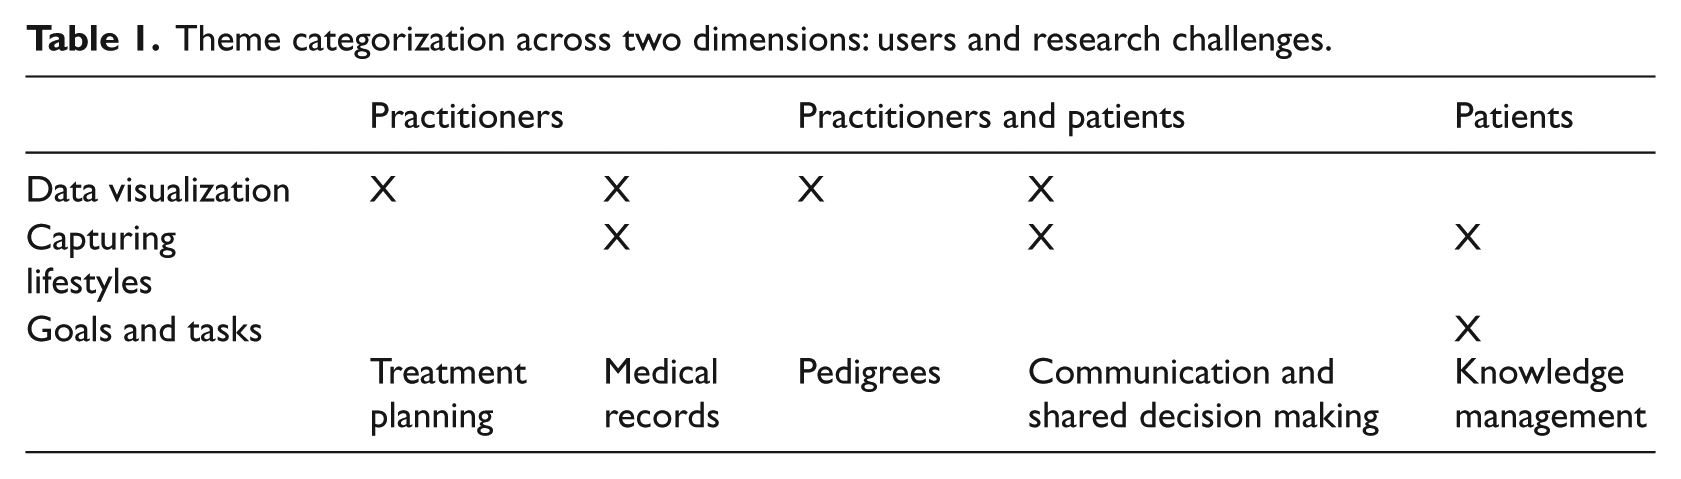
The users’ dimension indicates the primary users of the associated information visualization application theme. Users are divided into three categories: practitioners, practitioners and patients, and patients. As shown in Table 1, the first two themes (described in sections “Treatment planning” and “Examination of patients’ medical records and experiences”) have been designed to focus on practitioners as the primary users. The third and fourth themes (described in sections “Representation of pedigrees and family history” and “Communication and shared decision making”) focus on both practitioners and patients as they are designed to facilitate communication between both parties—in other words, to assist practitioners, mostly physicians, in helping patients in understanding a particular concept. Finally, the fifth theme (described in section “Life management and health monitoring”) focuses on patients as the primary users as they are designed to assist patients in managing their lifestyles in order to cope with chronic conditions.
The second dimension, “research challenges,” was also identified from the literature. This has been divided into three categories: data visualization, capturing lifestyles, and goals and tasks. The first, data visualization, focuses on research that has a very technical focus—mainly on finding visual representations to communicate the desired quantitative concepts. The second, capturing lifestyles, focuses on research that has the goal of capturing data—in this case, data that are largely qualitative as they represent people’s lifestyles. Finally, goals and tasks mainly focus on identifying the goals and tasks of users that the visualization tools are supporting and on the complexity of the problem. Some themes address more than one challenge. Table 1 shows that research to date on the first and third themes, treatment planning (section “Treatment planning”) and the representation of pedigrees and family history (section “Representation of pedigrees and family history”), addresses the data visualization challenge, whereas the second and fourth themes, examination of patients’ medical records (section “Examination of patients’ medical records and experiences”) and communication and shared decision making (section “Communication and shared decision making”), address two research challenges: data visualization and capturing lifestyles. Finally, the fifth theme, life management and health monitoring (section “Life management and health monitoring”), addresses the challenge of capturing lifestyles and goals and tasks.
In the following sections, we discuss each of the identified themes and the associated users and research challenges. The discussion is based on representative examples from the literature. Where possible, we link the design of visualizations to their use, and in particular, to how they support their users’ sensemaking activities.
Treatment planning
Treatment planning is one area in which the role of visualizations has been investigated. While treatment planning is not traditionally regarded as sensemaking, there is an important element of using the planning to make better sense of the patient’s condition and possible treatments. Practitioners follow clinical protocols and guidelines to devise a course of treatment for each patient. These are normally represented in the form of flowcharts, decision tables, or simply plain text. The following are the two examples of information visualization tools for the representation of treatment plans. Both have been designed to represent plans written in Asbru, 19 a plan representation language for clinical guidelines.
Asbru can be used to express temporal clinical protocols as skeletal plans that can be instantiated for every patient individually. For each plan, the following can be specified: preferences, intentions, conditions, effects, and the plan body, that is, the actions that are to be performed if the preconditions hold. Plans also have temporal constraints that need to be taken into account. Asbru as a language is too technical for use by physicians. As a result, visualizations were created to overcome this technical barrier and represent such plans in a more intuitive manner.
Kosara and Miksch 20 developed AsbruView, a visualization to assist in handling treatment plans in Asbru. AsbruView relies on a graphical metaphor where plans are represented as a running track, which the physician “runs” along while treating the patient. This visualization was designed to deal with the complex structures associated with a plan, such as the types of different plans, that is, sequential, compositional, parallel, random order, and cyclic. It also supports the decomposition of plans into sub-plans and deals with temporal uncertainty. This is done through the inclusion of two views: a topological view and a temporal view. The topological view represents the relationship between plans, while the temporal view concentrates on temporal aspects of the plan. A usability study was conducted with six physicians working in different fields to assess its usefulness. Participants were asked to use the system in order to create a plan for their everyday work. Notes were taken by the researcher during the course of the usability sessions documenting participants’ performance and any difficulties they encountered during their interaction with the tool. Participants were asked to fill in a questionnaire following their interaction with the tool. Feedback from the participants was very positive. They all reported finding the metaphors and the different plan types very useful and easy to understand and use. Among other things, they were all happy with the fact that they were able to change a plan’s type easily and at any time and liked the ways in which the system handled temporal uncertainty; see Kosara and Miksch 20 for more details.
CareVis 21 is another visualization developed to represent plans expressed in the Asbru language. Like AsbruView, CareVis supports the use of multiple simultaneous views to cover the different aspects of a plan. The views are based on the concepts of clinical algorithm maps and LifeLines, 22 described below, to deal with time annotations in a more intuitive manner. CareVis supports three views: a quick view, a logical view, and a temporal view. The quick view is more like an overview that represents the most important patient parameters and plan variables; the logical view represents the treatment plans in more detail; and the temporal view focuses on the temporal aspects of the plan. The system was evaluated via two user studies. The first evaluated the prototype through qualitative interviews with physicians. This study pointed to the fact that physicians found the system easy to use and understand. Physicians also found the different views very helpful in working with and exploring work plans. The second study was more specific. Its aim was to test the technique applied by the tool, PlanningLines, in order to visualize temporal uncertainties. A comparative empirical study was conducted in which users’ performance using PlanningLines was compared to their performance using Program (or Project) Evaluation and Review Technique (PERT) charts, a more commonly known technique. The study showed that PlanningLines was better suited for handling temporal task uncertainty.
The challenge when it comes to designing information visualizations to support treatment and therapy plans is in the ways in which the various aspects of the plan can be represented and the manner in which the different plans can be supported. Metaphors (e.g. the running track metaphor of AsbruView) are sometimes used to assist practitioners to make sense of complex, interconnected data. Most of the usability studies reported focused more on performance and little was reported on how these tools assisted the practitioners in making sense of the treatment plan data.
We have found no evidence in the literature that point to the use of treatment planning visualizations for practitioners to communicate with patients. The literature points to the fact that these visualizations have been designed largely for, and evaluated by, health professionals, and the research has focused mainly on the challenges of identifying the best techniques for visualizing quantitative data. Thus, as shown in Table 1, the emphasis of research to date has been on data visualization for practitioners.
Examination of patients’ medical records and experiences
One of the main applications of information visualization for making sense of patients’ health is facilitating the examination of patients’ medical records by clinicians. This supports health practitioners in automatically identifying commonalities, differences, and clusters in the data. 9 Most information visualization support tools allow practitioners to visualize concrete medical data. However, patients’ medical records comprise not only such data but also the stories that people tell of their experiences. These are represented as narratives. We review the work on visualization of medical records and narratives. The systems described in this section are representative of the examples available in the literature rather than an exhaustive list.
Medical health records
Patients’ medical histories and records contain information, including medical conditions, test results, readings, and medication dosages, documented over time. Health-care practitioners are faced with the challenge of making sense of these data. Information visualization tools have been developed to present such information.
LifeLines 22 was one of the first tools to be used for the representation of electronic health records. Its representational structure forms a baseline for many of the tools reviewed in this article, especially those representing time line medical information. LifeLines was originally developed as a general-purpose visualization tool for representing personal histories that were subsequently applied for the visualization of patients’ clinical records. At first, a screen mock-up prototype was created using a medical record that was found on the internet. 23 This mock-up was reviewed by several physicians, leading to very positive feedback. Subsequently, a fully functional system was implemented with input from a physician (a cardiologist). Aspects of the record such as the problem, diagnosis, test results, medications, and allergies are represented as dots or horizontal lines on an interactive time line. Visual encodings such as color and line thickness are used to represent additional information such as importance and severity (see Plaisant et al. 22 and Plaisant and Rose 23 for more details) (Figure 1).
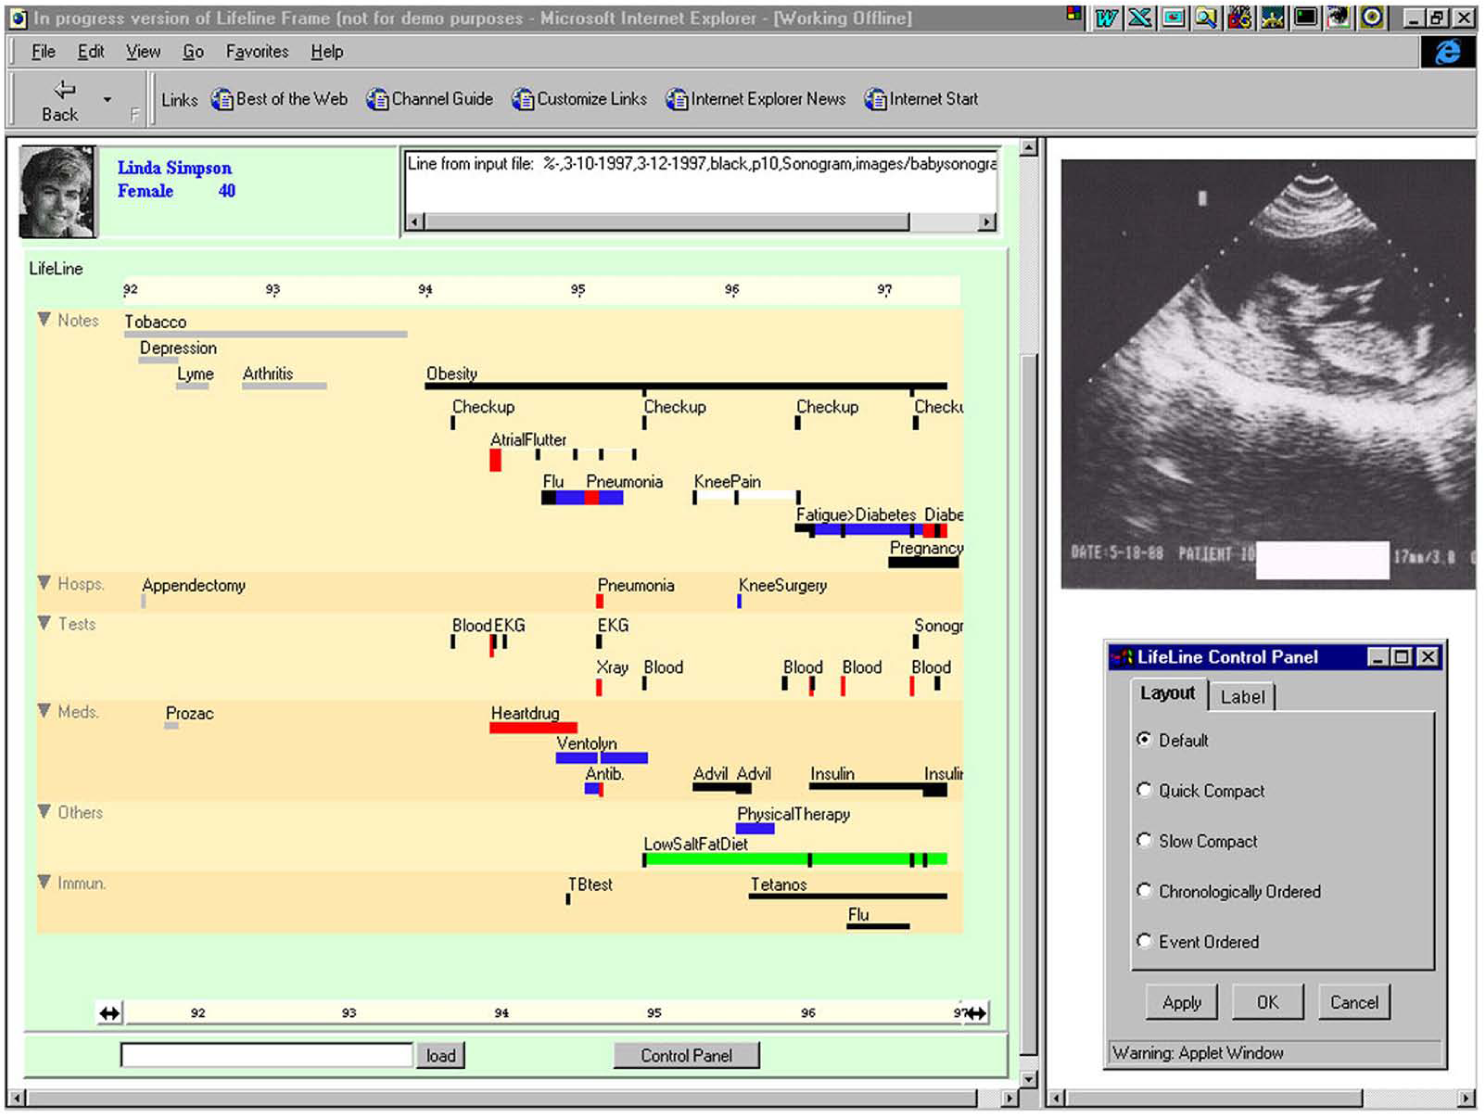
Lifelines 23 —aspects of the record are visually encoded.
LifeLines is a general-purpose visualization tool that has been tailored to the presentation of medical information for individual patients. Other tools such as Patient Record Intelligent Monitoring and Analysis (PRIMA) 24 and InfoZoom 25 have been designed for visualizing patients’ records; however, these tools do not focus on the individual patient’s data, but present the data for multiple patients in parallel, supporting the identification of trends and patterns by clinicians, but not supporting sensemaking on an individual’s health.
LifeLines, PRIMA, and InfoZoom are independent of any domain-specific knowledgebase. Other visualization tools for the exploration of clinical data exploit knowledge-based frameworks and models that rely on computational analysis. An example is Knowledge-based Navigation of Abstractions for Visualization and Explanation-II (KNAVE-II), 26 an intelligent knowledge-based visualization for the exploration and interpretation of longitudinal clinical data. It supports the formulation of temporal queries using a medical domain ontology and allows users to interactively explore the results. In some cases, in addition to examining individual patients’ records, practitioners may find it helpful to examine the data of multiple patients grouped by a particular parameter, such as a particular reading or test result; KNAVE-II supports the simultaneous representation of data for 5–10 patients, grouped by a specific parameter, for example, anemia levels.
The literature highlights two main challenges, both technical. The first is determining the best visual representations for assisting users in making sense of single or multiple patients’ records. The second is developing the backbone technology that is needed for the access and pre-analysis of medical data. We were unable to find concrete examples of how these tools assist practitioners in making sense of such complex data.
Narratives
As discussed earlier, patients’ medical health records are not only based on concrete medical data but also include narratives. 27 These are based mainly on the stories that people tell their health-care providers about their health and associated experiences. The literature points to nurses as playing a major role in collecting patients’ stories. According to Giles, 28 as part of the service they provide, home health-care nurses go to patients’ homes to record and monitor their current state and listen to their accounts of their conditions and how they are dealing with them. Based on this information, the nurse provides a health plan for each patient to follow. In situations such as these, nurses most commonly rely on paper and pen to document the information collected across multiple visits. Mamykina et al. 29 developed CareView (Figure 2) as an information visualization tool that addresses the challenges faced by home health-care nurses in making sense of a patient’s history. It consists of multiple visualizations for representing and recreating historic trajectories from clinical narratives.
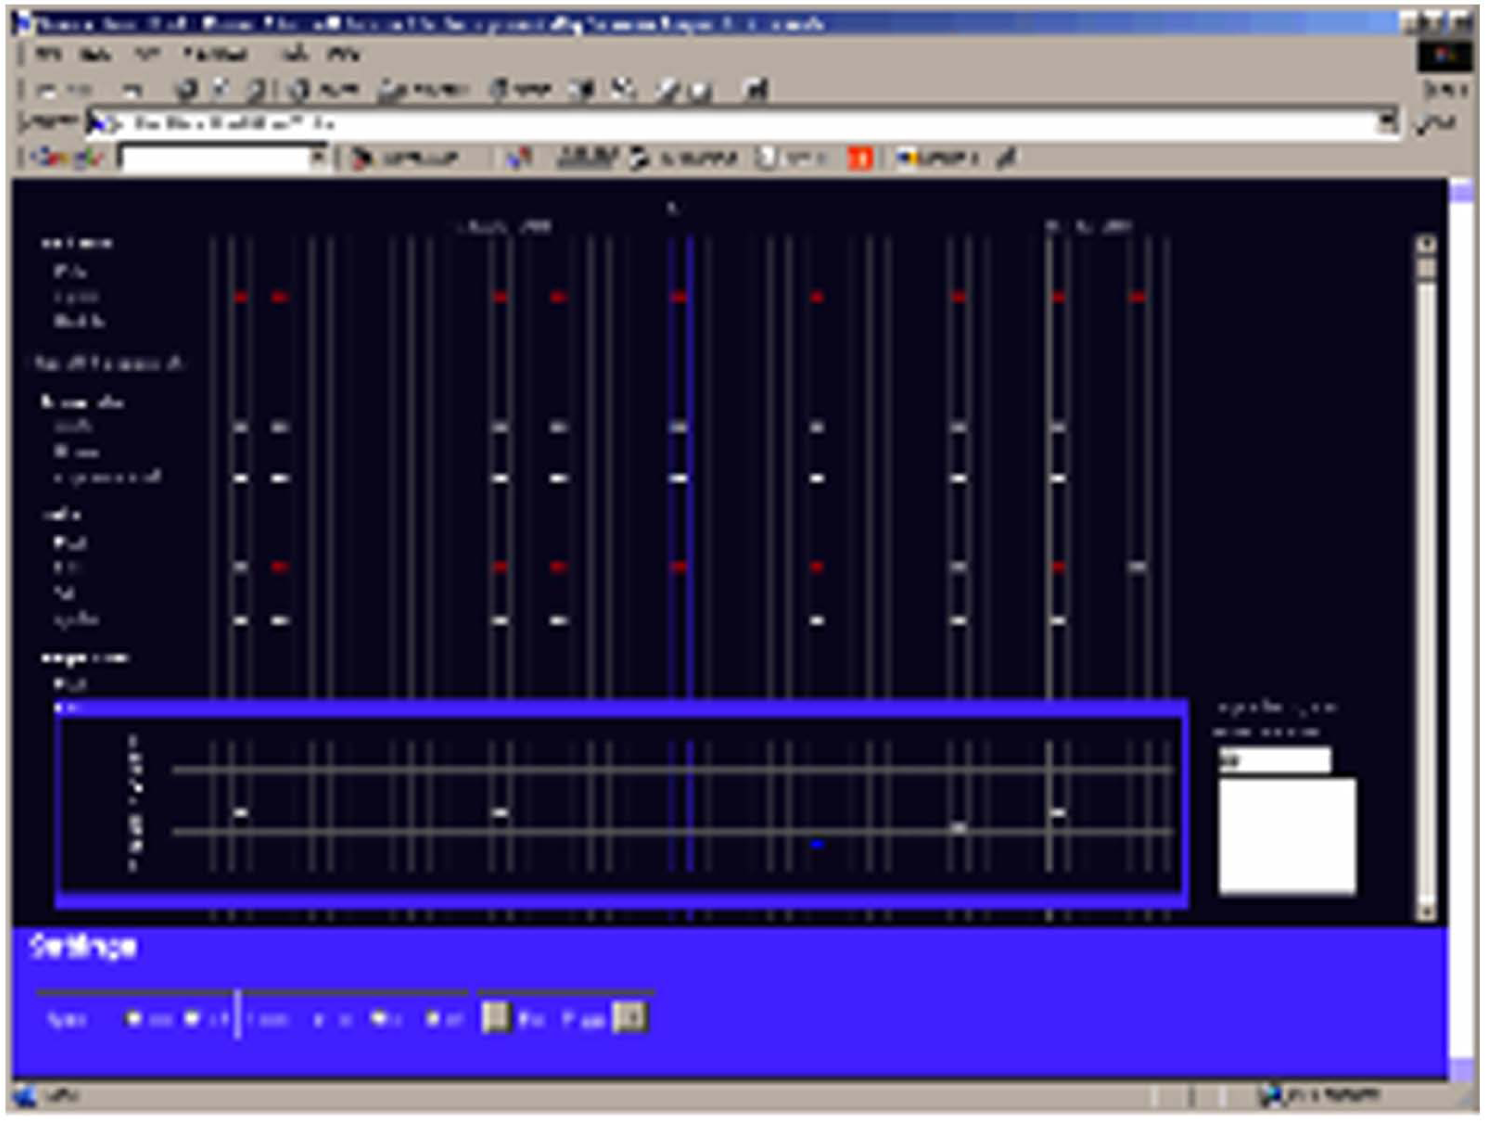
CareView. 29
The representation of quantitative data follows a similar scheme to LifeLines 22 where measurements such as vital signs and lab results are plotted along the x-axis time line. Qualitative data are represented in a similar manner, except that they are decomposed into multiple-choice entries and plotted on the y-axis. The tool also supports fields for freeform text entries and speech recognition to assist nurses in navigating between categories of data. CareView was evaluated and was found to enhance the ability of the nurses to monitor changes over time; however, it failed in painting a “picture of the patient’s conditions as observed at a particular moment” 29 (p. 1150). This was because the visualization tool did not properly support appropriate reconstruction of the narrative. The tool helped users to make sense of changes in values through time, but the evaluation highlighted a further need for effectively representing narratives alongside the quantitative results.
The principal challenges faced in visualizing qualitative data are related to finding effective visual representations and developing algorithms and techniques that will assist in representing these narratives in a meaningful manner without losing the overall storyline particularly since the storyline needs to be preserved in context. In addition, it is important to find ways in which narratives can be integrated as part of the overall medical record representation. As shown in Table 1, the challenges associated with the representation of medical records relates not only to the visualization of the data but also to capturing and representing information on lifestyles.
Representation of pedigrees and family history
Family histories are gaining importance in primary care practices for assessing patients’ medical risks. Family physicians or genetics experts normally collect a patient’s family history through the use of paper- and pencil-based tools such as interviews or questionnaires. When the family history is represented in a tree-like diagram, it is referred to as a pedigree. A genogram is a visual representation of a family history, taking into account not only biological factors but also social and psychological factors. 30 Information such as this is the gateway to recognizing inherited disorders. 31 Tools exist to assist medical professionals in collecting these data. However, as Rich et al. 32 indicate, these tools only reduce the professional’s time by 30–90 min; hence, there is a need for more effective representational tools that will assist the professional in the collection and representation and analysis of the data. 33
Risk Assessment in Genetics (RAGs) 34 is a visualization tool that helps medical professionals in the creation of family trees and risk assessment of breast and colorectal cancers. RAGs was developed following a user-centered design process that takes into account the doctor–patient encounter. In RAGs, family information is entered through a standard data entry form. Once the information has been entered, a family tree can easily be generated where nodes are color coded with the cancer type (Figure 3). The tool is able to generate two types of family trees: one that can easily be understood by the patient (Figure 3, left) and another more complex representation that uses traditional pedigree symbols (Figure 3, right). RAGs evaluates the genetic risk of a given patient by using PROforma, a generic argumentation-based technology for implementing clinical support and guidelines. The interface has been refined through feedback from GPs who have been using this tool with mock patients, but there is little evidence of use in ongoing clinical practice.
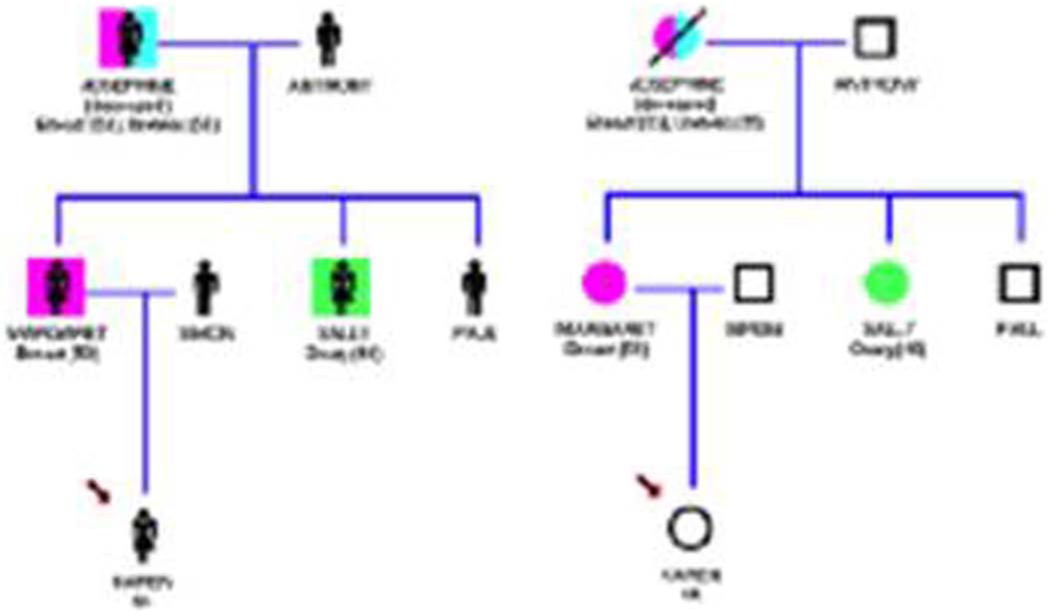
Example pedigree created with the RAGs software. 34
Pedigree Visualization and Navigation (PViN) 35 is an interactive information visualization tool that supports the analysis and printing of hierarchical relations. PViN enables the analysis and comparison of multiple pedigrees and the cross-referencing of individuals that appear in multiple families (e.g. remarriages). The tool also enables context-free drawing that is rendered onto the screen. This tool has been tested by the medical genetics department at Indiana University over the course of several months, where it has proven to be usable and accurate.
As seen from these examples, the visual representations used to visualize pedigrees and family trees have assisted practitioners and patients to better understand the risks associated with hereditary diseases. However, more work needs to be done to explore the potential of interactive information visualization techniques to analyze and make sense of pedigree data.
Communication and shared decision making
In the context of information visualization, efforts are being directed toward determining the best visual encoding for communicating particular concepts to patients. This is necessary because different visual representations may have different impact on patients. Lipkus et al. 36 address this problem by investigating the best cues for communicating risk to people with breast cancer. Within breast cancer, a model known as the Gail model 37 is used to predict a woman’s risk of developing breast cancer. Risk can be communicated as a point estimate, a range, or a point plus range estimate. In their study, they investigated how the different representations affect the ways in which women perceived their risks. In total, 169 women aged 39 and over participated in the study, which took the form of a between-subject experiment where women were randomized to one of the different risk representations. Following the risk communication, participants were contacted 6–8 months later to assess the psychological outcomes related to risk perceptions. The findings showed that giving a point estimate and a range was the most effective format for enabling women to comprehend the risks. This finding could directly inform the design of an information visualization tool for communicating such concepts.
Developing visualizations to enhance patient–practitioner communication is a fruitful research area with many design challenges. These challenges relate to both the overall information that is to be represented, for example, to facilitate shared decision making and the most effective data encoding to communicate the intended information. This is known as health numeracy, which is the ability of people to understand numbers. Faisal et al. 38 propose a categorization of visualizations based on various sensemaking situations. In addition, it is not only the representation of quantitative information that needs to be taken into account to facilitate communication and shared decision making but also the representation of richer qualitative data that reflects people’s lifestyles as is the case with the representation of medical health records (section “Examination of patients’ medical records and experiences”) (Table 1). As people are being expected to take more responsibility for their own health and to participate in health decision making, there is a growing focus on the use of personal health records (PHRs), electronic health-care records maintained by the patient or to which the patient has access. Organizations such as Microsoft (HealthVault) and the UK National Health Service (NHS) (HealthSpace) offer free PHRs to consumers. 39 Many argue that they will bring great benefits;40 –42 however, there is limited evidence on their use and effectiveness to date (and indeed Google recently withdrew from this space); for example, Greenhalgh et al. 43 present evidence that the NHS’s HealthSpace PHR has had limited take-up to date. However, these PHRs are largely text based and provide little support for sensemaking. It remains an open research question as to whether richer ways of managing personal health information, which better support sensemaking, will enhance patient engagement in health decision making, particularly for those with long-term conditions.
Life management and health monitoring
When dealing with chronic illnesses, life management and health care monitoring are not focused on curing the condition, but on maintaining everyday life and coping with the condition. For example, Mamykina et al. 44 compare the role of a patient with diabetes to that of a detective, where the patient has to identify the sources of the rise and fall in their blood sugar level by testing different hypotheses. In their study, they investigated existing people with diabetes self-management routines and ways in which their reflection on prior actions influenced their future lifestyle choices. As part of the study, they deployed a prototype incorporating state-of-the-art monitoring techniques to engage participants in reflective analysis of their disease. This revealed the need for careful presentation techniques to promote a more robust understanding and avoid reinforcement of biases. Based on that, they emphasized the need for visualizations to be designed to assist patients in generating appropriate hypotheses as well as supporting reflection and avoiding incorrect conclusions.
Smith et al. 45 followed a different approach to helping people with diabetes to reflect on their lifestyle experiences, namely, by including digital photography to augment and contextualize glucometer readings. Their aim was to facilitate experience sharing and long-term health management. Within the initiative, they conducted two studies. In the first study, they asked participants, newly diagnosed people participating in a diabetes educational course, to take photographs of anything they felt might have an impact on their health, such as meals, exercise routines, or stressful events. Discussions around these photos took place as part of the course. They reported that the findings were extremely encouraging: the inclusion of these photographs as part of the discussion prompted the participants to identify aspects of their routines that might have a negative effect on their health that they might not have been able to identify otherwise.
Based on these findings, a visualization tool was developed and used in a follow-up study. The tool combined blood glucose data with the daily photographs taken in a two-dimensional (2D) visual representation: rows represented time and columns represented the day. Hyperlinks were used to associate each reading with a photograph taken at that time of day. Colors were used to encode the severity of the reading, with blue indicating a low reading and red indicating a high reading. This design enabled the integration of the readings into people’s daily routines, hence contextualizing them. Eight participants took part in the study. They were asked to collect glucose data and photograph daily routines over a period of 4 weeks. Participants met with the researchers once a week to discuss the readings and associated pictures. The study revealed that this scheme prompted participants to address the social and psychological challenges of living with diabetes as the photographs carried deeper meaning than purely looking at the readings. Following is an example extracted from the article:
I see only two real blue marks.
Two lows?
So are you typically someone who doesn’t go low?
Yeah, I typically don’t go low. And if I do go low, it’s, umm, right after I exercise or while I’m exercising. And I think that’s one of the things I also have to work with my doctor about because I have a … not a phobia of going low, but I hate going low. I mean it just … it’s … I get all disoriented, and I just don’t like it. And I think that I’m scared of it, and I’d rather be high than be low. So, umm, that’s one of the things I have to try and work on getting over is just accepting that I’m gonna go low and, you know, I can’t be high all the time. (p. 281) 45
In this study, they concluded that the visualizations created contexts for explaining glucose data that turned into more reflective conversations about personal beliefs and ways of managing health, because they were able to give context to the quantitative data, bridging the gap between the medical readings and patients’ daily life experiences.
When it comes to health management and monitoring, mobile phones hold promise. 46 This is due to their mobility and constant availability. In the literature, examples of systems that have been developed for mobile phones through which users can log their various readings and health-related activities exist. These are then translated and plotted on graphs to assist users in understanding their current situation and setting goals to improve their readings. Walters et al. 47 used a mobile phone to collect data from people undergoing cardiac rehabilitation. The phones had built-in accelerometers to measure physical exercise, and physiological risk factors and other health information was also collected. These data were uploaded to a web site and visualized into graphs to allow patients and their mentors to assess progress and assist in goal setting. This resulted in sustainable behavioral changes. Other examples exist where people with diabetes 48 and people with hypertension 49 used mobile phones to collect medical and physiological data, which would then be visualized and uploaded onto a web site that allowed nurses to monitor their progress and provide patients with recommendations. Holzinger et al. 50 present an overview of the latest developments in the area of mobile wellness.
Mobile Access to Health Information (MAHI) 51 is a health monitoring application that was developed to assist newly diagnosed people with diabetes in managing their goals and developing reflective thinking skills through their communication with diabetes educators. As with the previous tools, MAHI is a mobile phone application that includes a conventional blood glucose meter. Unlike the other mobile phone–supported tools, MAHI followed a sensemaking framework in its design. As a result, the design was based on helping individuals make progress in understanding their disease by providing them with access to past recorded information in order to enhance reflective thinking. Users are encouraged to capture anything that disrupts their regular activities and hence their routine. Information is collected in the form of voice notes and photographs in addition to recording readings from the glucometer via Bluetooth. MAHI does not rely on visualizing the collected information other than presenting the graphs and associated notes to the user and the educator.
In addition to the examples presented in this section, information visualization tools exist to assist people in monitoring their diet, weight, and exercise levels such as “Fish ‘n’ steps,” 52 FotoFit, 53 and UbiFit Garden. 54 However, we do not discuss these articles further as our focus is on health problems rather than healthy lifestyles in general. The studies presented in this section highlight the importance of contextualizing quantitative medical readings to patients’ lifestyles. This ability to comprehend the context enables people to gain a better understanding of their conditions by giving meaning to the numbers, which should assist in better health management. As a result, there should be a focus on patients’ sensemaking. This is a complex problem due to the challenges associated with capturing and representing associated lifestyles. As shown in Table 1, research to date has focused on understanding the goals and sensemaking tasks associated with such activities and not on the technical aspects of visualization for patients’ sensemaking.
Discussion
Rind et al.
55
have presented a literature review of 12 state-of-the-art information visualization systems for the representation of electronic health records. In that review, they focus on challenges associated with the visualization of the data and associated interactive techniques. Their review addresses the challenge of data visualization for clinicians (the top left cell in Table 1) in more detail than we have in this article. Our review extends beyond the data visualization challenges associated with the representation of electronic health records: it has identified five research themes for the application of information visualization to making sense of personal health. For each of these themes, examples from the literature have been discussed and design challenges have been highlighted. These challenges have been summarized in Table 1 as data visualization, capturing lifestyles, and goals and tasks. In addition, we have taken the intended users into account when presenting the literature. This has highlighted the fact that little work has been conducted on how users (practitioners and patients) make sense of such complex information and used that as a basis for design and evaluation. Proper user evaluation has rarely been reported and the focus on evaluations has mainly been on performance and overall usability, overlooking the tools’ ability to support effective sensemaking. Card
56
argues that
the era of pure information visualization is over. The path ahead depends on giving much more attention to the purposes of visualization and its use [ … ] the purpose of information visualization is insight, more particularly, a larger process that might be called sensemaking. (p. xii)
Insight is the ultimate goal of any visualization tool; to gain insight, users engage in activities that help them make sense of the domain as represented by the visual externalization. Additional research is needed on how to design visualization tools that assists users in making sense of personal health.
Some of the design challenges we have identified relate to managing the complexity and diversity of medical and associated lifestyle data; while this is important, here we focus more on the requirement to develop visual representations that help patients and health practitioners to make sense of the represented information. The importance of this is illustrated by the example presented in section “Communication and shared decision making” where we discuss the study of Lipkus et al. 36 on cues for communicating risk to people with breast cancer. In addition, we were able to highlight that the majority of applications found focus primarily on practitioners’ needs even though the literature has shown that there is a clear benefit for such tools to be developed for patients. 45 We also highlight an area that could benefit from information visualization, that is, illness perception.
Practitioners and patients
Health-care practitioners, such as physicians, nurses, and therapists, interact with large amounts of information daily examining patients’ data, planning courses of treatment, and making medical decisions. Examples of visualizations that have been developed to assist in such activities include ones to support the examination of medical records (section “Examination of patients’ medical records and experiences”), treatment planning (section “Treatment planning”), and the representation of pedigrees and family history (section “Representation of pedigrees and family history”). For such applications, researchers have been faced with the challenge of generating meaningful visualizations that can assist users in understanding the data (see Table 1). The data that need to be represented in these themes are complex because practitioners need to keep track of changes in readings, values, narratives, conditions, and plans over time in order to make sense of the health condition. Due to the complexity and the quantitative nature of these data, the research focus has mainly been on the identification and creation of information visualization tools, as seen in Table 1, and less on identifying the goals and tasks. However, as discussed above, not all data that the practitioners deal with are quantitative, qualitative data also take a part. Rich information about people’s lifestyles and other factors that might influence the management of an individual’s health on a day-to-day basis are slowly being incorporated. This explains the gap in the literature, as seen in Table 1, where the research when it comes to practitioners’ needs mainly focuses on the creation of complex visualization and not on capturing lifestyles, goals, and tasks.
As with practitioners, patients, particularly those dealing with chronic illnesses, are faced with the challenge of handling large amounts of diverse information over time. This information may take the form of readings and values generated from monitoring devices, medication time logs, or diaries in which they document health-related issues. Because patients are the ones who live with and manage these health conditions, representing the pure medical facts is not enough. The supporting health-care technologies must be designed in a manner that bridges the gap between medical needs and everyday life circumstances. The paucity of studies on visualizations to support patients communicating with practitioners (section “Communication and shared decision making”) or making sense of their personal health (section “Life management and health monitoring”) suggests that there is a lack of understanding of patients’ information needs when it comes to them making sense of their personal health-related experiences. As Kleinman et al. 57 notes, “Modern physicians diagnose and treat diseases (abnormalities in the structure and function of the body organs and system) whereas patients suffer illness (experiences of disvalued changes in states of being and social function).” This can be seen in Table 1, where there is a gap in data visualization research when it comes to representing patients’ needs. The focus is on generating the requirements, capturing lifestyles, and identifying goals and tasks. Before meaningful information visualization tools can be designed, users’ needs and requirements need to be well understood and addressed. This is a challenge due to its qualitative and subjective nature.
Understanding patients’ experiences
Patients encounter medical visualizations on a regular basis, such as the ones produced by an electrocardiogram. The main problem with these visualizations is that they were designed for professionals. To better understand patients’ needs, Ballegaard et al. 58 applied a participatory design method, 59 in which patients and associated health-care practitioners played key roles in the design of supportive health-care technologies for elderly people and diabetic pregnant women. By using this approach, they were able to gain a better understanding of the true nature of patients’ needs and the means by which the technology can be naturally integrated into their lives. They refer to this as the “citizen perspective.”
Further research is needed to uncover patients’ needs, specifically when it comes to making sense of managing and communicating health-related issues. Research needs to look beyond the concrete data and into users’ health-related lifestyles and experiences in order to determine which aspects of these need to be embedded into a visual representation. When dealing with patients, the experiences need to be understood alongside the data. This is a sensemaking problem as there are clear differences between patients’ information needs and the available clinical information. Indeed, in a recent study of diabetes clinicians and patients, O’Kane and Mentis 60 found an important difference between the information needs of clinicians, who focus on data, and the needs of patients, who require knowledge – that is, an interpretation of data in terms of what it means for their lives and the management of their health. Adams and Blandford 61 report on changes in users’ information needs through a discussion of the “information journey.” One of the key findings of their work in the health-care domain is that patients require a great deal of support when it comes to the interpretation of clinical data. Attfield et al. 62 extended that work to identify the circumstances in which people try to make sense of clinical information, namely, before a clinical consultation (to check whether or not they need to see a doctor and to prepare for the consultation in terms of having questions ready to ask and understanding as much as possible about their condition) and also after a consultation (to better understand, and also validate, what the doctor has told them). This highlights the need to understand users’ situated needs to design appropriate technology to support those needs. Similarly, this review of the research literature highlights the need for a thorough understanding of how patients or practitioners make sense of health-related information before designing information visualization tools that support them in this activity. Illness perception can be seen as an example of the difference in sensemaking experiences between practitioners and patients and between patients and patients where each may have a different interpretation of the same illness. Information visualization has the potential to bridge this gap and ease communication and understanding.
Potential application area: illness perception
When it comes to understanding patients’ needs, the area of illness perception is a promising focus for information visualization. Illness perceptions 63 are the beliefs and representations that people create of their illnesses. There is an association between these models and the way in which a patient manages their health and deals with their condition, which in turn affects their quality of life. When people are diagnosed with an illness, they are faced with large amounts of information which they have to make sense of. Gaining an effective understanding of this information is crucial. Research has shown that patients’ perceptions not only differ between patients with the same condition but also are often different from those of their physicians or general health practitioners. 64 Therefore, it is essential for patients and practitioners to develop an understanding of each other’s perceptions. 65
Petrie et al. 66 list several illness perception assessment tools: semi-structured interviews, paper and pencil scale models, questionnaires, and drawings. Drawings have proven to be effective where patients are able to visualize their pathology. A study by Broadbent et al. 67 has shown that patients who drew more damage to their hearts took longer to return to work due to the negativity of their perceptions. There is a clear need for the development of interventions to help patients generate less dysfunctional models. Due to the diversity and complexity of the information that patients have to deal with, which might comprise figures, medical terminology, documents of varying fonts that some might find difficult to see, diagrams, and so on, there is a role for information visualization to be an effective supportive application.
It is also important to take into account patients’ overall health literacy. Health literacy is based on the ability of patients to read, understand, and act upon health information. Issues such as age, overall literacy or more specifically health numeracy (e.g. ability to understand figures and diagrams), disability (e.g. poor sight), language, culture, and overall emotions must be taken into account when designing visual support representations. 68
Conclusion
In this article, we have presented a systematic review of the literature on the application of information visualization for making sense of personal health. We identified five research themes. For each of these themes, design challenges and opportunities have been discussed. Challenges differ based on users’ needs and the associated data that are to be represented. As shown in Table 1, research has addressed three key challenges: how to visualize data, how to gather user data, and how to support users’ goals and tasks. However, there have been different focuses for research on different topics, and none has covered all the three angles (representing, gathering, and using data). The review has shown that more work needs to be done on incorporating sensemaking processes into the design and evaluation of these tools. Patients need to take into account their experiences as well as the medical facts and need more support in interpreting data than clinicians do. This review has highlighted a potential role for information visualization in assisting both practitioners and patients in making sense of personal health information, but this potential has not yet been fully realized.
Footnotes
Funding
This study has been supported by EPSRC grant EP/G004560/1.