
Abstract
This article describes the ongoing process of engaging with users in the development and evaluation of prototype visualisation software, which aims to assist in the understanding and improvement of appropriate movements during rehabilitation. The value of the process is illustrated in the article with a discussion of the key findings of pre-pilot focus groups with stroke survivors and therapists. The article describes how the design of the visualisation software is being adapted to meet the emerging understanding of the needs of patients and professionals, and of the rehabilitation process.
Introduction
For many physical rehabilitation issues a biomechanical understanding of the problem and its solution is essential. 1 However, despite more than three decades of developments in the field, the potential of biomechanics to fully influence rehabilitation practice has remained under-exploited as a result of the problematic nature of communicating complex biomechanical data and analyses to other disciplines and to lay people.
Motion analysis systems and supporting software enable the collection of accurate, repeatable and objective data on the complex dynamic movements patients perform. This type of analysis has shown a demonstrable positive effect on clinical decision-making in the context of gait analysis.2,3 However, current biomechanical analysis systems are expensive, both in terms of the equipment required 4 and the number of staff needed to collect and interpret the complex results.5,6
In addition to the need for tools to aid the understanding of therapists, the benefits of involving patients in their own care have been demonstrated.7,8 Patient understanding of their treatment and effective communication with clinicians have both been identified to have a positive impact on their compliance 9 leading to a better chance of improved treatment outcomes. 10
This article reports on research into the development of visualisation software for rehabilitation and, in particular, how the design has been informed by a process of user engagement. The aim of the software is to use motion capture technologies to provide patients with a visually comprehensible representation of their own movements and to provide therapists with a tool to improve their explanation of what the patient is trying to achieve during consultations or therapy sessions.
The article begins by introducing the background to the project and is followed by a description of the visualisation software under development. The process of engaging with users in the project is then illustrated using key examples from pre-pilot focus groups. The implications of the feedback from patients and therapists for the design of the visualisations are then discussed, including the challenges this presents for integration with clinical trials.
Background
A previous study of ours11,12 investigated the ability of professionals from different disciplinary backgrounds and lay persons to understand example visualisations of complex biomechanical information on the functional capabilities of older adults. The research found that through the use of visualisation techniques, data which would usually have been incomprehensible and required specialists in biomechanics to interpret could be understood by both lay and non-biomechanics professional audiences. Furthermore, the visualisations were shown to enable new cross-disciplinary dialogues about the data between the professionals and lay members.
In rehabilitation, there remains a lack of conclusive evidence on the efficacy of the use of visual feedback; however, several studies have shown positive results.13,14 Two systematic reviews15,16 both concluded that although there is not enough evidence to recommend the best strategy or nature of feedback, overall it provided added value to stroke rehabilitation. The visual feedback provided in these studies included only limited information on the biomechanical performance of rehabilitation tasks and quality of movement.
The ‘
Five discrete work packages have been selected to investigate the application of the visualisation software to a range of rehabilitation processes and complexities of condition, namely:
falls prevention advice and visual feedback to those at risk of falling;
functional exercises for the rehabilitation of total knee replacement patients;
lower limb stroke rehabilitation for acute stroke patients;
upper limb stroke rehabilitation for acute stroke patients;
diagnosis and fitting of an ankle-foot orthosis in late stage stroke.
Each work package evaluates the effectiveness of the visualisation software, used as a rehabilitation intervention, on patient outcomes in a Phase II randomised controlled trial (RCT) exploratory, as defined by the Medical Research Council (MRC) and will follow MRC guidelines for the evaluation of complex interventions. 17 From the MRC framework, the interventions are categorised as complex, as they involve an intervention in individual patient care and modifications to the service for the patient and will also provide an educational intervention and decision aid for health professionals. 18
Although the RCT offers a rigorous research method for determining whether or not a cause-effect relationship exists between a treatment and its outcomes 19 , the quantitative outcome measures alone would not provide any explanation of which aspects of the visualisation software were successful and which were not: ‘Complex healthcare interventions involve social processes that can be difficult to explore using quantitative methods alone. Qualitative research can support the design of interventions and improve understanding of the mechanisms and effects of complex healthcare interventions’. 20 Therefore, an essential and integrated component to the project is to explore, using qualitative methods, the effects of the use of the software on the experience, the understanding and the value of appropriately executed rehabilitation exercises from the separate perspectives of, and interactions between, both the patients and therapists. 20
The qualitative component of the research will not only complement and explain the quantitative outcome measures, but has also been essential in informing the design and development of a viable and usable visualisation tool to assist in rehabilitation. This article discusses the pre-RCT focus groups and how they have been instrumental in understanding the key stakeholders and informed the design of the visualisations.
Developing a flexible visualisation software tool for the focus groups
A new flexible, fully customisable visualisation software tool was developed. This was essential to enable the exploration of different visual techniques in the focus groups and to customise it for the patients and therapists in each of the separate work packages. The software tool is flexible in two key ways.
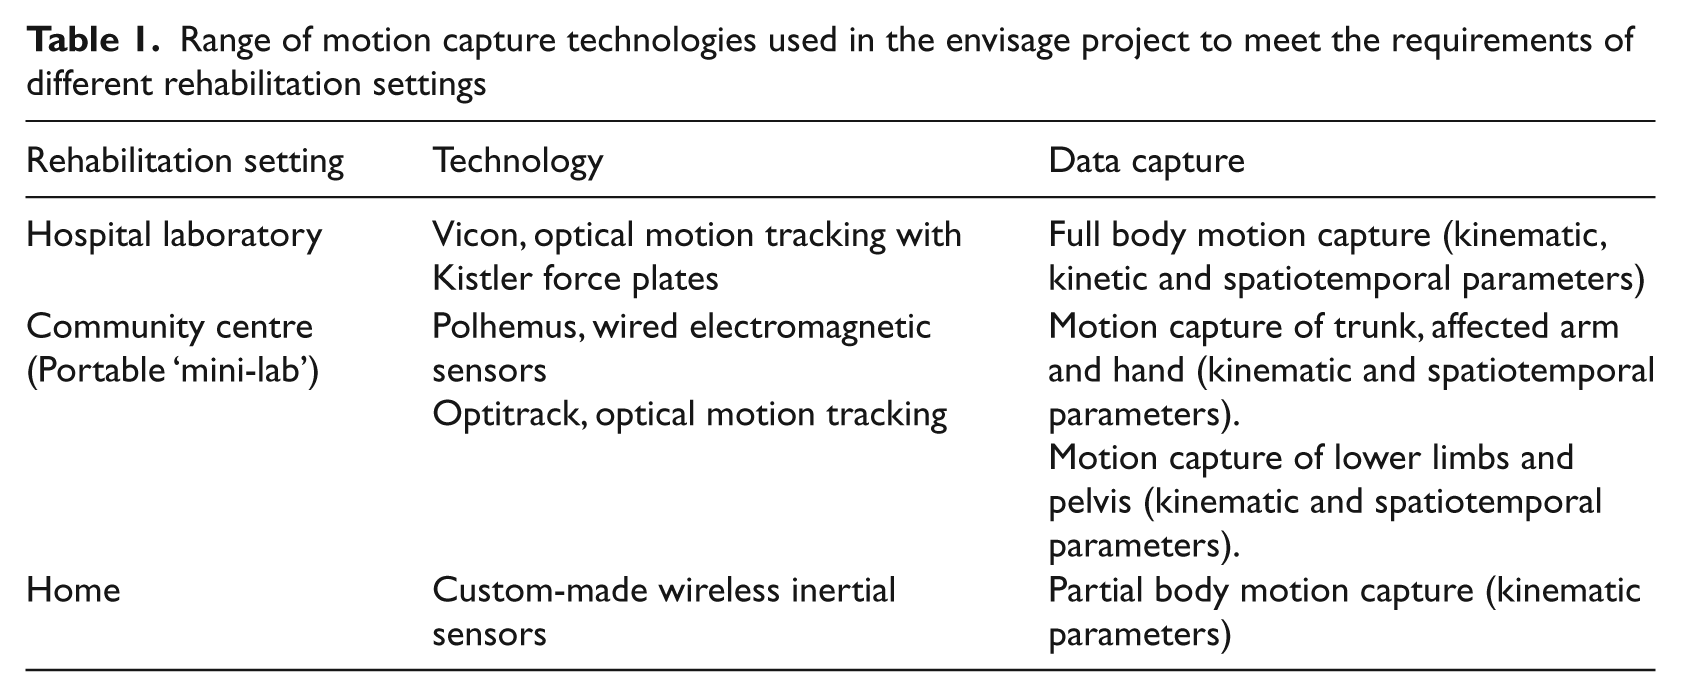
Firstly, the software is flexible in the selection of the data input technology used. In each work package, the software uses motion capture data of the individual patients to generate visualisations of biomechanical data relevant to their rehabilitation programme. However, each of the different rehabilitation scenarios has different practical limitations including size of room, shared spaces requiring regular setup and dismantling of equipment, and non-technical system operators. To meet these different requirements, the software has been designed to use a range of different motion capture technologies (Table 1).
Range of motion capture technologies used in the envisage project to meet the requirements of different rehabilitation settings
Secondly, the tool is flexible in terms of the interface used and the visualisation options presented to the patient. Five different variations of the tool have been created, tailored to the different requirements of the patients and therapists participating in the work packages and the biomechanical information to be communicated.
For example, two of the work packages superficially share a common exercise: a knee lift exercise. However, both the way the participants interact with the tool and the visual feedback needed are completely different. In the first example (Figure 1a), an acute stroke patient is trying to regain lower limb function in a session with a therapist. The exercise is specifically chosen, the patient’s range of motion determined, and the therapist sets a specific target to work to for the session. The visualisation highlights where the patient may be making compensatory movements to ensure that the maximum benefit can be achieved from the session.
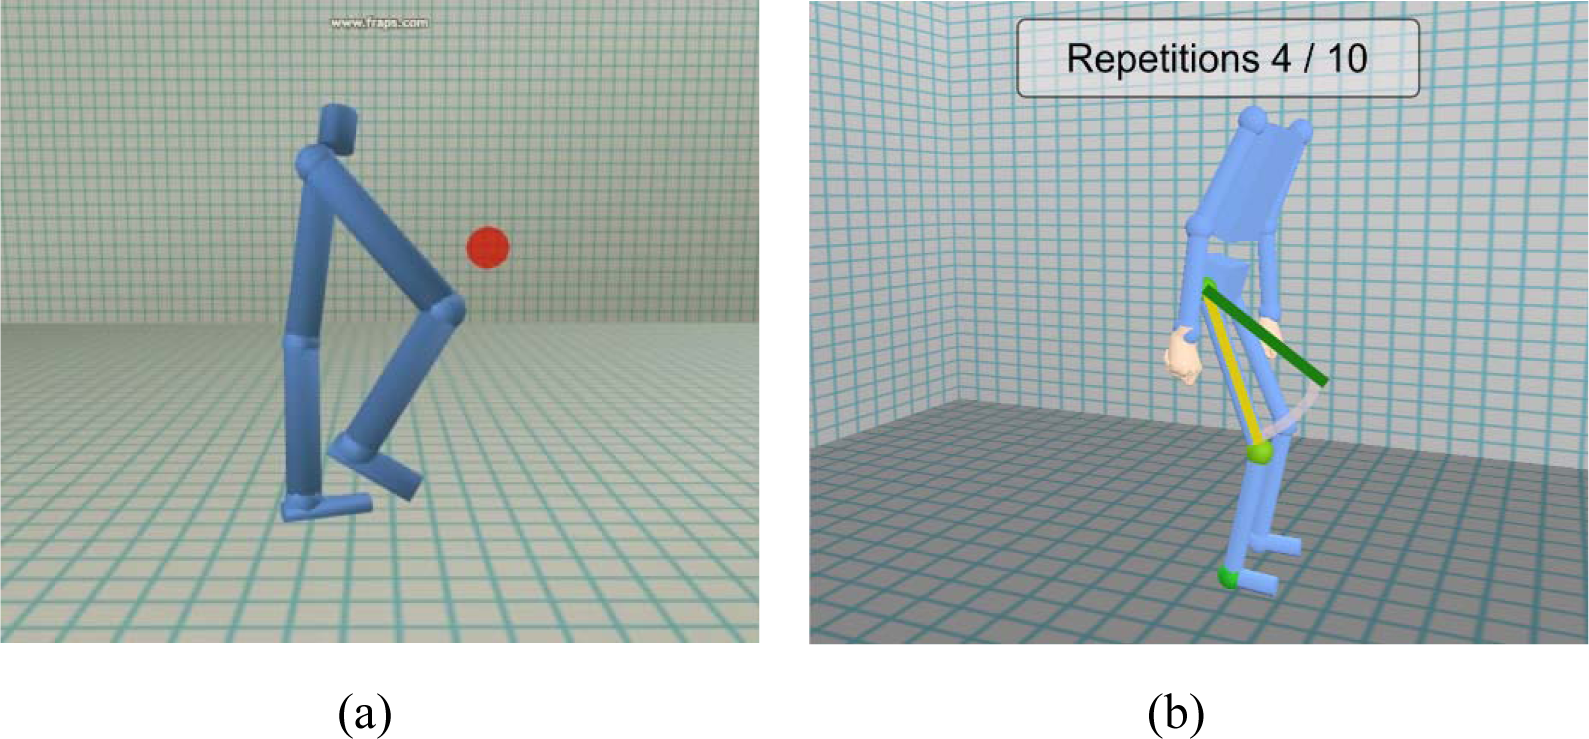
Knee lift exercise example, illustrating how different rehabilitation aims require a different interface and visualisations. (a) Lower limb stroke rehabilitation: the aim is for the patient to attempt to move their knee to a virtual target without using compensatory movements. (b) Falls prevention rehabilitation: the aim is for the patient to perform a set number of repetitions of the exercise at a steady speed
In the second example (Figure 1b), the participant is performing prescribed falls prevention exercises in their home. The software automatically cycles through a prescribed exercise programme, of which the knee lift is only one. The emphasis of the visual feedback is on performing the prescribed number of repetitions at the correct speed, rhythm and angle.
Focus groups prior to clinical trial pilots
In this section, the pre-RCT focus groups are described and two key examples from the focus groups provided to illustrate their value in informing the development of the visualisation software.
Focus group overview
Two focus groups were conducted with relevant stakeholders for the stroke work packages. The aim of the sessions was to obtain the stakeholders’ responses to early prototypes of the visualisations in order to inform the design of the software for further pilots before the RCTs commence. 21
The first of these focus groups (FG1), held in March 2011, included a group of stroke survivors (n = 7) who had received stroke rehabilitation in the last five years in Scotland. These volunteers were approached through three charitable organisations: Chest Heart and Stroke Scotland, The Stroke Association and Different Strokes. Written information about the focus groups was forwarded to them through the charities and when they had agreed they were sent information sheets and formal consent forms, which they signed and returned. No strict criteria were placed on the severity of stroke they suffered. While no payments were made to any volunteers, lunch and refreshments were provided, and all travel expenses were reimbursed.
The second focus group (FG2), held a week after FG1, included a group of neuro-rehabilitation professionals (n = 5: one practicing orthotist, one academic orthotist, two practicing physiotherapists, one academic occupational therapist). These volunteers were all contacts and acquaintances of the Rehabilitation Engineering team at the University of Strathclyde, and were selected to give a balance of the specific professions who were likely to use the visualisation software during the RCTs. Again, no payments were made to the volunteers, although lunch and refreshments were provided, and all travel expenses were reimbursed. Full ethical approval was obtained for both focus groups through the Glasgow School of Art ethics committee.
The same visualisations, core questions and prompts were used in each of the focus groups to enable a comparison of views between the two sessions. Supplementary group-specific questions were also added to probe issues only relevant to one participant group. The questions were exploratory in order to uncover any further issues which may not have been identified by the research team. The focus groups were video and audio recorded, with a scribe noting down key points. Each of the focus groups were 90 minutes long and structured into seven sections, which covered both generic and particular work package issues relating to the design of the visualisations.
A descriptive thematic analysis of the focus groups was performed, 22 centring around the main themes of maintaining patient motivation through the rehabilitation process, and the communication and understanding of rehabilitation goals and progress both by patients and professionals. The following sections provide illustrative examples of two sections of the focus groups that have been crucial in informing the design of the software interface and visualisations.
Example 1: The appearance of the figure
A key factor in the effectiveness of the previous visualisation prototype (described in section 2) was to display the biomechanical data in relation to the context of the movement, using a simple ‘stick-man’ figure. This approach will be extended to the current project, where the abstract biomechanical data will be visualised in relation to the context of the patient’s own movements. The aim of this section of the focus group was to investigate the potential of using alternative types of figure to represent the motion.
Three videos were presented to the participants, each showing the same motion capture data, but providing an example of a different approach to representing the person virtually on screen (Figure 2). The stroke survivor participants were asked to select which they would prefer to see during the stroke rehabilitation process and, more importantly, to explain their reasons for choosing that particular representation. In the professionals’ focus group, the participants were asked to select which figure they would like to see, but, additionally, which one they would use with the patient.
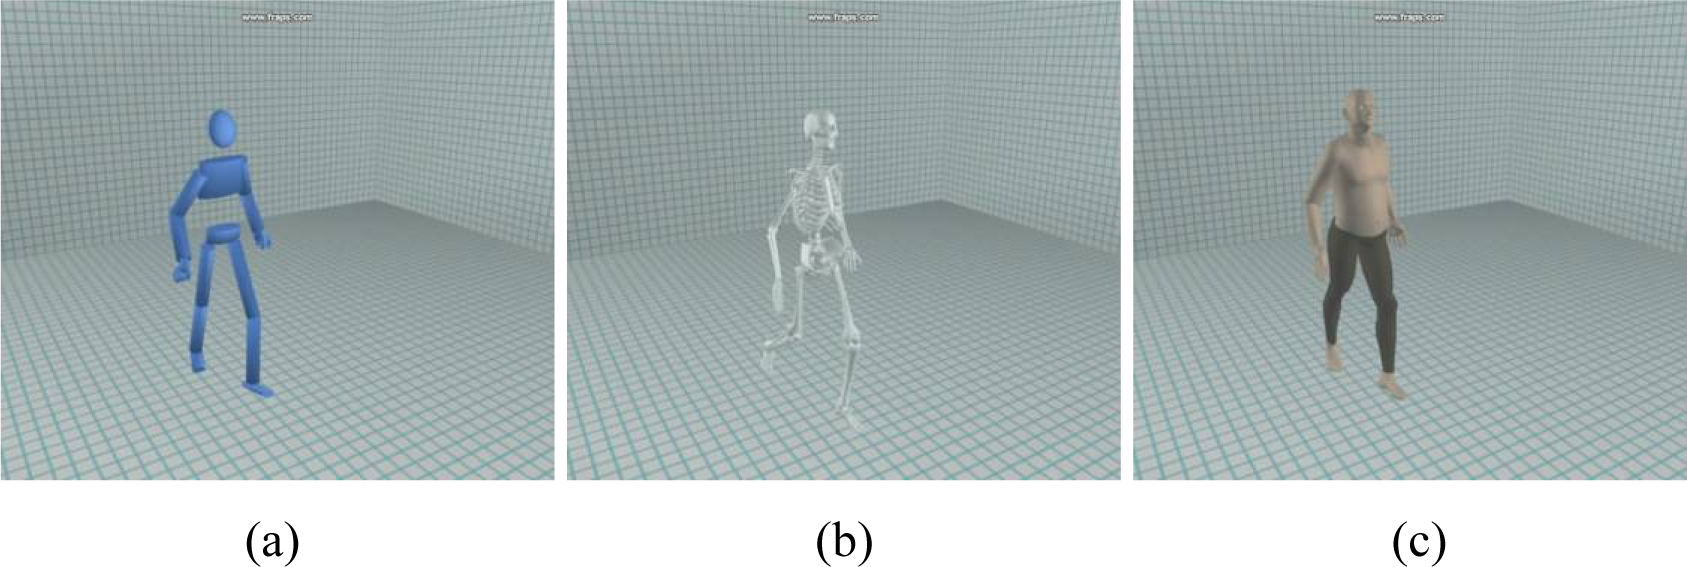
Different options for the appearance of the figure shown at the focus groups. (a) A simple stick figure; (b) a skeletal figure; (c) a more realistic human figure
The main outcome from this section was that different figure representations would be valuable in different circumstances. It was suggested that the ability to change the representation to suit the needs of the stroke patient and their stage in the rehabilitation process would be valuable. This would be particularly true in the early stages post-stroke, when the ability to strip back the visualisations to be very simple would be important.
The participants in both groups seemed to ascribe more weight to the skeletal model as a way of seeing more accurate, detailed movements than the other figures—despite all of the representations using the same motion capture data. This suggests that the skeletal figure may mislead the viewer to believe that the position and shape of the bones are accurately modelled. An important part of the research is to communicate the data in an accessible way but without misleading, so the skeletal figure will not be included in the tools for the clinical trials.
Example 2: Communicating progress of rehabilitation
A sequence of videos (Figure 3) of a patient’s recorded walking movement compared with a normal walking pattern was shown to the participants. Early prototype visualisations of the gait data were shown which highlighted different components of the movement that were causing the patient difficulty. The participants were asked whether they felt this approach would be helpful in the communication of the patient’s progress through their rehabilitation. The more detailed clinical data in Figure 3 (d) were shown only to the professionals group to explore the question of what should be shown to the patient and what would only be suitable for the professional to see.
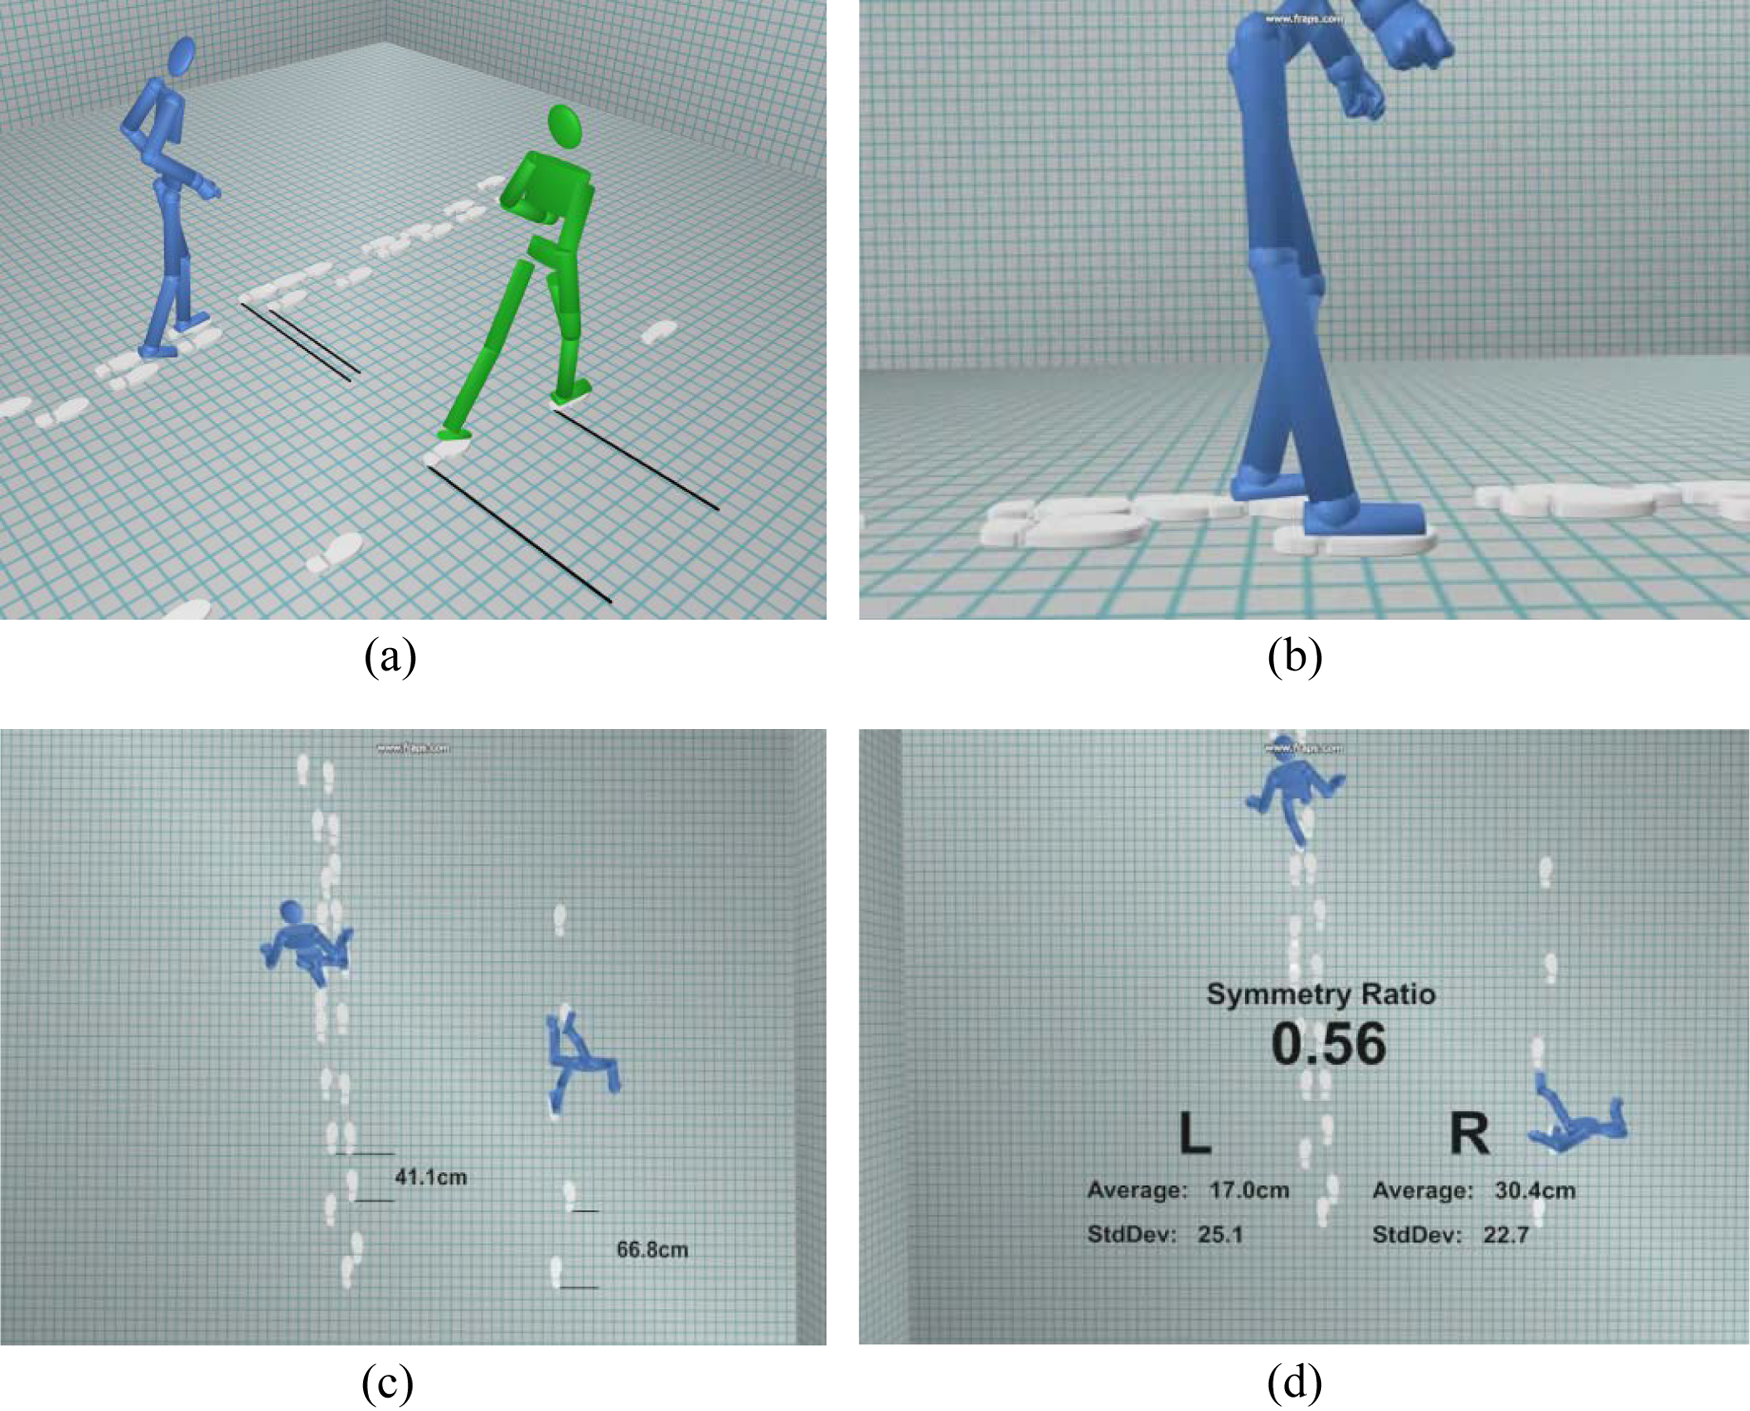
Dynamic interaction with playback of gait trial with patient. Different visualisations and viewpoints are shown to highlight specific information. (a) Visualisation of uneven and slow gait of stroke survivor at baseline (blue figure) relative to improved gait symmetry and walking speed at three-month follow-up (green figure). (b) Visualisation of the stroke patient’s hyperextension of the affected limb at the knee joint during walking. (c) Top down view highlighting differences in step length and variability of gait between the affected gait pattern and normal walking. (d) Highlighting detailed numerical data on the step length and symmetry ratio of the stroke patient’s gait (shown to professionals’ group only)
In both groups the comments were that this form of feedback would offer several advantages in stroke rehabilitation. In the stroke survivors’ group it was commented that it would allow you to see clearly the whole movement and realise what part of the walking movement is going wrong, which, as a patient, you are not normally aware of. In the professionals’ group, the ability to hone in on detailed information was thought to be very valuable.
However, it was thought that there were some adjustments needed in relation to the communication of progress. Three of the key findings from this section are described below. Firstly, the example of walking speed in both groups was identified as potentially de-motivating for the patient—the motion data for the example presented a slow stroke-affected gait in comparison with quite a fast, normal healthy walk. A suggestion from both groups was that displaying a normal gait pattern may be helpful at times to indicate what the rehabilitation is trying to achieve, but that it should be played at a similar speed to the affected gait. Further, the display of normal gait patterns should be sensitively handled for patients who, in the best case scenario, may only be able to achieve 80–90% of their previous walking capability.
Secondly, there was a clear difference in response to seeing the affected figure from those who have been through stroke rehabilitation to the professionals treating it. Both groups commented that the footprints were effective and clear for showing the gait symmetry of the patient. However, an interesting difference was found between the groups in terms of the viewpoint used when observing the affected walking pattern. The professionals’ group thought that the aerial view would be confusing to show to patients as it would be unfamiliar to them. In contrast, in the survivors’ group, the participants preferred the aerial view as it may be more easily accepted by the patient; some of the participants found the views where the severity of the gait problems were clearly visible quite upsetting (Figure 3a, b), as they brought back strong memories of their walking difficulties at the start of their rehabilitation.
Thirdly, the display of numerical data Figure 3(c), was also thought to be a useful addition in both groups. One of the survivors commented that it could be used to ‘compete with yourself’ over time. In the professionals group, it was suggested that the use of numerical data would be useful to show when a patient had made subtle improvements which could not easily be seen visually, for example gait symmetry.
However, in relation to Figure 3 (d), the professionals’ group had some reservations about numerical data, which would need to be considered. There were concerns that it might be necessary to spend time explaining the numbers and where they came from, and that this could waste what is already limited therapy time. It was also suggested that some patients may respond to this level of detail, others may not, and the flexibility of when to show the data should be in the hands of the therapist. The ability to measure and track the quantitative progress of the patient was also seen as beneficial in providing the clinician with evidence that what they do has an impact and that they are right to continue to treat.
Discussion
Changing the software design based on the focus group findings
The focus group and design workshop findings have already had an impact on the design of the visualisation software. For example, the ability to flexibly switch between different visualisations of the same data was initially to be implemented only for the pilots, before choosing the ‘best option’ for the RCT version. From the focus groups it was clear that there should not be a ‘one size fits all’ solution, but rather the patient and the professional should be able to choose the option that suits them best during the trial. This flexibility is now being implemented and the participant’s choices will be logged by the software for analysis post-trial. Furthermore, a key question for the qualitative research post-trial will be to investigate what the participants’ understood from viewing the data, to discover any instances of misinterpretation.
The focus groups were important in highlighting the sensitivity required when showing stroke patients the extent of their difficulties at a distressing period of their life. Some of the participants in the stroke survivors’ focus group had an emotional response to seeing the affected figure as it ‘brought them back to where they were’. However, as the stroke patients in the trial will be actively experiencing the condition at the time of viewing the visualisations, this may provoke a different reaction. The experience of the therapist will be key in deciding what should be shown and when, with sensitivity to the patient’s situation.
Another key finding was that there was an assumption by the researchers that the numerical data that generate the visualisations would only be shown to the stroke professionals. It emerged from the survivors’ focus group that the use of numbers, if explained in context, would also be a useful measure of progress for the stroke patients. The ability to show numerical details to the patient is now being integrated into the tool, although the therapist will be given the flexibility to hide this option if the patient is not at the stage where it would be useful.
Challenges of integrating qualitative research with a RCT
Qualitative research within a RCT is still relatively uncommon and the examples published to date have largely been poorly integrated. 20 In traditional ‘medical model’ RCT studies, factoring in additional time at the start for people-centred qualitative and participative research processes may enhance understanding within research teams of the most appropriate and productive avenues for enquiry and development in advance of trials. Public and patient involvement has been shown to be an important driver of innovation when introduced as early as possible in the process. 23 The findings from the focus groups and design workshops support this. However, there is an inevitable trade-off between the time spent on these activities and commencing the RCTs within project timescale constraints. In this project, the timing of the trials has been restructured to allow extra time for refining the development.
Another challenge for mixed methods with RCTs are in the integration of the complementary quantitative and qualitative outcome measures. In the case of the envisage project, the relationship between quantitative outcome measures (e.g. attendance rate, walking velocity, variability in stride length and functional ambulatory category) and qualitative outcomes (e.g. understanding of rehabilitation tasks and progress, personal and emotional responses to visual representations of one’s own movements) will be explored at the different stages pre-, during and post-trial.
Conclusions
In the
As a result of the mixed methods approach detailed in this article, the design of the interventions to be investigated in the RCTs has developed significantly from its starting point. This process will continue through the pre-RCT pilots and will be an essential driver of innovation and development of the visualisation software beyond the trials themselves.
Footnotes
Funding
This research is funded by the MRC Lifelong Health and Wellbeing programme (LLHW), grant number G0900583. LLHW is a cross council initiative in partnership with the UK health departments and led by the MRC.