
Abstract
This study uses hospital administrative data to ascertain the differences in the patient characteristics, process and outcomes of care between the Emergency Department (ED) triage categories of patients admitted from an ED presentation into a large metropolitan teaching hospital with a Stroke Care Unit. Bayesian Networks (BNs) derived from the administrative data were used to provide the descriptive models. Nearly half the patients in each stroke subtype were triaged as ‘Urgent’ (to be seen within 30 minutes). With a decrease in the urgency of triage categories, the proportion admitted within 8 hours decreased dramatically and the proportion of formal discharge increased. Notably, 45% of transient ischaemic attacks (TIAs) were categorized as ‘Semi-urgent’ (to be attended within 60 minutes), indicating an opportunity to improve emergency assessment of TIAs. The results illustrate the utility of hospital administrative data and the applicability of BNs for review of the current triage practices and subsequent impact.
Introduction
Stroke has been acknowledged as an important and expensive medical and societal problem.1–5 Current stroke treatments can substantially improve the outcome; however, these therapies must be administered promptly and properly.5–8 The crucial elements of an organized stroke care within a hospital include appropriate triaging and imaging in the emergency department (ED), prompt transfer to a dedicated stroke care unit (SCU) for appropriate and focused care, and rehabilitation.6,7,9,10
Once signs and symptoms of stroke are recognized, effective triage for the most appropriate emergency care was listed as one of the essential features of optimal stroke care by the Brain Attack Coalition, National Institutes of Health. 10 Appropriately triaged stroke patients can be fast-tracked through the ED. 7 Since 2000, the Australian Triage Scale (ATS), based on the National Triage Scale (NTS) developed by the Australian College of Emergency Medicine (ACEM), has been in used in Australian hospitals.11–13 The above classification reflects the urgency of medical and nursing care. It is also used as a case mix tool to monitor resource usage and efficiency.13–15 As recommended by the ACEM, the percentage of patients seen within the time specified by each triage category is commonly used to audit and benchmark performance; with a waiting time of more that two hours considered a failure of both access and quality. 14 Therefore, it would be of interest to study how the stroke patients are triaged using the ATS.
As mentioned, after appropriate treatment in ED, admission into an organized SCU provides the optimal care. The cost benefit value of SCUs has been acknowledged.2,16,17 The benefits of SCUs in reducing in-hospital mortality, the length of stay (LOS), as well as improving the functional outcome have been reported.18–22 In Australia, SCUs are usually found in teaching hospitals. 23 To date, there are no studies of the impact of ED triaging of suspected stroke that are also admitted to a SCU, i.e. those who have an in-patient SCU episode following an ED presentation. Such patients often use the healthcare system for a longer time and can therefore incur higher costs.
Ongoing monitoring of the care process and outcome using routinely collected administrative datasets provides opportunities to increase the efficiency of care of especially high-cost patients.24–26 Record linking has been increasingly used to join small and large health datasets.27–31 Linking hospital administrative datasets can present important opportunities to investigate specific questions and study the trends in the continuum of hospital care.25,30,32 In this study, ED data linked to admitted patient data was used.
Bayesian Networks (BNs) provide a natural model for exploration and reasoning about complex probability distributions,33–35 which is amenable to population from routinely collected administrative data. Structurally, BNs are directed acyclic graphs (DAGs), with the nodes representing random variables, the arcs representing statistical dependencies among the variables, and each node having an associated conditional probability of the node being a specific value given the values of its parents. 33 When nodes (variables) are linked in the form of a network, Bayes’ rule helps to predict the outcomes of events that are dependent on another event(s). There are many examples of health applications of BNs, including applications in nursing,36,37 intensive care unit decision making36–41 and public health.42,43
Lucas 35 believes that BNs can be an alternative to logistic regression, with the advantage that statistical dependence and independence are explicitly represented and not hidden in approximation. It has been reported that Bayesian classifiers generally tend not to over-fit to the training data, resulting in greater tolerance to noise and thus out-performing logistic regression.44,45 In the medical context, it has been found that Bayesian classifiers are as good, or better, in performance, ease of construction and ease of interpretation. 46 Based on statistical data and learning rules, BNs can generally improve the reliability of a model and thus be useful as an exploratory data analysis tool for studying the relationships among variables. 36 BNs have also been shown to provide similar performance to decision trees and to have complementary value for providing insight into care processes. 47 Modern BN tools allow one to easily navigate a wide range of options by fixing the values of specific parameters of interest and viewing the resultant conditional probability distributions.48–50 Owing to the above factors, BN was the method of choice for the present analysis.
By applying BN to the administrative dataset of a large metropolitan teaching hospital with a SCU, comparisons were made between the admitted stroke patients who had different allocated ED triage categories. The comparisons were in terms of characteristics and care journey/outcome profiles. The study cohort was patients admitted into the same hospital as their ED presentation.
Methods
Dataset, preparation and variables
Dataset, healthcare facility and year of collection
Two fiscal years (1 June 2004–30 July 2006) of ED and in-patient data collected by a major Melbourne (Victoria, Australia) metropolitan teaching hospital with a SCU were used in this study. All hospitals in Victoria have to comply with standard definitions for reporting financial and statistical data.25,51 Hence, the collection comprises of standardized data units required for reporting.
Record-linking and data preparation
The hospital in-patient collection data was linked with the ED data collection using deterministic matching. Deterministic matching uses unique variables in the two datasets that are to be linked and are achievable when the datasets are relatively small and fairly accurate.29,32,52,53 Patient first name and surname, date of birth, date of presentation and discharge from ED, data of admission to ward and hospital record numbers were used in matching. After linking, a random sample of 20 records was examined and compared with the physical record for quality of link. The link was found to be correct, i.e. the process achieved the joining of records of a single patient who had an in-patient episode following an ED presentation in the same hospital.
The linked fiscal years were merged together, with great care taken to address any differences in data dictionary and International Classification of Diseases (ICD) codes. By choosing consecutive year data, in this study such heterogeneities were minimized. The linked and merged data was checked for completeness and duplicates, and any records with missing or duplicate data removed. Data dictionaries for the fiscal years (obtained from the Victorian Department Health) were used to check for errors in integrity. Exploratory data analysis was performed to check the success of the above data preparation. Lastly, the relevant data elements were transformed (see below) for use.
Cohort selection and variables of interest
All patients included in this study presented in the ED with signs and symptoms of stroke, were identified by a triage nurse and were treated as a stroke by the ED physicians. Data elements of interest include: the diagnosis codes that help define the cohort; other diagnoses; patient demographics; number of presentations at the hospital; outcome, including ED and in-patient LOS; ED referrals and separation types; and, notably, information on ED triage categories. The cohort in this study all had a principal stroke diagnoses and so were treated for stroke in both the ED and the ward.
Each patient record in the dataset had one mandatory ICD version 10 with Australian Modification (ICD-10-AM) code for the principal diagnosis and provisions to record up to 40 other ICD codes. The principal diagnosis codes were used to select the cohort and assign the stroke subtypes as follows: 51 (1) stroke, not specified as haemorrhage or infarction (all I64, SnsHorI); (2) cerebral infarction (all I63, CI); (3) other nontraumatic intracranial haemorrhage (all I62, OntICH); (4) intracerebral haemorrhage (all I61, ICH); (5) subarachnoid haemorrhage (all I60, SAH); and, (6) transient cerebral ischaemic attacks and related syndromes (all G45 except G454, TIA). The current trend in clinical thinking is that there is a continuum between TIA and stroke 54 and the blurred boundaries between TIA and stroke has been discussed. 55 Therefore, in the present study, TIAs were included in the ‘stroke’ cohort; in addition, where appropriate, distinction between TIA and stroke subtypes was also made.
Comorbidity has been reported to have a significant impact on stroke outcome.56,57 There is a shift of thinking from generic comorbidity measures to a more disease-specific complexity-of-patient-presentation construct that favours a more person-centred perspective.58–60 The recently developed 61 comprehensive stroke-specific complexity (of patient presentation) or patient complexity measure was used in BNs. Briefly, the instrument has a selection of stroke-specific ‘condition-groups’ and an associated index value based on their relative potential to contribute towards the complexity-of-stroke-patient-presentation. The convergent validity of the developed instrument had been determined using a derived ‘pseudo gold standard’. In addition, using a state administrative dataset, the alignment of the complexity score to the expected patient factors and outcomes has been established. In the current study, the index values of the stroke patient’s nonprincipal diagnoses were used to calculate the total complexity weight or the patient ‘complexity’. The SPSS Visual Bander and the BN discretization function based on entropy minimization were used to categorize all continuous variables (including age, LOS and complexity) for optimal discrimination.
The source from which patients were referred to the current ED were classified as: (1) staff from current hospital (or this hospital); (2) oneself, family and friends (or self); (3) doctors (or Dr); and, (4) all others (as ‘rest’). The number of presentations at the study hospital was classified into 1, 2–3 and 4+. ATS includes the following categories and the targeted times for attendance:11,62 (1) Resuscitation—within 1 minute; (2) Emergency—within 10 minutes; (3) Urgent—within 30 minutes; (4) Semi-urgent—within 60 minutes; (5) Non-urgent—within 120 minutes; and, (6) Dead on arrival. LOS of patients in ED is calculated in hours and representing node in the BN is divided into: (1) up to 4 hours; (2) 4 hours and 1 minute–8 hours; (3) 8 hours and 2 minutes–12 hours; (4) 12 hours and 1 minute–18 hours; (5) 18 hours and 1 minute–24 hours; and, (6) >24 hours and 1 minute. The in-patient LOS was converted to an ordinal variable (see above). The separation types included: (1) to rehab; (2) to elderly care; (3) transfers; (4) statistical; (5) formal; (6) in-hospital death; and, (7) left against medical advice (LAMA). Note, ‘statistical separation’ is where the patient commences a new episode of care with a new care type all within a given hospital stay. Table 1 includes the description of variables/nodes used in the BNs. In the present study, the various triage categories are compared.
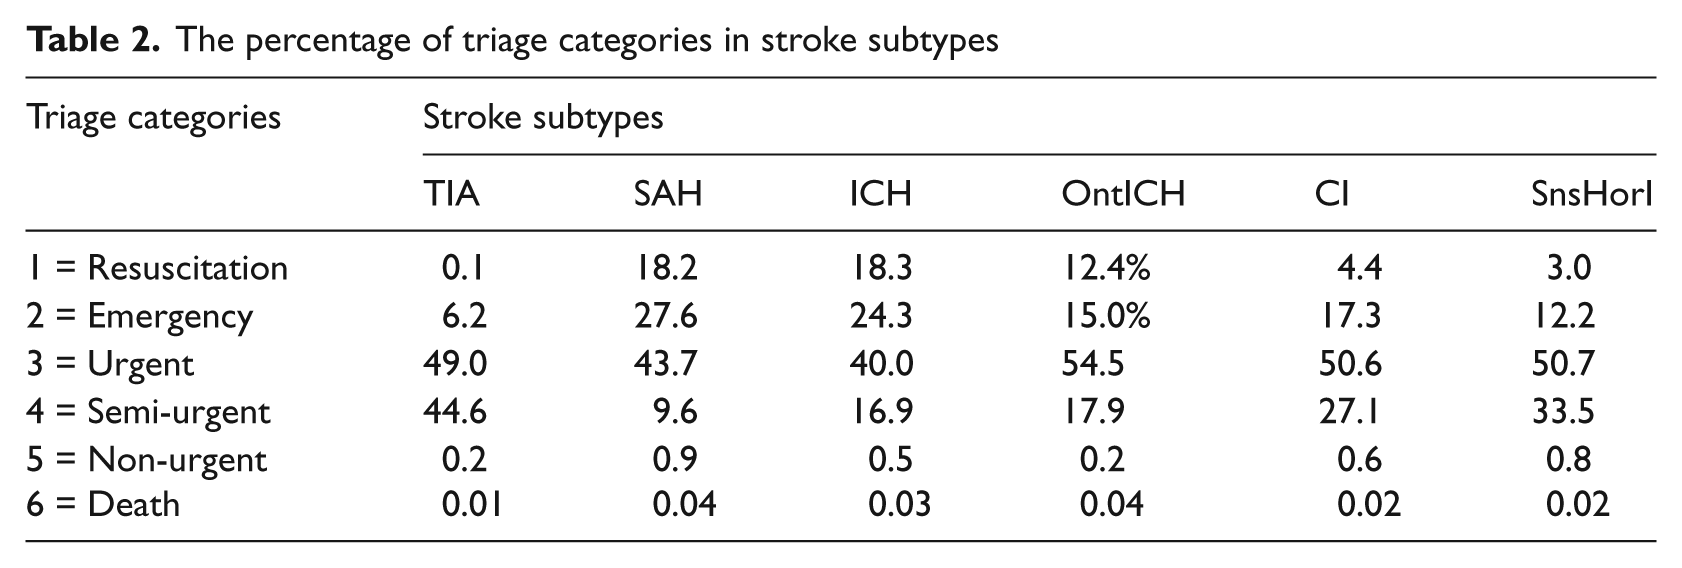
Description of variables or nodes used in the BNs

The percentage of triage categories in stroke subtypes
Modelling with BNs
CaMML (Causal MML) BN learning tool from Monash University Data Mining Centre 63 was employed for the construction of BNs. CaMML is an automated causal discovery algorithm that learns the best causal structure to account for observational data using Wallace’s Minimum Message Length (MML) principle. 64 MML is said to provide a Bayesian information-theoretic metric, making a trade-off between prior probability (model complexity) and goodness of fit, thus avoiding over-fitting the data. Across a range of problems, comparative studies have shown CaMML to provide better-than or equal performance compared with other approaches.65,66 CaMML has been successfully used 66 to learn the local structure in BNs in a particularly flexible way using either full Conditional Probability Tables (CPTs), logit models or decision trees, or any combination of these determined on a node-by-node basis (hybrid models). As the above results in a flexible learning procedure which automatically accommodates different data sizes by preferring simple local structure representations (e.g. logit models) for small data and a richer representation (decision trees and/or CPTs) for a large data, it was the method of choice. The placement of arcs between nodes, representing conditional dependency or probabilistic correlation between variables,41,67 were algorithmically derived from training data (n = 25% of total). Netica 68 was used for BN visualization.
Results
The cohort consisted of 1892 patients who had an ED, as well as admitted episode, in the study hospital during the study period.
The BNs
Figures 2–6 give the BNs for the various triage categories. Figure 2 is for patients that were triaged as ‘Resuscitation’ (i.e. 100% Resuscitation), Figure 3 represents those were classified as ‘Emergency’ (i.e. 100% Emergency), Figure 4 represents those triaged as ‘Urgent’, Figure 5 for ‘Semi-urgent’ and Figure 6 those classified as ‘Non-urgent’.
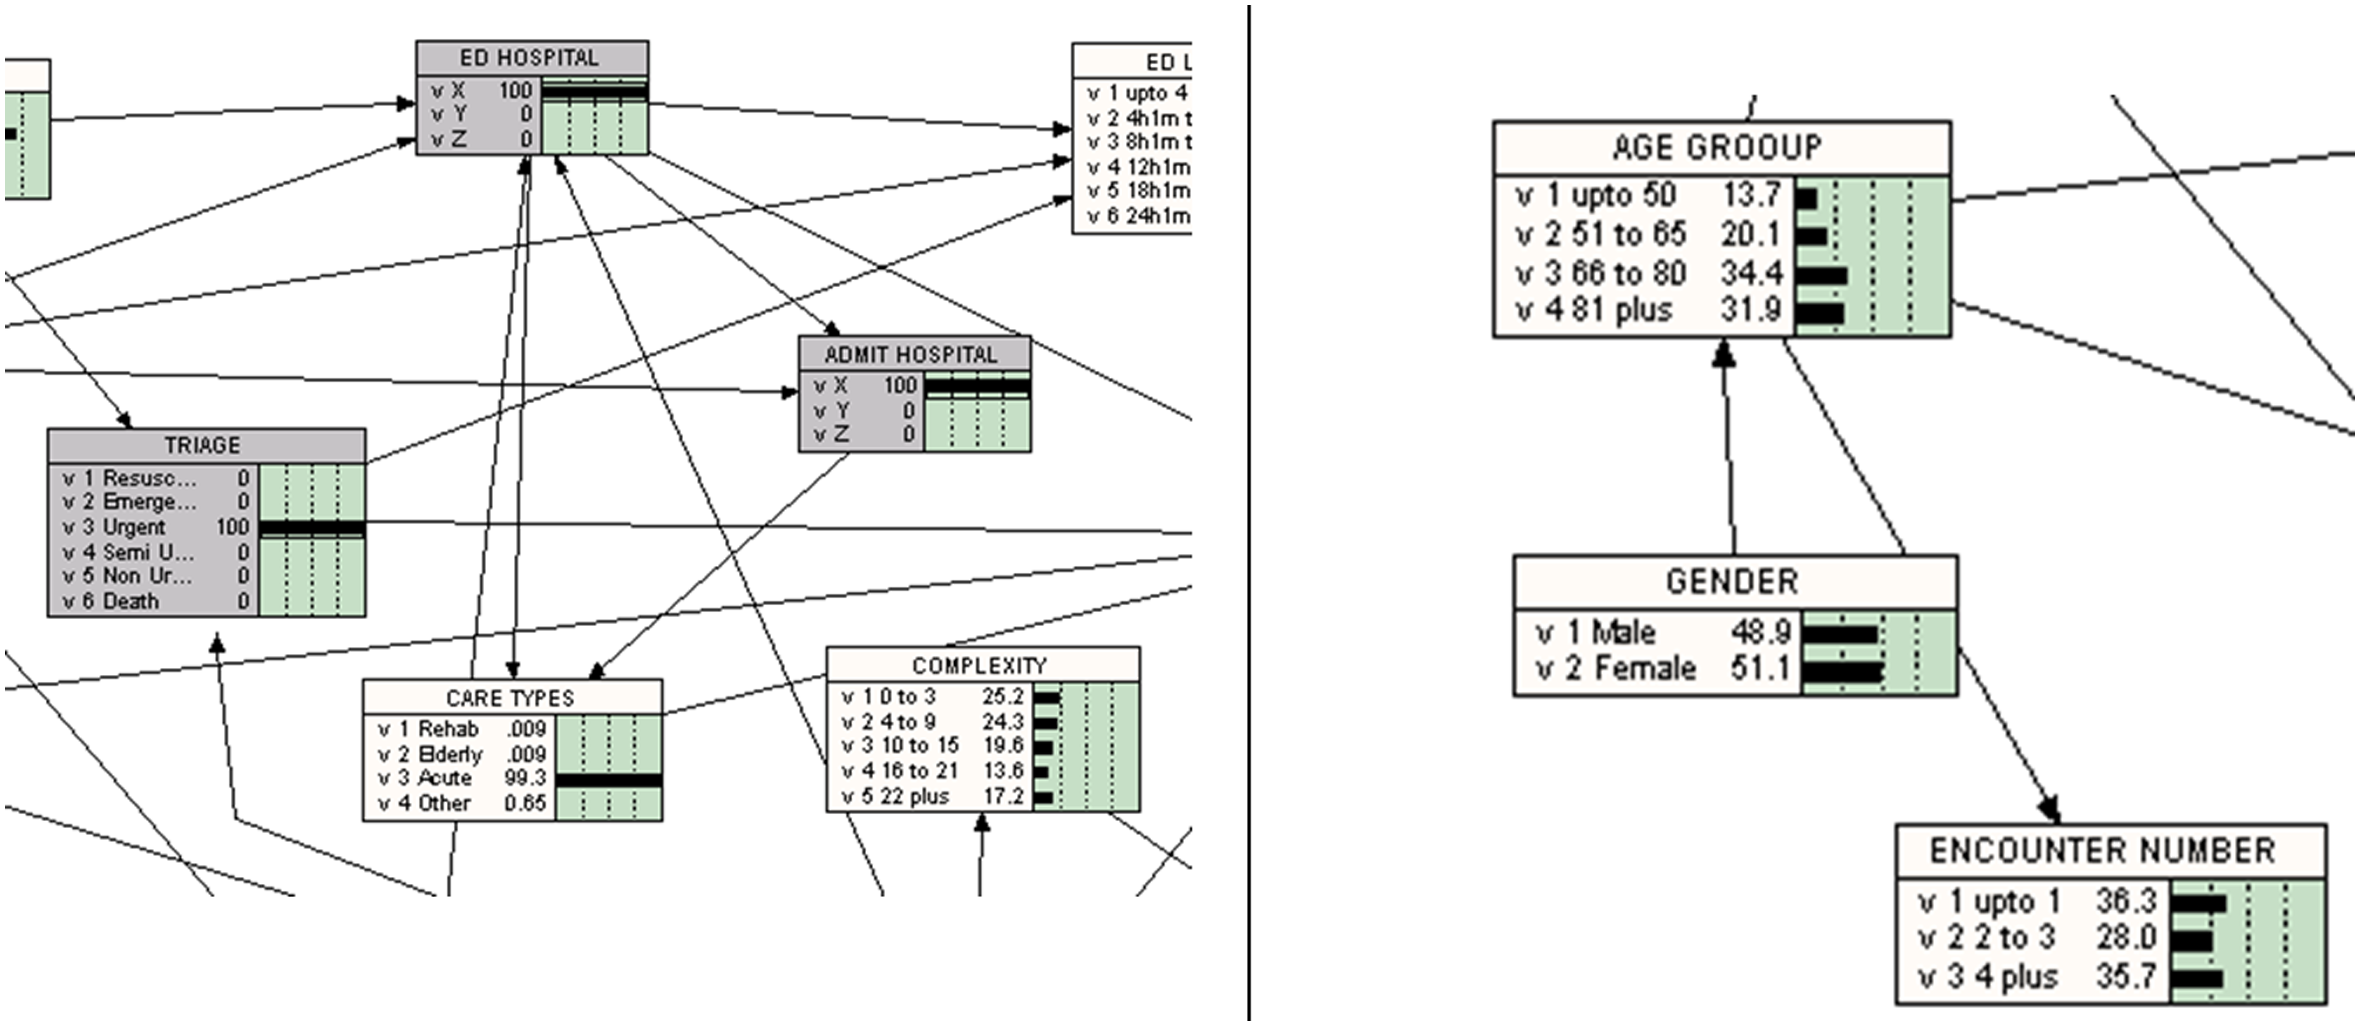
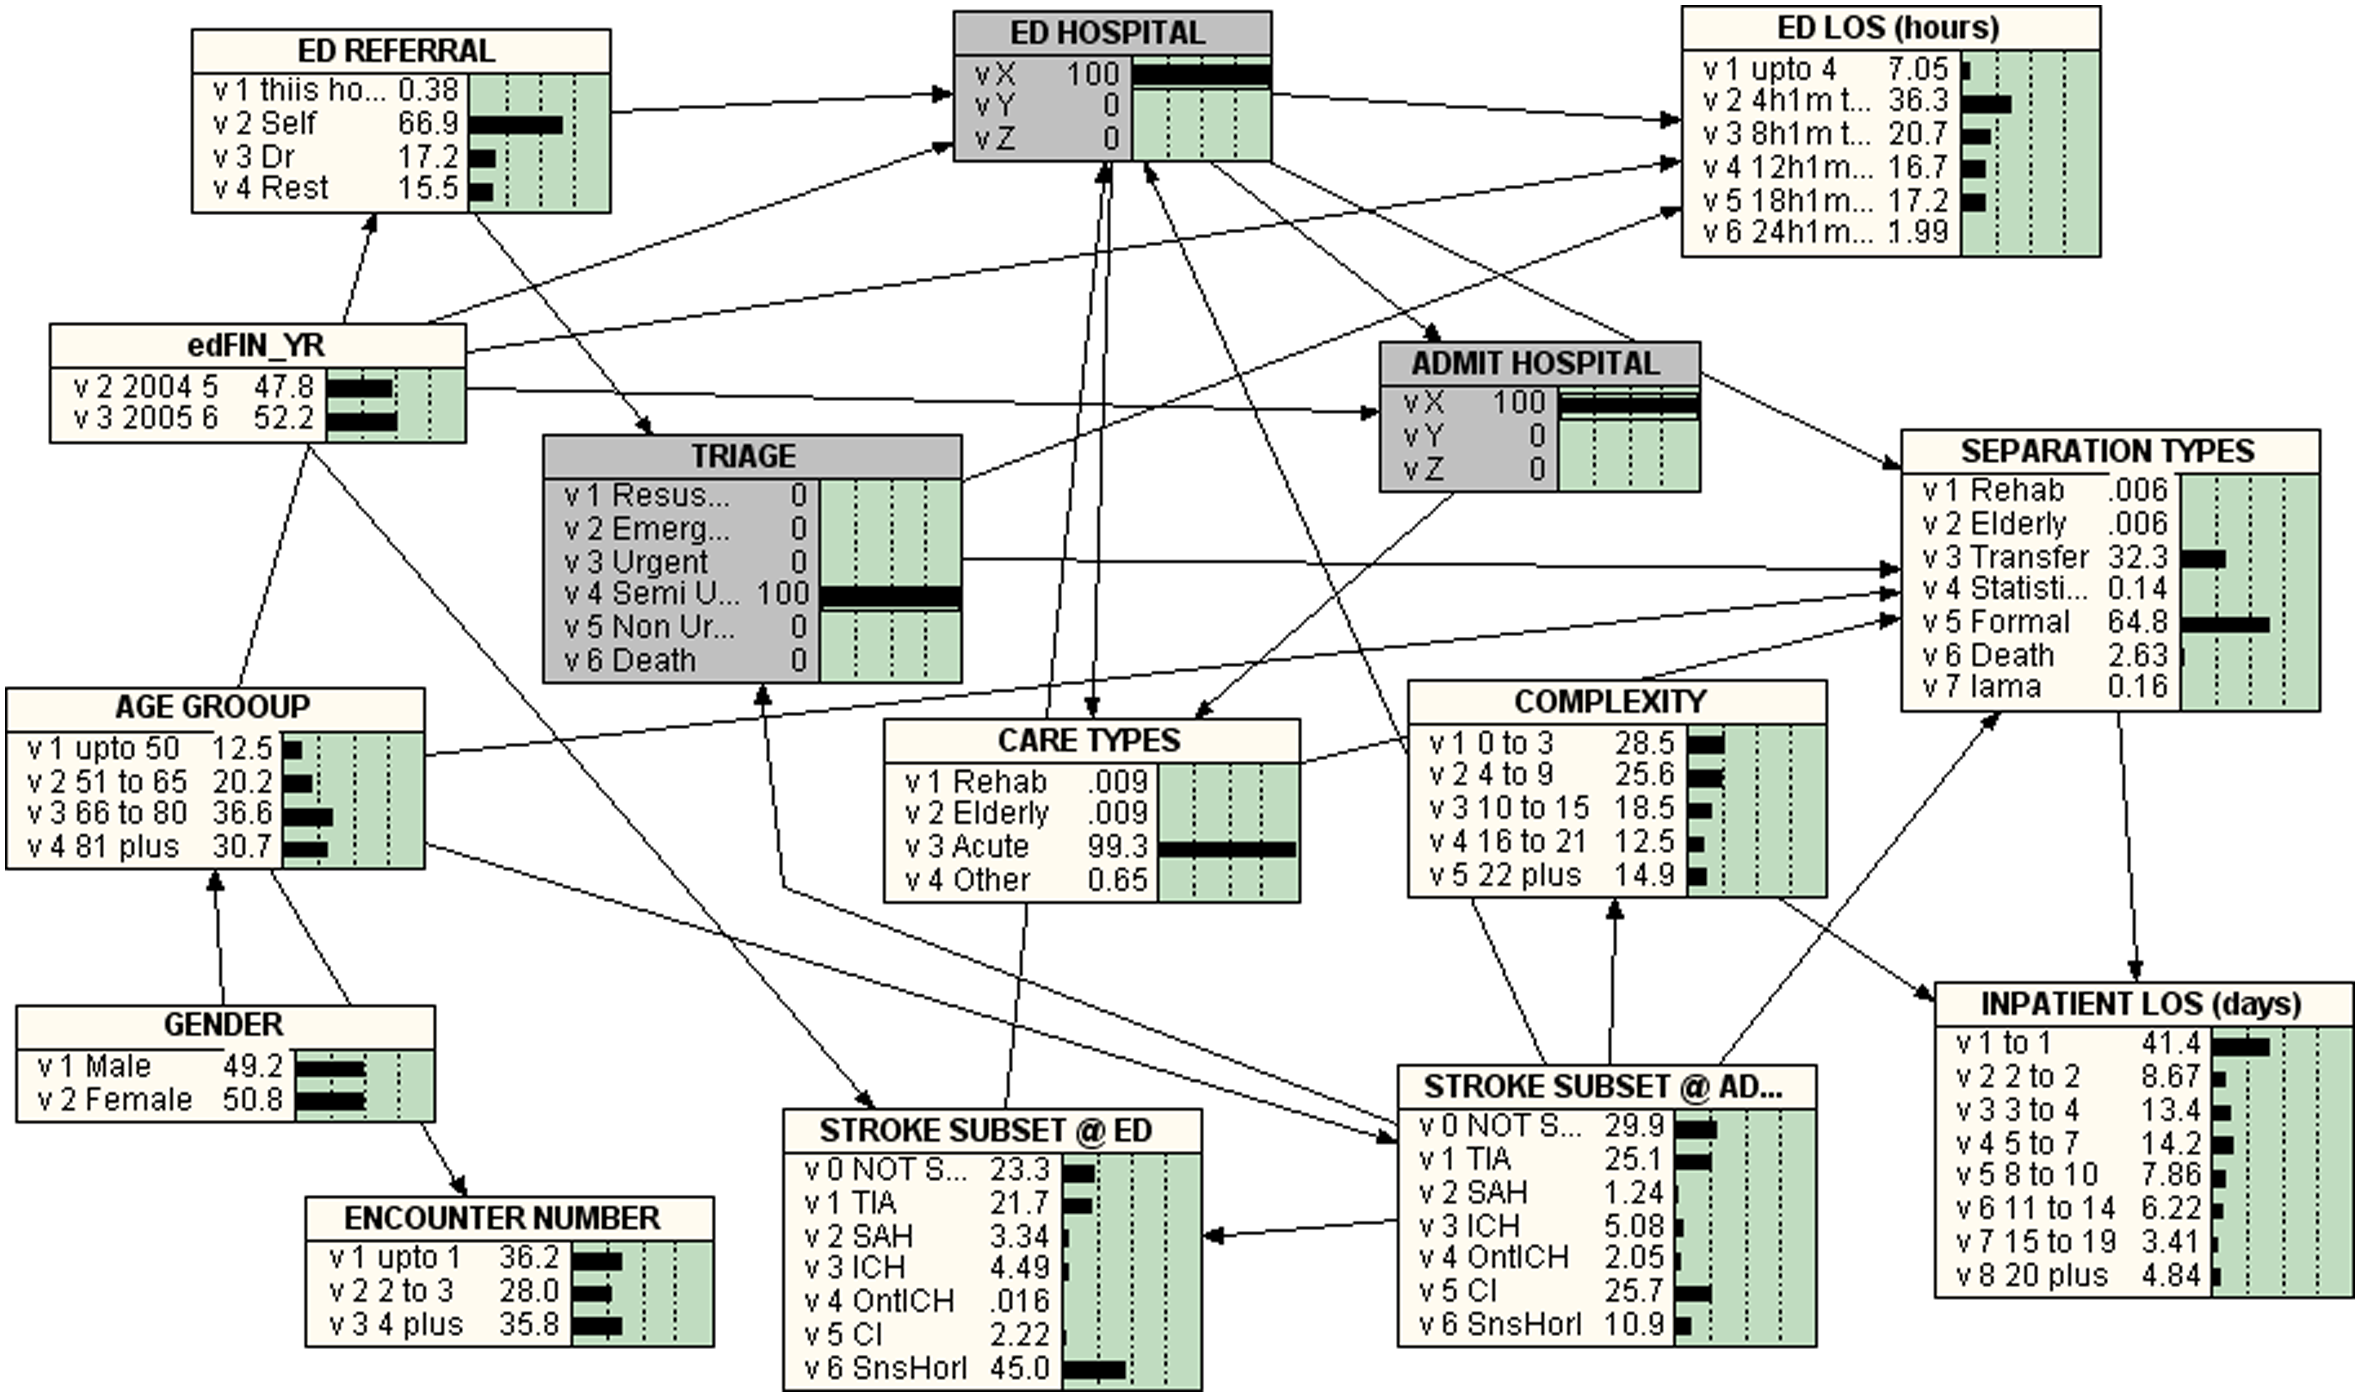
In interpreting Netica graphs, the following should be noted (also see Table 1 and Figure 1 which give selected callouts from BNs in Figures 2 and 6):
The rectangles represent nodes (i.e. variables), with the variable name indicated at the top of the rectangle; values of the variable, with a graphical and numeric representation of the distribution of the values, are represented below the variable name.
The rectangles with a greyed area have been selected for only a specific value (see nodes to the left in Figure 1). As mentioned above, the node ‘TRIAGE’ is set to a specific value for each BN found in Figures 2–6. Also note this study is looking at data from one of the admitting hospitals (hospital X) in the cluster (i.e. ‘ADMIT Hospital’ is set to 100% hospital X—i.e. other cases have been filtered). Note the conditions of the ethics approval do not allow the identification of the hospital.
The direction of the arcs (arrows) represents influences of one variable on the distribution of another. For example, ‘GENDER’ influences ‘AGE GROUP’ which, in turn, influences ‘ENCOUNTER NUMBER’; conversely ‘GENDER’ is not modelled as being influenced by any other variable in the model and hence has no incoming arrows (see nodes with arrows on the right of Figure 1).
As can be seen from Figures 2–6, each of the nodes contains a conditional probability table that gives the probabilities of the node being in a specific state. Thus, the table contains conditional probabilities that the node is in a specific state for definite configuration of states of its parents.

Bayesian Network for TRIAGE = 1 = RESUSCITATION
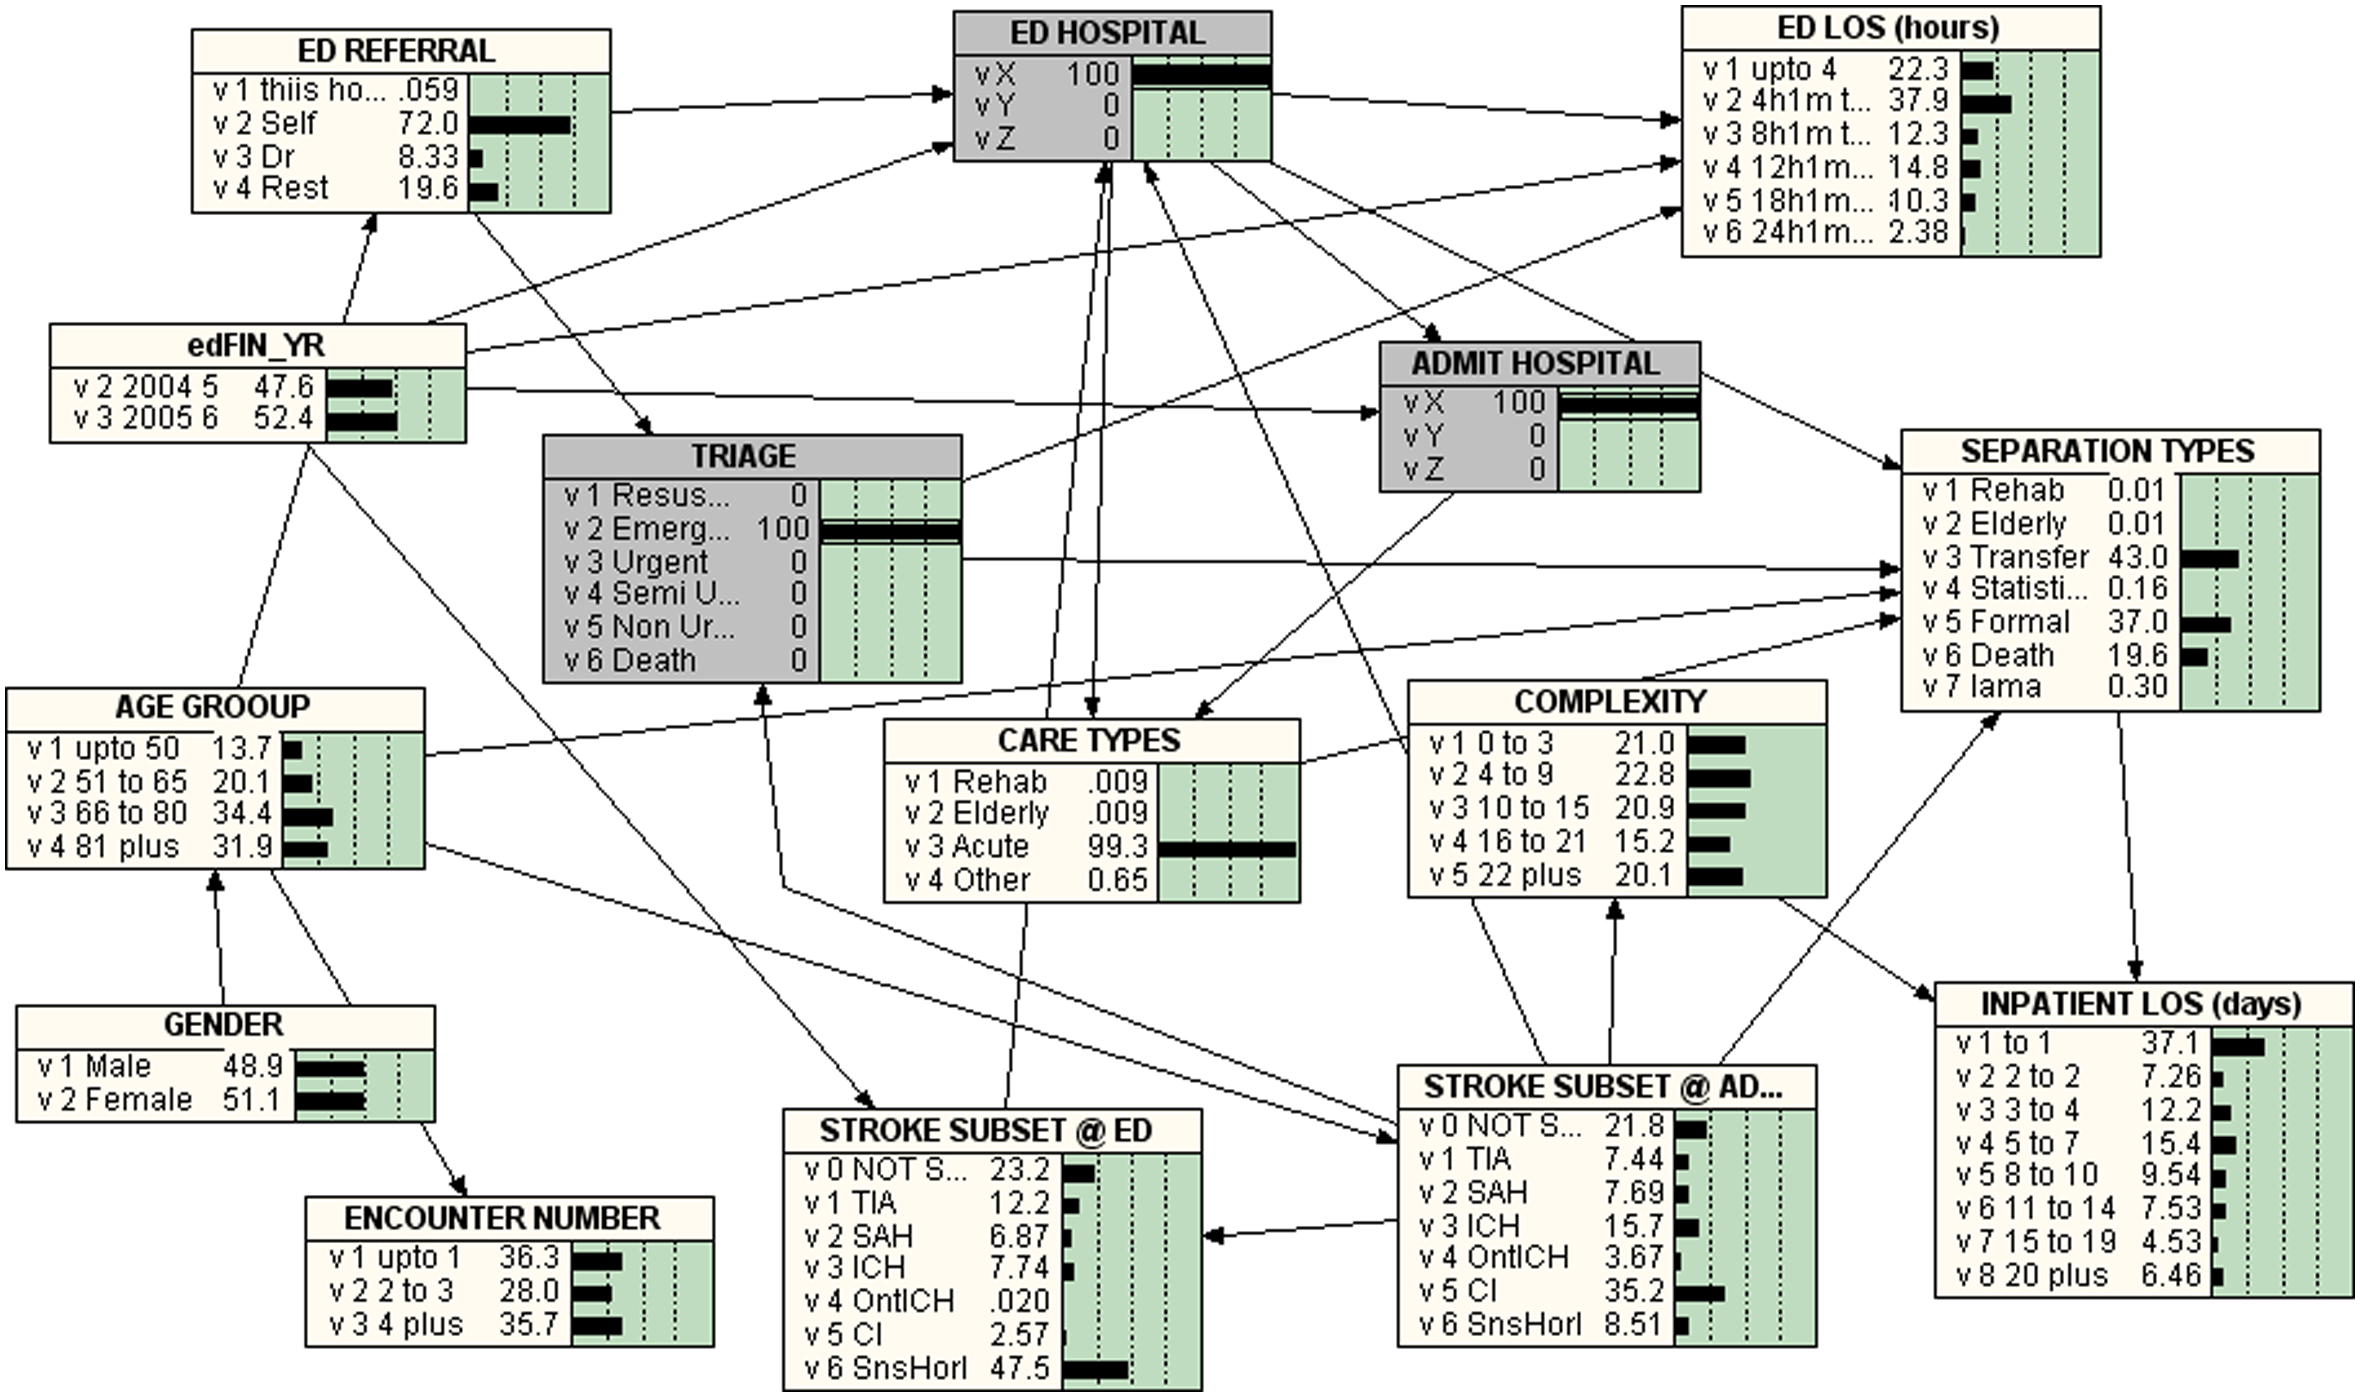
Bayesian Network for TRIAGE = 2 = EMERGENCY
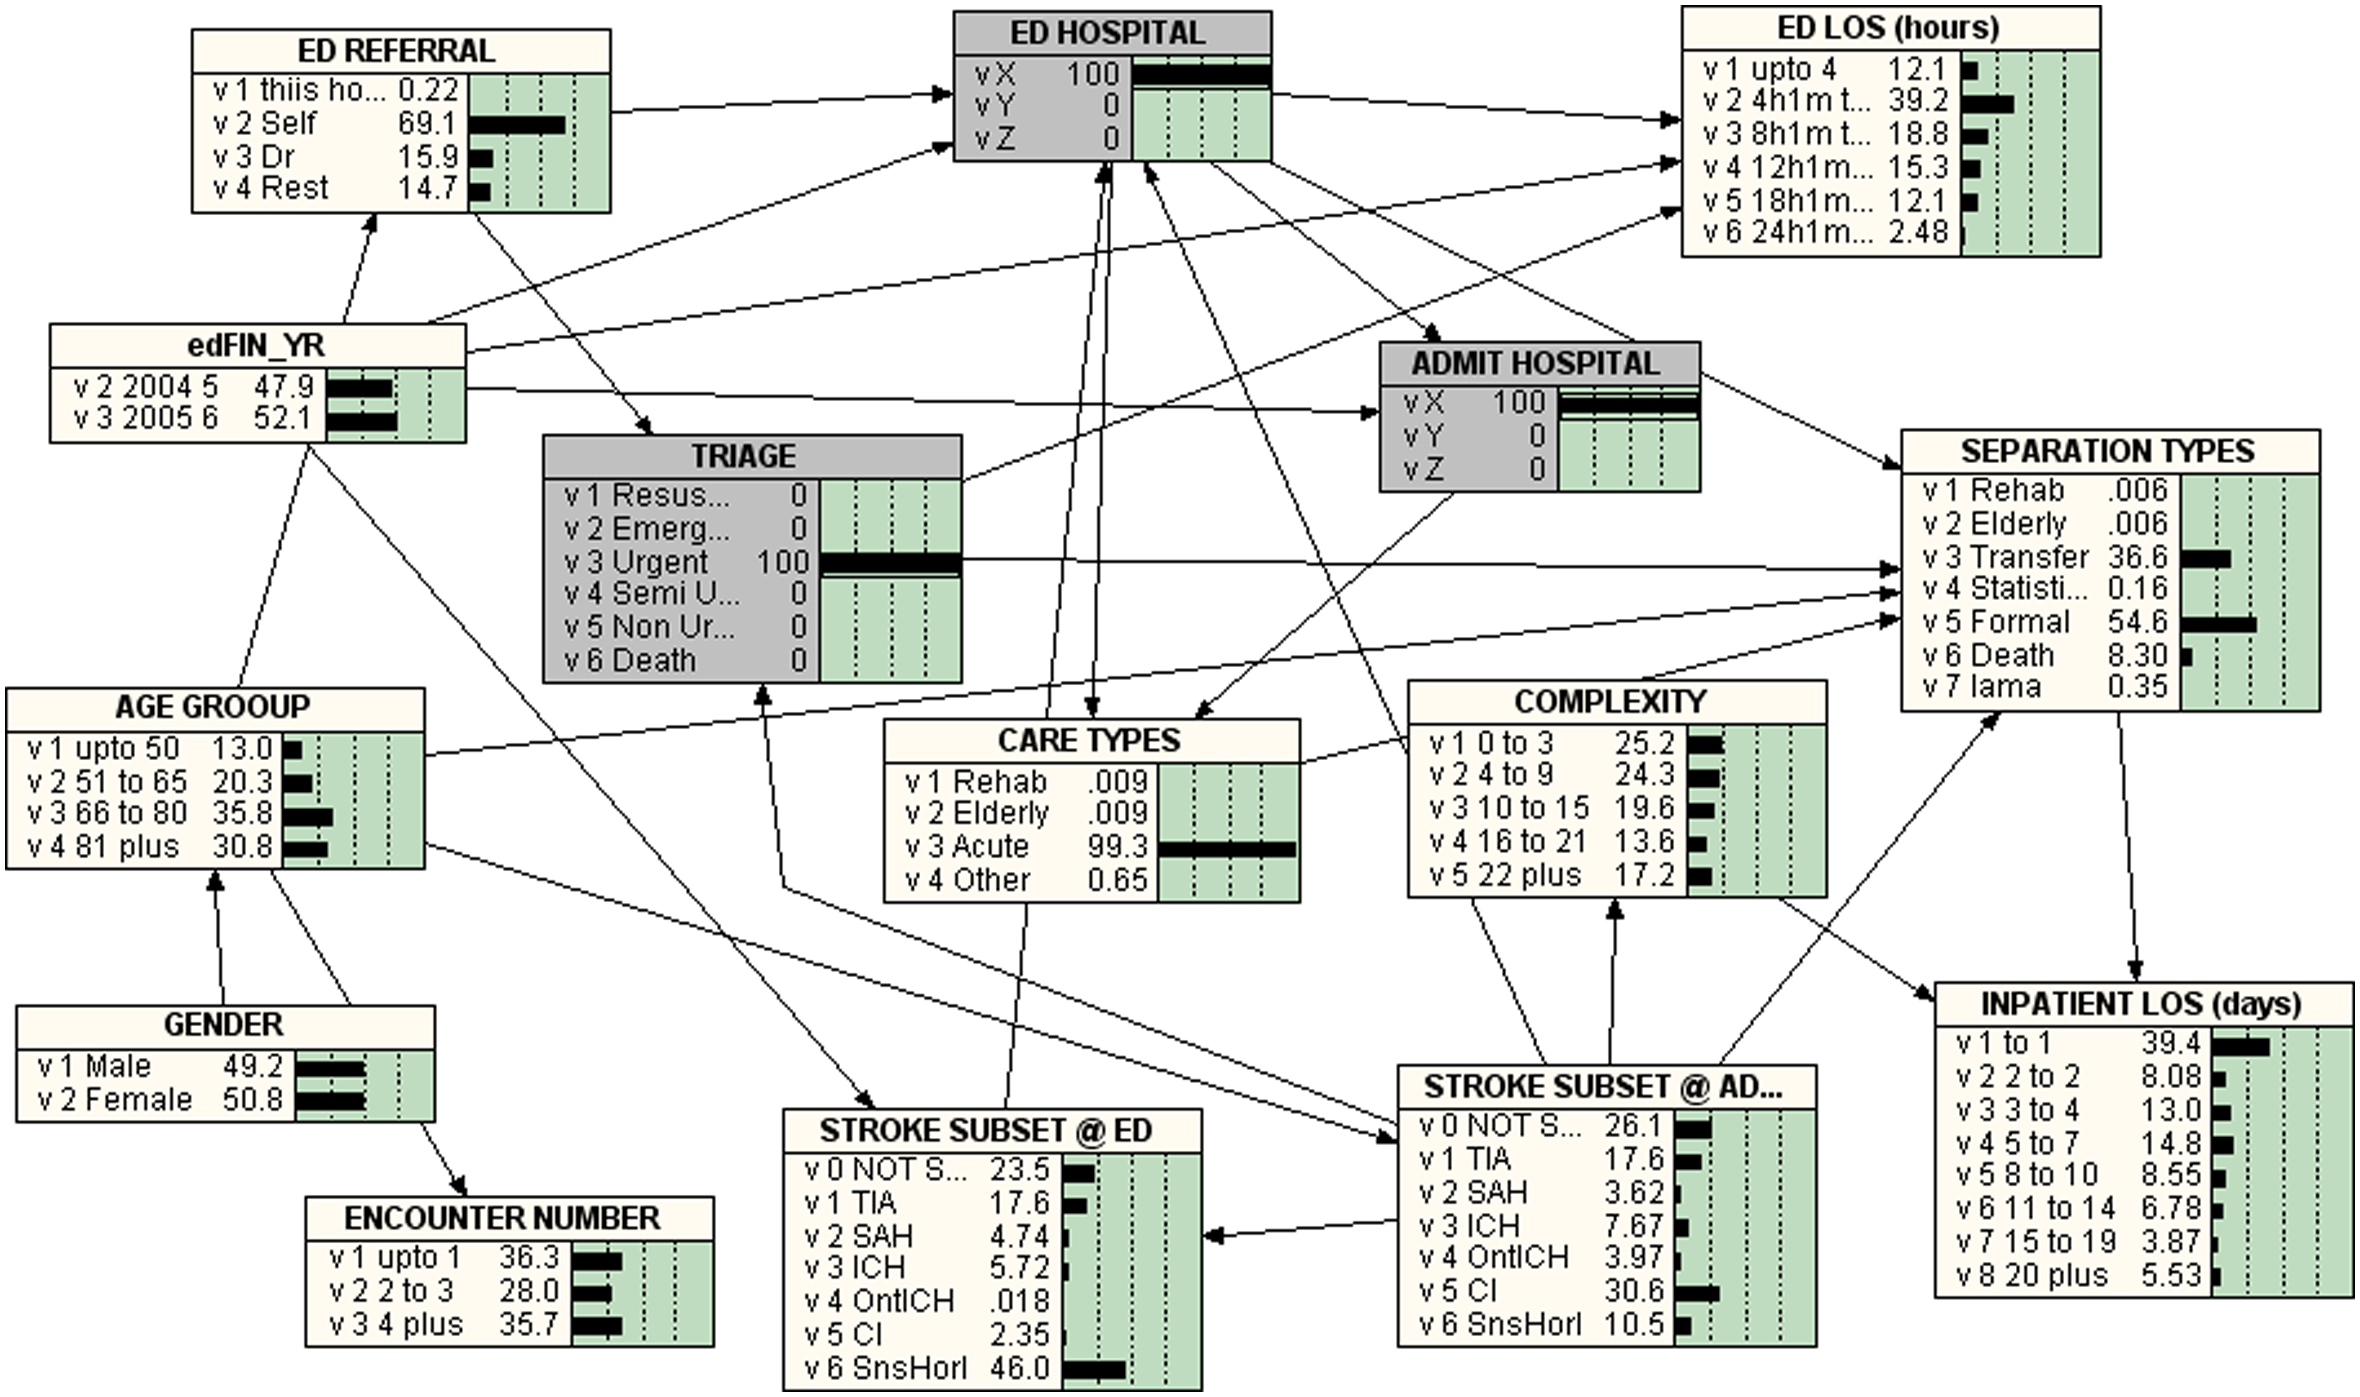
Bayesian Network for TRIAGE = 3 = URGENT
Bayesian Network for TRIAGE = 4 = SEMI-URGENT

Bayesian Network for TRIAGE = 5 = NON-URGENT
Key differences
In the study cohort,the gender distribution between triage categories was similar, with the gender influencing age.The age differences between triage categories were also unexceptional. From the arc direction in the BNs, it can be see that the age influences the number of presentations at the hospital, the stroke subtype at admission, the type of ED referral and the separation types.
The number of current hospital encounters did not have an influence on any of the studied parameters and there was no relationship between the triage categories and encounter number.
The Percentages of Triage Categories in Stroke Subtypes are listed in Table 1. The percentage of less than or equal to eight hours ED LOS in the triage categories ‘Resuscitation’, ‘Emergency’, ‘Urgent’, ‘Semi-urgent’ and ‘Non-urgent’ were 72.8%, 60.2%, 51.3%, 43.4% and 40.6% respectively.
In-patient diagnosis influenced the provisional diagnosis at ED presentation.There was no significant difference in the complexity of patient presentation between triage categories. However, stroke subtype (at admission) influenced the complexity of presentation and, in turn, patient complexity affected in-patient LOS. The proportion of patients who admitted to the same hospital within eight hours decreased dramatically as the ED triage category changed from 1 to 5.
In the study cohort, 19.9% of those who received resuscitation were transferred to other facilities and 62.1% who underwent resuscitations in ED died after admission. The in-hospital death declined with the lower priority triage categories. Eighty percent of the patients classified in ED as ‘Emergency’ were either transferred to other facilities (43.0%) or formally discharged (37.0%) from the hospital. The proportion of formal discharge from hospital was 54.6% for ‘Urgent’, 64.8% for ‘Semi-urgent and 60.8% for ‘Non-urgent. For the triage categories 3–5, the proportion of transfers was between 32.3% and 36.8%.
Discussion
Stroke and transient TIA are increasingly common conditions that are associated with significant morbidity and mortality. 69 The triage scale is said to relate to a number of outcome measures and provides an opportunity for operational assessment. 14 BNs were used here to analyze hospital administrative data in order to understand the impact of ED triaging of suspected stroke patients who subsequently experienced an in-patient admission in a large metropolitan teaching hospital with a SCU. A number of parameters were compared.
The discrepancies in the ED treatment of men and women have been documented, with a pattern of delayed care and poorer outcomes for women. 70 However, in this study the gender differences between triage categories were unremarkable, with gender having an impact on age distribution. The latter could be explained by the larger proportion of females in the older age groups.
Although there were no age differences between triage categories, age was found to influence the number of presentations at the hospital, the stroke subtype at admission, the type of ED referral and the separation types. The influence of age is not surprising as the elderly frequent the hospital more often and stroke is more frequent in the older age groups. 3
There was no relationship between the triage categories of suspected stroke and the number of visits to the current hospital. Surprisingly, the number of presentations at this hospital does not have an influence on any of the studied parameters.
As expected, the confirmed in-patient diagnosis influences the provisional diagnosis at ED presentation. It was noted that, in ED, some non-stroke patients are incorrectly (and presumably symptomatically) diagnosed as strokes and some strokes classified as non-strokes. This was corrected at admission following full investigation. The degree of difficulty of triage and diagnosis depends on whether symptoms are specific to a particular disease.
Early recognition and intervention in stroke are required to minimize mortality and morbidity. 7 In the current study, nearly half of the patients in each of the stroke subtypes were earmarked to be seen within 30 minutes, i.e. triaged as ‘Urgent’ (see Table 1). A study of EDs in Houston (TX, USA) 71 reported that the average time taken between ED arrival to a physician examination and computed tomography (CT) scan was 28 and 100 minutes respectively. From their review of the literature, Kwan et al. 72 found that the median delay from arrival at hospital to medical assessment ranged from 20 minutes to 4 hours. The above systematic review warns that, unless strokes are triaged as high priority to be assessed and managed quickly (ideally within one hour), thrombolysis is not likely to have a major effect on outcome. With the study cohort, it would be of interest to investigate the time to examination, CT scan and treatment. Although SCUs and thrombolysis have greatly improved the management of stroke patients, the benefits of these advances can only be fully realized if emergency departments recognize the signs of stroke and act both appropriately and promptly.6,7 After reviewing the literature, an Australian study 73 concluded that factual knowledge was more important than the years of emergency nursing or triage experience when it comes to triage decisions.
In the study cohort, 45% of TIA, 35.5% of SnsHorI, 27% of CI, nearly 18% of OntICH, nearly 17% of ICH and less that 10%of SAH were categorized as ‘Semi-urgent’ (to be attended within 60 minutes). TIAs are known to be an important risk factor for stroke.74,75 As nearly half of all post-TIA recurrent strokes is said to occur in the first 24 hours, there is a need for emergency assessment of TIAs. 76
The assessment at ED is done quickly (usually 2–5 minutes), with the patients’ triage being based on the need for time-critical intervention rather than severity of the illness. 14 Triage nurses are said to make valid and reliable estimates of patient complexity. 77 In the present study, the differences in the complexity of patient presentation between triage categories were not noteworthy—perhaps because triage is for a suspected stroke rather than patient complexity. Stroke subtype (at admission) influences the complexity of presentation. Patient complexity (and not the stroke subtype) impacts in-patient LOS.
The efficiency of an ED depends on many factors, including the delay in handing over to the appropriate hospital wards/units/departments for continuing care. Such access block and its effects on patient care are known.78–80 Therefore, to understand (and improve) ED LOS, one has to also focus on the area of the hospital that provides the next episode of care. An Australian study reported that the patients kept in the ED for longer than eight hours had an average in-patient LOS of 4.9 days compared with 4.1 days for the other patients. 81 The observed correlation between prolonged ED stay and excess in-patient LOS remained, even when results were adjusted for major confounding factors. 80 In the present study, the percentage of stroke patients presenting at ED who were admitted in the same hospital within eight hours were examined. The proportion admitted within eight hours decreased dramatically as the ED triage category changed from 1 to 5. ED delays and, hence, delay to treatment can be detrimental for patients with especially time-critical conditions. 82 A relationship between time to treatment and clinical outcomes has been demonstrated for patients with acute ischaemic stroke 83 and in acute stroke and TIA. 84 As timely and accurate imaging done in an ED guides the next course of action and outcome, 85 it would be informative to study the time to imaging in ED and on-going treatment.
Stroke is a medical emergency that needs prompt attention to avoid the possibility of severe deficits, complications and death.10,84,86,87 In the study cohort, 62.1% who receive resuscitation in ED died as an in-patient and 19.9% were transferred to other facilities. The percentage of in-hospital death decreased with the lower priority triage categories. The majority of patients classified at ED as ‘Emergency’ are either transferred to other facilities (43.0%) or formally discharged (37.0%) from the hospital. The proportion of formal discharge from hospital was observed to increase with a decrease in the urgency of triage categories (54.6% for ‘Urgent’, 64.8% for ‘Semi-urgent and 60.8% for ‘non-urgent’). The proportions of transfers remained at similar level (32.3–36.8%) for the triage categories 3–5. It appears the triaging practice at this hospital appears to be generally appropriate and achieves the desired effect.
Conclusions
BNs were used in this study as this method, via a graphical diagram, provides a comprehensive way of representing relationships and influences among nodes or variables. Thus, BNs are a convenient tool to model and subsequent display and explore associations among a set of variables.This study demonstrated that the selected algorithm and the hybrid BNs, when applied to stroke patient’s who were admitted from an ED presentation, can give an overview of the differences in the stroke patient journey/outcome profiles between the ED triage categories.
In the cohort of stroke patients who had presented at the ED of a major metropolitan teaching hospital with SCU and continued as an admitted episode, overall many of the characteristics and outcomes are as expected, indicating a good performance. Nearly half of the patients in each of the stroke subtypes was triaged as ‘Urgent’, to be seen within 30 minutes. The proportion admitted within eight hours decreased dramatically as the ED triage category changed from 1 to 5; the proportion of formal discharge from hospital was observed to increase with a decrease in the urgency of triage categories.It is notable, however, that 45% of TIAs were categorized as only ‘Semi-urgent,’ indicating an opportunity to improve emergency assessment of TIAs.In this study, unlike other studies, the gender differences between triage categories were unremarkable.
There are some limitations in this study. As with any analysis/modelling, the results can be influenced by the quality of the data collection and the computational methodology employed in the construct of BNs. The advantage of using the standardized hospital administrative data has already been pointed out and BNs are a known, rigorous, well-defined technique. The BN constructs from the hospital administrative data helped to identify only a limited set of factors and gave a high-level view of process and outcome of care. Further follow-up of pre- and post-study journeys and abstraction of greater details from the medical records would be required to better explain some of the observed differences.
Emergency departments on their own, as well as the ED to in-patient journey, present unique challenges for process improvement. Studies such as this are important for gathering information on the impact of current triage practices and highlighting areas for further exploration.
Footnotes
This research received no specific grant from any funding agency in the public, commercial, or not-for-profit sectors.