
Abstract
Background and aims:
Psoas muscle surface area (PMA) can estimate sarcopenia related long-term mortality risk. This study explored whether this association is linear or non-linear and if a meaningful threshold defines patients at high risk.
Methods:
This retrospective individual participant-level meta-analysis included four different cohorts of 3893 patients undergoing cardiovascular interventions: 1302 abdominal aortic aneurysm repairs (AAA), 1099 transcatheter aortic valve insertions (TAVI), 593 surgeries for thoracic aortic and aortic valve pathology (TA) and 899 procedures for peripheral artery disease (PAD). The association between PMA and mortality was visualized using pooled spline curves. Cox models were fitted separately within each cohort with three levels of adjustment, and hazard ratios were combined using inverse-variance meta-analysis. Results were replicated in a retrospective dataset of 561 patients undergoing carotid endarterectomy or thrombectomy for ischemic stroke, where sarcopenia status was estimated using masseter muscle surface area.
Results:
Age and sex were the most important features associating with PMA (p < 0.001), but significant variation between the cohorts was also observed (p < 0.001). The association between PMA and long-term mortality was inverse and linear (p < 0.001). Patients with poor muscle status (Z-values –1.5 or less for PMA) had significantly higher adjusted risk of death (hazard ratio (HR) of 1.6 with 95% confidence interval (CI) 1.3–2.0, p < 0.001) when compared to all other patients. Similar results were observed in the replication cohort (HR 1.7, 95% CI 1.0–2.82, p = 0.04).
Conclusions:
Long-term mortality after a cardiovascular intervention increases linearly as the PMA value decreases. Patients with poor muscle status (Z-values below –1.5) seem to have consistently elevated mortality risk independent of other risk factors.
Context and relevance
Sarcopenia, defined as low psoas muscle area (PMA), is associated with increased mortality after cardiovascular procedures, but prior studies have lacked standardized thresholds for PMA. In this meta-analysis of four independent cohorts comprising nearly 4000 patients, we identified an inverse, predominantly linear association between PMA and long-term mortality, without clear biological threshold. However, patients with a sex-specific PMA Z-score below –1.5, corresponding to values at least 1.5 standard deviations below the mean PMA, exhibited significantly higher mortality risk. These findings support incorporating PMA into preoperative risk assessment, especially in elective surgery where physiological reserve is prognostically relevant. As risk models evolve, PMA may serve as one of several key variables for surgical decision-making.
Introduction
Numerous recent studies have shown a significant association between psoas muscle area (PMA) and mortality among patients undergoing invasive cardiovascular procedures.1–12 However, the results are highly heterogeneous, with some large studies even reporting negative results. 13 Despite the majority of studies showing positive associations, it is unclear which thresholds should be set to indicate significant risk when measuring PMA.
One of the problems leading to the heterogeneity and difficulties in interpreting the clinical utility of previous results is that there is no clear consensus on whether the putative association between PMA and mortality is linear or if there is a cut-off value after which the mortality risk would increase dramatically. The majority of previous studies lack statistical power and the linearity of the association has not been truly evaluated. As a result, many studies have used several different methods for population stratification for statistical comparisons resulting in highly variable and poorly reproducible results.1,2,4,5,8–10,12–14
One more possible source of bias is variability in methodologies in measuring PMA. PMA has often been indexed to body size, for example using height or body surface area. In addition, depending on the study, PMA is measured from different levels of the lumbar spine.2,7,8,10,14,15 We have previously shown in a large meta-analysis of three different cohorts of patients that indexing to body size or using different anatomical levels for PMA measurement does not result in any significant improvement in the predictive values of PMA measurements when compared to using sex-specific values. 16
In this study, we assessed the linearity between PMA and mortality and investigated if there is a clear cut-off point for sex-specific PMA values after which the prognosis of patientsś recovery from cardiovascular procedures worsens significantly.
Methods
Study design
This was a retrospective registry study of consecutive patients undergoing various vascular and valvular operations at Tampere University Hospital and Tays Heart Hospital. It consists of four cohorts with a total of 3893 patients. Three of these cohorts are the same as in our previously published study including 1302 abdominal aortic aneurysm repair (AAA) patients (open surgery n = 530, endovascular repair n = 772), 1099 transcatheter aortic valve implantation (TAVI) patients and 593 patients undergoing open surgery for thoracic aortic and aortic valve pathology (TA), defined as combined procedures involving replacement of the ascending aorta and/or aortic root, often with concomitant valve replacement and/or coronary artery bypass grafting. 16 In addition, we included a new cohort of 899 patients treated invasively for peripheral artery disease (PAD). Patients with missing PMA measurements at the L3 vertebral level (258 patients treated for AAA and 1 patient for TAVI) were excluded. The final sample size was 1044 in AAA, 1098 in TAVI, 593 in TA and 899 in PAD cohorts.
This study was conducted adhering to the ethical principles of the Helsinki Declaration and approved by the institutional review board of Pirkanmaa Hospital district (now Pirkanmaa Wellbeing Services County) with permit number R20602. Due to the retrospective nature of this registry study, no formal patient consent was required or obtained.
Collection of clinical data
Clinical background data was acquired from two prospectively updated registries designed to collect relevant procedural and patient-related clinical data of patients undergoing invasive operations (the vascular surgery registry maintained by vascular surgeons and the KARDIO registry maintained by cardiologists and cardio-thoracic surgeons). These data were further complemented retrospectively by clinical information collected from the electronic hospital registry and by review of written patient records and charts.
Psoas measurements
Psoas measurements from L3 level were performed based on preoperative computer tomography (CT) or magnetic resonance angiography (MRA) and in some cases after the operation if only postoperative images were available (<3% of images taken within 30 days after the operation). In PAD patients, preoperative imaging was performed using MRA, and PMA was therefore assessed from MRA images in this cohort. Muscle cross-sectional areas measured from CT and magnetic resonance images have been shown to correlate strongly. 17 The medians and interquartile ranges for the time between CT imaging and the operation for different cohorts were as follows: 42 (13–49) days for AAA patients, 40 (17–74) for TAVI patients and 49 (1–118) for TA patients. The corresponding time between MRA to operation for PAD patients was 43 days (29–63). CT measurements were performed using the contrast-enhanced arterial phase and axial slices thickness between 0.50–3.00 mm. Preliminary quality control analysis did not show that CT slice thickness would substantially associate with measured mean PMA value distribution. Two different CT scanners were used: The General Electric LightSpeed 16-row scanner (GE Healthcare, Milwaukee, WI, USA) and the Philips Brilliance 64-row scanner (Philips Healthcare, Best, Netherlands) (~80% with 100 kV and ~20% with 120 kV). Both were in equal use and there was no selection between these scanners. The MRA studies were performed with two scanners: Siemens Prisma 3T and Philips Ingenia Edition X 3T. The MR sequence types and parameters were fl3D (TE 0.97 ms, TR 2.74 ms) and mDIXON (TE 0.97 ms, TR 2.74 ms) with voxel sizes 1.3 × 1.3 × 1.3 mm and 1 × 1 × 2 mm, and the matrix dimensions 384 × 384 and 432 × 351. CTA and MRA images were reviewed using medical imaging workstations (Carestream Vue PACS viewer version 11.4.0.1253, Rochester, NY, USA). The psoas muscles were carefully outlined with free-hand tool along the prominent muscle fascia after which the imaging workstation program automatically calculated the area of the outlined muscle in mm2 (Phillips Intellivue software (Philips Healthcare, Best, Netherlands). Left and right PMA measurements were combined, and the average PMA was calculated to produce an estimate of the average of both sizes, which is less prone to measurement error and reduces the number of required statistical tests. The PMA measurements were performed by eight researchers (O.J., I.L., M.V., P.M., M.S., H.H., D.V., H.H.) and according to previous literature, intra- and inter-observer variability is considered acceptable.18,19
Statistical analysis
First, the mean PMA values were compared between cohorts stratified by sex by analysis of variance (ANOVA). Then, the mean PMA values were adjusted sequentially, first for age alone, and subsequently for age, weight, and height combined. These adjusted values were compared across the cohorts by analysis of covariance (ANCOVA). Linear regression analyses were conducted separately within each cohort to assess how selected covariates (age, sex, height, weight, and when available, comorbidities such as pulmonary disease, renal dysfunction, diabetes, hypertension, dyslipidemia, and coronary artery disease) were associated with PMA in men and women. The resulting regression coefficients were then combined using meta-analysis to evaluate which associations were most consistent across the cohort (i.e. statistically significant in meta-analysis).
To explore the linearity or possible non-linearity in the association between PMA and mortality we first converted PMA values to cohort and sex-specific z-values (mean value was set to zero with value one denoting one standard deviation from the mean). This was done to harmonize measurements across cohorts, because there was significant inter-cohort variability in mean values despite adjusting for mean age in each cohort. To visualize the association between sex-specific z-standardized PMA values and long-term mortality, we performed an age-adjusted cox regression analysis using penalized regression splines (default setting of three knots) in the pooled study population (i.e. all study cohorts combined). This model was adjusted for available clinical risk factors.
To gather more specific information on prognostic thresholds and to account for variation in sex-standardized values, the cohorts were divided into five Z-score categories: excellent (⩾1.5), good (0.50–1.49), normal (–0.49–0.49), impaired (–1.49 to –0.50), and poor (⩽–1.5). In each cohort, hazard ratios for mortality were calculated within these categories: unadjusted, age-adjusted, and fully adjusted for clinical risk factors including age, sex, urgency of procedure, pulmonary disease, renal insufficiency, dyslipidemia, diabetes, and coronary artery disease. These cohort-specific hazard ratios were then meta-analyzed to assess consistency across cohorts.
All meta-analyses were performed using the inverse variance method for pooling in R (package “meta”). Fixed effect model results were interpreted when heterogeneity was not significant (I² < 50% and p > 0.05 for heterogeneity testing), and random-effects model results were used when significant heterogeneity was observed (I² ⩾ 50% and p ⩽ 0.05).
To illustrate unadjusted survival differences between the Z-score categories, Kaplan–Meier survival analysis was conducted and cumulative incidence curves were plotted.
The Cox regression analysis using penalized splines was performed in R using the Hmisc package (function pspline) and the Survival package.
Independent replication
The results of categorization of patients according to sex-specific Z-values were replicated in two other patient cohorts, in patients who underwent carotid endarterectomy (n = 233) or cerebral artery thrombectomy (n = 328) for ischemic stroke with masseter muscle area measurement from pre-interventional CT angiography scans.20,21
Results
Population characteristics
General demographics of the four independent cohorts are presented in Table 1. On average, patients in the TAVI cohort were the oldest and the proportion of women was similarly highest among TAVI patients (53%, Table 1).
General demographics and follow-up information for four independent cohorts of patients undergoing interventions for different cardiovascular conditions.
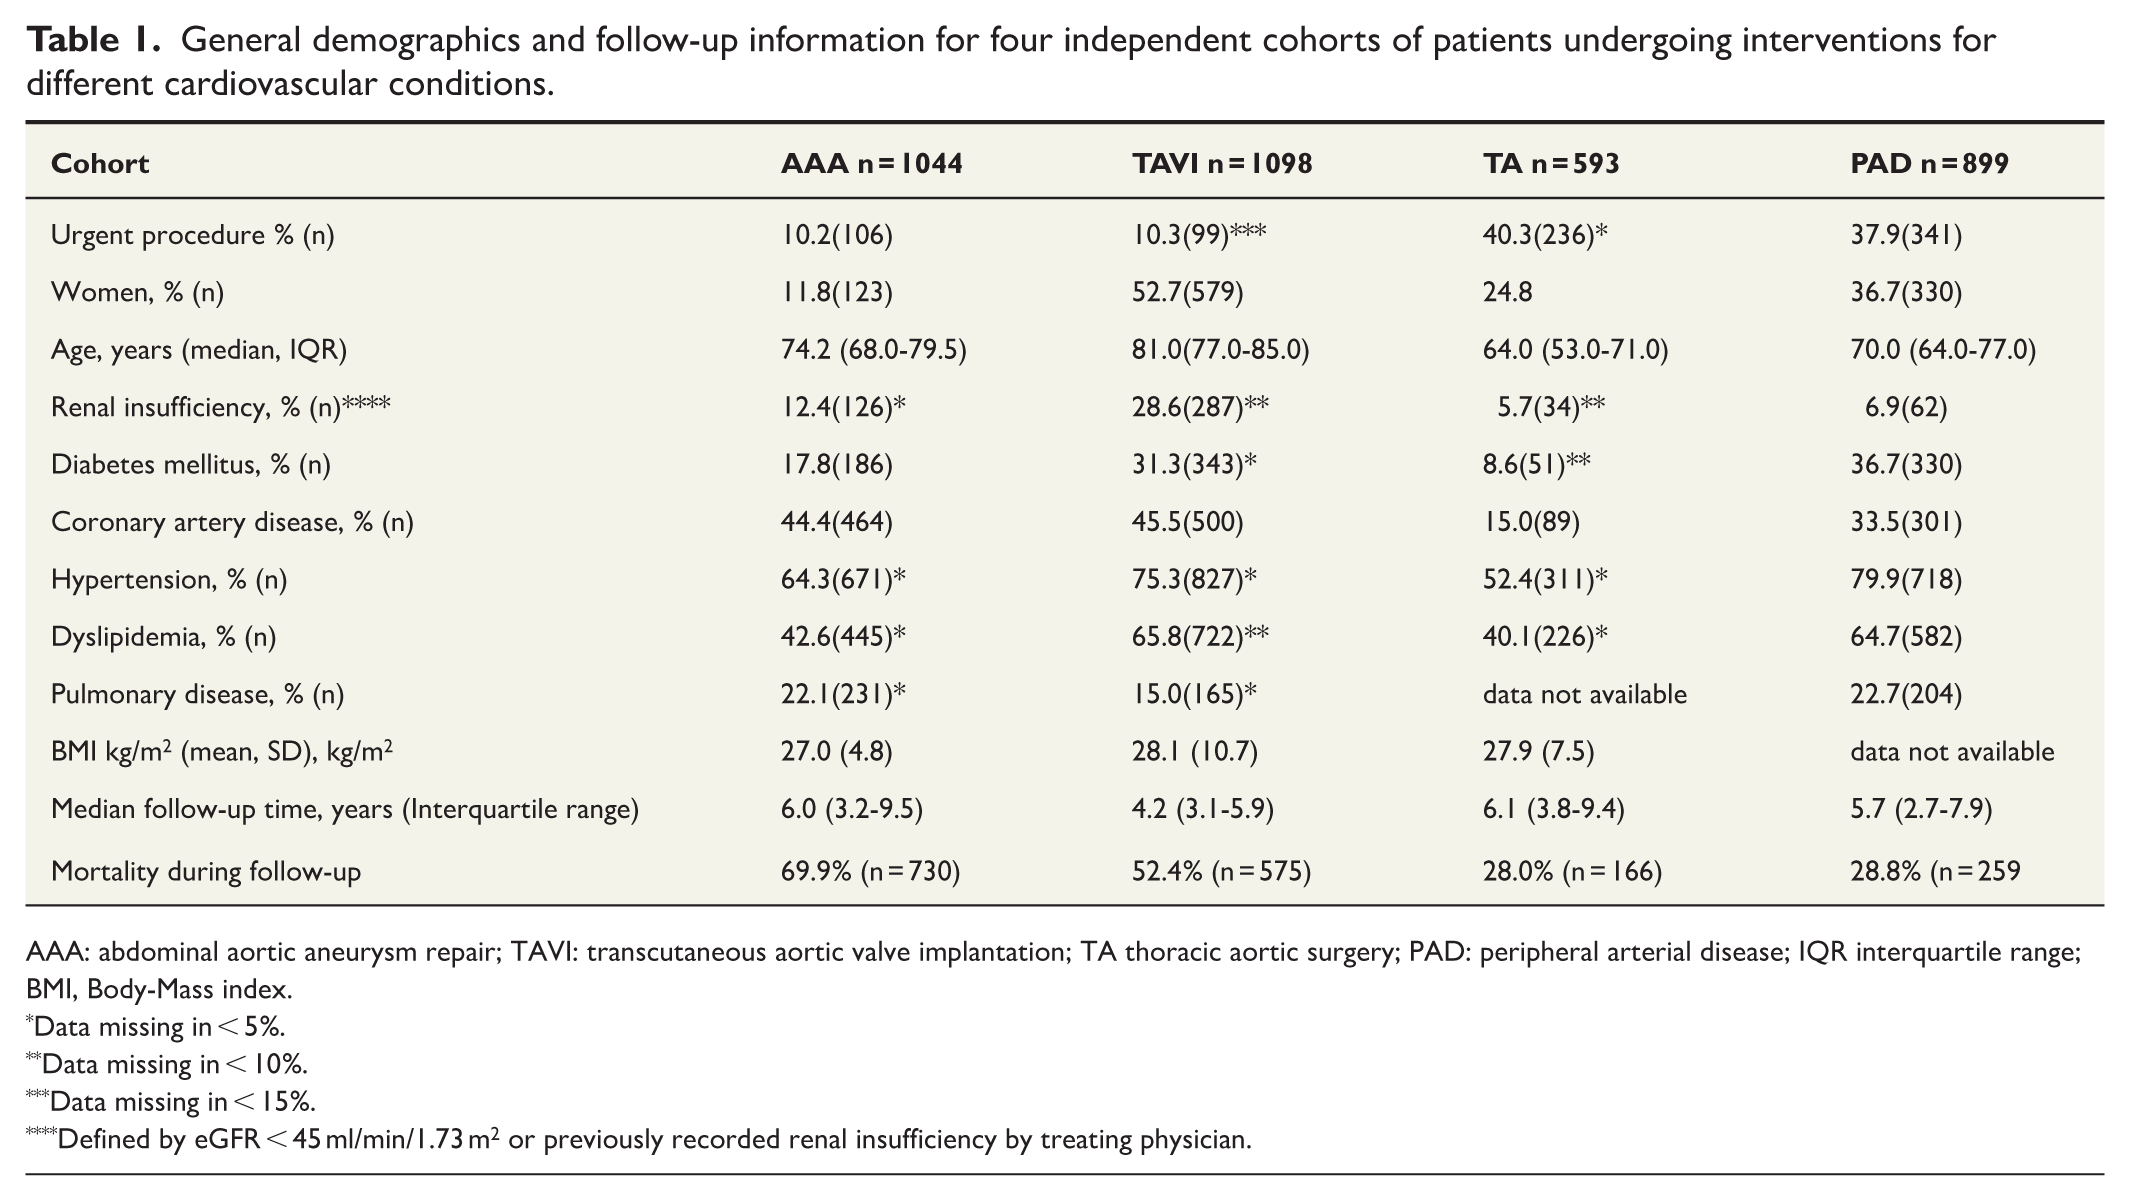
AAA: abdominal aortic aneurysm repair; TAVI: transcutaneous aortic valve implantation; TA thoracic aortic surgery; PAD: peripheral arterial disease; IQR interquartile range; BMI, Body-Mass index.
Data missing in < 5%.
Data missing in < 10%.
Data missing in < 15%.
Defined by eGFR < 45 ml/min/1.73 m2 or previously recorded renal insufficiency by treating physician.
Factors associated with PMA at baseline
The absolute PMA values corresponding to the Z-values are shown in Table 2. According to one-way unadjusted ANOVA and in ANCOVA adjusted with age and additionally with body weight and height, there was significant variance in PMA values across cohorts in both sexes (p < 0.001) (Table 3). Men had consistently larger mean PMA values. Sex-specific means and estimated mean values after correcting for age and body weight and height are presented in Table 3. Patients in the PAD cohort had the lowest PMA values in every comparison, whereas patients in the TA cohort generally exhibited the highest values. After adjusting for age, and additionally for body height and weight, patients in the TA and TAVI cohorts showed highest estimated PMA values, followed by AAA and PAD cohorts. The results of pairwise post hoc tests are presented in Supplementary Table 1. After age-adjustment, PAD patients had approximately 17–18% lower PMA values compared to TAVI and TA patients in men and 9–15% lower values in women.
Absolute value ranges in mm2 for different categories of muscle status defined by mean psoas muscle surface area measured from L3 level of the lumbar spine.
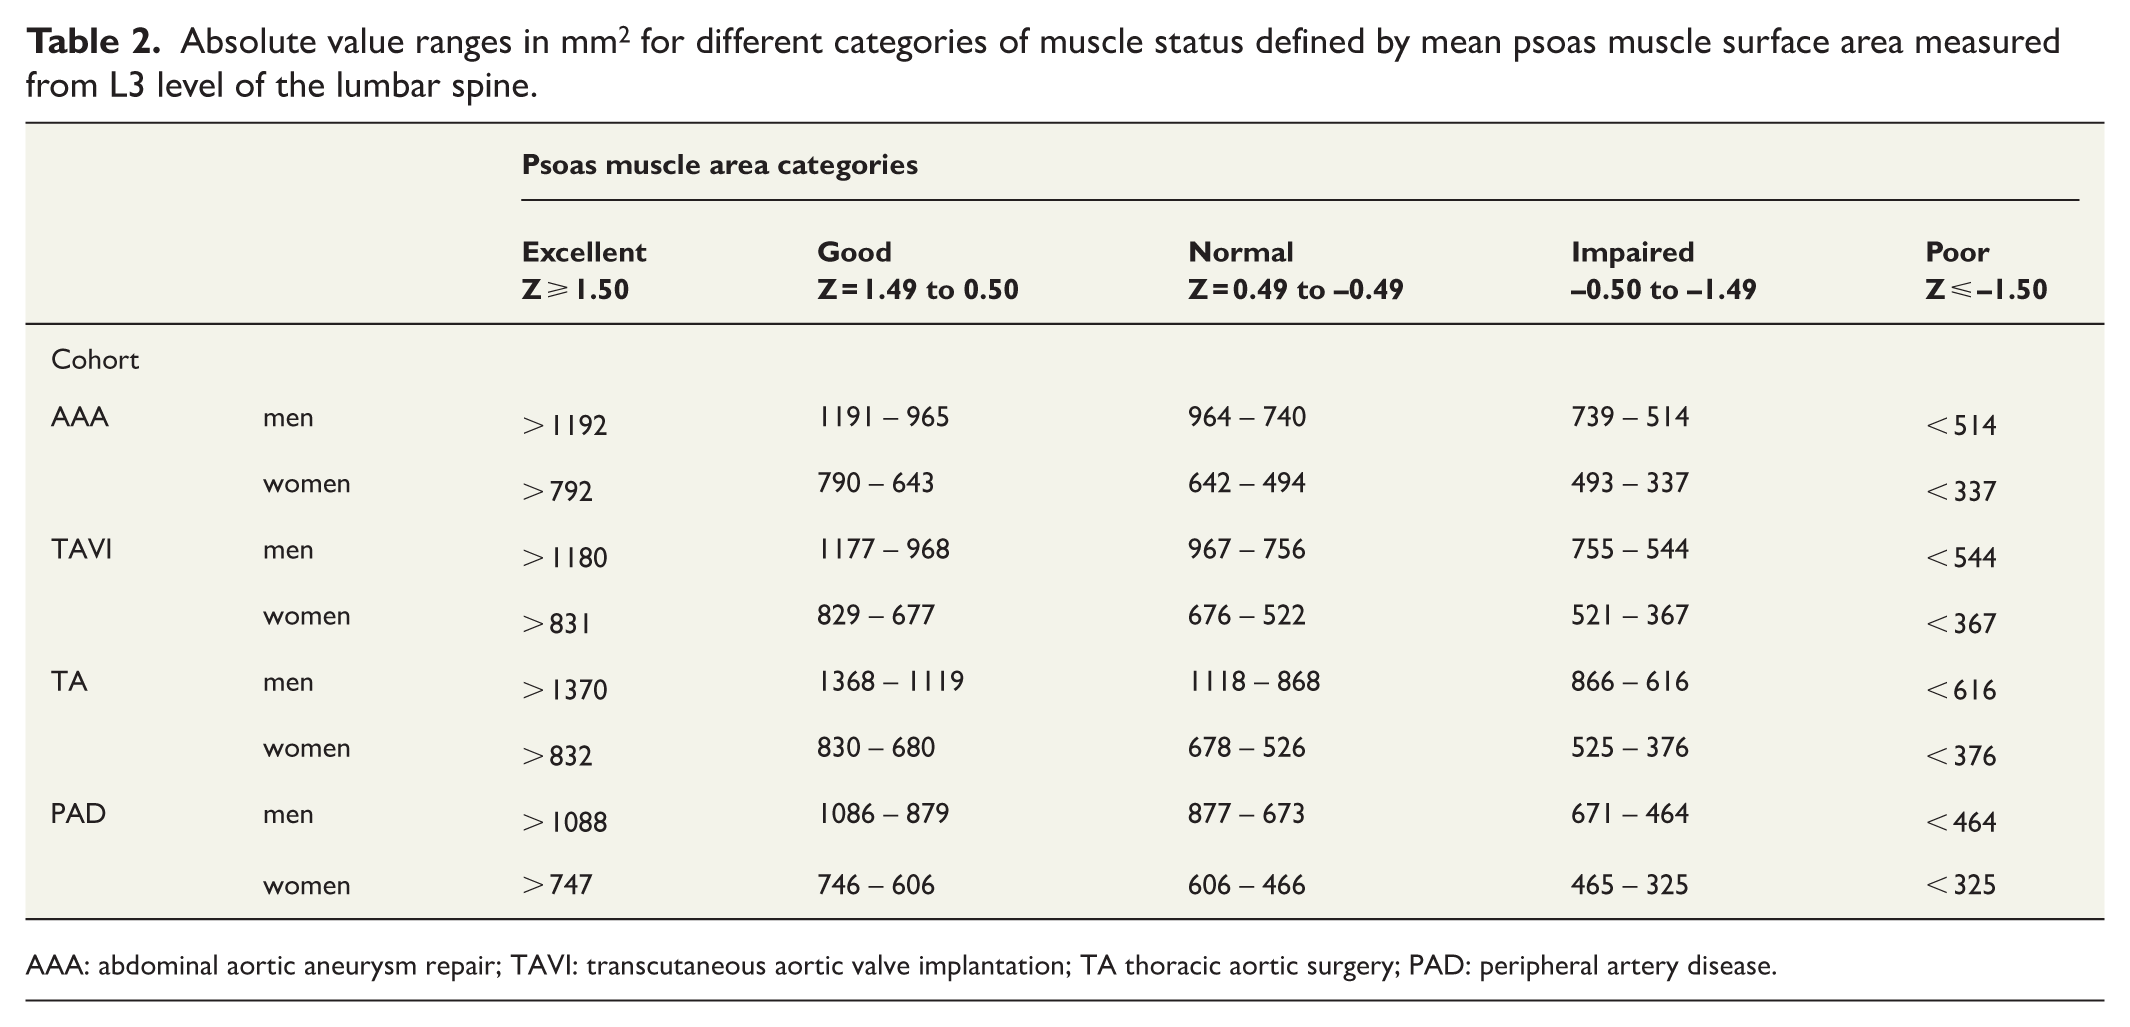
AAA: abdominal aortic aneurysm repair; TAVI: transcutaneous aortic valve implantation; TA thoracic aortic surgery; PAD: peripheral artery disease.
PMA by study cohort and sex: crude means (SD), adjusted means (SE), and overall group differences.
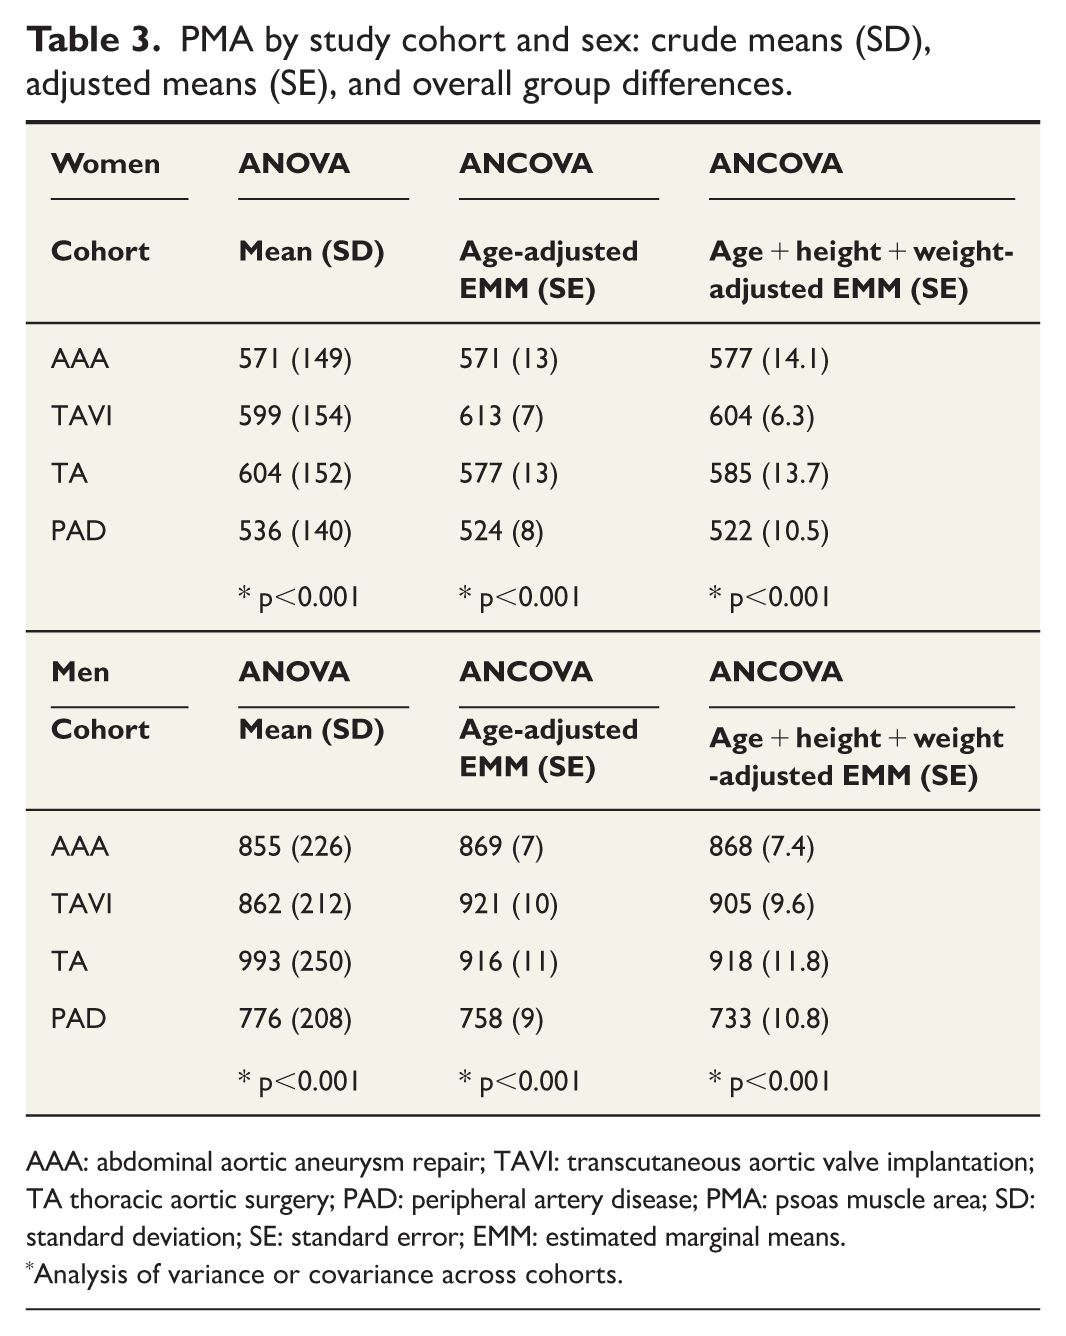
AAA: abdominal aortic aneurysm repair; TAVI: transcutaneous aortic valve implantation; TA thoracic aortic surgery; PAD: peripheral artery disease; PMA: psoas muscle area; SD: standard deviation; SE: standard error; EMM: estimated marginal means.
Analysis of variance or covariance across cohorts.
The meta-analyzed linear regression results revealed that only age and sex were consistently associated in all cohorts with PMA. Cohort-specific analyses are presented in Supplementary Table 2. A 10-year increase in age in men was associated with 71.5 mm2 (95% confidence interval (CI) 60.2–80.7, p < 0.001) lower PMA (I2 = 37.5%). In women, a 10-year increase in age was associated with 26.2 mm2 (Fixed effects model with 95% CI 16.2–36.3, p < 0.001) lower PMA (I2 = 0%). In the subgroup with available body surface area data (n = 2782, 76.6%) after additional adjustment for body surface area, a 10-year increase in age was associated with a decrease of 38.6 mm² in men (random-effects model; 95% CI 21.2–56.1; p < 0.001; I²= 65.8%). In women, the corresponding association was a decrease of 25.6 mm² (fixed-effects model; 95% CI 13.4–37.8; p < 0.001; I²= 22.3%).
After adjusting for age, meta-analysis across all cohorts showed that men had, on average, 268.7 mm² higher PMA compared to women (random-effects model, 95% CI 212.4–325.0, p < 0.0001; I² = 89.8%). After adjusting for age and sex, none of the other risk factors (pulmonary disease, renal function, diabetes, hypertension, dyslipidemia, or coronary artery disease) associated significantly with PMA in meta-analysis of all cohorts.
Association between PMA and long-term mortality
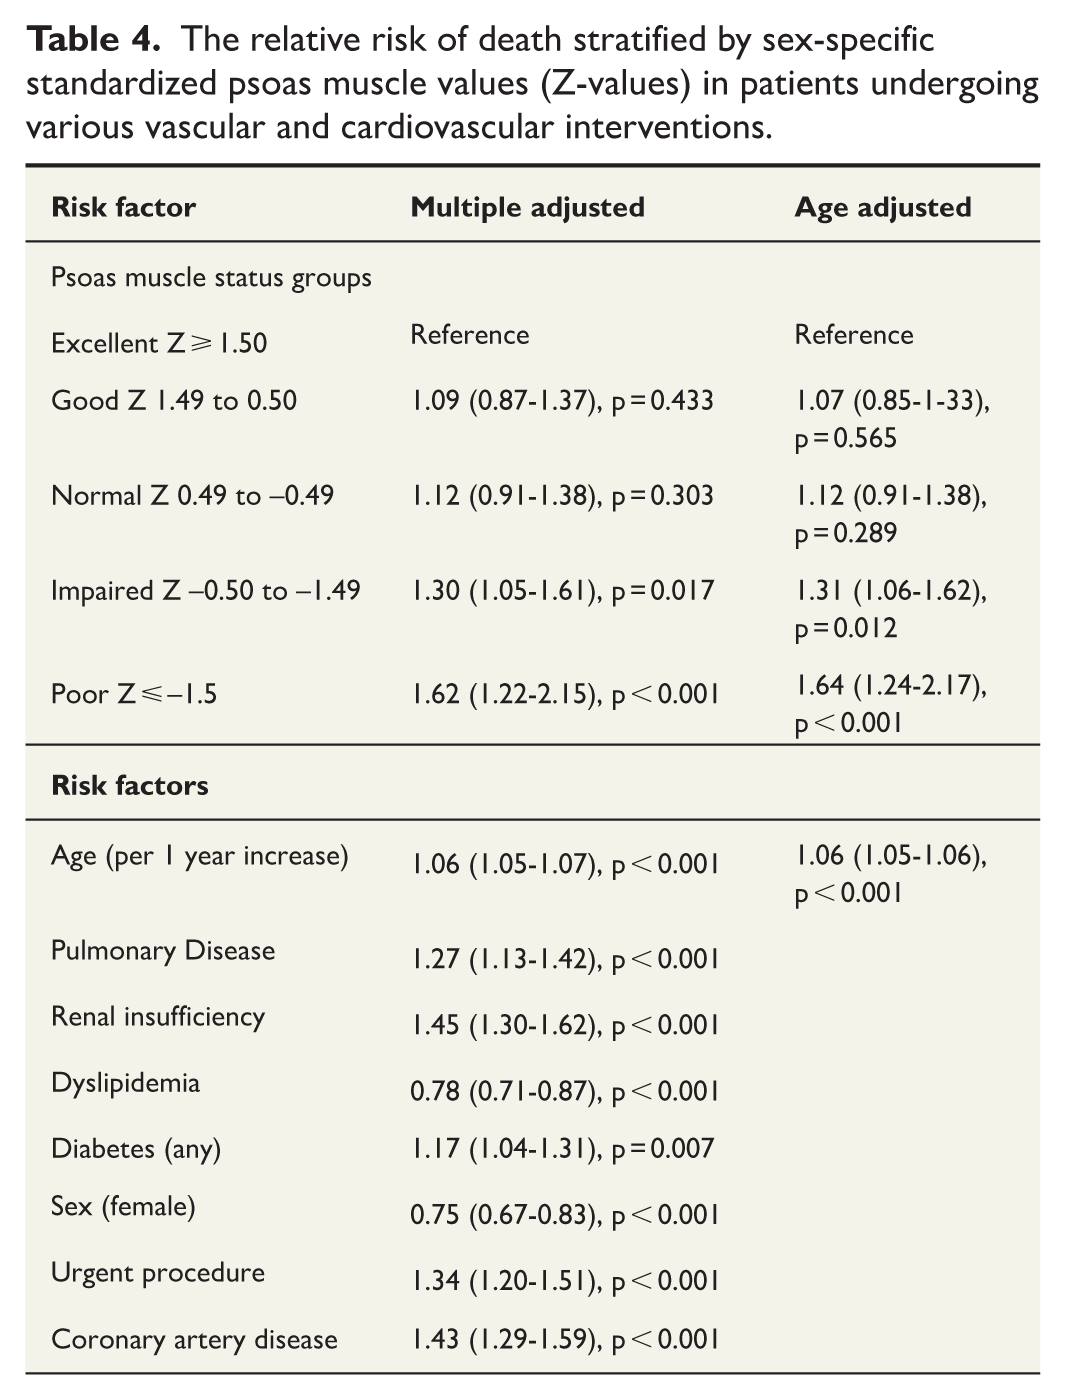
A pooled analysis of the association between the sex-standardized PMA and long-term mortality demonstrated a clear inverse and mostly a linear trend (Fig. 1). The same trend was observed in both men and women when analyzed separately, although in women, the number of observations was lower and the interpretation of the association curve was less reliable at the extremes (Fig. 2). Meta-analyzed unadjusted, age-adjusted and risk factor-adjusted mortality risk stratified by PMA values is presented in Table 4. and the cumulative mortality over time in each risk category is presented in Fig. 3. Briefly, the mortality risk increased from non-significant differences between patients with excellent, good and normal PMA values to significantly elevated risk in patients with impaired PMA (hazard ratio (HR) 1.30, 95% CI 1.05–1.61, p = 0.017) and poor PMA (HR 1.62, 95% CI 1.22–2.15, p < 0.001) when compared to the patients with excellent PMA values. These results were virtually unchanged regardless of whether the analysis was adjusted for only age or additionally for all significant cardiovascular risk factors (pulmonary disease, renal insufficiency, dyslipidemia, diabetes, sex, and coronary artery disease) and urgency of the procedure. When patients with poor muscle status (Z-value ⩽ –1.50) were compared to all other groups combined (PMA Z-values > –1.50), the relative risk remained significant (HR 1.61, 95% CI 1.30–1.98, p < 0.0001 for the age-adjusted analysis and HR 1.58 95% CI 1.25–2.00, p = 0.0001 for the full-risk-factor-adjusted analysis).
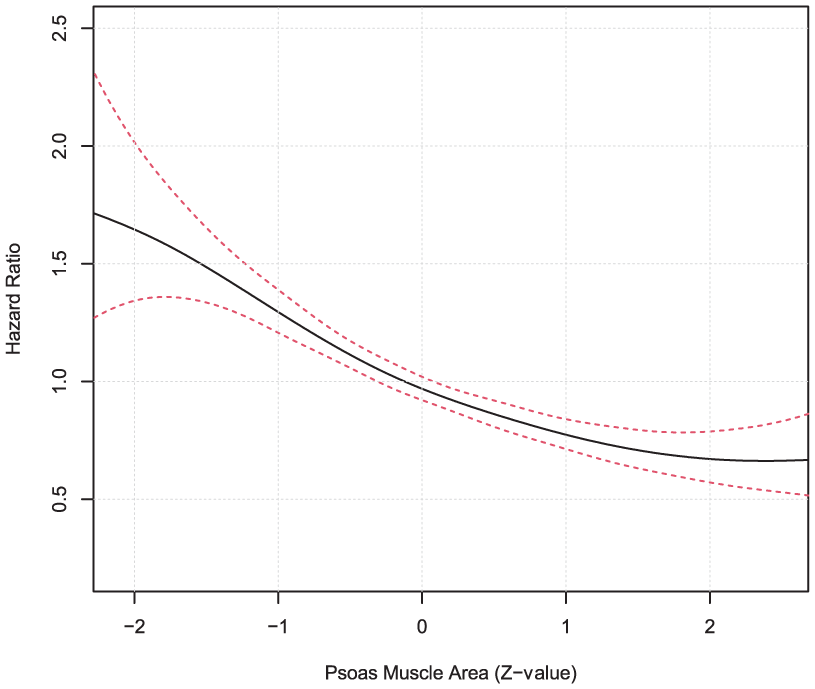
The age-adjusted cox regression analysis by splines visualizing cohort and sex-specific association curve for z-standardized psoas muscle surface area values and long-term mortality (95% confidence interval = dotted lines).
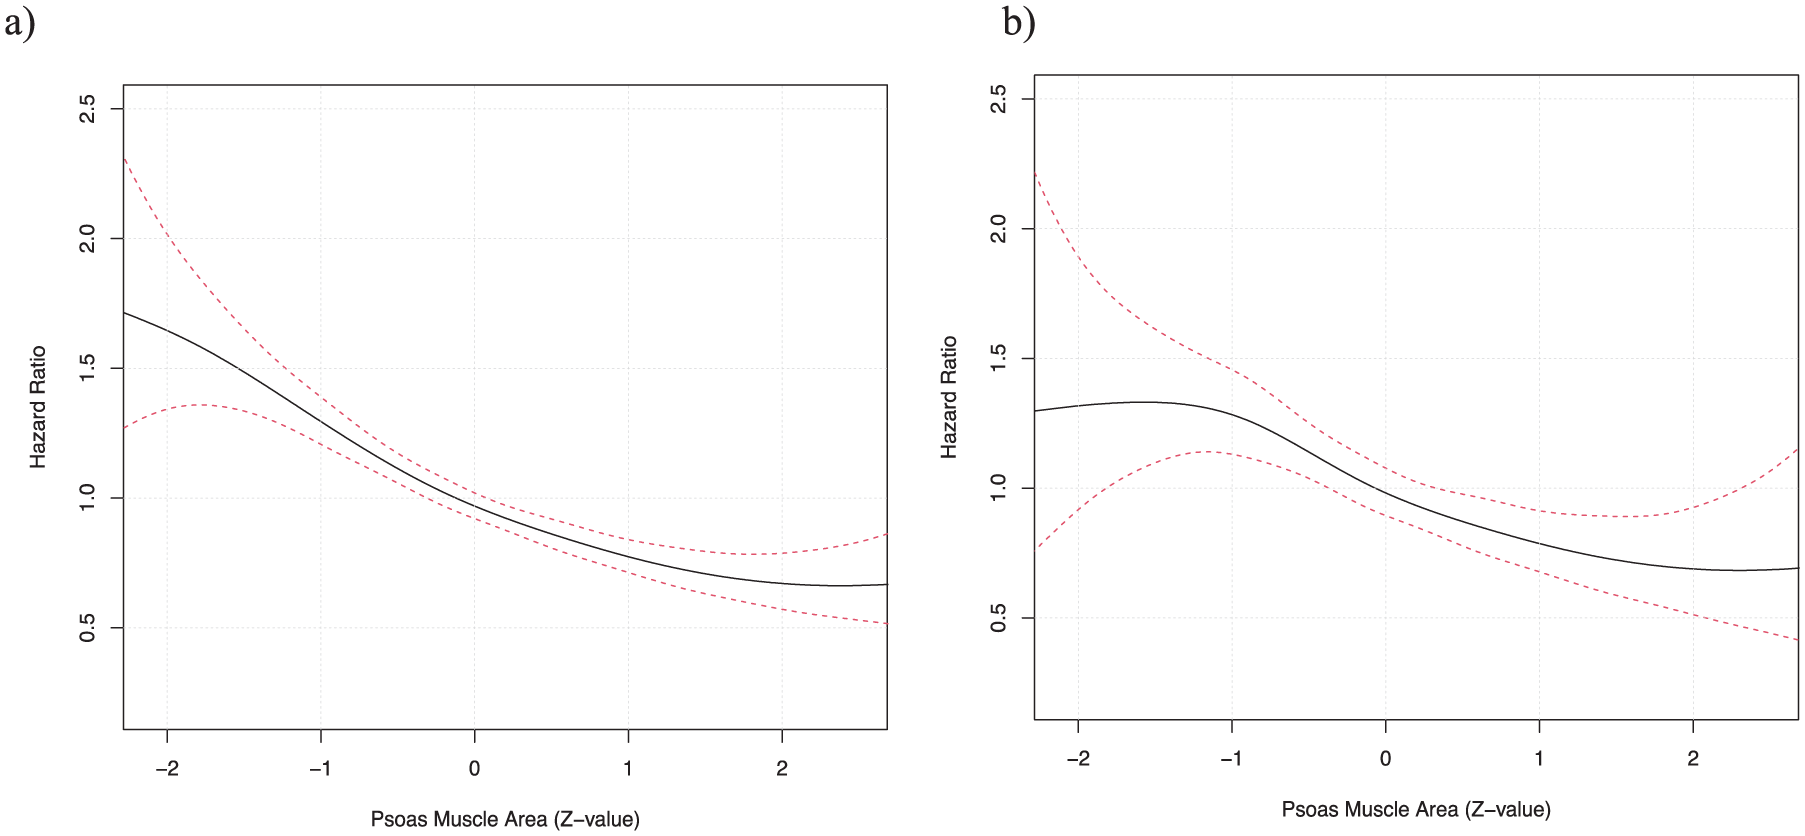
The age-adjusted cox regression analysis by splines visualizing an association between z-standardized psoas muscle surface area and long-term mortality both in men (A) and women (B) (95% confidence interval = dotted lines).
The relative risk of death stratified by sex-specific standardized psoas muscle values (Z-values) in patients undergoing various vascular and cardiovascular interventions.
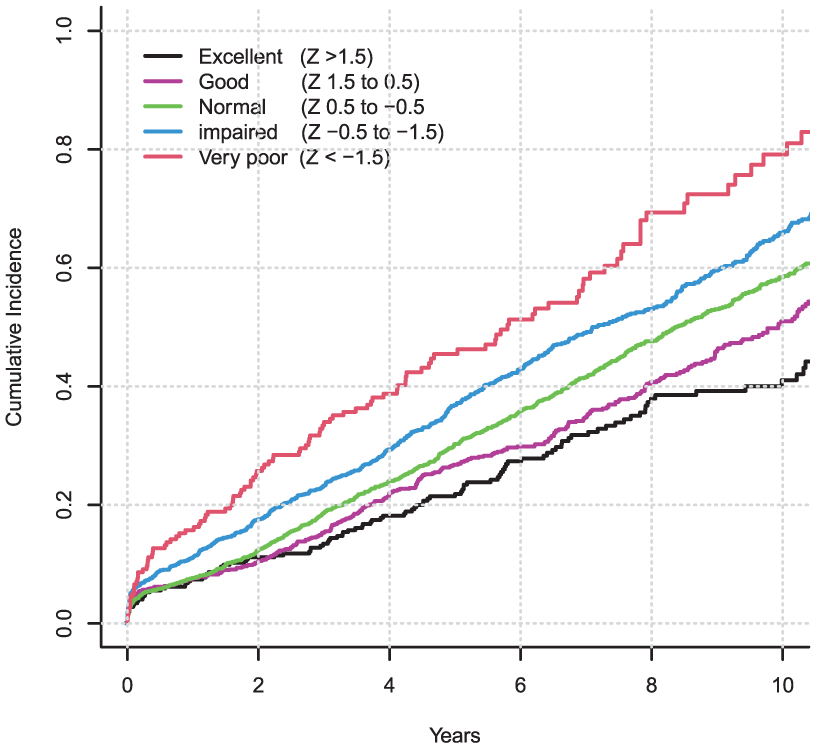
The cumulative incidence of death in patients who underwent cardiovascular interventions at baseline. Patients are divided into five separate categories by their psoas muscle surface area which was standardized according to cohort and sex-specific values (Z-values where value zero denotes mean value and each unit corresponds to one SD change in Z-value).
Replication of the results
Analysis of the association between sarcopenia measured based on the masseter muscle and long-term mortality among patients undergoing carotid endarterectomy or thrombectomy for ischemic stroke (median follow-up time 3.8 years with interquartile range 1.9–8.5 years during which 39.8% or 233 patients died) revealed that the results were almost identical and showed some tendency toward even higher mortality in patients with poor muscle status as measured from surface area of the masseter muscle (Supplementary Table 3). According to the risk factor-adjusted meta-analysis patients with poor sex-specific masseter muscle status (Z-value ⩽ –1.50) had significantly higher mortality when compared to other patients combined (Z-values > –1.50) (HR 1.70, 95% CI 1.02–2.82, p = 0.040, analysis adjusted with age, sex, renal insufficiency and diabetes which were all available in both cohorts of patients with masseter measurements).
Discussion
This retrospective meta-analysis of individual-level data from four independent cohorts undergoing vascular or valvular interventions is the first study to robustly assess the linearity between PMA and long-term postoperative mortality. We found a primarily linear, age-independent association with no sharp increase in risk beyond a specific threshold. However, patients with a sex-specific PMA 1.5 standard deviation below the mean showed markedly worse survival; 60–70% higher mortality compared to those with higher PMA values.
We observed significant variability in PMA values between all cohorts in both men and women. The difference is most likely explained by the different selection criteria for patients for different kinds of procedures based on general clinical condition and specifics of condition to be treated. This also means that it is very difficult to set absolute universal limits to clinically significant sarcopenia based on PMA measurements even if some deviation from linearity were observed. The use of z-values formed from the normal distribution of PMA values provides a possibility for a calibrated risk assessment in different populations and facilitates the evaluation of sarcopenia-related mortality risk. We used a sex-specific z-value transformation for PMA in several independent cohorts to evaluate the association between PMA and overall mortality and confirmed our findings by replicating the results in patients undergoing different operations (carotid endarterectomy and mechanical thrombectomy) and measuring muscle status from masseter muscle.20,21 Based on our findings, patients with muscle surface area values of 1.5 standard deviations below population mean can be reliably defined to have significant sarcopenia associating with clearly increased risk of death. When population-specific z-scores are used, we obtain truly standardized and comparable values. A z-score of –1.5 corresponds to an absolutely different value in different populations, but it consistently indicates a poor prognosis. Absolute age- and sex-specific thresholds cannot be generalized, as populations differ in their average PMA.
The observations made based on our data also indicate that while the association between PMA and mortality is clearly influenced by age, patientś underlying conditions do not seem to have an impact on this association. This observation is supported by a multitude of previous studies showing the same.1–12,15,19,20
In the absence of a clear biological non-linear risk function, if considered in preoperative risk assessment before heavy invasive operations, PMA should probably be used as a continuous variable with incremental risk function. However, this would require a robust understanding of the underlying baseline risk (based on patients risk profile). Furthermore, the type of procedure, the burden to the patients, time of recovery, expected clinical benefit and the urgency of the required procedure essentially affect how much weight the clinician should give to sarcopenia when considering the procedure. In the absence of reliable risk prediction models to which a continuous risk feature such as sex-specific PMA measurement could be integrated, one can reliably state that patients with poor muscle status defined at least 1.5 standard deviation below mean PMA have significantly higher mortality in the long-term. Most likely PMA status works best as a prognostic factor for elective procedures such as the non-ruptured AAA repair. Supporting this, we have previously demonstrated that PMA is not a significant predictor of early mortality in patients undergoing surgery for thoracic aortic and aortic valve pathology since the mortality is mostly affected by the severity of patients’ clinical condition in urgent and emergency operations. 16
The limitations of the present study include the lack of information on the specific causes of death. It would be very useful to know what modalities of mortality are associated with the muscle status derived sarcopenia assessment. Previous trials have been able to show a connection between sarcopenia and cardiovascular mortality although some other studies have not found that.22–24 A meta-analysis of more than 21.000 patients revealed an association with hypertension 25 and sarcopenia has been found to be associated with deaths caused by septic shock and pneumonia, especially aspiration pneumonia.26,27 In a meta-analysis of five studies and more than 700.000 patients, no association between sarcopenia and myocardial infarction was found. 28 Determining the specific cause of death in sarcopenic patients would be interesting and potentially useful in creating a tool for preoperative evaluation. Further limitation of this study is the retrospective setting which hinders reliable collection of data for other sarcopenia-related variables, such as hand grip strength, walking, standing balance, and chair raising time.29–31
To our knowledge, the linearity of the association between PMA and long-term postoperative mortality following cardiovascular interventions has not been previously assessed. This meta-analysis of nearly 4000 patients carries substantial statistical weight. It combines four cohorts with diverse cardiovascular conditions and varying risk profiles but comparable covariate data, enabling robust evaluation of the PMA–mortality relationship. In addition, we replicate the finding using masseter muscle area as a surrogate of muscle status in patients treated with carotid endarterectomy or mechanical thrombectomy for ischemic stroke.
Supplemental Material
sj-docx-1-sjs-10.1177_14574969251397740 – Supplemental material for Defining optimal muscle surface area thresholds for sarcopenia-related mortality after cardiovascular interventions
Supplemental material, sj-docx-1-sjs-10.1177_14574969251397740 for Defining optimal muscle surface area thresholds for sarcopenia-related mortality after cardiovascular interventions by Otto Järvinen, Juho Tynkkynen, Iisa Lindström, Marko Virtanen, Pasi Maaranen, Minea Söderlund, Henni Huhtamo, Damir Vakhitov, Jari Laurikka, Niku Oksala and Jussi Hernesniemi in Scandinavian Journal of Surgery
Supplemental Material
sj-docx-2-sjs-10.1177_14574969251397740 – Supplemental material for Defining optimal muscle surface area thresholds for sarcopenia-related mortality after cardiovascular interventions
Supplemental material, sj-docx-2-sjs-10.1177_14574969251397740 for Defining optimal muscle surface area thresholds for sarcopenia-related mortality after cardiovascular interventions by Otto Järvinen, Juho Tynkkynen, Iisa Lindström, Marko Virtanen, Pasi Maaranen, Minea Söderlund, Henni Huhtamo, Damir Vakhitov, Jari Laurikka, Niku Oksala and Jussi Hernesniemi in Scandinavian Journal of Surgery
Supplemental Material
sj-docx-3-sjs-10.1177_14574969251397740 – Supplemental material for Defining optimal muscle surface area thresholds for sarcopenia-related mortality after cardiovascular interventions
Supplemental material, sj-docx-3-sjs-10.1177_14574969251397740 for Defining optimal muscle surface area thresholds for sarcopenia-related mortality after cardiovascular interventions by Otto Järvinen, Juho Tynkkynen, Iisa Lindström, Marko Virtanen, Pasi Maaranen, Minea Söderlund, Henni Huhtamo, Damir Vakhitov, Jari Laurikka, Niku Oksala and Jussi Hernesniemi in Scandinavian Journal of Surgery
Footnotes
Acknowledgements
NA
Author contributions
OJ contributed to data acquisition, statistical analysis, writing of an original draft, review and editing of the article. JT contributed to statistical analysis, writing of an original draft, review and editing of the article, and supervision. IL, MV, PM and DV contributed to data acquisition and review and editing of the article. MS and HH contributed to data acquisition. JL contributed to review and editing of the article. NO contributed to the study concept, study design, review and editing of the article and supervision. JH contributed to data acquisition, statistical analysis, writing of an original draft, review and editing of the article, study concept, design, and supervision.
Declaration of conflicting interests
The authors declared no potential conflicts of interest with respect to the research, authorship, and/or publication of this article.
Funding
The authors disclosed receipt of the following financial support for the research, authorship, and/or publication of this article: This study was supported by the competitive research funding of the Pirkanmaa wellbeing area, the Tays support foundation, the Finnish foundation for cardiovascular research and by European commission research funding (HORIZON, CVD Link).
Supplemental material
Supplemental material for this article is available online.
References
Supplementary Material
Please find the following supplemental material available below.
For Open Access articles published under a Creative Commons License, all supplemental material carries the same license as the article it is associated with.
For non-Open Access articles published, all supplemental material carries a non-exclusive license, and permission requests for re-use of supplemental material or any part of supplemental material shall be sent directly to the copyright owner as specified in the copyright notice associated with the article.