
Abstract
Background and Aims:
The coverage of the official statistics is poor in motorcycle and moped accidents. The aim of this study was to analyze the severity of motorcycle and moped crashes, and to define the degree of under-reporting in official statistics.
Material and Methods:
All first attendances due to an acute motorcyclist or moped driver injury registered in the emergency department between June 2004 and May 2006 were analyzed. The severity of the injuries was classified using the Abbreviated Injury Scale score and the New Injury Severity Score. The hospital injury data were compared to the traffic accident statistics reported by the police and compiled and maintained by Statistics Finland.
Results:
A total of 49 motorcyclists and 61 moped drivers were involved in crashes, leading to a total of 94 and 109 injuries, respectively. There were slightly more vertebral and midfoot fractures among motorcyclists than among moped drivers (p = 0.038 and 0.016, respectively). No significant differences were found between the severity (maximum Abbreviated Injury Scale and median New Injury Severity Scores) of the motorcycle and moped crashes. There was no in-hospital mortality. The degree of agreement (overlap) between the hospital dataset and the official statistics was 32%. The rate of under-reporting was 68%.
Conclusions:
According to the maximum Abbreviated Injury Scale and New Injury Severity Scores, the injury severity was equal for motorcycle and moped crashes. The degree of agreement between the hospital dataset and the official statistics was 32%.
Introduction
Riding motorcycles and mopeds is increasing in Finland. Between 2000 and 2012, the number of motorcycles and mopeds increased by 170% and 186%, respectively (1). Both activities are risky. According to one US investigation, motorcyclists are 35 times more likely than passenger-car occupants to die in a motor vehicle traffic accident, and eight times more likely to be injured per vehicle mile (2). A Canadian study showed that motorcyclists are more than 3.5 times more likely to be injured or die than other motor vehicle drivers (3). Research from Sweden reports a 20 times higher risk of injury associated with traveling by moped than by car (4). A German study showed that adolescents driving mopeds had a 24-fold risk of injury compared to bicyclists (5).
In Finland, a moped or scooter is a vehicle with an engine displacement of at most 50 cc, and the top speed limit is 45 km/h. Since October 2005, it has been legal to have a passenger on a moped or scooter. Two-wheeled vehicles with higher engine displacements and speeds above 45 km/h are classified as motorcycles.
Traffic safety assessments in Finland are based on the official traffic accident statistics reported by the police and maintained by Statistics Finland. The statistics on fatal traffic accidents are correct, but those on injured subjects are insufficient (6). The Finnish authorities define a fatal vehicle accident as a road-traffic accident causing the death of any person at the scene, on arrival at hospital, or within 30 days of the event (7). The development of the national injury statistics indicates that the coverage of the official statistics is poorest in bicycle accidents and second poorest in motorcycle and moped accidents (8).
In Finland, little is known about the severity of injuries caused by motorcycle and moped crashes. The classification of injury severity is neither used in clinical work nor recorded in national injury statistics in Finland. In 2013, the European Union (EU) issued a recommendation to all member states on the definition of serious injury and the compilation of statistics on serious injuries in traffic accidents (9).
The aim of this study was, using hospital injury data, to analyze the injury patterns and injury severity of motorcycle and moped (including scooter) crashes, and to define the level of under-reporting of these crashes in official statistics. Since these two-wheeled motor vehicles differ from each other in power and speed, our hypothesis is that the injuries of motorcyclists are more severe than those of moped drivers.
The present case is a first study in Finland with regard to the definition of serious injuries in motorcycle and moped accidents.
Materials and Methods
Study Design
We registered prospectively consecutive motorcycle and moped accident victims who attended the Emergency Department at the North Kymi Hospital, Kouvola, Finland, during 2 years from June 1, 2004 to May 31, 2006. During that time period, we could collect the injury data directly in the electronic patient record system, via the injury database created for this purpose. According to population statistics in study years, the North Kymi Hospital (level II trauma center) was responsible for an area with nearly 100,000 inhabitants. The catchment area is a typical area in Finland, with urban and rural municipalities.
Data
The International Classification for Diseases (ICD-10-Finnish Modification) (10), for public hospital use in Finland was used. Motorcycle and moped crashes were identified according to the external cause of injury (codes V28-V29 in ICD-10, FM). These codes are equivalent to the ICD-10 codes V20-V29 (http://www.who.int/classifications). In addition, the following data were gathered: age, sex, date and time of accident, type of accident (ICD-10), and trauma diagnoses (ICD-10). Breath alcohol concentration (BAC) on attendance was routinely tested with a breathalyzer by staff in the emergency department, and was expressed as g/L. In addition, treatment of injury, admittance to the hospital, referral to the central hospital or university hospital, use of a helmet, and number of operations were checked retrospectively in the patients’ hospital records. Corresponding medical data on patients who were referred to the Kymenlaakso Central hospital in Kotka or to the Central University Hospital in Helsinki (level I trauma center) were checked and gathered by one of the present authors (P.L.), an orthopedist and trauma surgeon. These patients were included in our data.
Whether the vehicle in question was a motorcycle or a moped was identified from the patient’s hospital records. The external cause of injury classification (ICD-10) does not include separate codes for a motorcycle crash or a moped crash.
The severity of the injuries was classified retrospectively according to the Abbreviated Injury Scale (AIS) (11) by P.L. Maximum Abbreviated Injury Scale (MAIS) denotes maximum AIS. Furthermore, as a complementary classification to MAIS, the New Injury Severity Score (NISS) was calculated. The NISS (12) is a simple modification to the Injury Severity Score ISS (13). ISS does not take into account multiple injuries in the same body region. NISS sums squares of the three most severe injuries, regardless of body region injured.
The hospital injury data were compared to the official traffic accident statistics reported by the police and compiled by Statistics Finland. The comparison was made on the basis of the date, time, location, and type of the cases. In addition, the number of pre-hospital fatal cases in the study area during the study period was checked from Statistics Finland.
Statistical Analysis
Analyses were performed using SPSS Statistics 22. Fisher’s exact test, the Pearson chi-square test, the Wilcoxon rank test, and the Independent Samples t-test were used. The values are expressed as mean ± standard deviation (SD) or median with 25% and 75% interquartiles unless otherwise mentioned.A p-value of <0.05 was considered statistically significant.
Results
Over 2 years, a total of 49 motorcyclists and 61 moped drivers were involved in crashes, leading to a total of 94 and 109 injuries, respectively. Two injured motorcyclists and one injured moped driver were pillion passengers. The figures for male motorcyclists and moped drivers were 88% (n = 43) and 70% (n = 43), respectively (p = 0.029). The motorcyclists were quite evenly distributed by age, whereas moped drivers were most often (70%) in the age group 15–17 years. The mean age of motorcyclists was 32.4 years ± 13.3 years and that of moped drivers 21.4 ± 14.5 years (p = 0.000). Male motorcyclists were 32.8±13.7 years and females 29.1 ± 11.0 years (p = 0.458), whereas the male moped drivers were 21.6 ±15.2 years and females 21.1 ±12.8 years (p = 0.780).
Injuries
The anatomical locations of all injuries among motorcyclists and moped drivers are shown in Fig. 1. The most common injuries among motorcyclists and moped drivers were shoulder and upper extremity injuries (38/94, 40% and 39/109, 36%, respectively) (p = 0.296) and lower extremity injuries (30/94, 32% and 39/109, 36%, respectively (p = 0.334)). There were slightly more neck injuries among motorcyclists (p = 0.038), and, correspondingly, slightly more elbow and forearm injuries among moped drivers (p = 0.039). The figures of head injuries were 9.6% (9/94) and 16.5% (18/109) in motorcyclists and moped drivers, respectively (p = 0.106). Severe head injuries (MAIS ⩾ 3) were 33% (3/9) among motorcyclists and 11% (2/18) among moped drivers (p = 0.189).
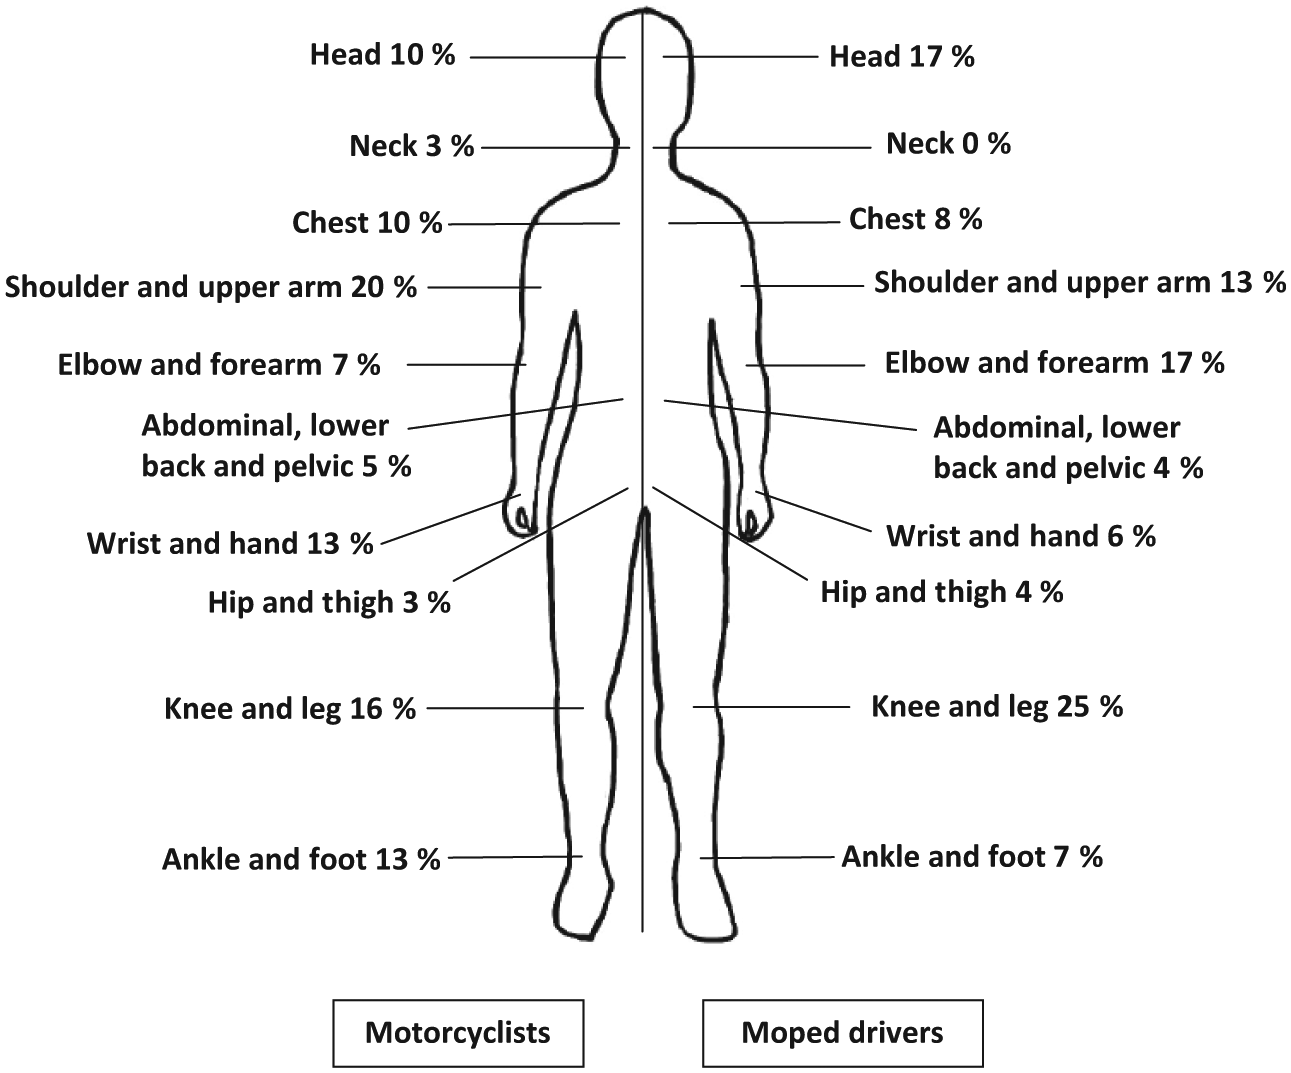
Body region of injury for motorcyclists and moped drivers.
A total of 34 motorcyclists and 41 moped drivers sustained fractures. More vertebral and midfoot fractures appeared among motorcyclists than among moped drivers (p = 0.038 and p = 0.016, respectively) (Table 1). Motorcyclists sustained 13 (38%, 13/34) and moped drivers 15 fractures (37%, 15/41) of the upper extremity (p = 0.464), and, respectively, 17 (50%, 17/34) and 12 fractures (29%, 12/41) of the lower extremity (p = 0.055). Furthermore, motorcyclists sustained 21 and moped drivers 18 other unspecified fractures (p = 0.095). Each moped driver sustained, on average, 1.1 fractures, and each motorcyclist, correspondingly, 1.5 fractures. In all, 32.4% (11/34) of the moped drivers and 36.6% (15/41) of the motorcyclists who sustained fractures were operated on for a fracture (p = 0.446). In total, there were 20 operations on moped drivers and 26 operations on motorcyclists (p = 0.498).
Distribution of fractures among 34 motorcyclists (n = 51) and 41 moped drives (n = 45) according to body region.
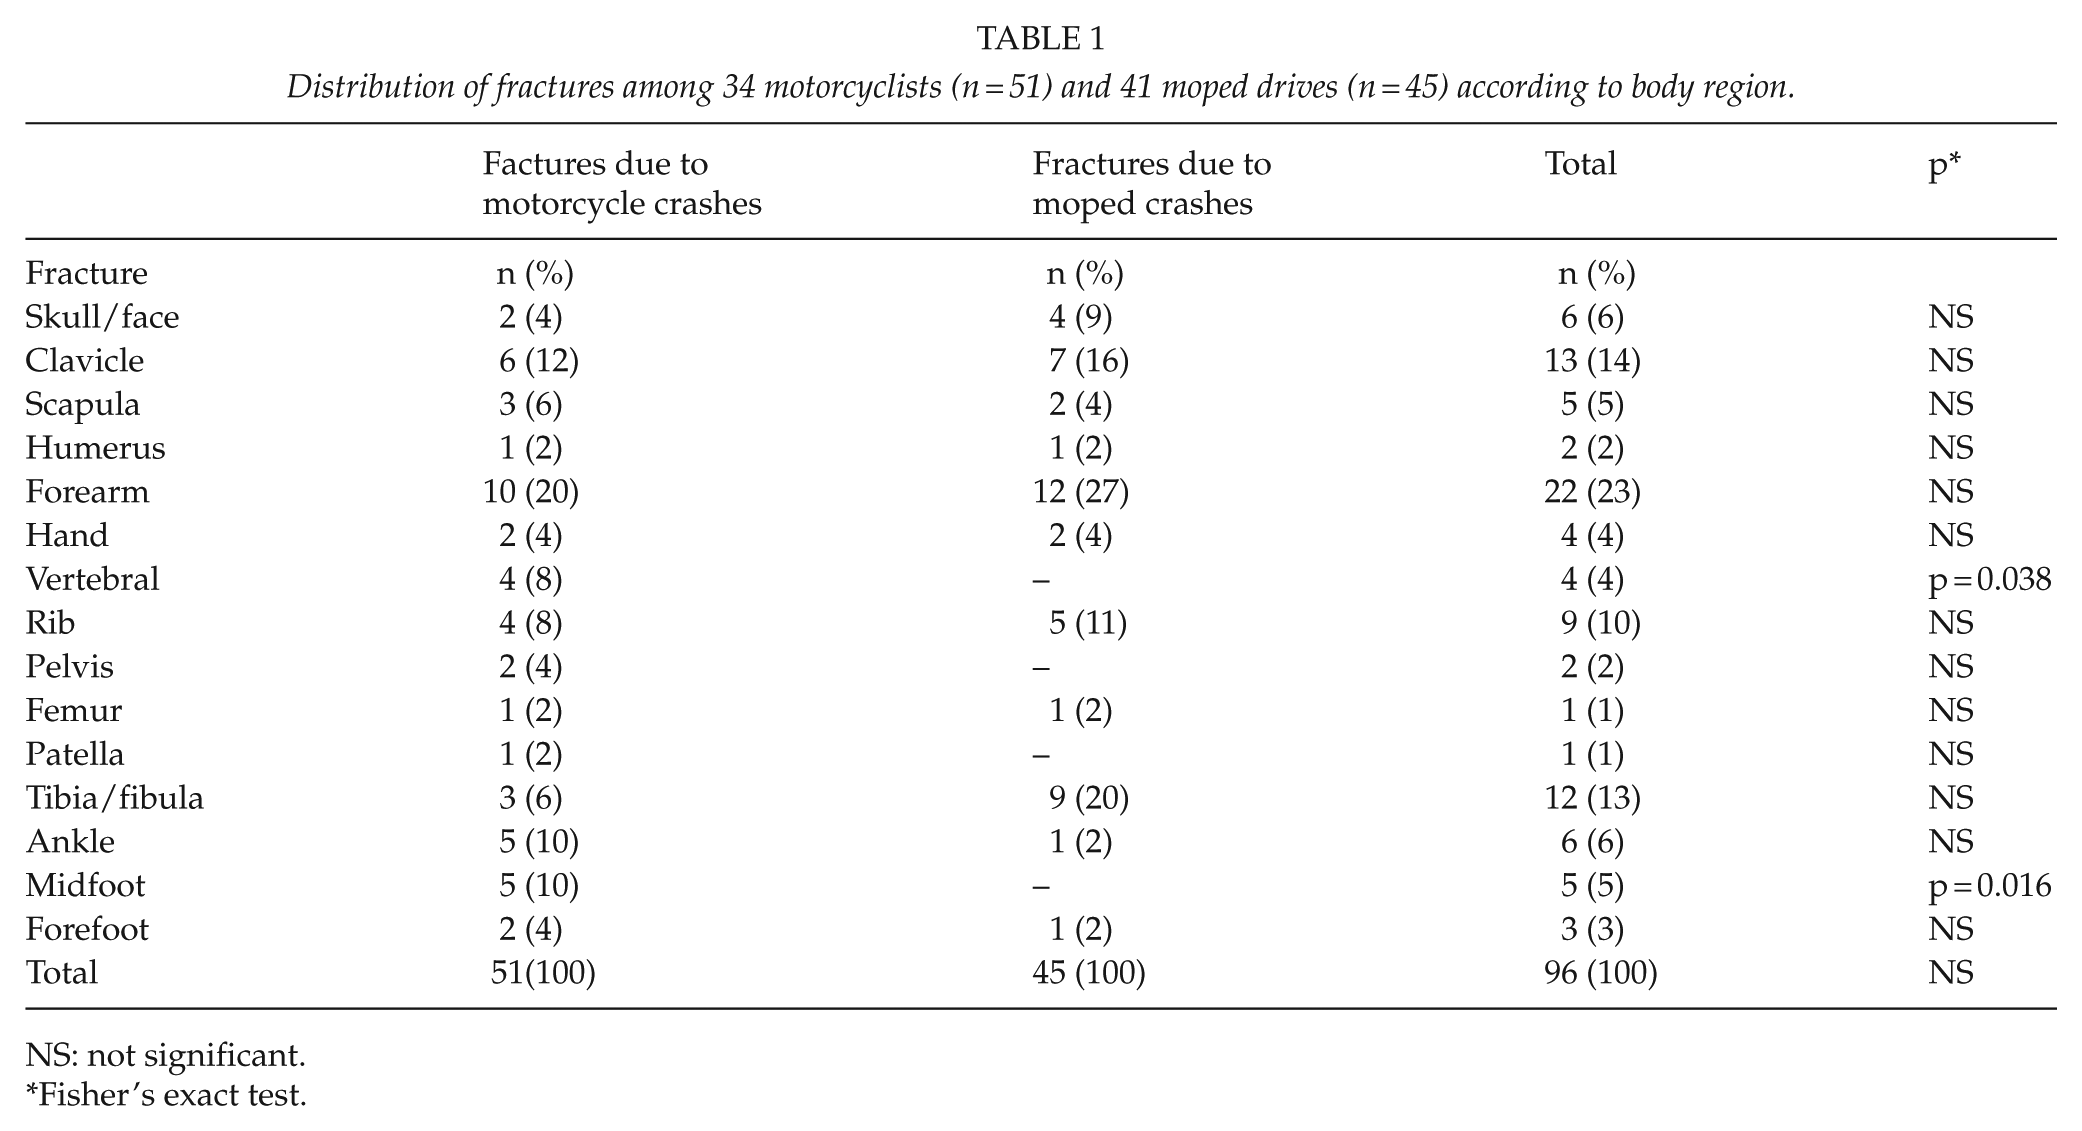
NS: not significant.
Fisher’s exact test.
Injury Severity
No differences were found between the two groups, according to AIS and MAIS scores (Tables 2 and 3). No differences were found in the median NISSs, either, with the median NISSs being 4.0 in both groups.
Severity (AIS) of injuries among 49 motorcyclists (n = 94) and 61 moped drivers (n = 109).
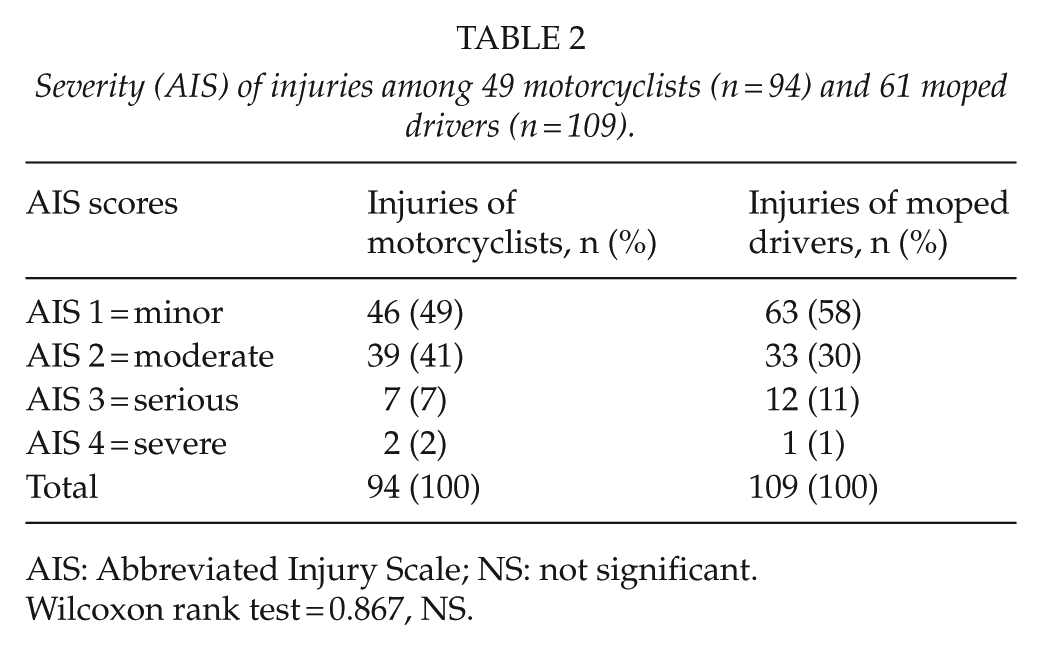
AIS: Abbreviated Injury Scale; NS: not significant.
Wilcoxon rank test = 0.867, NS.
Severity of the most serious injury (MAIS) of motorcycle crashes (n = 49) and moped crashes (n = 61).
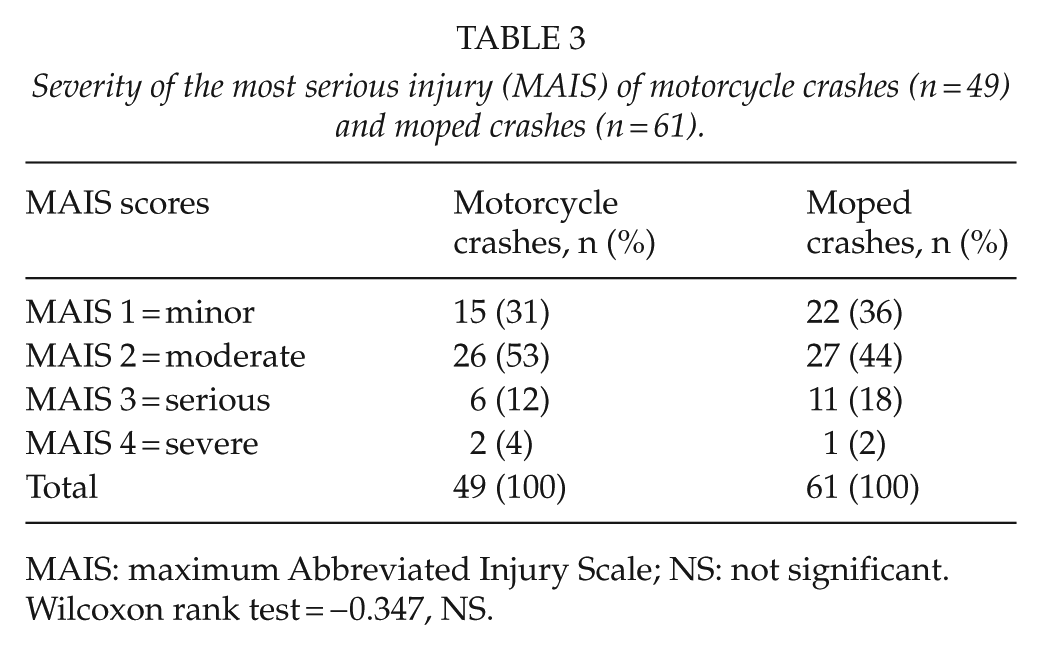
MAIS: maximum Abbreviated Injury Scale; NS: not significant.
Wilcoxon rank test = −0.347, NS.
The distribution of serious injuries (MAIS ⩾ 3) in motorcycle crashes was similar regardless of the gender of the patient, with males 7/43 (16%) and females 1/6 (17%) (p = 0.322). In moped crashes, the corresponding figures were 10/43 (23%) and 2/18 (11%) (p = 0.237).
Use Of Helmets And Driving Under The Influence Of Alcohol
Two motorcyclists (4%) and three moped drivers (5%) were not wearing a helmet. In four moped crashes, the helmet fell off during the crash. All the injured motorcyclists were sober. In six moped crashes (10%), five drivers, most often (4/5) a male driver, and one pillion moped driver were under the influence of alcohol.
Mortality
There was no in-hospital or 1-year mortality. However, official statistics showed that during the study period in the study area, four motorcyclists (7.6%, 4/53) and one moped driver (1.6%, 1/62) died at the scene of the accident (p = 0.137). Thus, the 30-day mortality rates for motorcyclists and moped drivers were 2.2 and 0.62 per 100,000 persons, respectively.
Comparison Between Hospital Data And Official Statistics
Only 35 patients from those in the hospital data were identified in the official statistics, the degree of agreement being 32% (35/110). Thus, the rate of under-reporting was 68%. The extent to which the serious injuries (MAIS ⩾ 3) were found in the official statistics was 55% (11/20).
The majority of crashes (69%, 76/110) were single-party accidents, that is, without another party, for example, another vehicle or a pedestrian. If there was another party involved, it was most commonly a car. Most of the collisions (68%, 23/34) between a motorcyclist or moped driver and a car were recorded in the official statistics. Only 16% of the single-party crashes appeared in the official statistics.
Discussion
Our results indicate that there are no significant differences in the injury severity between motorcycle and moped crashes. Both AIS scores (11) and NISSs (12) were used in this study. Similar results were reported in a Danish study of non-fatal accidents among motorcyclists and moped and scooter drivers (14), in an Australian study (15) and in a recent Dutch study (16). However, light-moped drivers (permitted maximum speed of 25 km/h) showed more severe injuries than moped riders and motorcyclists (16). The Danish study (14) used the AIS classification, the Australian study (15) the ISS classification (13), and the Dutch study (16) both the AIS and ISS classifications. In 2013, the use of AIS scores (MAIS ⩾ 3) was recommended by the EU to all member states concerning the definition of serious injury in traffic accidents (9).
Our results indicate that traffic injuries with two-wheeled motor vehicles are much more common among males than females. Other studies have shown similar results (14–16).
As reported elsewhere (14–18), upper and lower extremities were most commonly injured. In a Dutch study, similar to our results, the most common injuries among motorcyclists were those of the upper extremities, and among moped riders, correspondingly, the lower extremities (16). But then again, in Australia, the lower extremities were the most common region among both moped/scooter riders (42%) and motorcycle riders (44%) (15).
In the Swedish studies, the motorcyclists had five times more vertebral fractures (17, 18) and 2.5 times more upper extremity fractures than the moped drivers (19). In the present study, there were more vertebral fractures among motorcycle drives, but the figures for upper extremity fractures among motorcyclists and among moped drivers sustaining fractures were equal (37%) to those in the Danish study (14).
The corresponding figures for the lower extremities were different: 50% versus 29%. The results of the present study differ from other studies, in which the most common site for fractures in moped drivers (20) and in motorcyclists (21, 22) was the lower extremities.
Our study showed no differences in mortality between motorcyclists and moped drivers. All deaths occurred at the scene of the accident, and none during the in-hospital stay or during the first year. Our total rate of deaths of motorcyclists was 7.6% and of moped drivers1.6%, and the mortality rates were 2.2 and 0.62 per 100,000 persons, respectively.
In the Swedish 8-year study (1987–1994), the in-hospital mortality rate was 1% among moped riders (17), and within 30 days of admission, the mortality rate was 0.9% among motorcyclists and 1.6% among passengers (18). If deaths after 30 days were included, the total rate of deaths of motorcyclists was 2.2% and of passengers 3.3% (driver plus passenger: 2.3%) (18). In a Dutch study (1993–2008), the mortality after admission to hospital was 2.5% among motorcyclists and 2.1% among moped riders (16). In Australia, the mortality rate (July 2002–June 2008) among motorcyclists was 4.2 per 10,000 registration years, compared with 1.2 fatalities for moped riders (23). In neither study was information on the follow-up time of mortality reported (16, 23).
Weiss et al. (24) reported the influence of the three major and different types of helmet laws in the United States: (1) for all ages (universal), (2) for people younger than 21 years (<21 law), and (3) for children younger than 18 years (<18 law). In states with the <21 law, serious traumatic brain injuries among youths were 38% higher than in states with the universal law. Motorcyclists aged 12–17 years in <18 helmet law states had a higher proportion of serious-severe traumatic brain injuries than motorcyclists in universal-law states (24). A number of authors have suggested that the major cause of death following two-wheeled motor accidents is head injury (25–27). In Finland, the use of helmets among motorcyclists and moped drivers is mandatory, but 5% of the present study population was not wearing a helmet. In our study, the rates in head injuries were equal among motorcyclists and moped drivers, and similar result was found in the severe head injuries. In Denmark (14), no differences in severe head injuries were found between motorcyclists and moped drivers, either.
The recent Dutch study reported slightly more severe injuries and mortality among motorcyclists than among moped riders (p < 0.05) (16). In the light-moped group (helmet not obligatory), half of all severe injuries concerned head injuries (49.3%) (16).
The Degree Of Agreement (Overlap) Of The Different Data Sources
In most countries, data on road-traffic injuries are provided by the police, and road safety policies are based on that data. Under-reporting is common in studies of bicycle injuries, two-wheeled motor vehicle injuries, and car accidents (6, 28, 29). In the present study, the degree of agreement of hospital data and official statistics in non-fatal motorcycle and moped accidents was 32%, and half of the severe injuries occurring in hospital data were found in official statistics. A study from the United Kingdom reported that only 50% of the police road-traffic accident injury admissions were included in the linked database of hospital admissions (28). The linkage rate was 31% for bicyclists, 67% for vehicle occupants, 69% for motorcyclists, and 72% for pedestrians (28).
Due to the discrepancies between official accident statistics and hospital injury data, the Finnish Consultative Committee on Road Safety has recently taken the responsibility to improve the situation. The aim is to find how the accident statistics by the police and the hospital injury data could be combined.
This study confirms that the official statistics on motorcycle and moped crashes in Finland are insufficient for injury prevention. In order to obtain reliable statistics, compiling accurate data on the crashes and injuries of moped drivers and motorcyclists regularly, in hospital emergency departments, is crucial. It would facilitate an analysis of the trends of these accidents and, more importantly, the use of the data in planning and implementing preventative interventions. The injury data should also include a nationally agreed classification of injury severity. In general, the national traffic safety policy should be based on the actual statistics compiled in hospital emergency departments. According to the recent recommendation of the EU, Finland should report the total number of serious traffic injuries (MAIS ⩾ 3) to the EU for the first time in 2015 (8). Due to this recommendation, severity data will be added as a variable to the accident data compiled by Statistics Finland.
Limitations
Our data include only patients who attended hospital emergency departments for treatment and do not, therefore, cover all injured moped drivers and motorcyclists in the region. Drivers who sustained minor injuries could have been treated in local health-care centers. This limitation exists in other studies on this subject, as well (14). Limitations of the present study also include the inability to ascertain the road conditions leading to the accidents, lighting conditions, and the speed of the vehicle at the time of the accident. These factors were not included in the injury database, although they would undoubtedly be important.
Some mopeds may have been tuned up, and their speeds may have exceeded the speed limit of 45 km/h. However, this is forbidden in Finland, and the Finnish police is very active in controlling the speeds of moped drivers. This possibility could not be checked. This problem has not been mentioned in other studies, either (14–16).
Strengths
No similar data collection or definition of serious injuries as regards motorcycle and moped crashes has been conducted previously in Finland. The reliability of the primary 2-year injury data, of which the present data are a part, was carefully investigated and found to be good (30). Furthermore, the data of the present study were manually checked and complemented by data on those who were also treated in the central or university hospital of the region in question. The pre-hospital deaths were checked from Statistics Finland.
Conclusion
According to AIS scores and NISSs, the injury severity was equal for motorcycle and moped crashes. The degree of agreement (overlap) between the hospital dataset and the official statistics was 32%. Thus, the rate of under-reporting was 68%.
Footnotes
Declaration of Conflicting Interests
The authors declare that there is no conflict of interests.
Ethical Approval
Ethical approval was obtained from the Ethics Committees of Kymenlaakso Health Care District and of the Hospital District of Helsinki and Uusimaa.