
Abstract
This is a narrative review on vascular assessment for critical limb ischaemia in the past and present combining Finnish and Japanese experience.
Keywords
INTRODUCTION
The initial definition of critical limb ischaemia (CLI) included both clinical and objective criteria for regional hypotension in the ischaemic foot (1). In that document non-invasive diagnostic criteria were used for the first time in the characterization of critical leg ischaemia. The introduction of a non-invasive vascular laboratory emerged from the need for more accurate differential diagnostics, the localization of disease, the measurement of severity, as well as the documentation of the progression of peripheral arterial disease and the effects of treatment. Our aim is to discuss current practice, some open issues and new ideas. As background material, extracts from the vascular laboratory approach as it was presented in 1979 have also been referred in citations in italics with the permission of Mauri Lepäntalo, the author of the unpublished review (2). Indeed, many of the early methods have become obsolete (3).
“The physiological state of the peripheral arterial circulation may be assessed non-invasively by pressure, volume and flow measurement. Pulsatile flow can be analysed on the basis of transient beat-by-beat volume changes by means of pulse pletysmography and oscillography as well as according to flow velocity, the shape and size of the pulse wave by meants of ultrasound methods.”(2)
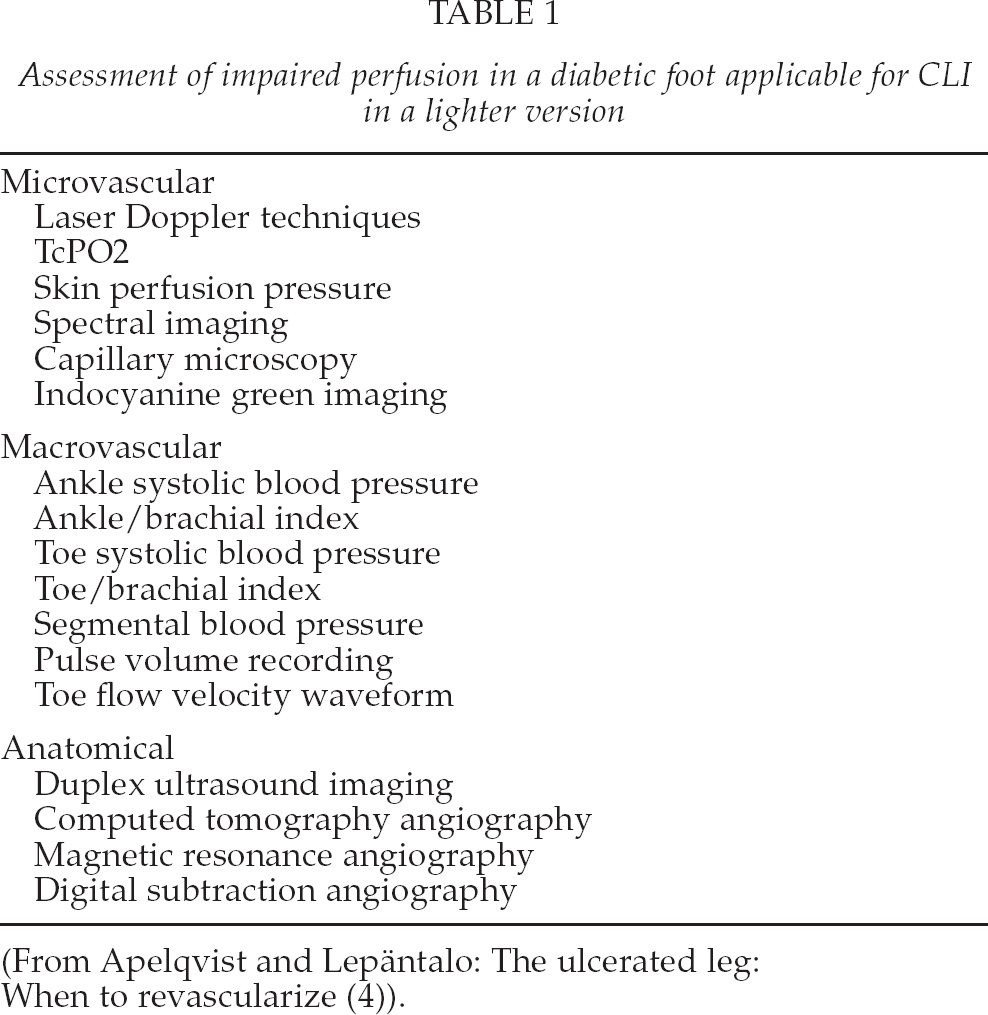
There is a clear need to assess both macro- and microcirculation in the context of critical limb ischaemia, especially in diabetics (Table 1) (4).
Assessment of impaired perfusion in a diabetic foot applicable for CLI in a lighter version
ANKLE-BRACHIAL INDEX (ABI)
“Blood pressure is measured indirectly with an occluding cuff and a distal sensor. The classical sensors are a palpating finger and a stethoscope.” (2)
Pulse palpation is a method with surprisingly poor repeatability and reproducibility. Furthermore, there is a wide variation in systolic pressure levels at which different individuals can feel the pulse (5).
“Sensitive sensors currently in use are based on Doppler ultrasound, as well as various plethysmographic and isotope clearance techniques. A transcutaneous Doppler ultrasound blood velocity detector is the simplest in use (Rushmer et al. 1966, Strandness et al. 1966). A pulsatile flow is needed for the Doppler ultrasound technique to be operative. Therefore, collateral and digital flow at pressures below 50 mmHg cannot be estimated reliably by the Doppler ultrasound technique (Lassen et al. 1978). The ankle/brachial pressure ratio or index is the most suitable primary method for differential diagnosis for obliterative arterial insufficiency in the lower extremities (Yao et al. 1969). There is an almost linear correlation between maximal distal flow and distal blood pressure among patients with obliterative arterial disease (Sumner & Strandness 1969). The ankle pressure is normally 20–25 mmHg above the brachial pressure due to the systolic pressure amplification (Kroeker & Wood 1955). The ankle and arm pressures should be measured simultaneously, because there may be variation from one pulse beat to another up to 10–20 mmHg in systolic blood pressure (Nielsen et al. 1972).” (2)
The Ankle-brachial index (ABI) is the ratio of systolic blood pressure at the ankle and systemic blood pressure measured from the brachial artery when the patient is at a supine position. Blood pressure at the ankle level is measured using a hand-held continuous-wave Doppler ultrasound probe from both the dorsalis pedis artery and the posterior tibial artery. The higher ankle value is divided with the higher of the systolic arm blood pressures. ABI-measurement is easy, non-invasive, relatively quick and inexpensive. In addition, it has been found to be relatively reliable with an intra- and inter-observer variability of 6%–12% (6). ABI measurement has been proven to be reliable when performed by vascular experts, family physicians and nurses (7). ABI can be measured at any practice equipped with Doppler and a blood pressure cuff, and it should be available in all primary health care units.
Because of its simplicity, ABI should be the first diagnostic measure on a patient with an ulcer or rest pain. Most often, normal ABI is defined to be 0.9–1.3 (8). Values below 0.9 predict peripheral arterial disease in 95% of the cases, while those higher than 1.3 predict mediasclerosis and non-compressible vessels at ankle level, and the ABI is pseudohypertensive (8). If a patient has an ulcer that does not heal, the absolute ankle pressure is typically below 50–70 mmHg, and if the patient suffers from rest pain, the typical value is below 30–50 mmHg (6). Specific ABI threshold-values for rest pain, critical limb ischaemia or wound healing are impossible to give, but a rough estimate of ABI < 0.4 refers to severe ischaemia of a leg (9 –14).
“If arteries are collapsing inaccurately while the cuff is inflated, the distal blood pressure will be overestimated. This may be due to a too narrow cuff, thick limbs or mediasclerosis.” (2)
In diabetic patients or those with rheumatoid arthritis or end-stage renal disease, the arteries at the calf level are more often non-compressible due to mediasclerosis than in other patients with peripheral arterial disease (PAD), and the ABI is falsely high and does not measure the blood supply of the foot (15). Therefore, an ABI > 0.6 should not be regarded as reliable in diabetic patients (16).
In addition to being a basic diagnostic tool, the ABI is a valuable measure in assessing the changes in the blood supply to a foot after revascularization, for example. Reporting standards require a change of 0.15 to be considered clinically relevant, or > 0.10 if associated with clinical improvement (6). The overall accuracy of a > 10% decrease in ABI to > 0.2 varies between 71% and 89%. However, the sensitivity is rather poor for ABI to be a surveillance method (17).
The higher ABI is useful in assessing distal ischaemia in a single leg whereas the lowest measurable ABI of either leg is useful in predicting cardiovascular risk in terms of adverse events and death (18).
A pole test method may be beneficial in diabetics as the pressure levels at which the Doppler signals disappear are measured without an occluding cuff. Furthermore ankle pressure measured with the pole test and TcPO2 correlated well in diabetics. Unfortunately, the scientific value of this test is weak (19, 20)
PULSE VOLUME RECORDING (PVR)
Segmental pulse volume recordings at various levels of the leg have traditionally been used in primary non-invasive diagnostics of vascular disease and the assessment of the level of the occlusive lesions (21). Today, duplex has made PVR unnecessary in this sense. However, PVR deserves a mention here as it may be used as an additional measure when estimating the reliability of toe pressure and ABI measurements or as a quick method for detecting graft patency or a major change after endovascular treatment.
TOE PRESSURE (TP)
Toe pressure and TcPO2 measurements are the most widely used noninvasive methods in assessing foot perfusion and wound healing potential.
“Sensors unable to record the non-pulsatile aspects of the inflow of blood are not to be used for measuring the lowest pressures. The mercury strain gauge (Whitney 1953) and photoelectric method described by Nielsen et al. (1973) are the only two available methods sensitive enough to estimate the low pressure values and besides being applicable on toes (Lassen et al. 1976). The great toe systolic pressure is normally 5–10 mmHg lower than the brachial pressure (Nielsen et al. 1972) and 35–40 mmHg lower than the ankle pressure (Carter & Lezack 1972).” (2)
The rationale behind measuring TP is that it is the most distal pressure representing the macrocirculation that can be measured, and the toe arteries are less prone to mediasclerosis. There are three principally different methods for detecting flow in the toes – the mercury strain-gauge, photoplethysmography (PPG) and laser Doppler (LD), the latter two being the ones still in use. PPG is based on detecting changes in the blood filling of the digital arteries and arterioles. The PPG sensor emits infrared light that penetrates the tissue under the probe and is reflected by red blood cells. The LD perfusion signal is derived from the Doppler shift undergone by the emitted infrared laser light after reflection from moving particles (red blood cells). The PPG detectors need a pulsatile flow, whereas LD sensors detect minor movements of red blood cells and thus allow lower values of toe pressure to be measured.
After the detection of flow, a suitably sized cuff is inflated to a pressure at which the signal is no longer detectable. The pressure where the signal returns during deflation is recorded as the toe systolic pressure. The pressure is measured, for example, three times and the mean of the reliable values is used. Prior to the measurement, the patient should rest in the supine position and the toes should be warmed and ideally the ambient and the temperature controlled. All drugs and other agents causing vasospasm should be avoided. The patient should lie still as the sensors are sensitive to movement artefacts.
Different methods of warming the feet and toes during measurement may be used. The warming is not easy to standardize. In our own unpublished experience, different methods of warming have given very different toe temperatures. Laser Doppler may be combined with a special warming probe, which only warms the area under the probe to 40 Celsius in an attempt to cause maximal local vasodilatation. A hair dryer has also been used, but the warming effect will be fairly superficial, transient and uncontrolled. Especially in diabetics the skin may be in danger. Indeed, warming pads give a better standardized warming effect.
Generally, TP measurement is very quick and thus suitable for use at a busy vascular outpatient clinic with large quantities of measurements, as it can be repeated with a low threshold – e.g. pre- and post-procedure – several times. However, it may be suspected that the faster the measurement, the more prone it is to error. The optimal time used is chosen locally with non-evidence reasoning. The general consensus remains that vascular laboratories should be tested and validated for quality control.
However, publications on comparing the different methods of toe pressure measurement and their reproducibility are scarce. In our own validation and comparison effort, we found that TP varied far too greatly between the methods. Reproducibility with the same method was better, but still not optimal (22).
Recent European guidelines on diabetic foot management have acknowledged the problem of TP reliability especially in diabetics and have raised the level of probable wound healing from the previous 30–50 mmHg to 50–55 mmHg (6, 23). In non-diabetics a cut-off value of 30 mmHg has been used for rest pain (6).
TRANSCUTANEOUS PARTIAL OXYGEN PRESSURE (TcPO2)
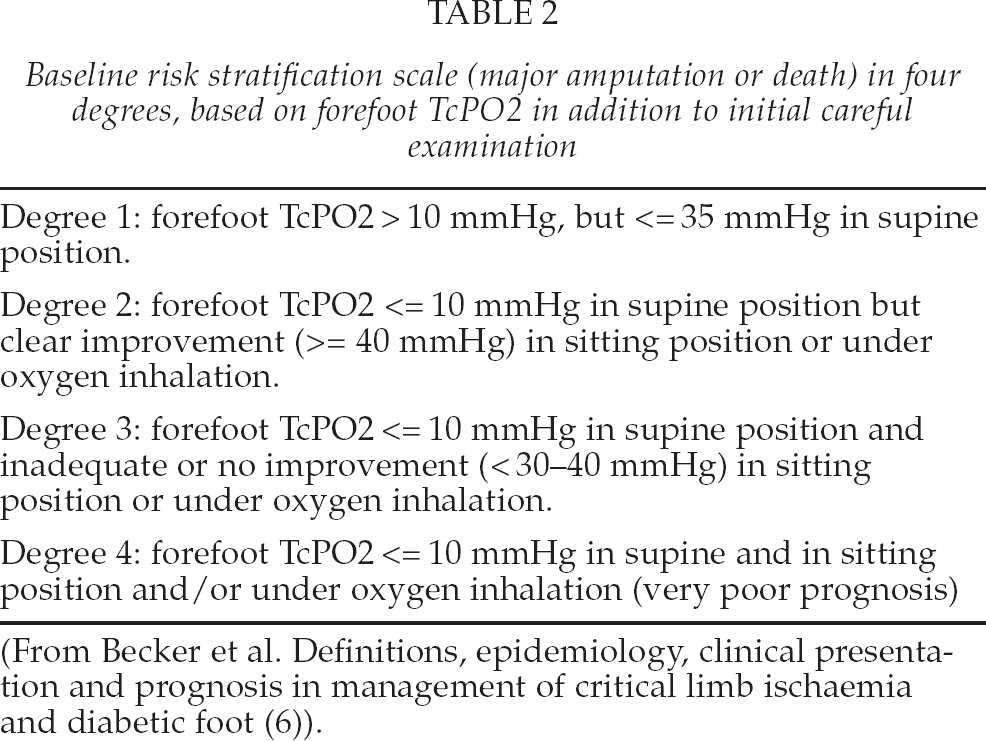
Transcutaneous oxygen pressure measurement (TcPO2) reflects the metabolic state of the underlying skin and is considered to reflect the tissue healing potential. It is based on the amount of oxygen that is diffused from the capillaries through the epidermis to a measuring electrode at a certain point. The electrode heats the underlying tissue in order to create local hyperaemia. The oxygen is reduced at the cathode of the electrode and produces a current that is proportional to the partial pressure of oxygen (PO2). Due to the fact that it measures the perfusion in capillaries and arterioles, it is very sensitive to vasospastic errors. Measuring the TcPO2 is more time-consuming than, for example, toe pressure measurement. In addition to resting values measured in the supine position, different provocation tests have been administered. These include at least the dependent position, reactive hyperaemia and oxygen inhalation with or without hyperbaric stimulation. There is little reliable data to state the definite value of these provocation tests, and their clinical value is thus unclear. Yet, Becker et al. have done valuable work on the subject and derived cut-off levels for different severity classes of CLI (Table 2). The data need to be validated in larger studies.
Baseline risk stratification scale (major amputation or death) in four degrees, based on forefoot TcPO2 in addition to initial careful examination
The advantage of TcPO2 is that it may be measured at several points of the skin. It may be measured in the proximity of the ulcer or any other area of interest and is thus more modifiable than toe pressure measurement. The areas of different angiosomes may be measured separately.
However, the measurement is time-consuming and prone to error due to skin thickness or vasospasm. The ischaemia in the skin may be patchy, and as the measured area is quite small, these islands of ischaemia may be missed or they may lead to a false diagnosis. TcPO2 has little value when the skin perfusion is good as there is oxygen in abundance.
An ulceration of the foot in diabetes will generally heal if the TcPO2 is > 50 mmHg. Healing is usually severely impaired when TcPO2 is < 30 mmHg (6).
IDOCYANINE GREEN FLUORESCENCE IMAGING (ICG-FI)
The perfusion of the foot can also be studied in a number of other ways, with an emphasis on microcirculation. Such methods include various laser Doppler techniques, spectral imaging, capillary microscopy and skin perfusion pressure measurements. Indocyanine green fluorescence imaging, an old method, has become interesting again due the improved quantification of the perfusion data (Photodynamic eye, Hamamatsu Photonics, Hamamatsu, Japan).
Although fluorescent imaging has been used in clinical applications such as for almost sixty years, it is a new method in the assessment of blood supply to the foot. The principle of fluorescence imaging is to illuminate the tissue under examination with light at the excitation wavelengths (roughly 750 to 810 nm) while observing it at longer emission wavelengths (840 nm). ICG works in the so-called tissue optical window, i.e. the near-infrared (NIR) light: fluorescence penetrates tissue to the depth of several millimetres or even further (24). The technical application includes the injection of ICG intravenously and recording the image with an infrared camera for further processing.
The imaging protocol is simple. ICG is given as an injection into systemic blood circulation and imaging is carried out over a period of 5 minutes after the injection. ICG is removed quickly from the circulation by the liver, processing it into bile juice. Normally a new bolus can be given in 15–30 minutes. Because the technique is new in the assessment of lower limb circulation, the interpretation of the ICG images is under development. Kang et al. (24) have suggested the use of onset time and modified Tmax (the time from the onset of ICG fluorescence to the maximum), which they have found reliable in assessing mild ischaemia.
We have tested the use of T1/2 and PDE10 in the assessment of blood flow. T1/2 is the time elapsed from the onset of the fluorescence to half of the maximum of its intensity. PDE10, in turn, is the fluorescence intensity measured 10 seconds after the onset of the fluorescence. Both parameters are determined from the time-intensity curve (Fig. 1). One of the advantages of the ICG-FI is the visual information from the recorded images (Fig. 1). According to the blood supply to the foot, ischaemic patches can be seen in the foot area. Because it is a new method, there are very little scientific data on the use of PDE in the clinical setting, but to us it seems interesting as the measured flow is also from deeper layers and in addition to single spot figures the perfusion in the whole foot and different angiosome areas may be seen simultaneously.
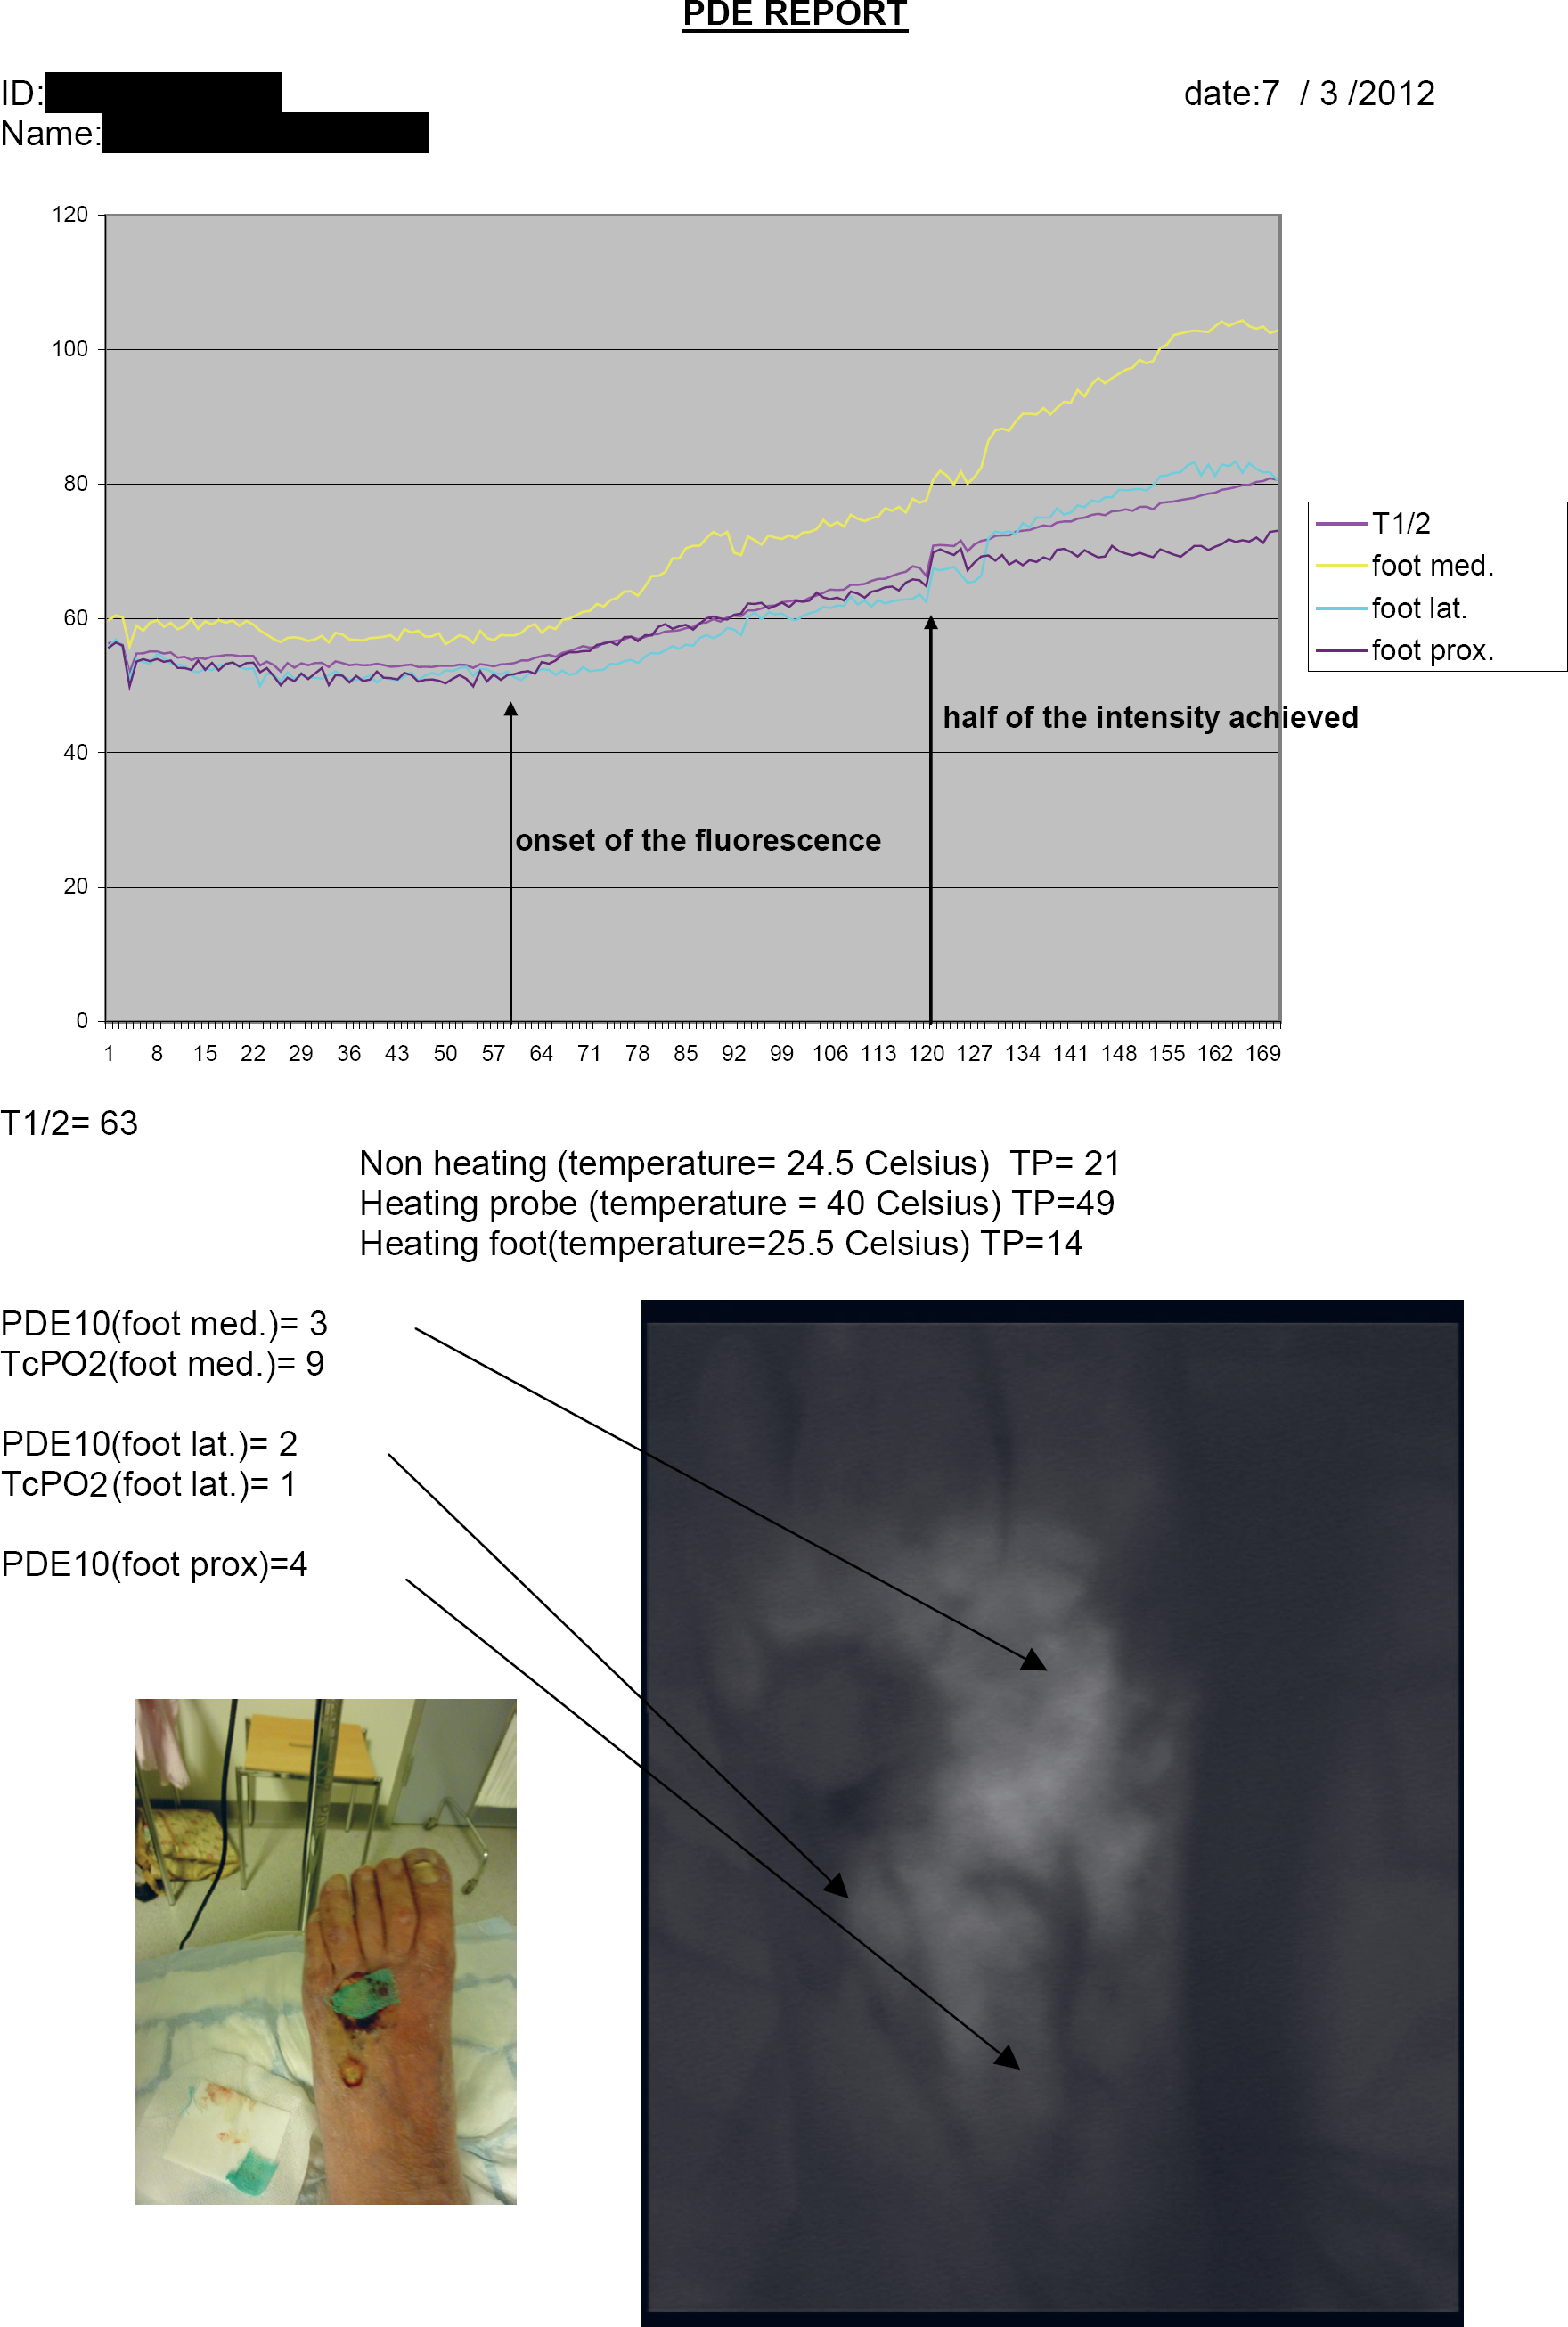
PDE report including toe pressure and TcPO2 values from left foot of a patient with critical leg ischemia and an ulcer in the dorsum of the foot. Time-intensity curve has been drawn and T1/2 and PDE10 determined from three points: medial, lateral and proximal aspect of the dorsum of the foot. All parameters except toe pressure using heating probe indicate critical ischemia.
DUPLEX ULTRASOUND (DUS)
Duplex-ultrasound is ideal in the examination of lower-extremity arteries in many ways. It is non-invasive and well tolerated. It does not affect to the renal function. Also, it is relatively inexpensive. Duplex-ultrasound equipment has developed intensively during the last two decades, thus markedly increasing its versatility.
In the assessment of the anatomy and severity of the stenosis, a B-mode image provides the anatomical details. However, it does not reveal the haemodynamical influence of the stenosis. The degree of the stenosis is determined using peak systolic velocity (PSV) in the artery before stenosis, at the stenosis and after the stenosis. If the PSV at the stenosis is more than three times the velocity before the stenosis, the stenosis is haemodynamically significant. A PSV ratio of 4:1 or more indicates a stenosis > 75% and 7:1 > 90% (6). With the colour Doppler, turbulent blood flow also indicates significant stenosis although it can be used only as a suggestive sign. The shape of the duplex-curve also gives information on the stenosis. The normal triphasic Doppler arterial wave has an initial steep peak, representing the high flow of systole. The second portion, the dip, indicates the reverse flow in early diastole. The third segment of the wave, a small peak, signifies the forward flow of late diastole.
The accuracy of DUS has been compared with digital subtraction angiography, magnetic resonance angiography and computer tomography angiography. The sensitivity and specificity compared to DSA have been shown to be high in several meta-analyses (27): 84%–91% and 93%–96%, respectively. The basic principle in these examinations is completely different in the determination of stenosis. While DSA is a two-dimensional image which should be taken from at least 2 different angles in order to detect and define stenoses, DUS yields true haemodynamic information.
In the hands of an experienced examiner, reliable information on the arterial tree from the aorta to the foot can be achieved. When the findings are documented as a cartoonography, illustrating their severity, endovascular treatment can be planned on the basis of an ultrasound examination only (Fig. 2) (28, 29). In the femoropopliteal area, accuracies of 84%–87% have been found when PTA has been performed on the basis of ultrasound (27, 28). The lesions in these relatively small case series have mostly been short stenoses of the superficial femoral artery. There are no studies on the accuracy of DUS compared to DSA in critical limb ischaemia with widespread peripheral arterial disease. However, our own experience suggests that DUS also provides reliable information in these cases, but the examiner has to have extensive experience in DUS (Fig. 3).
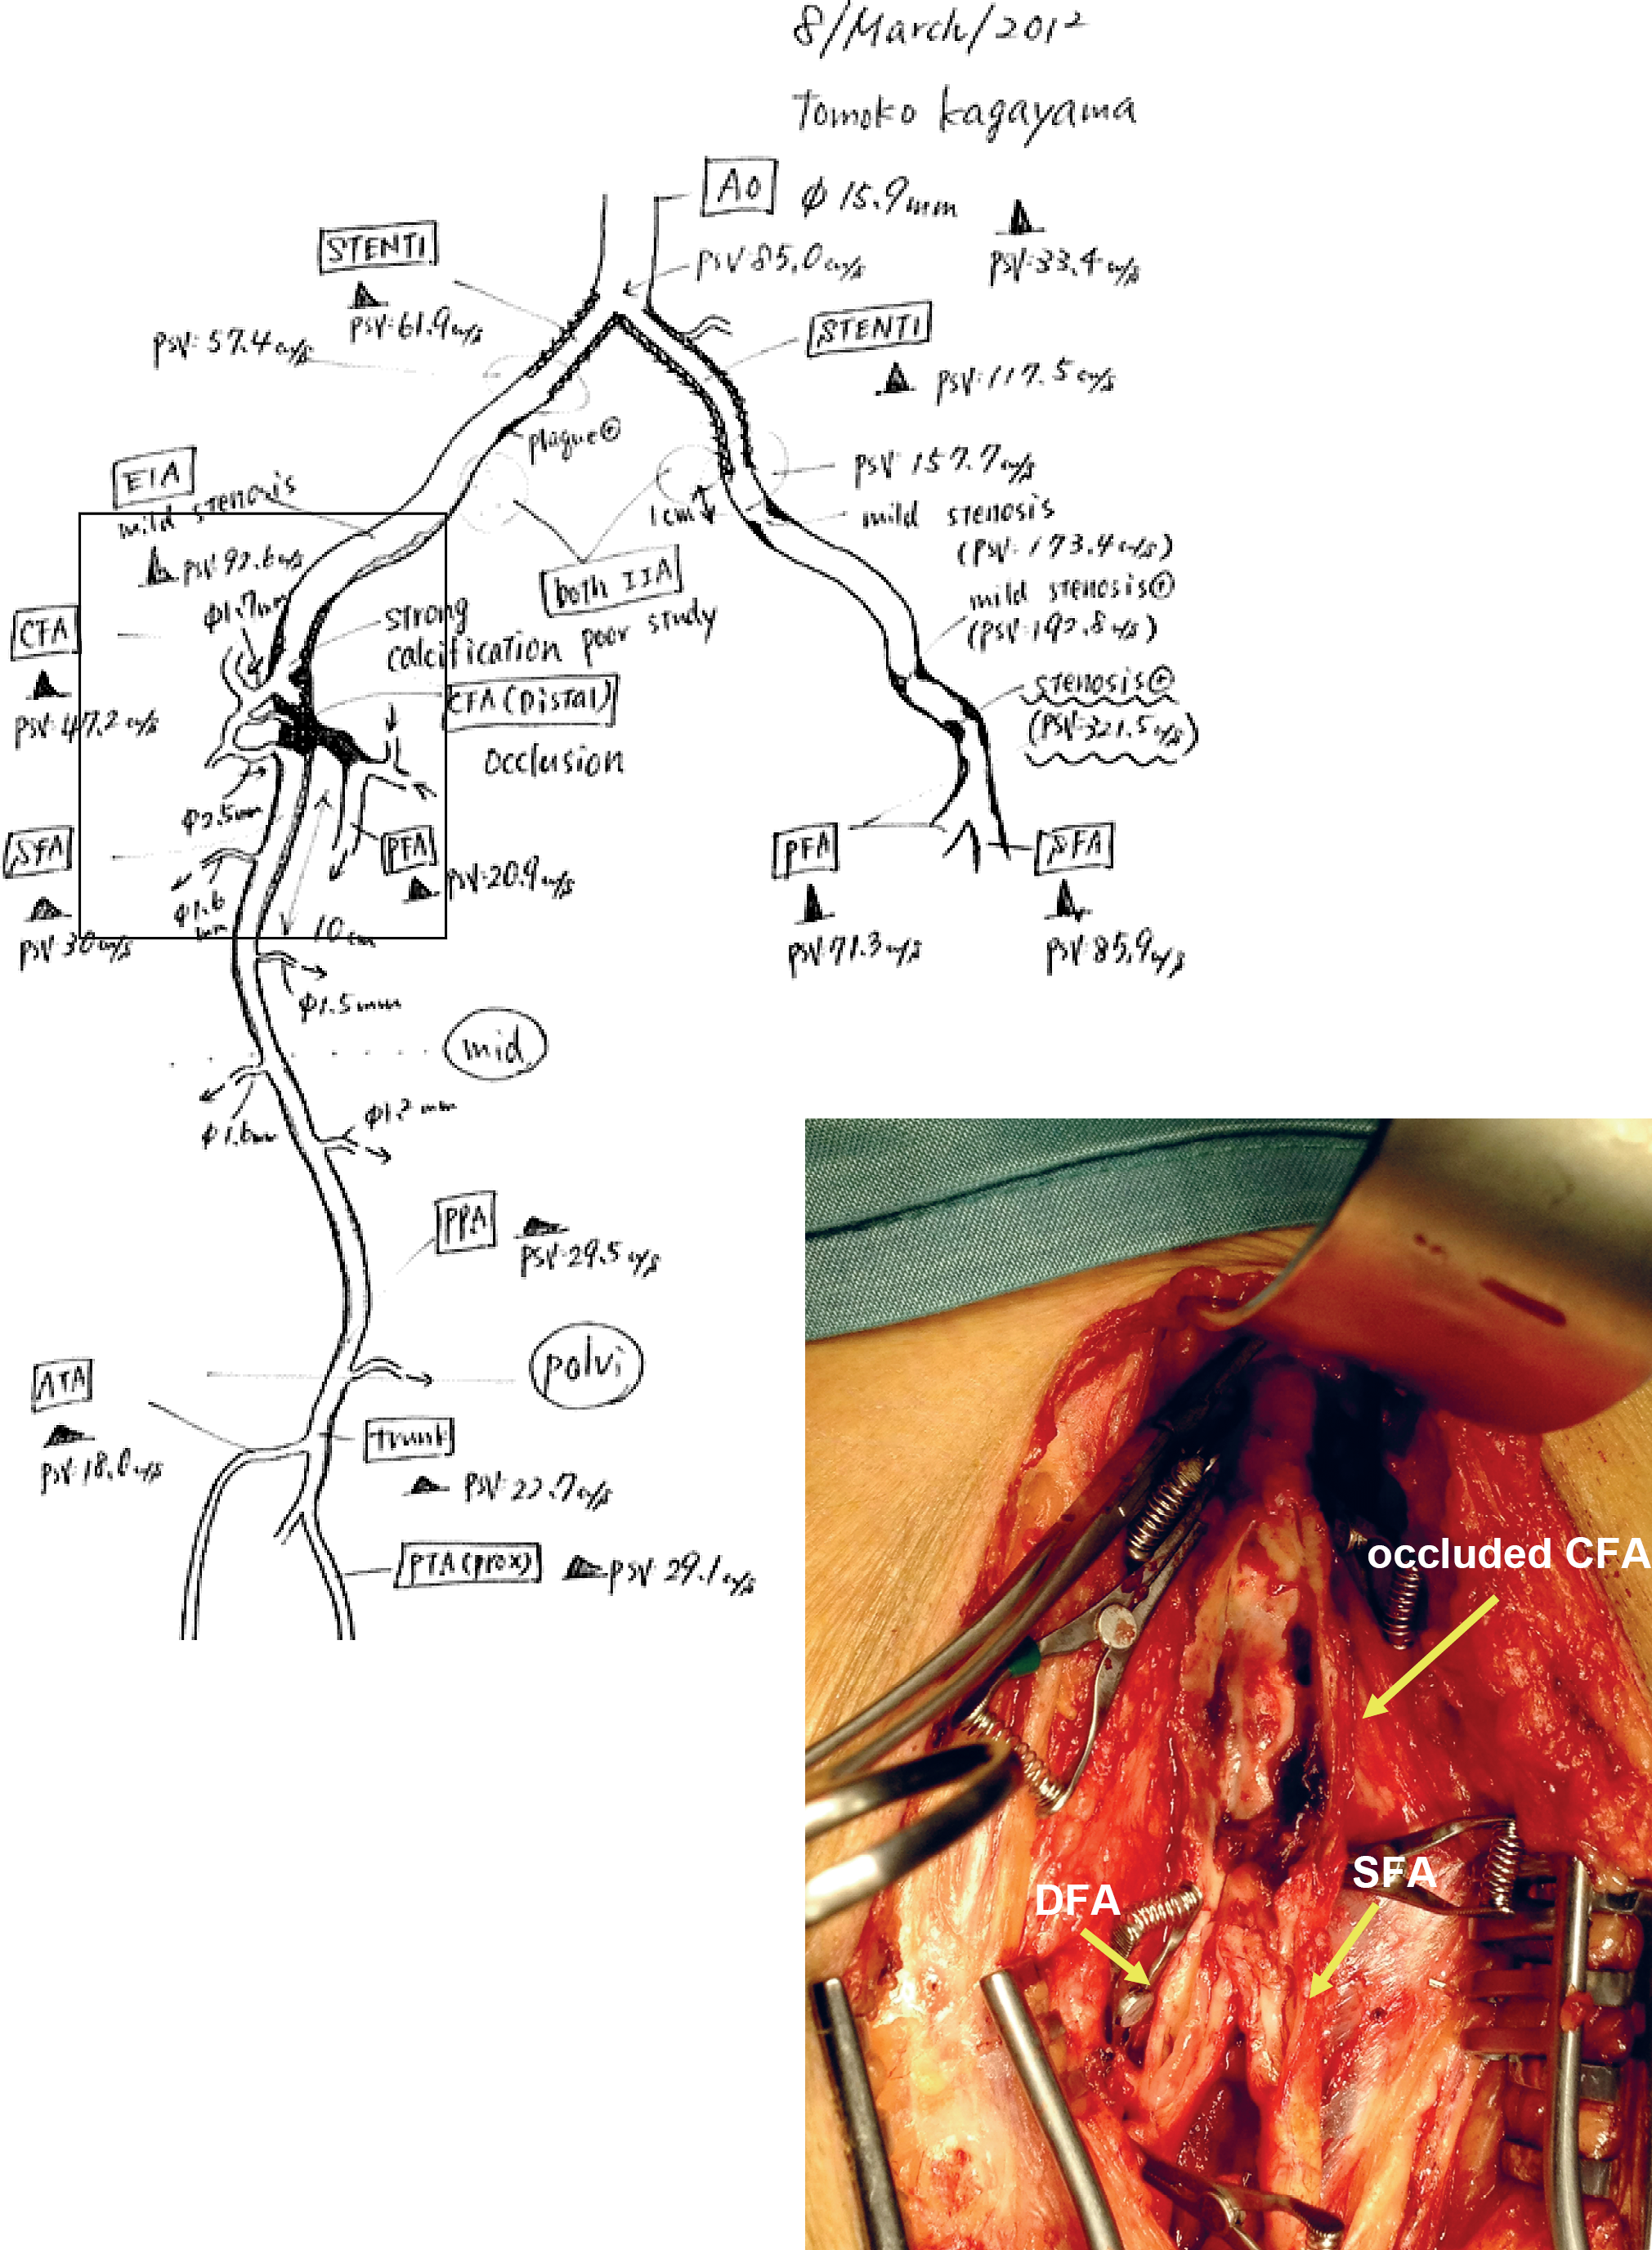
An operation peformed solely on the basis of DUS. Operative finding compared to DUS cartoonography (square).
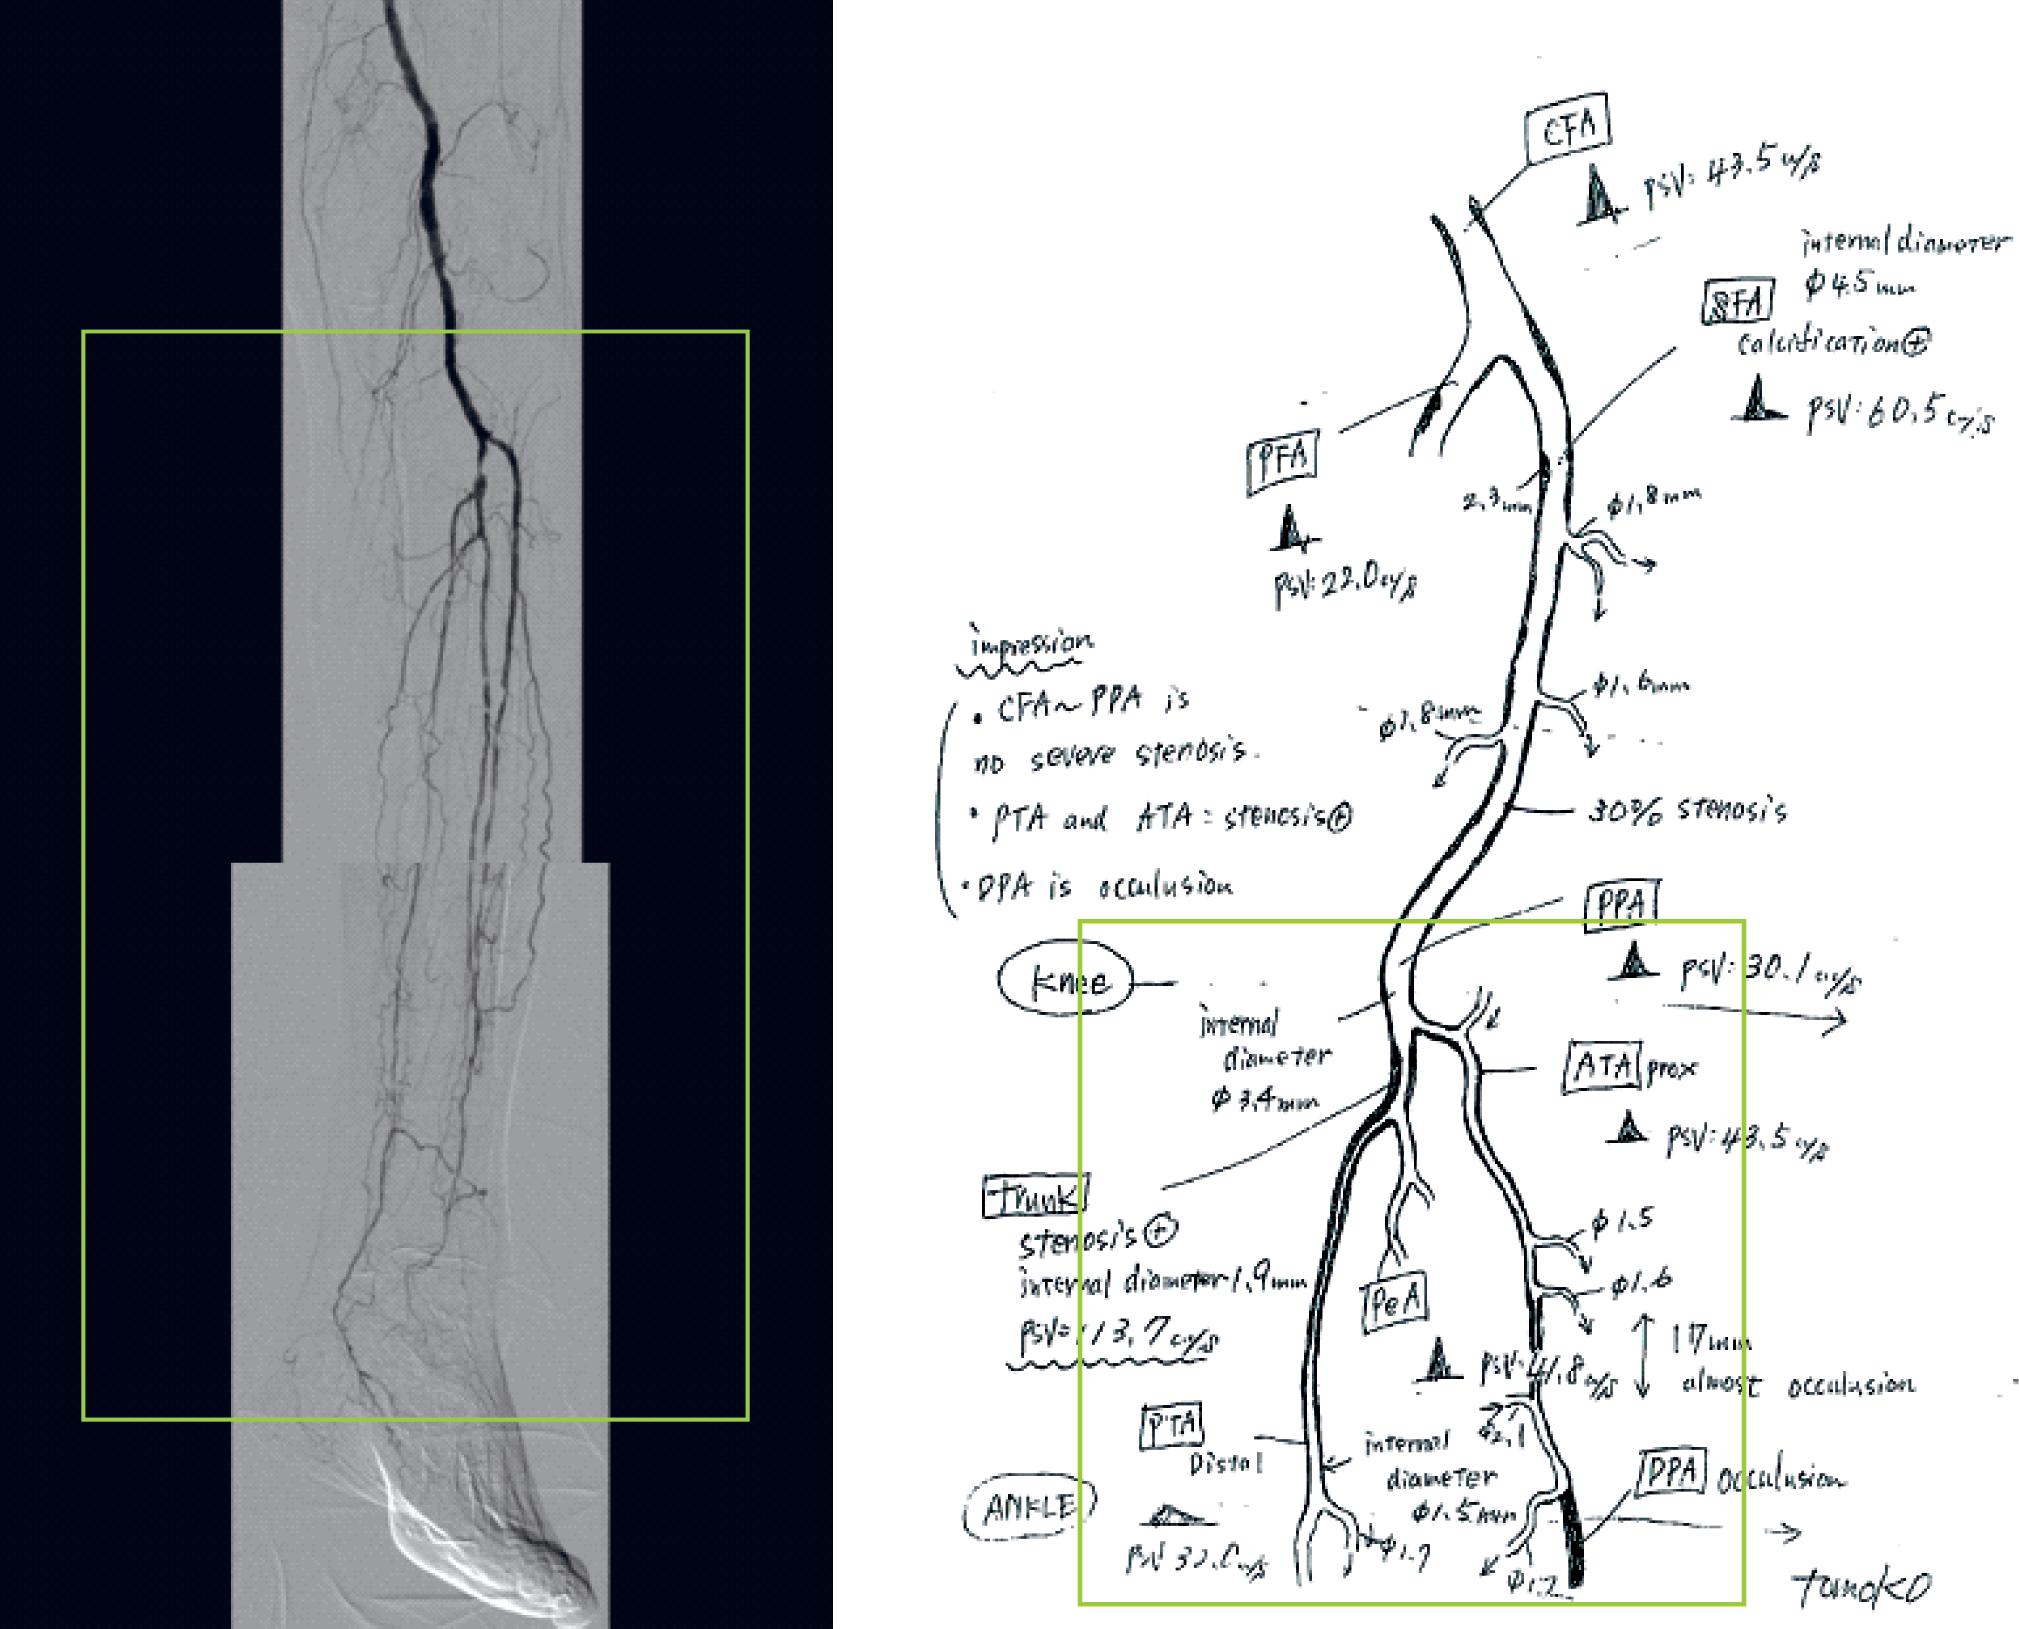
DSA compared to the DUS cartoonography (square indicates areas compared though not in scale).
Moreover, the most useful outflow artery for distal bypass can often be chosen on the basis of DUS (27, 28). Sometimes the plantar artery or dorsalis pedis artery is not visible in DSA but can be seen in DUS. DSA and DUS may thus be considered as complementary methods.
One of the most widely utilised applications in vascular surgical practice is vein graft surveillance, to which an entire chapter in this issue has been dedicated.
The main limitation of DUS is that it is very operator dependent. Furthermore, the interpretation of the duplex finding can be challenging, as a DUS image alone is not informative without a summarizing cartoonography. DUS is also a time-consuming examination compared to CTA and MRA. The visibility to the distal aorta and pelvic area may be limited due to obesity or bowel gas. Calcification may cause shadows and impair visibility. Other challenging areas include arteries distal to tight stenosis, where the velocity curve is not diagnostic due to slow velocity.
CONCLUSION
Objective and reliable assessment of perfusion in the foot is of utmost importance in the treatment and diagnostics of CLI. Several different methods have been used and should be available in a modern vascular laboratory, which should be systematically validated. All methods have their own strengths and pitfalls and the clinician should be aware of these. None of the methods is satisfactory as a single tool, but information gained from several methods should be combined and interpreted together with the clinical picture.
Footnotes
ACKNOWLEDGEMENTS
The authors want to thank Mauri Lepäntalo as well as Marita von Bell, Päivikki Määttälä, Anna Mannerkoski, Saara Penttinen, and Tomoko Kagayama, all devoted to vascular laboratory activities for longer periods of time.