
Abstract
Background:
Previous studies have indicated that the alcohol consumption among older Danish individuals has increased during the last three decades of the 20th century. However, the research is limited and, hence, the aim of the present article is to describe the trends and peculiarities in the development of the present situation in older people’s drinking patterns in Denmark.
Methods:
Data were obtained from the Danish Health and Morbidity Survey (2005) and the Danish National Health Survey (2010, 2013, and 2017). Data used in this study were collected via self-administered questionnaires from random samples of the adult (≥ 16 years) Danish population. Response rates varied between 50.8% (2005) and 59.5% (2010). Drinking patterns are described using the following indicators: alcohol consumption during the past 12 months; alcohol consumption at least two days a week; mean number of standard drinks consumed in a typical week and heavy episodic drinking (at least monthly). Results are presented as percentages or means.
Results:
The prevalence of overall 12-month alcohol use in all individuals aged 60 years or older has slightly increased between 2010 (83.9%) and 2017 (85.2%). On the other hand, the prevalence of consuming alcohol at least twice a week has overall decreased slightly between 2010 (54.0%) and 2017 (52.0%) in the same age group. A decrease was also observed in the mean number of standard drinks consumed in a typical week, from 8.3 in 2010 to 7.0 in 2017. Additionally, the prevalence of consuming at least five standard drinks on one occasion at least monthly decreased markedly from 24.8% in 2005 to 14.8% in 2013 (the prevalence remained stable between 2013 and 2017). The trends in prevalence of various alcohol indicators varied by sex and age.
Conclusions:
The findings of this study suggest an overall decline in alcohol consumption among older Danes in the study period. The continuation of this trend will be the subject of future studies.
The Danish Health Authority has seven recommendations about alcohol (Danish Health Authority, 2019). One of them is that older people should be careful when consuming it. However, there is surprisingly little literature on the drinking habits of older people in Denmark. Over the last 40 years there have been basically only two peer-reviewed epidemiological studies on this subject (Bjørk et al., 2008; Bjørk et al., 2006). This limited epidemiological research reported an increase in consumption from the 1980s through to the early 2000s in these older age groups, while there was a decline or stagnation in the overall adult population. One study of trends based on general population cross-sectional survey data followed those aged 50 years and older from 1987 to 2003 (Bjørk et al., 2006). The self-reported mean consumption on “the last weekday” increased significantly for both men and women, while the mean consumption among younger men and women dropped. A similar trend was found for the prevalence of heavy drinkers, defined as those consuming on average three units or more per day for men and two units or more per day for women (Bjørk et al., 2006).
A number of explanations for the increases in alcohol use in the older age groups has been offered. For example, some argue that wine became more acceptable to drink, especially with dinner (Bjørk et al., 2006). Furthermore, research suggested that moderate drinking may have some health benefits in middle-aged and older adults and this finding received a lot of attention (Grønbæk et al., 1998; Grønbæk et al., 1995). Other research has focused on women and their increased participation in the labour market during the 1960s and 1970s which encouraged them to drink similarly to men and which carried on through to the 1980s. For example, Hammer and Vaglum (1989) interpreted similar trends in Norway as indicating a lifestyle change for women. Bjørk et al. (2006) also referred to a closing of the gender gap in alcohol consumption among these older age groups, but did not actually test the data for that occurrence. However, in a later international repeated cross-sectional study that included Finland, Bloomfield et al. (2001) were able to determine that the gender gap in alcohol consumption between Finnish women and men had narrowed during the 1980s for all birth cohorts examined.
Bjørk et al. (2008) continued their research with a later publication and additional data from 2005, allowing for an age-period-cohort analysis. The same main results were found and the authors were able to conclude with more certainty that the increase in alcohol consumption among Danes aged 50–74 from 1987 to 2005 had much to do with the developing lifestyle of the cohort born around the Second World War as well as with the cultural and social changes in Denmark in the 1960s and 1970s (Bjørk et al., 2008).
Thus, older Danish persons appear to have increased their drinking during the last three decades of the 20th century, and such a phenomenon points to the special characteristics of a particular cohort: those born between the word wars (Christensen et al., 2012). These persons enjoyed drinking alcohol during a time of increased liberalism in the Nordic region. It might be said that Denmark perhaps helped to lead the way with this lifestyle change that later also became apparent in the other four Nordic countries (Storm et al., 2010).
Trends in alcohol consumption among those 65 years of age or older between 2010 and 2017 have been examined in the Danish National Health Surveys (i.e., data from the same source as the present study) (Jensen et al., 2018). Consumption, as measured by percentages drinking over the sensible drinking limits (i.e., 21 standard drinks per week for men, 14 standard drinks per week for women) (Mørch et al., 2005) fell between 2010 and 2013. The report by Jensen and colleagues also noted that 65–74-year-olds have the highest percentage of individuals exceeding the Danish sensible drinking limits (along with 16–24-year-olds and 55–64-year-olds). These findings could indicate that the upswing in drinking that took place in the late 20th century and 2000s began to decline in the 2010s with the ageing of the cohort that was born around or before the Second World War. Furthermore, the results from the Danish National Health Surveys revealed that drinking habits of the elderly were also marked by a clear reverse social gradient (Jensen et al., 2018). This means that among older drinkers, the higher the level of education attained, the larger the proportion of risky drinkers.
The present study seeks to fill in gaps in the current state of the literature on older people’s drinking habits in Denmark in the period since the mid-2000s. Thus, the aim of this article is to provide a descriptive picture of trends and peculiarities in the development of the present situation in older people’s drinking patterns in Denmark.
Method
Data derive from the Danish Health and Morbidity Survey (2005) and the Danish National Health Survey (2010, 2013, and 2017) (in 2010, the Danish Health and Morbidity Survey was incorporated into the Danish National Health Survey) (Christensen et al., 2012; Ekholm et al., 2009; Jensen et al., 2018). All surveys are nationally representative with samples drawn at random from the adult population in Denmark aged 16 years or older using the Danish Civil Registration System (Pedersen, 2011). However, only Danish citizens were invited to participate in the Danish Health and Morbidity Survey in 2005, whereas all individuals with an official residence in Denmark were invited to the Danish National Health Survey in 2010, 2013, and 2017. The overall aim of these surveys was to describe the status and trends in health and morbidity in the adult Danish population aged 16 years or older. Moreover, the aim was to describe the factors that may influence the population’s health status, including, e.g., health behaviour, mental health, and environmental health risks.
The Danish Health and Morbidity Survey 2005
The total sample in 2005 included 21,832 Danish citizens. All invited individuals received an introductory letter briefly describing the purpose and content of the survey. It was emphasised that participation was voluntary. Data were collected via face-to-face interviews at the respondents’ homes (response rate: 66.7%). Following the interviews, all respondents were asked to complete one of two versions of a self-administered questionnaire (one of which contained questions on alcohol). The main reason for supplementing the face-to-face interview with a self-administered questionnaire was to include questions on more sensitive matters (such as the use of illicit drugs and sexual behaviour) in a less threatening way. Thus, half of the sample received a self-administered questionnaire including questions on alcohol consumption among other topics following the interview. In all, 5,552 individuals completed both the face-to-face interview and this version of the self-administered questionnaire (50.9%). The methodology of this survey is described in detail elsewhere (Ekholm et al., 2009).
The Danish National Health Surveys 2010, 2013, and 2017
In 2010 (n = 289,550), 2013 (n = 300,450), and 2017 (n = 312,349), the samples were based on random samples of individuals aged 16 years or older officially residing in Denmark. In 2010, 2013, and 2017, a concurrent mixed-mode approach was used to collect the survey data, allowing for the invited individuals to complete either a web questionnaire or to fill out an identical enclosed paper questionnaire. All selected individuals received an introductory letter briefly describing the purpose and content of the survey, and it was emphasised that participation was voluntary. The response rates were 59.5% (2010), 54.0% (2013) and 58.7% (2017). The methodology of these surveys is described in detail elsewhere (Christensen et al., 2012; Jensen et al., 2018).
Measures
For some of the indicators on drinking habits comparable data do not exist for all study years. Drinking habits are presented by the following alcohol indicators: Alcohol consumption (conversely abstention) during the past 12 months (2010, 2013, 2017) was assessed by asking the question: “During the past 12 months, did you drink any alcohol?” (“Yes”, “No”). Alcohol consumption at least two days a week (2010, 2013, 2017) was assessed by asking the following question: “How many days per week do you drink alcohol?” (“0–1 day”, “2 days”, “3 days”, “4 days”, “5 days”, “6 days”, “7 days”). This question is one of the items in CAGE-C questionnaire (Zierau et al., 2005). Mean number of standard drinks consumed in a typical week (2010, 2013, 2017) was assessed by asking the following beverage-specific question: “How many alcoholic drinks do you typically have on each day of the week?” as suggested by Ekholm et al. (2008). Each day of the week was listed, and intake was measured in numbers of standard drinks, with one standard drink equalling approximately 12 grams of pure alcohol. Heavy episodic drinking (HED) (2005, 2013, 2017) was assessed by asking: “How often do you have five or more standard drinks on one occasion?” (“daily or almost daily”, “weekly”, “monthly”, “less than monthly”, “never”) (Bohn et al., 1995). This question was asked in the self-administered questionnaire in one of the two subsamples in 2005. Frequent HED was defined as having five or more standard drinks on one occasion at least monthly. The definition of HED was not the same in 2010 (i.e., 6 standard drinks or more), and therefore data from 2010 were not included when examining trends in HED.
Data on sex and age were obtained from the Civil Registration System (Pedersen, 2011). In order to avoid overlooking any age-related changes in the drinking indicators, we decided to analyse our data in relatively narrow five-year age groups; i.e., 60–64 years, 65–69 years, 70–74 years, 75–79 years and 80 years or older. For reference purposes, we included the remainder of the sample as a single comparison group of 16–59 years.
Statistical analysis
In all survey waves, weights were constructed by using auxiliary information from Statistics Denmark’s registers in order to take into account the different sampling probabilities and reduce the impact of non-response bias (Christensen et al., 2012). As all individuals with an official residence in Denmark have a unique personal identification number, it was possible to link on an individual level the personal identification numbers of both respondents and non-respondents to relevant central registers. Hence, by applying calibrated weights it was possible statistically to allow for some differential non-response. Weights were computed by Statistics Denmark and based on information on sex, age, municipality of residence, highest completed level of education, income, marital status, ethnic background, number of visits to the general practitioner, hospitalisations, occupational status, and owner/tenant status for all invited individuals in each of the survey years, respectively. Additionally, in 2005, 2010 and 2013 the weights included adjustment for a provision in Denmark which enables residents to choose to opt out of participation in statistical and scientific surveys (this “research protection” option was removed in 2016). Results are presented as percentages or means (stratified by sex and age). Due to the rather small sample size in 2005, χ2 tests were used to evaluate the differences in the prevalence of HED between 2005 and 2013. All analyses were carried out using SAS version 9.4.
Results
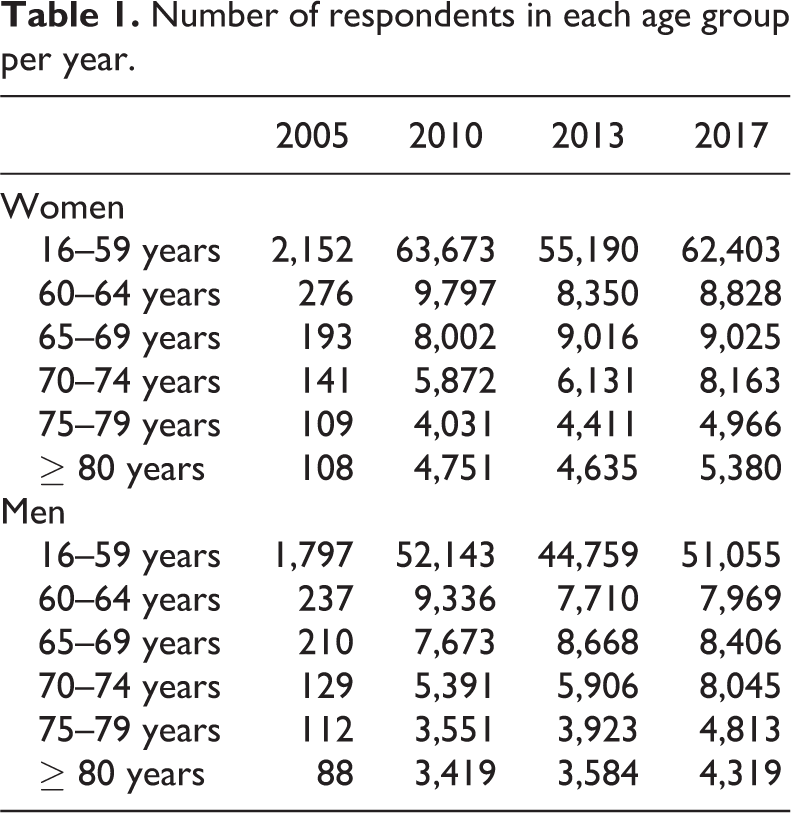
Table 1 shows the number of respondents in each survey by sex and age group.
Number of respondents in each age group per year.
The prevalence of current drinking
Overall, the prevalence of overall 12-month current drinking in all people aged 60 years or older increased slightly between 2010 and 2017. These proportions were 83.9% in 2010, 85.0% in 2013 and 85.2% in 2017 (data not given in table format). The prevalence of this indicator is displayed for all age and sex subgroups in Figure 1. The age group 16–59 years is included to serve as a reference point. Among women, the prevalence remained rather stable in the younger age groups (i.e., 60–64 years and 65–69 years) between 2010 and 2017, whereas an increasing tendency was observed in the older age groups. Among men, the results reveal a decreasing tendency in the younger age groups above 60 years (i.e., 60–64 years and 65–69 years) and an increasing tendency among the older age groups (75–79 years and ≥ 80 years) between 2010 and 2017. The prevalence among 70–74-year-old men was rather stable in the period. In all survey years and age groups, the prevalence is clearly higher among men than among women. The oldest age group of 80+ years had the lowest prevalence of current drinkers for all older age groups. Although their numbers are small, there is still a discernible tendency for the prevalence of drinking to rise during the study period.
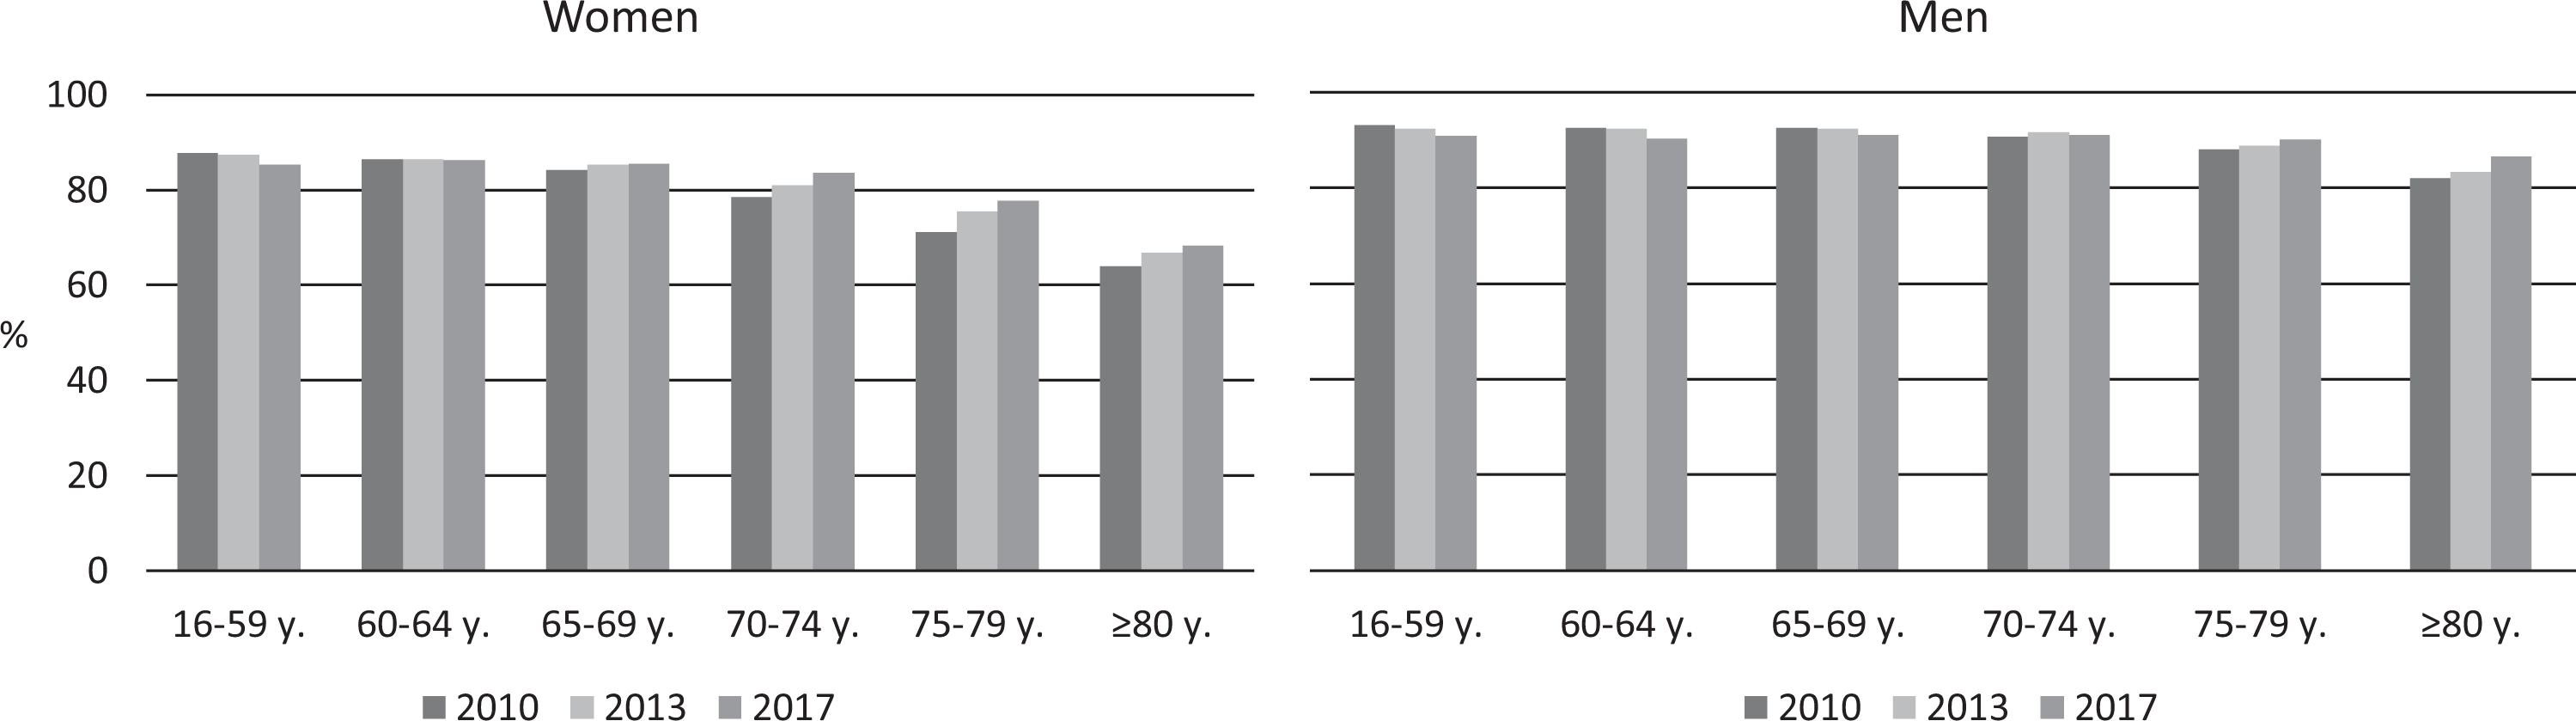
Proportion of current drinking in last 12 months (percentages).
The prevalence of frequent drinking
In general, the prevalence of all individuals aged 60 years or older who consumed alcohol at least twice a week had decreased slightly between 2010 and 2017 (54.0% in 2010, 53.7% in 2013 and 52.0% in 2017) (data not given in table format). As can be seen from Figure 2 the prevalence decreased between 2010 and 2017 for both women and men in the “younger” older age groups (i.e., 60–64 years and 65–69 years). Among women, there is a tendency towards an increase in the remaining older age groups, yet their prevalence is smaller than that among the 60-year-olds. The pattern of trends is somewhat more unclear among men in the remaining older age groups. In all survey years and age groups, the prevalence is again higher among men than among women. It is interesting that the 80+ year olds have a higher prevalence of drinking twice a week or more often than the young reference group (16–59 years). Yet the prevalence of these oldest citizens remains the lowest of all older people.
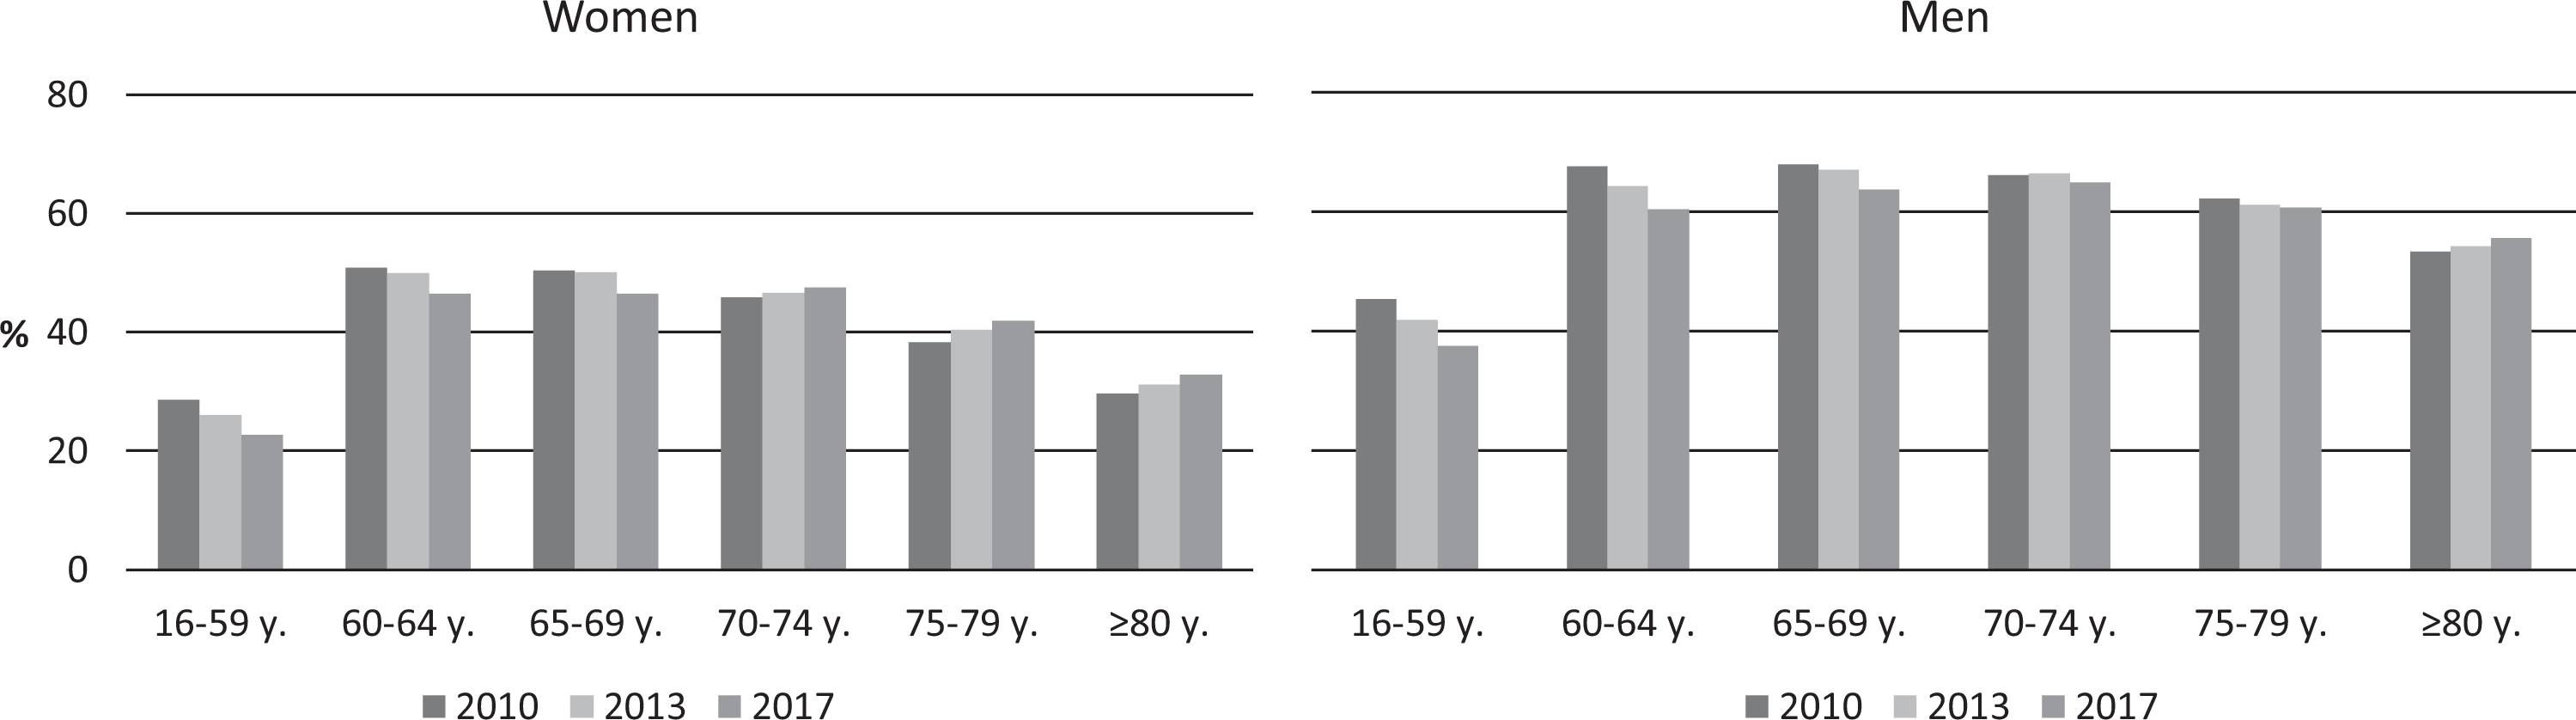
Proportion of those who have used alcohol at least twice a week (percentages).
Mean number of standard drinks per week
A decrease was also observed in the mean number of standard drinks (i.e., containing 12 grams ethanol) consumed in a typical week, from 8.3 in 2010 to 7.0 in 2017 (in 2013 the mean was 7.6) among people aged 60 years or older (data not given in table format). Among both women and men (Figure 3), the mean number of standard drinks in a typical week decreased between 2010 and 2017 in all age groups except for the oldest, where it has remained rather stable. In all survey years and age groups, the mean number is higher among men than among women. For this indicator the very oldest age group of 80+-year-olds also has the lowest mean consumption of standard drinks of all age groups, including the reference group.
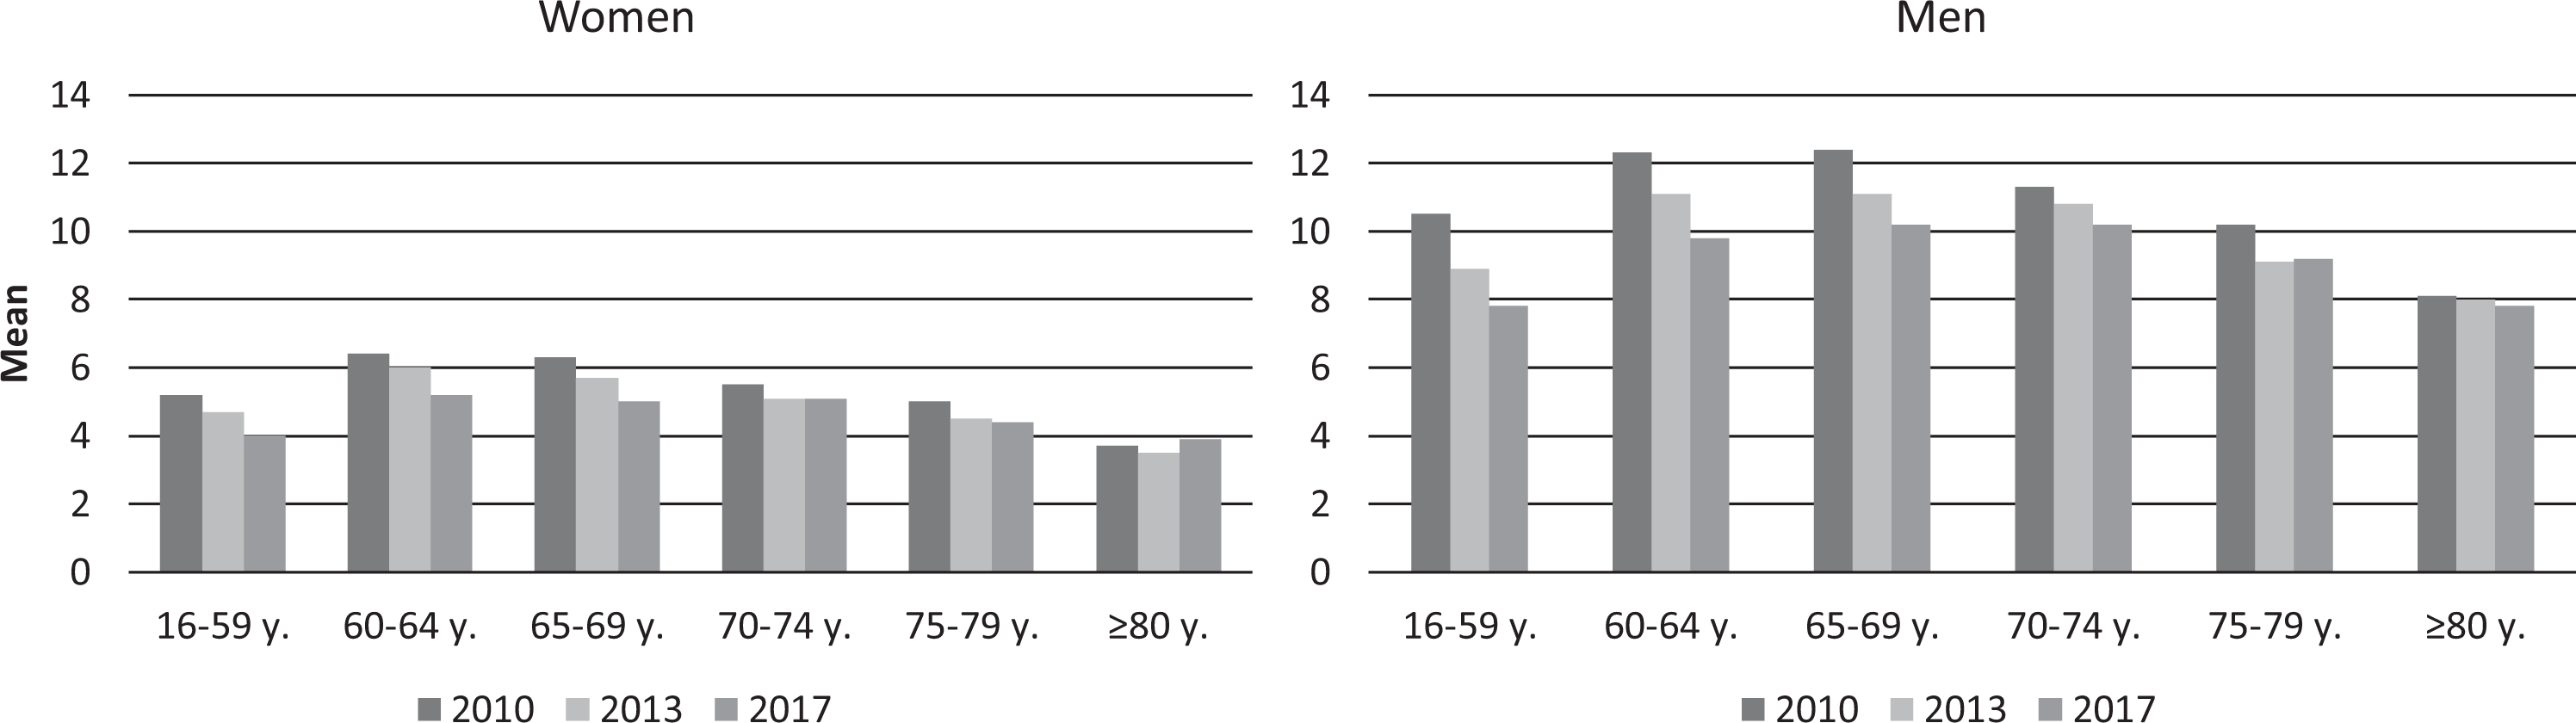
Number of standard drinks consumed in a typical week (mean number of standard drinks).
Prevalence of heavy episodic drinking (HED) at least monthly
A statistically significant decrease in the overall prevalence consuming at least five standard drinks on one occasion (“heavy episodic drinking”) at least monthly was also observed among people aged 60 years or older between 2005 (24.8%) and 2013 (14.8%) (data not given in table format). In 2017, the prevalence was 15.0%. As seen in Figure 4, there is a clear tendency towards a decline in the prevalence of HED at least monthly in all age groups and among both women and men. However, the prevalence decreased only between 2005 and 2013. Between 2013 and 2017 it remained rather stable among all people aged 60 years or older. Moreover, the prevalence among the oldest old is quite low since 2013, especially among women, and thus constitutes a less pronounced problem than it is among young Danes. It is important to note that the sample size was considerably smaller in 2005 as compared to 2013 and 2017. However, the observed decreases were statistically significant in all age groups among both sexes, except for men aged 65–69 years and women aged 75–79 years and 80 years or older.
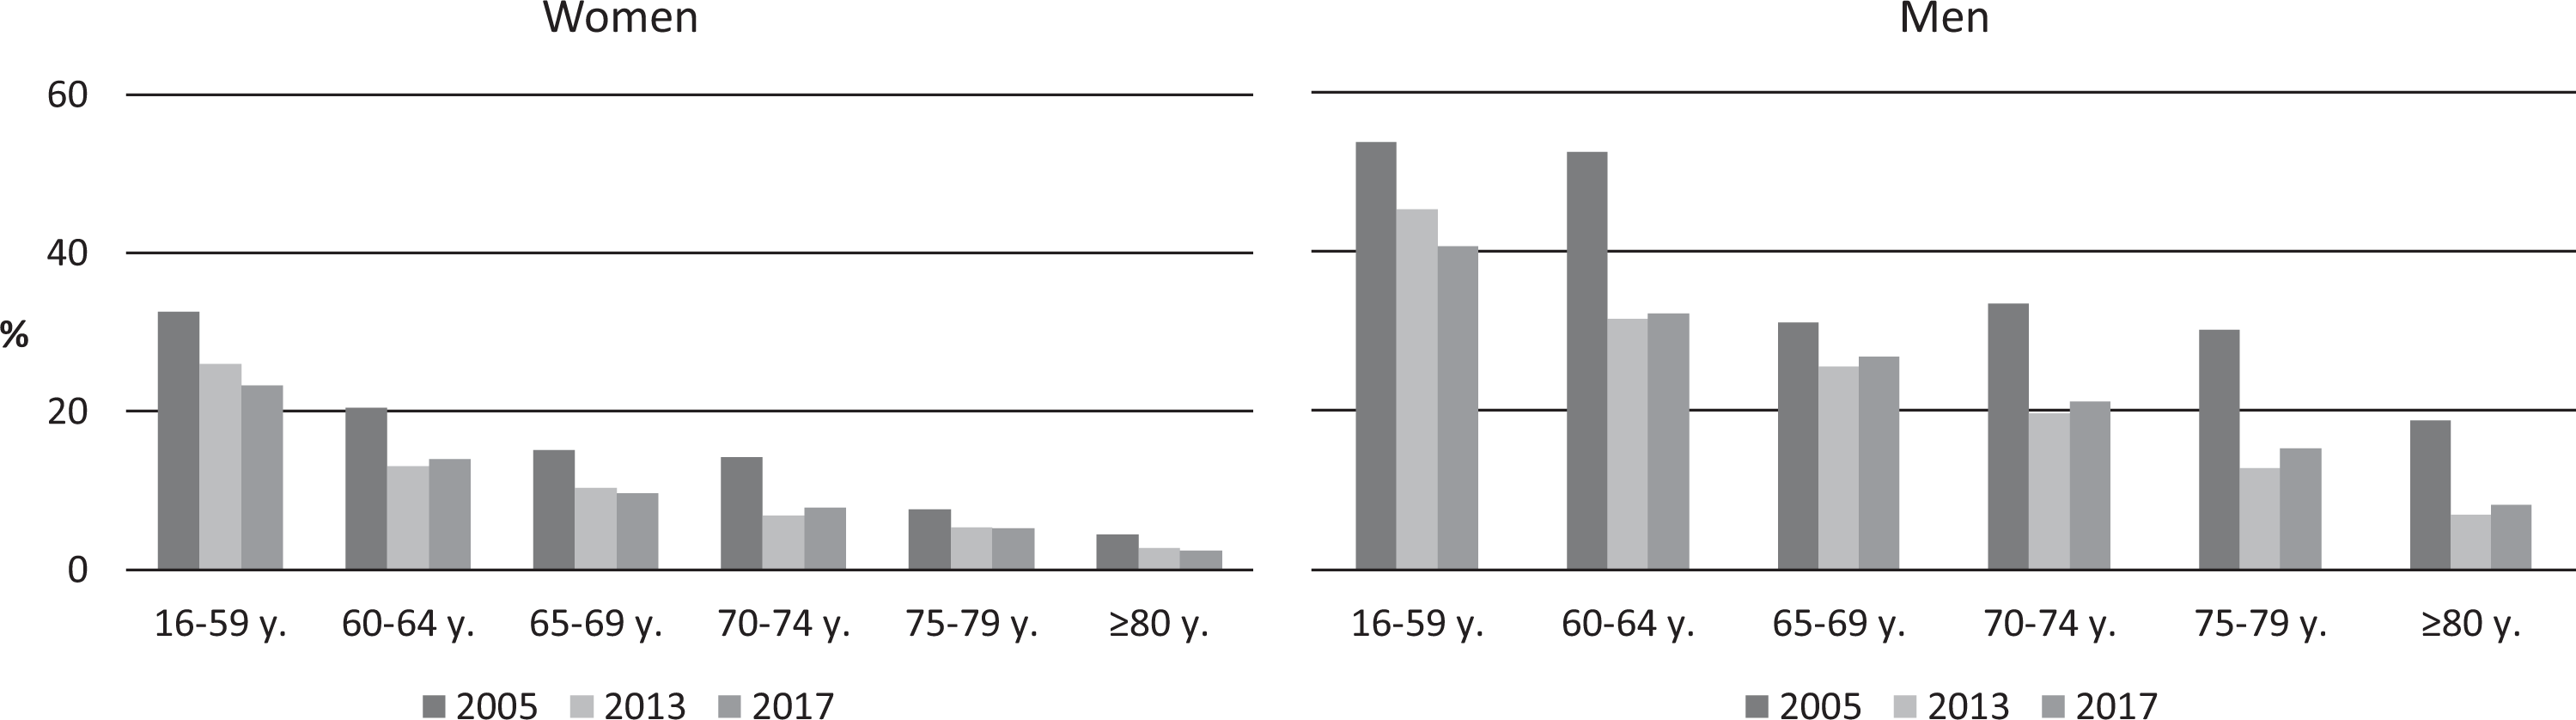
Heavy episodic drinking (≥ 5 standard drinks at one drinking occasion at least monthly) (percentages).
Discussion
The results of the present study suggest that an overall decline in alcohol intake among Danes aged 60 years or older occurred over the reviewed study period. These trends complete a longer overview of the development of drinking habits among older Danes since the late 1980s. In extending the earlier analyses with the present study, it appears that successive generations since 1987 have continued to decrease their drinking as they have grown older. This is not a surprising fact, as it is well known that people consume less alcohol as they age. Body water decreases and the metabolism changes such that the elderly are more sensitive and susceptible to alcohol’s side effects, including interactions with a number of medicines (Meier & Seitz, 2008).
The general tendency for the alcohol indicator of current drinking was a slight decline or a stable prevalence in the younger age groups (60–64 years and 65–69 years), and with an increasing tendency especially in the oldest age groups of 75–79 years and ≥ 80 years. The same pattern was observed for consumption of alcohol at least twice a week. Regarding mean number of standard drinks consumed per week there was a decreasing tendency across all age groups among men and among women up until the oldest age group. Lastly, HED clearly declined between 2005 and 2013, but then seemed to stabilise among both men and women in all age groups above 60 years.
For all of our analyses we included the age group 16–59 years as a comparison with the remainder of the general adult population. The trends in this reference group have basically mirrored those observed for the entire group of individuals above 60 years. However, interestingly, in this case, the prevalence of HED actually decreased among 16–59-year-old men and women between 2013 and 2017 while, as mentioned above, it stabilised in the older age groups, especially older men. In all survey years and age groups, the prevalence also is higher among men than among women.
Little research exists on the drinking habits of older people, including Danes. However, one Danish qualitative study examined a group of alcohol treatment patients aged over 60 years for their reasons for starting to drink heavily late in life. Patients reported several losses: losing social and professional networks, daily routines as well as the meaning and personal identity in life. These are experiences that often come with retirement and transition to this new stage in life (Emiliussen et al., 2017). Although our research is based on representative samples of the Danish general population, such qualitative treatment research contributes to an understanding of the context in which many older people experience drinking at their age. Other qualitative work also has painted a picture of the Danish drinking culture and how Danes perceive alcohol and drinking as generally a positive experience (Grønkjær et al., 2011). Furthermore, previous epidemiological research has demonstrated that in high income countries, including Denmark, the frequency of drinking actually increases with age (Bloomfield et al., 2008; Chaiyasong et al., 2018).
A major strength of the present study is that it is based on large national samples with adequate response rates. However, the sample size in 2005 was relatively small. Thus, the changes in the prevalence of consuming at least five standard drinks on one occasion at least monthly between 2005 and 2013 should be interpreted with some caution. Another possible limitation was that the sample in 2005 only included only Danish citizens. Hence, a sensitivity analysis was carried out that included only Danish citizens in the three most recent surveys. This analysis showed that the proportion of non-Danish citizens in the study population was small (approximately 1% of the respondents in each wave) and the exclusion of these individuals had no impact on the overall results. The possibility of bias due to non-response is a crucial issue in all survey-based research. Non-response was in all waves associated with male sex and younger age (Christensen et al., 2012; Ekholm et al., 2009; Jensen et al., 2018). The use of non-response weights has with all certainty reduced, but not eliminated, the bias of non-response. Another limitation was that the available study period was rather short.
It should be remembered that these data come from cross-sectional general population surveys and not from follow-up longitudinal data, which could have added another dimension of support for any speculations of actual causality. Although we have not followed the same people over time, representative samples of the same general population are regarded as usually indicative of ongoing trends in a defined population.
Conclusions
The findings of this study suggest an overall decline in alcohol consumption among older Danes during the study period. However, the trends in prevalence of various alcohol indicators varied by sex and age. The available study period was, unfortunately, rather short. Longer study periods are warranted as this would provide us with more insight into the patterns and trends in alcohol consumption among older adults. Thus, it is of utmost importance that the survey questions and mode of data collection remain unchanged to facilitate the analysis of future time trend studies of alcohol consumption among older Danes.
Supplemental Material
Supplemental Material, Supplementary_table_1 - Trends in alcohol consumption among older adults in Denmark in the 21st century
Supplemental Material, Supplementary_table_1 for Trends in alcohol consumption among older adults in Denmark in the 21st century by Heidi Amalie Rosendahl Jensen, Kim Bloomfield, Cathrine Juel Lau and Ola Ekholm in Nordic Studies on Alcohol and Drugs
Supplemental Material
Supplemental Material, Supplementary_table_2 - Trends in alcohol consumption among older adults in Denmark in the 21st century
Supplemental Material, Supplementary_table_2 for Trends in alcohol consumption among older adults in Denmark in the 21st century by Heidi Amalie Rosendahl Jensen, Kim Bloomfield, Cathrine Juel Lau and Ola Ekholm in Nordic Studies on Alcohol and Drugs
Supplemental Material
Supplemental Material, Supplementary_table_3 - Trends in alcohol consumption among older adults in Denmark in the 21st century
Supplemental Material, Supplementary_table_3 for Trends in alcohol consumption among older adults in Denmark in the 21st century by Heidi Amalie Rosendahl Jensen, Kim Bloomfield, Cathrine Juel Lau and Ola Ekholm in Nordic Studies on Alcohol and Drugs
Supplemental Material
Supplemental Material, Supplementary_table_4 - Trends in alcohol consumption among older adults in Denmark in the 21st century
Supplemental Material, Supplementary_table_4 for Trends in alcohol consumption among older adults in Denmark in the 21st century by Heidi Amalie Rosendahl Jensen, Kim Bloomfield, Cathrine Juel Lau and Ola Ekholm in Nordic Studies on Alcohol and Drugs
Footnotes
Acknowledgements
The Danish National Health Surveys were conducted and funded by The Capital Region, Region Zealand, The Region of Southern Denmark, The Central Denmark Region, The North Denmark Region, The Ministry of Health and the National Institute of Public Health, University of Southern Denmark.
Declaration of conflicting interests
The authors declared no potential conflicts of interest with respect to the research, authorship, and/or publication of this article.
Funding
The authors received no financial support for the research, authorship, and/or publication of this article.
References
Supplementary Material
Please find the following supplemental material available below.
For Open Access articles published under a Creative Commons License, all supplemental material carries the same license as the article it is associated with.
For non-Open Access articles published, all supplemental material carries a non-exclusive license, and permission requests for re-use of supplemental material or any part of supplemental material shall be sent directly to the copyright owner as specified in the copyright notice associated with the article.