
Abstract
Aims:
To examine the prevalence of and trends in older adults’ (60–79 years) alcohol use in Norway between 1985 and 2019.
Methods:
Data stem from two repeated cross-sectional surveys in the Norwegian population: Statistics Norway’s Health and Living Conditions Surveys from 1985 (N = 7799), 1995 (N = 3518) and 2005 (N = 6487), and the Norwegian Institute of Public Health’s (NIPH) annual surveys on alcohol, tobacco and drug use from 2012/2013 (N = 4047), 2014/2015 (N = 4378), 2016/2017 (N = 4264) and 2018/2019 (N = 4330). The following measures were used to examine trends in alcohol use among women and men aged 60 and older: drinking status, drinking frequency, number of drinks per occasion, and frequency of heavy episodic drinking (HED).
Results:
Between 1985 and 2019, there has been a substantial increase in the proportions of older adults in Norway who drink alcohol and who drink relatively often. The increase was particularly marked between 1985 and 2012/2013, and for elderly women. However, the majority of older adults drink small amounts of alcohol on typical drinking occasions, illustrating that the increased frequency of drinking is not accompanied by a corresponding increase in risky drinking.
Conclusions:
There has been a marked increase in alcohol use among older adults the past 30 years, particularly among older women, suggesting that the age and gender gap traditionally found in alcohol use in Norway is diminishing. Due to the lower alcohol tolerance among elderly, monitoring the changing trends in alcohol use in this group, as well as the possible consequences of these changes, is important.
In the past few decades, alcohol use among older adults has gained increased attention, in the Nordic countries and other European countries (e.g., Bye & Østhus, 2012; Frydenlund, 2011; Hallgren et al., 2009; Ramstedt, 2009), and in the United States (e.g., Han et al., 2017). There are several possible reasons for this. First, older adults constitute a growing share of the population in Norway, as elsewhere. Due to the large number of Norwegian citizens born in the 1940s and 1950s, lower birth rates over the past 50 years, increased life expectancy and improved health, the proportion of older individuals will increase in the next decades. In Norway, the proportion of the population aged 64 years and older was 15% in 2011, and is expected to increase to 22% in 2040 (http://statbank.ssb.no/statistikkbanken). Moreover, the older adults of today grew up in a wetter society than their parents and grandparents (Præstiin, 2008). Those who grew up in the post-war era had a higher standard of living, increased availability of alcohol as well as greater purchasing power thus resulting in a relatively lower price of alcohol.
The increasing number of older people drinking alcohol in Norway could result in more alcohol-related problems in this group. Older adults have a lower alcohol tolerance due to factors such as reduced muscle mass and slower metabolism; i.e., the same amount of alcohol is more harmful to older than younger individuals (Anderson et al., 2012; Galluzzo et al., 2012). Hence, drinking a large amount of alcohol on one occasion, i.e., heavy episodic drinking (HED), is particularly likely to increase the risk for acute health and social problems as well as the risk for accident injuries such as falls among older adults (Hartikainen et al., 2007; Woolcott et al., 2009).
Additionally, older adults represent the largest consumer group of prescription drugs, and the combined use of alcohol and prescription medicines may result in an increased risk of harm and accidents for older adults who combine these substances, as well as for the people around them (Bye & Rossow, 2017; Moore et al., 2007). In this context, it should be mentioned that compared to men, women are particularly susceptible to the effects of alcohol due to their lower ability to metabolise alcohol. The risk of negative consequences from equal amounts of alcohol is thus more elevated for older women than for older men (Blow & Barry, 2002; Epstein et al., 2007; Wilson et al., 2014). Older women are also more likely to be prescribed medicines (Berg, 2019) that can result in severe consequences when taken concomitantly with alcohol (Moore et al., 2007). To what extent the increased alcohol use among older adults will affect injury and accident statistics in the future is of great interest, and monitoring the alcohol use of older adults is therefore important.
Registered alcohol sales in Norway increased sharply from an average of 5 to 6.75 litres of pure alcohol per capita aged 15 years and older between the beginning of the 1990s and 2008. After 2008, the registered sales of alcohol declined and the average has been approximately 6 litres of pure alcohol per capita aged 15 years and older in the past years (Bergsvik, 2019). Studies of changes in alcohol use in the Norwegian general population since the 1970s reveal three main changes. First, more people drink alcohol; there has been especially an increase in the share of women and older adults who report drinking. Second, there has been a change in the type of alcohol consumed, with a larger proportion of the population drinking wine today compared with 25 years ago, while the proportion drinking beer and liquor has remained fairly constant. The third and most important change is that Norwegians drink alcohol more frequently than before (Bye & Østhus, 2012). Traditionally, there has been both an age and a gender gap in alcohol use in Norway. Young adults and middle-aged people have had more harmful drinking patterns than older adults, and men have traditionally had more harmful drinking patterns than women, including more frequent drinking and consumption of larger quantities per drinking occasion (Horverak & Bye, 2007). However, some of these differences may have evened out in recent years.
The possible changes in older adults’ alcohol use are addressed in a number of Norwegian studies (mainly published in Norwegian), covering data from the period 1973–2004 (Horverak, 2006; Horverak & Bye, 2007), 1995–2008 (Bye & Østhus, 2012; Støver et al., 2012), 2002/2003–2007/2008 (Løset & Slagsvold, 2013), and 2002–2008 (Brunborg & Østhus, 2015). However, a detailed overview of trends from 2008 onwards in older adults’ alcohol use is lacking. Moreover, a common feature of previous studies addressing changes in alcohol use among the middle-aged and elderly in Norway is that older adults are either treated as one large age group (i.e., individuals aged 40 years and above; Brunborg & Østhus, 2015), or as two age groups (e.g., 55–64/65–79 years in Bye & Rossow, 2019, and 51–65/66–79 years in Bye & Østhus, 2012). However, different changes may occur in the various age groups of older adults. Due to the crude classification of older adults in previous studies, little is known about whether the changes are consistent across various age segments. Thus, in the present study we used a more refined division of adults above 60 years; 60–64 years, 65–69 years, 70–74 years, and 75–79 years. Trends in older adults’ alcohol use are the main focus in this study. However, individuals aged 16–59 years were included to serve as a reference group. This enabled us to examine whether potential changes in alcohol use were valid only for older adults or whether the changes reflected a general trend. In addition, because the trends in alcohol use seem to differ between women and men (Bye & Østhus, 2012), and because older women are particularly susceptible to alcohol use (Blow & Barry, 2002; Epstein et al., 2007), gender-specific analyses are warranted. Finally, because we wanted to examine possible changes in the level and the pattern of drinking among older adults in Norway, several dimensions of alcohol use were included in the analysis.
The aim of this study was to estimate the prevalence of, and examine the trends, in alcohol use among men and women aged 60 years and older in Norway between 1985 and 2019 with regard to drinking status, drinking frequency, number of drinks per occasion and heavy episodic drinking (HED).
Methods
Procedure and respondents
Data from two large repeated cross-sectional surveys in the Norwegian population, with similar questions on alcohol use at several time points, were used. The first data set stems from Statistics Norway’s (SSB) Health and Living Conditions Survey (HLCS) conducted in 1985, 1995 (Ramm, 2000) and 2005 (Hougen, 2006). In each survey year, a representative sample (random) of the population of about 10,000 people aged 16 to 79 years first received information and a letter of invitation to the study. In 1985 and 1995, all interviews were conducted as personal interviews. In addition, a self-administered form including questions that may be perceived as sensitive (about mental health, use of alcohol and drugs, etc.) was left behind for the respondent to fill out and return postally after the personal interview was completed. In 2005, the data collection was conducted as a combination of personal and telephone interviews, along with a self-administered form as used in 1995 (postal supplement for those who answered by telephone).
The second data set stems from annual surveys on alcohol, tobacco and drug use (2012–2019) commissioned by the Norwegian Institute of Public Health (NIPH) and carried out by Statistics Norway (for details see Amdam, 2015a, 2015b; Høstmark, 2014a, 2014b; Jensen, 2018; Lagerstrøm, 2018, 2019; Todorovic, 2019). Each year, a general population sample (N = 3700) aged 16 to 79 years, regarded as representative (random) of the adult population, was contacted by Statistics Norway and asked to participate in a telephone survey (CATI) on alcohol- and drug-related topics. The annual surveys from the NIPH have considerably lower sample sizes (approximately 2000 respondents in each survey year) than the Health and Living Conditions Survey. To obtain a sufficient number of respondents in the five-year age groups among men and women aged 60+ years, we pooled data from the years 2012–2013, 2014–2015, 2016–2017 and 2018–2019.
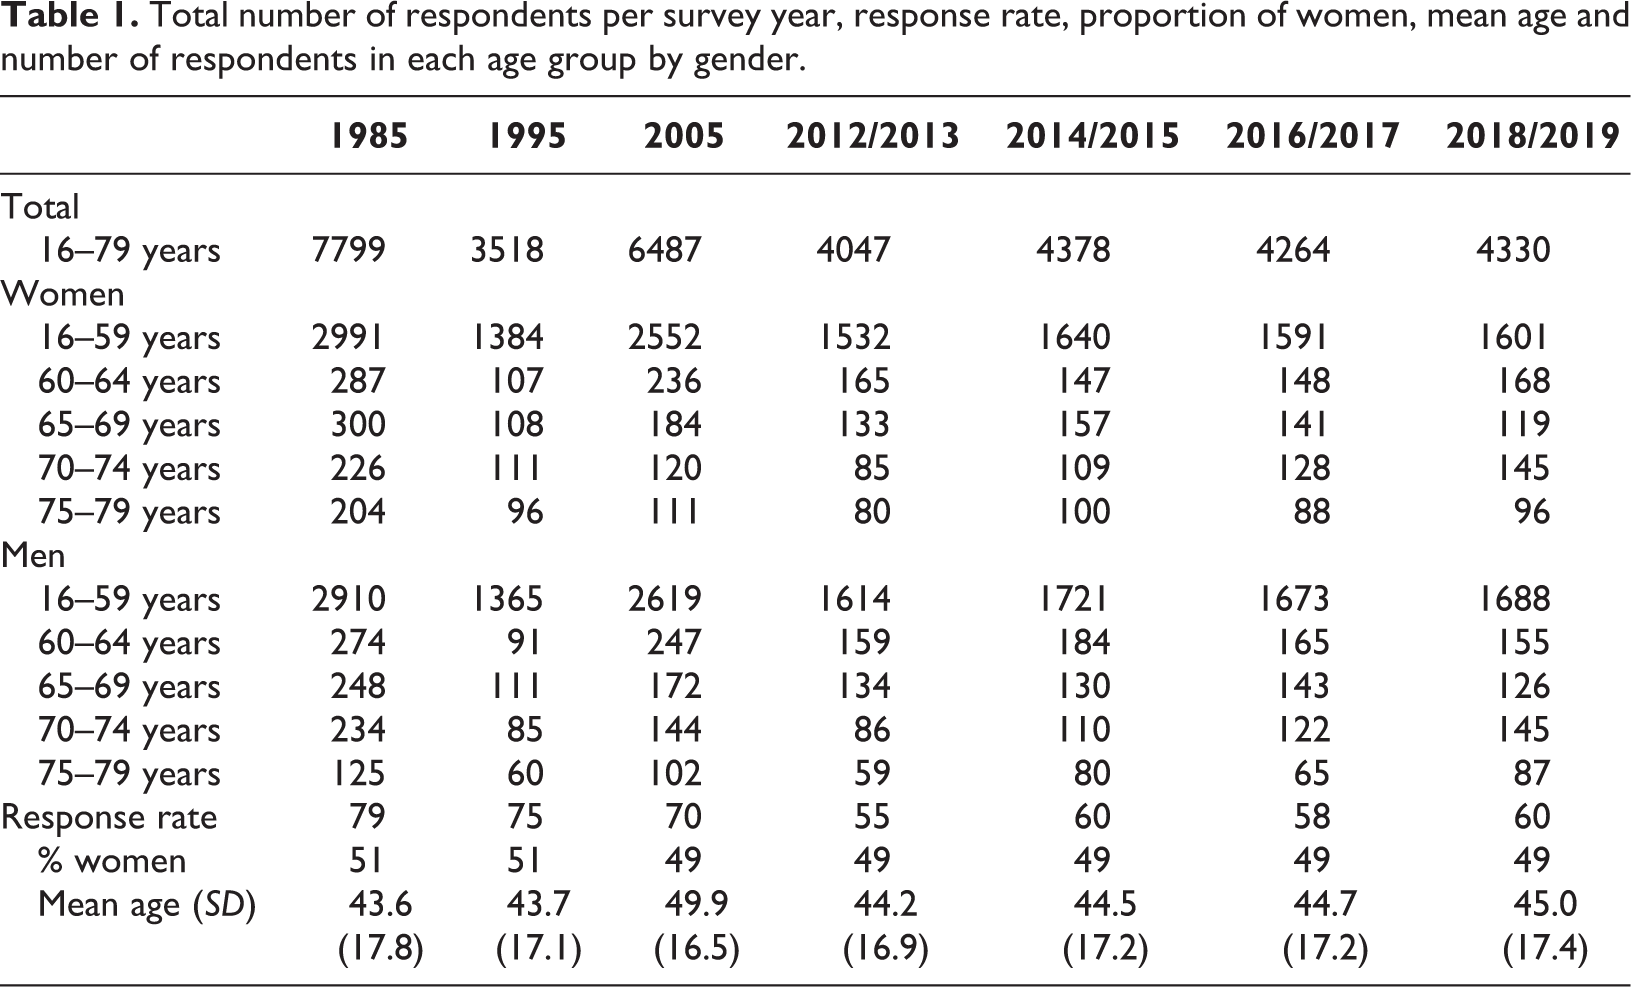
The surveys are weighted to take into account distortions that may arise between sample and population with respect to socio-demographic characteristics (gender, age, place of residence) or sampling procedure. Sample sizes and response rates, and characteristics of the samples, for each survey year are displayed in Table 1. Adults aged 60 years and older were divided into four age groups (60–64 years, 65–69 years, 70–74 years and 75–79 years), and individuals aged 16–59 years were included to serve as a reference group.
Total number of respondents per survey year, response rate, proportion of women, mean age and number of respondents in each age group by gender.
Measures
Current drinkers and frequency of drinking
In the survey years 1985–2019, the respondents were asked about frequency of drinking in the past 12 months, with response categories ranging from “zero times/never” to “4 times a week or more often”. In the present study, these questions were collapsed into two drinking categories: (a) current drinkers, where zero times/never was coded 0 (non-drinkers past 12 months), and all other values coded 1 (current drinkers); and (b) frequent drinkers, where respondents who reported drinking alcohol two days per week or more often were coded 1, and those who reported drinking less than two days per week or zero times/never were coded 0.
Alcohol units consumed
From 2012 onwards respondents were asked “How many drinks containing alcohol do you have on a typical day when you are drinking?”. This question corresponds to the question asked in the Alcohol Use Disorders Identification Test (AUDIT) (Babor, et al., 2001). The answers ranged from 1–2 units to 10 or more units. Due to few respondents in the highest categories, we use only four groups: “none”, “1–2 units”, “3–4 units”, or “5+ units”. Moreover, very few individuals in the age group 70–79 years reported more than 3+ units on a typical day, thus this measure is displayed only for the age groups 16–59 years and 60–79 years.
Frequency of heavy episodic drinking
In the surveys from 1985, 2005 and 2012–2019 (the question was not included in 1995), the respondents were asked about frequency of heavy episodic drinking (HED), that is, drinking six alcohol units (e.g., four half-litres of beer or one bottle of wine) or more on one drinking occasion. However, the frequency categories were not defined in the same way for the years 1985, 2005 and 2012–2019. Thus, we constructed two variables: (1) any HED in the past 12 months (coded 1 = any HED, 0 = no HED) for all years, and (2) frequent HED, defined as having six or more standard drinks on one occasion once a month or more often (coded 1 = HED once a month or more often and 0 = HED less often/no HED) for the years 2012–2019. As for number of alcohol units consumed, frequent HED was also very uncommon among the elderly aged 65+ years, especially women, so the elderly age groups were collapsed into one group (60–79 years) for the frequent HED measure.
Mean frequencies
To illustrate the development of mean frequency of drinking and mean frequency of HED, we calculated mean frequency variables for 2018/19 with values: (a) daily/almost daily = 365, (b) 4–5 times a week = 234, (c) 2–3 times a week = 130, (d) once a week = 52, (e) more than three days a month (36), (f) 2–3 times a month = 30, (g) once a month = 12, (h) more than three days a year = 5, (i) 2–3 times a year = 3, (j) one day in the past year = 1, and (k) none = 0.
The results are presented separately for men and women, and the age groups 16–59 years (as a reference group), 60–64 years, 65–69 years, 70–74 years and 75–79 years, with the exception of the measures of typical alcohol units consumed and frequent HED, where only the age groups 16–59 years and 60–79 years were used.
The question about typical alcohol units consumed was not included in the HLCS studies. Furthermore, the frequency of HED question had different response categories in the HLCS and NIPH studies and was not included in 1995. Thus, data are only presented for the years after 2005 for these two measures.
Analyses
The data were analysed with SPSS, version 25. Descriptive statistics are presented as percentages or means, across age groups and gender (weighted data).
Results
Prevalence of current drinking
The proportion of current drinkers in Norway, in the years 1985 to 2019, is displayed in Table 2. For respondents aged 60 years and above, the proportion of current drinkers increased significantly, i.e., from 60% in 1985 to more than 80% in 2005 and onwards, while it was more or less stable in the reference group (16–59 years). The proportion of current drinkers has increased substantially and more so among women than among men in the past 30 years (Table 2).
Proportions of current drinkers, gender and age, 1985–2019.
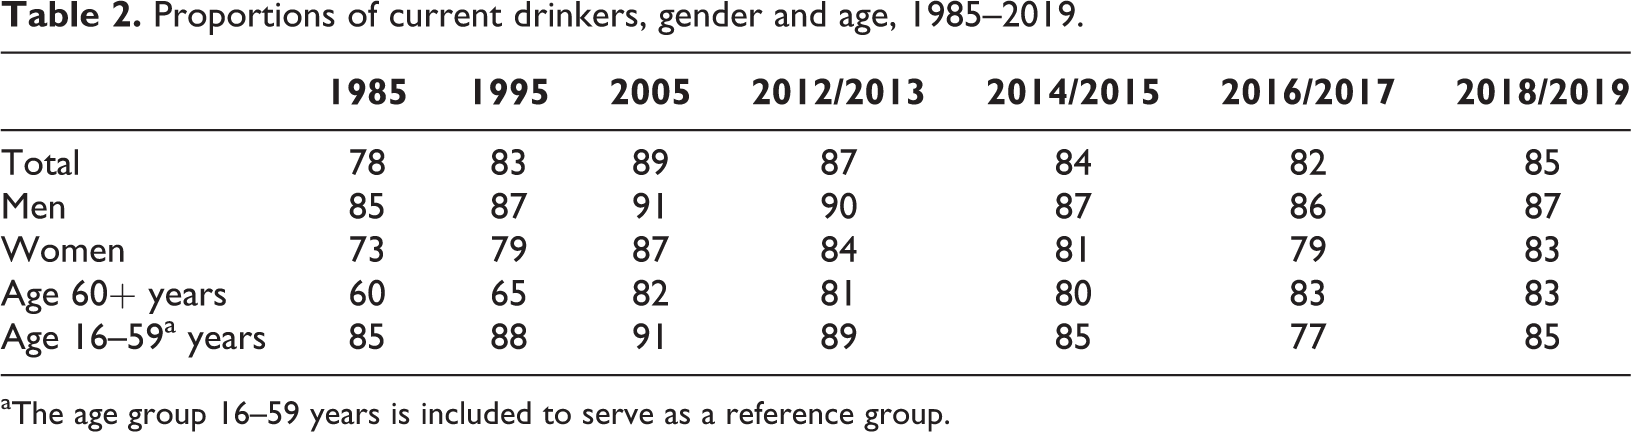
aThe age group 16–59 years is included to serve as a reference group.
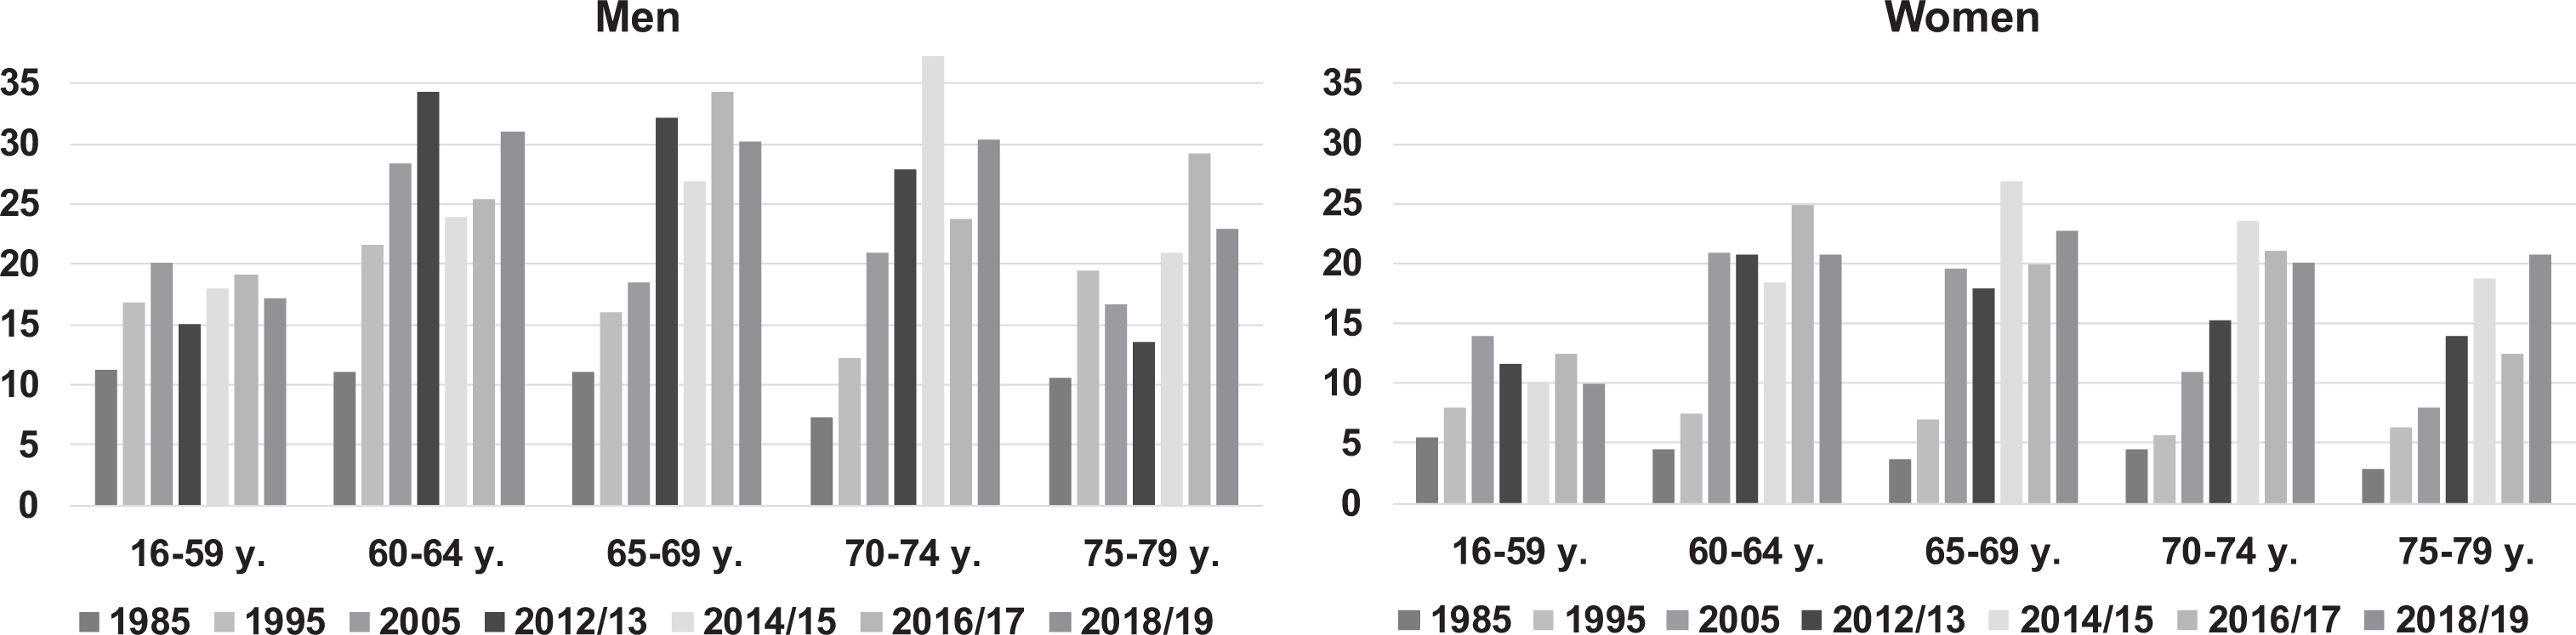
The 12-month alcohol use prevalence and trends for men and women in different age groups are shown in Figure 1. Figure 1 reveals substantial changes in the older age groups. It can be seen that the changes are most pronounced in older women: in all four age groups 60 years and older, the increase in the proportion of current drinkers has been approximately 30%. The largest relative increase was found among women aged 75–79 years, i.e., from 38% of current drinkers in 1985 to 71% in 2018/2019. However, the proportion of women who are current drinkers is still lower for the 70–79-year group (i.e., around 70%) compared to women aged 60–69 years (i.e., around 90%). The proportion of current drinkers also increased among men in all four age groups from 60+ years, with the largest increase found among men aged 75–79 years (from 57% to 82%). The proportion of current drinkers in the two oldest age groups of men are more similar, i.e., around 80% among those aged 65–79 years and 90% among those aged 60–64 years. The proportion of current drinkers in the reference group (16–59 years) has been relatively stable among men (90%) and fluctuated between 80% and 90% among women in the period.
The gender gap narrowed markedly throughout this period, and in 2018/2019 the proportion of current drinkers aged 65–69 years is somewhat higher among women (87%) than among men (83%).
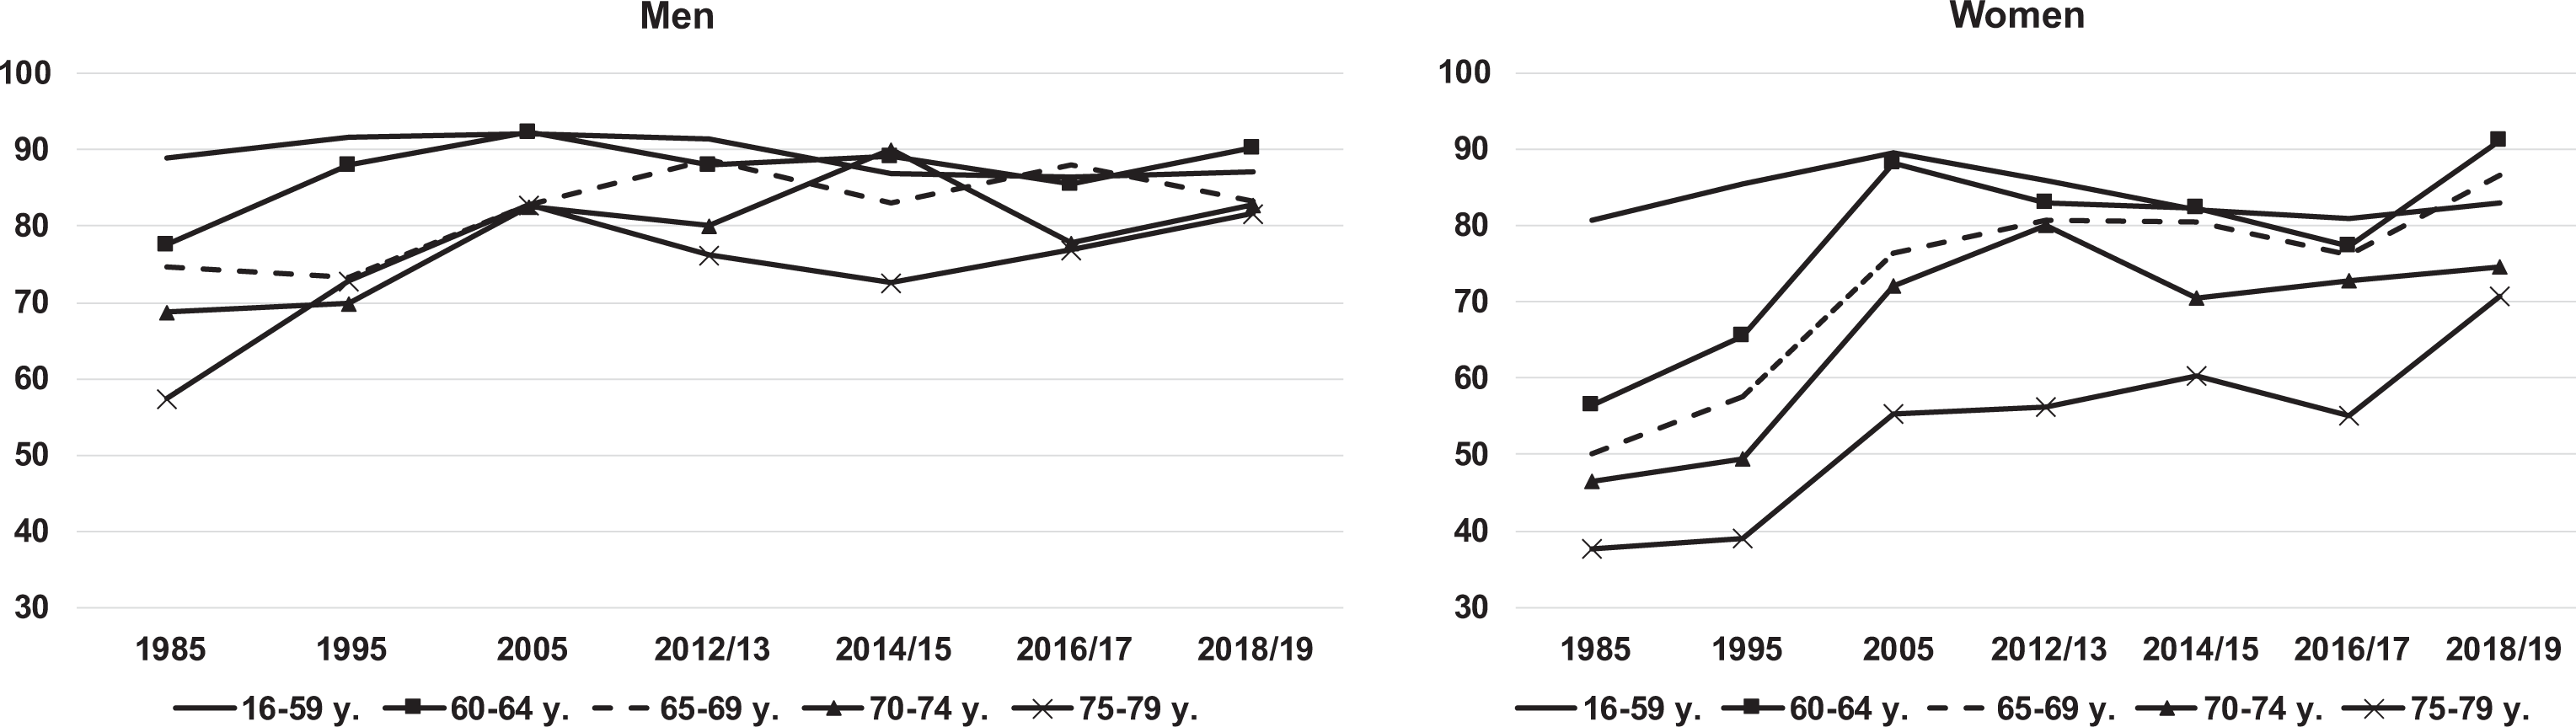
Proportions of current drinkers, gender and age groups, 1985–2019 (percentages).
Prevalence of frequent drinking
The proportion who reported drinking alcohol at least twice a week (frequent drinkers) also increased between 1985 and 2018/2019, and considerably more so among adults aged 60+ years (Table 3). In 1985, the prevalence of frequent drinkers was higher in the reference group (8.3%) than among those aged 60+ years (6.7%). However, since 2005 the order is reversed: in 2018/2019, the proportions were 25.1% for older adults and 13.6% for the reference group. Table 3 also shows that frequent drinking increased among both men and women in the period, but relatively more so for women. Moreover, the increase in the proportion of frequent drinkers from 1985 to 2005 appears to have levelled out in the period 2012–2019.
Proportions of those who reported drinking alcohol twice a week or more often (past 12 months), gender and age, 1985–2019.
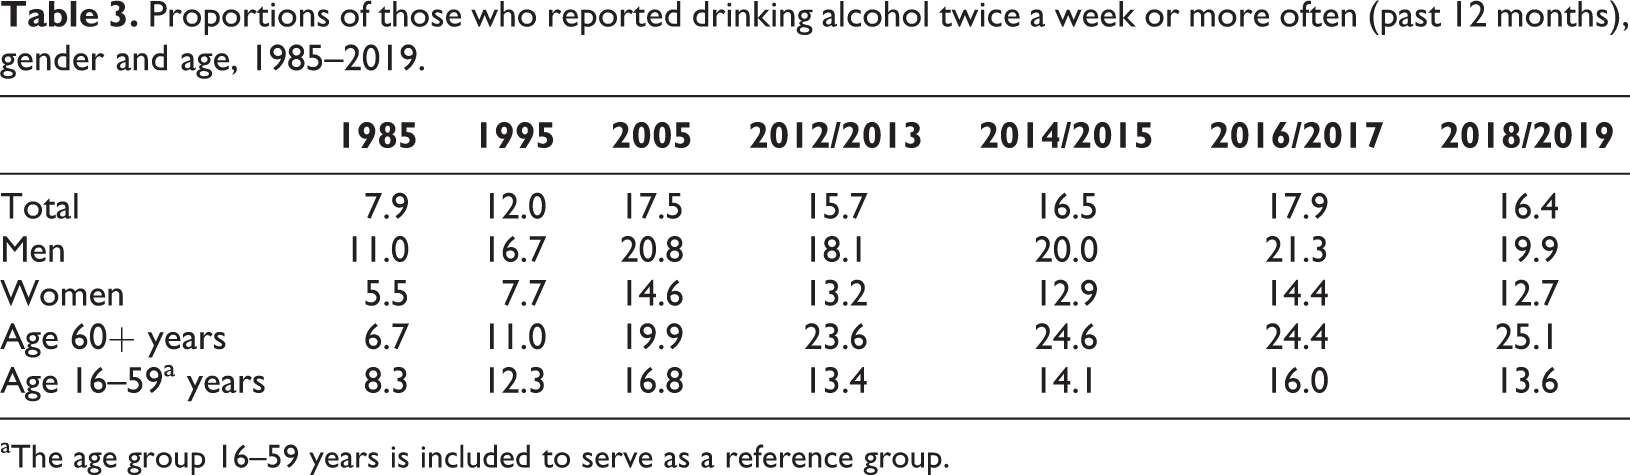
aThe age group 16–59 years is included to serve as a reference group.
Figure 2 shows that there has been an overall increase in frequent drinking (past year) in all four 60+ age groups both for men and women in the period 1985–2019, with a relatively larger increase among women. However, the increase has not been consistent throughout the whole period. It was most pronounced between 1985 and 2012/2013 and then there has been a tendency toward levelling out and even a decrease in some age groups (e.g., among women aged 70–74 years). Moreover, while frequent drinking was more common in the reference group (16–59 years) than in older age groups until 1995, frequent drinking was more common among all older female age groups after 2012/2013 and among all older male age groups after 2014/2015 than the reference group (16–59 years). Among older women, the proportion of frequent drinkers is similar in all age groups: one in five respondents reports frequent drinking in the age group 60–79 years. Among older men, three out of ten report frequent drinking with the exception of the oldest age group (75–79 years).
The gender gap also seems to be closing with respect to frequent drinking, but still more men than women report frequent drinking in all older age groups.
The proportion of men and women who reported drinking alcohol twice a week or more often (past 12 months) in different age groups, 1985–2019.
Typical amounts consumed
Figure 3 displays the proportion reporting various numbers of alcohol units consumed on a typical drinking day in 2012/2013 and 2018/2019 (data not available for the period 1985–2005). In 2018/2019, the majority of women aged 60+ years (64%) typically consumed 1–2 units on a drinking day, while 15% reported drinking 3–4 units. Among elderly men, the figures were 53% for 1–2 units and 23% for 3–4 units, respectively. Drinking more than five units on a typical drinking day was uncommon among elderly women (3%) and more common among elderly men (9%). This pattern was consistent in the whole period 2012–2019. Drinking larger amounts of alcohol, i.e., 3–4 and 5+ units, was more common in the reference group than among older adults (Figure 3).
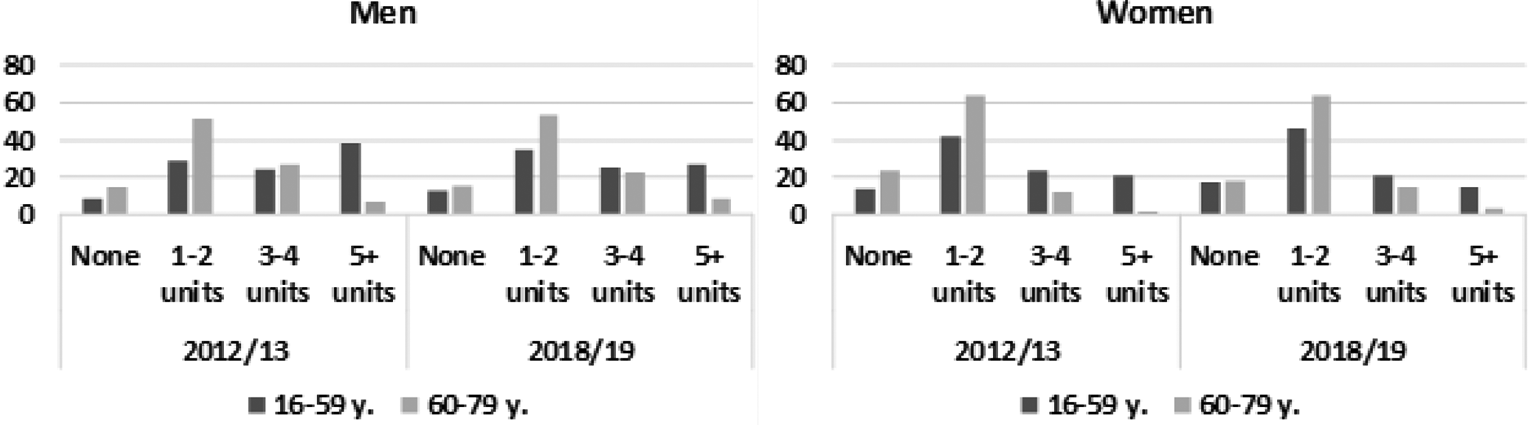
Proportion of men and women in different age groups and number of alcohol units consumed on a typical drinking day, 2012/2013 and 2018/2019 (percentages).
Table 4 shows the proportion who reported heavy episodic drinking (HED) in the past year. It can be seen that the proportion of older adults (60+ years) reporting any HED increased in the period, and more so for women than men. In the reference group, the proportion reporting any HED was higher than among older adults and fairly stable throughout the period.
Data for frequent HED (i.e., once a month or more often) were only available for the years 2012–2019. Less than one out of ten older adults (60+ years) reported frequent HED in this period. Frequent HED was more common in the reference group, i.e., about two out of ten reported frequent HED in this group throughout the period. Finally, frequent HED was more common among men than women (Table 4).
The proportion who reported any heavy episodic drinking (HED) in the past year, and HED once a month or more often in the past year, age groups and gender, 1985–2019.
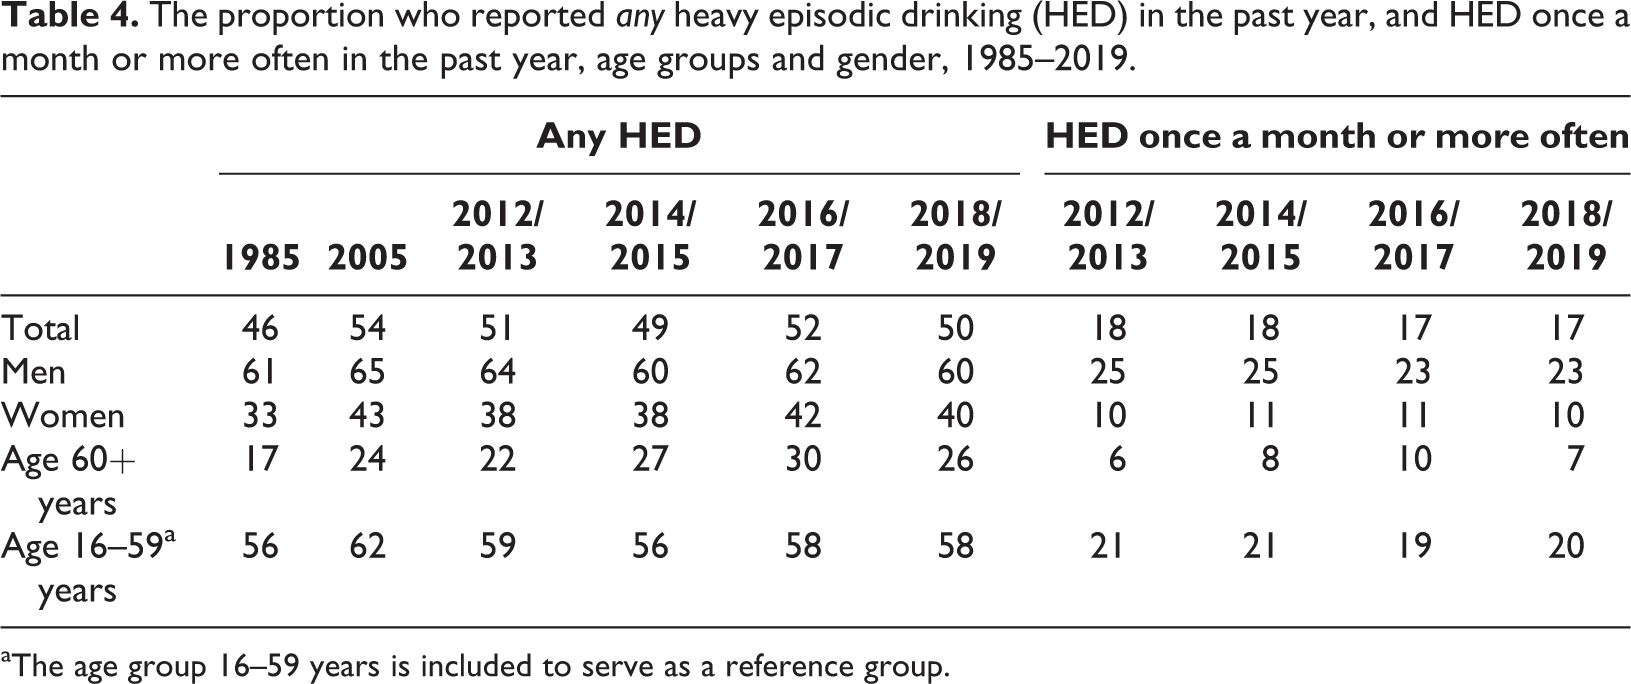
aThe age group 16–59 years is included to serve as a reference group.
Prevalence of heavy episodic drinking (HED)
Figure 4 displays the proportion of women and men of different age groups reporting frequent HED during the past year (2012–2019). The proportion of older men reporting frequent HED has been fairly stable in the period 2012–2019, i.e., around 10%. Among older women, the proportion increased from 3% in 2012/2013 to 7% in 2016/2017, and was 5% in 2018/2019. Although the gender gap in frequent HED has narrowed somewhat among older people, and remained stable at a higher level in the reference group, frequent HED is still more common among older men than among older women.
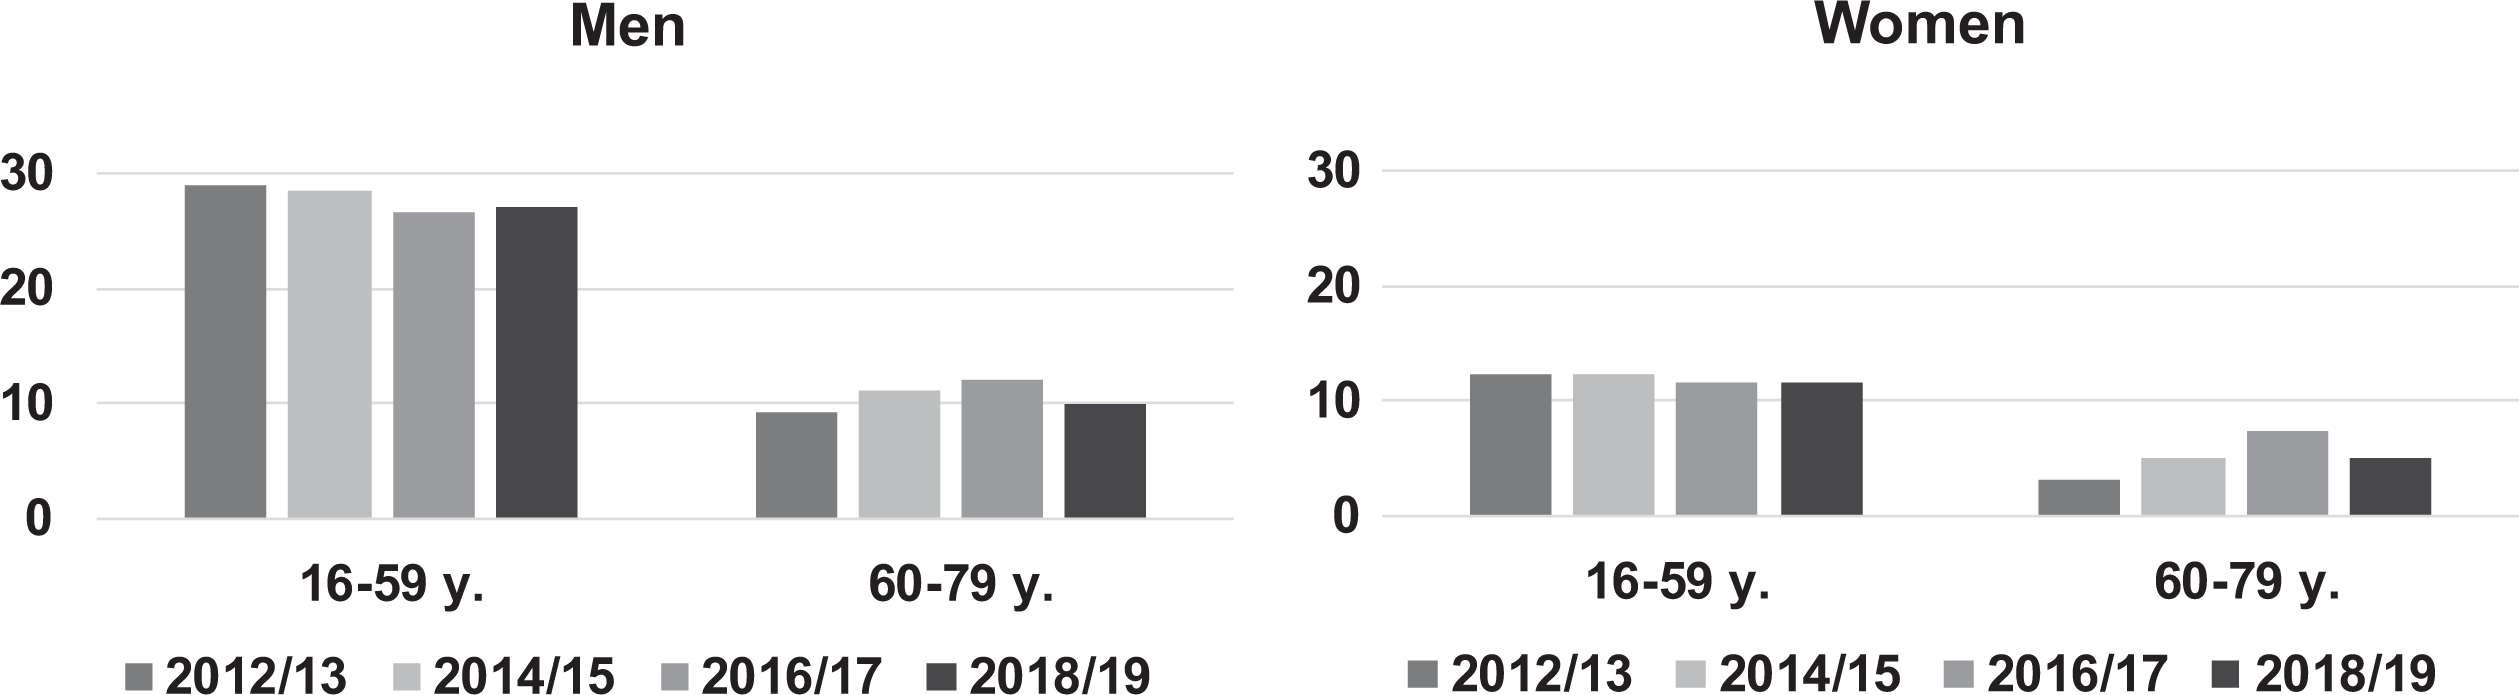
The proportion of men and women who reported heavy episodic drinking (HED) monthly or more often during the past year (2012–2019) in different age groups (percentages).
To shed further light on the drinking patterns of older adults, we calculated the average drinking frequency and average frequency of HED during the past year for 2018/2019 (Figure 5). The figure clearly illustrates that even though the average frequency of drinking increases with increasing age (until age 70 years), the opposite is true for risky drinking such as HED. The average HED frequency is highest among youth and young adults (16–29 years), fairly similar for the age groups between 40–59 years and lowest for the age group 60–79 years. Thus, the increase found in frequency of drinking among older people is not accompanied by an increase in heavy episodic drinking.
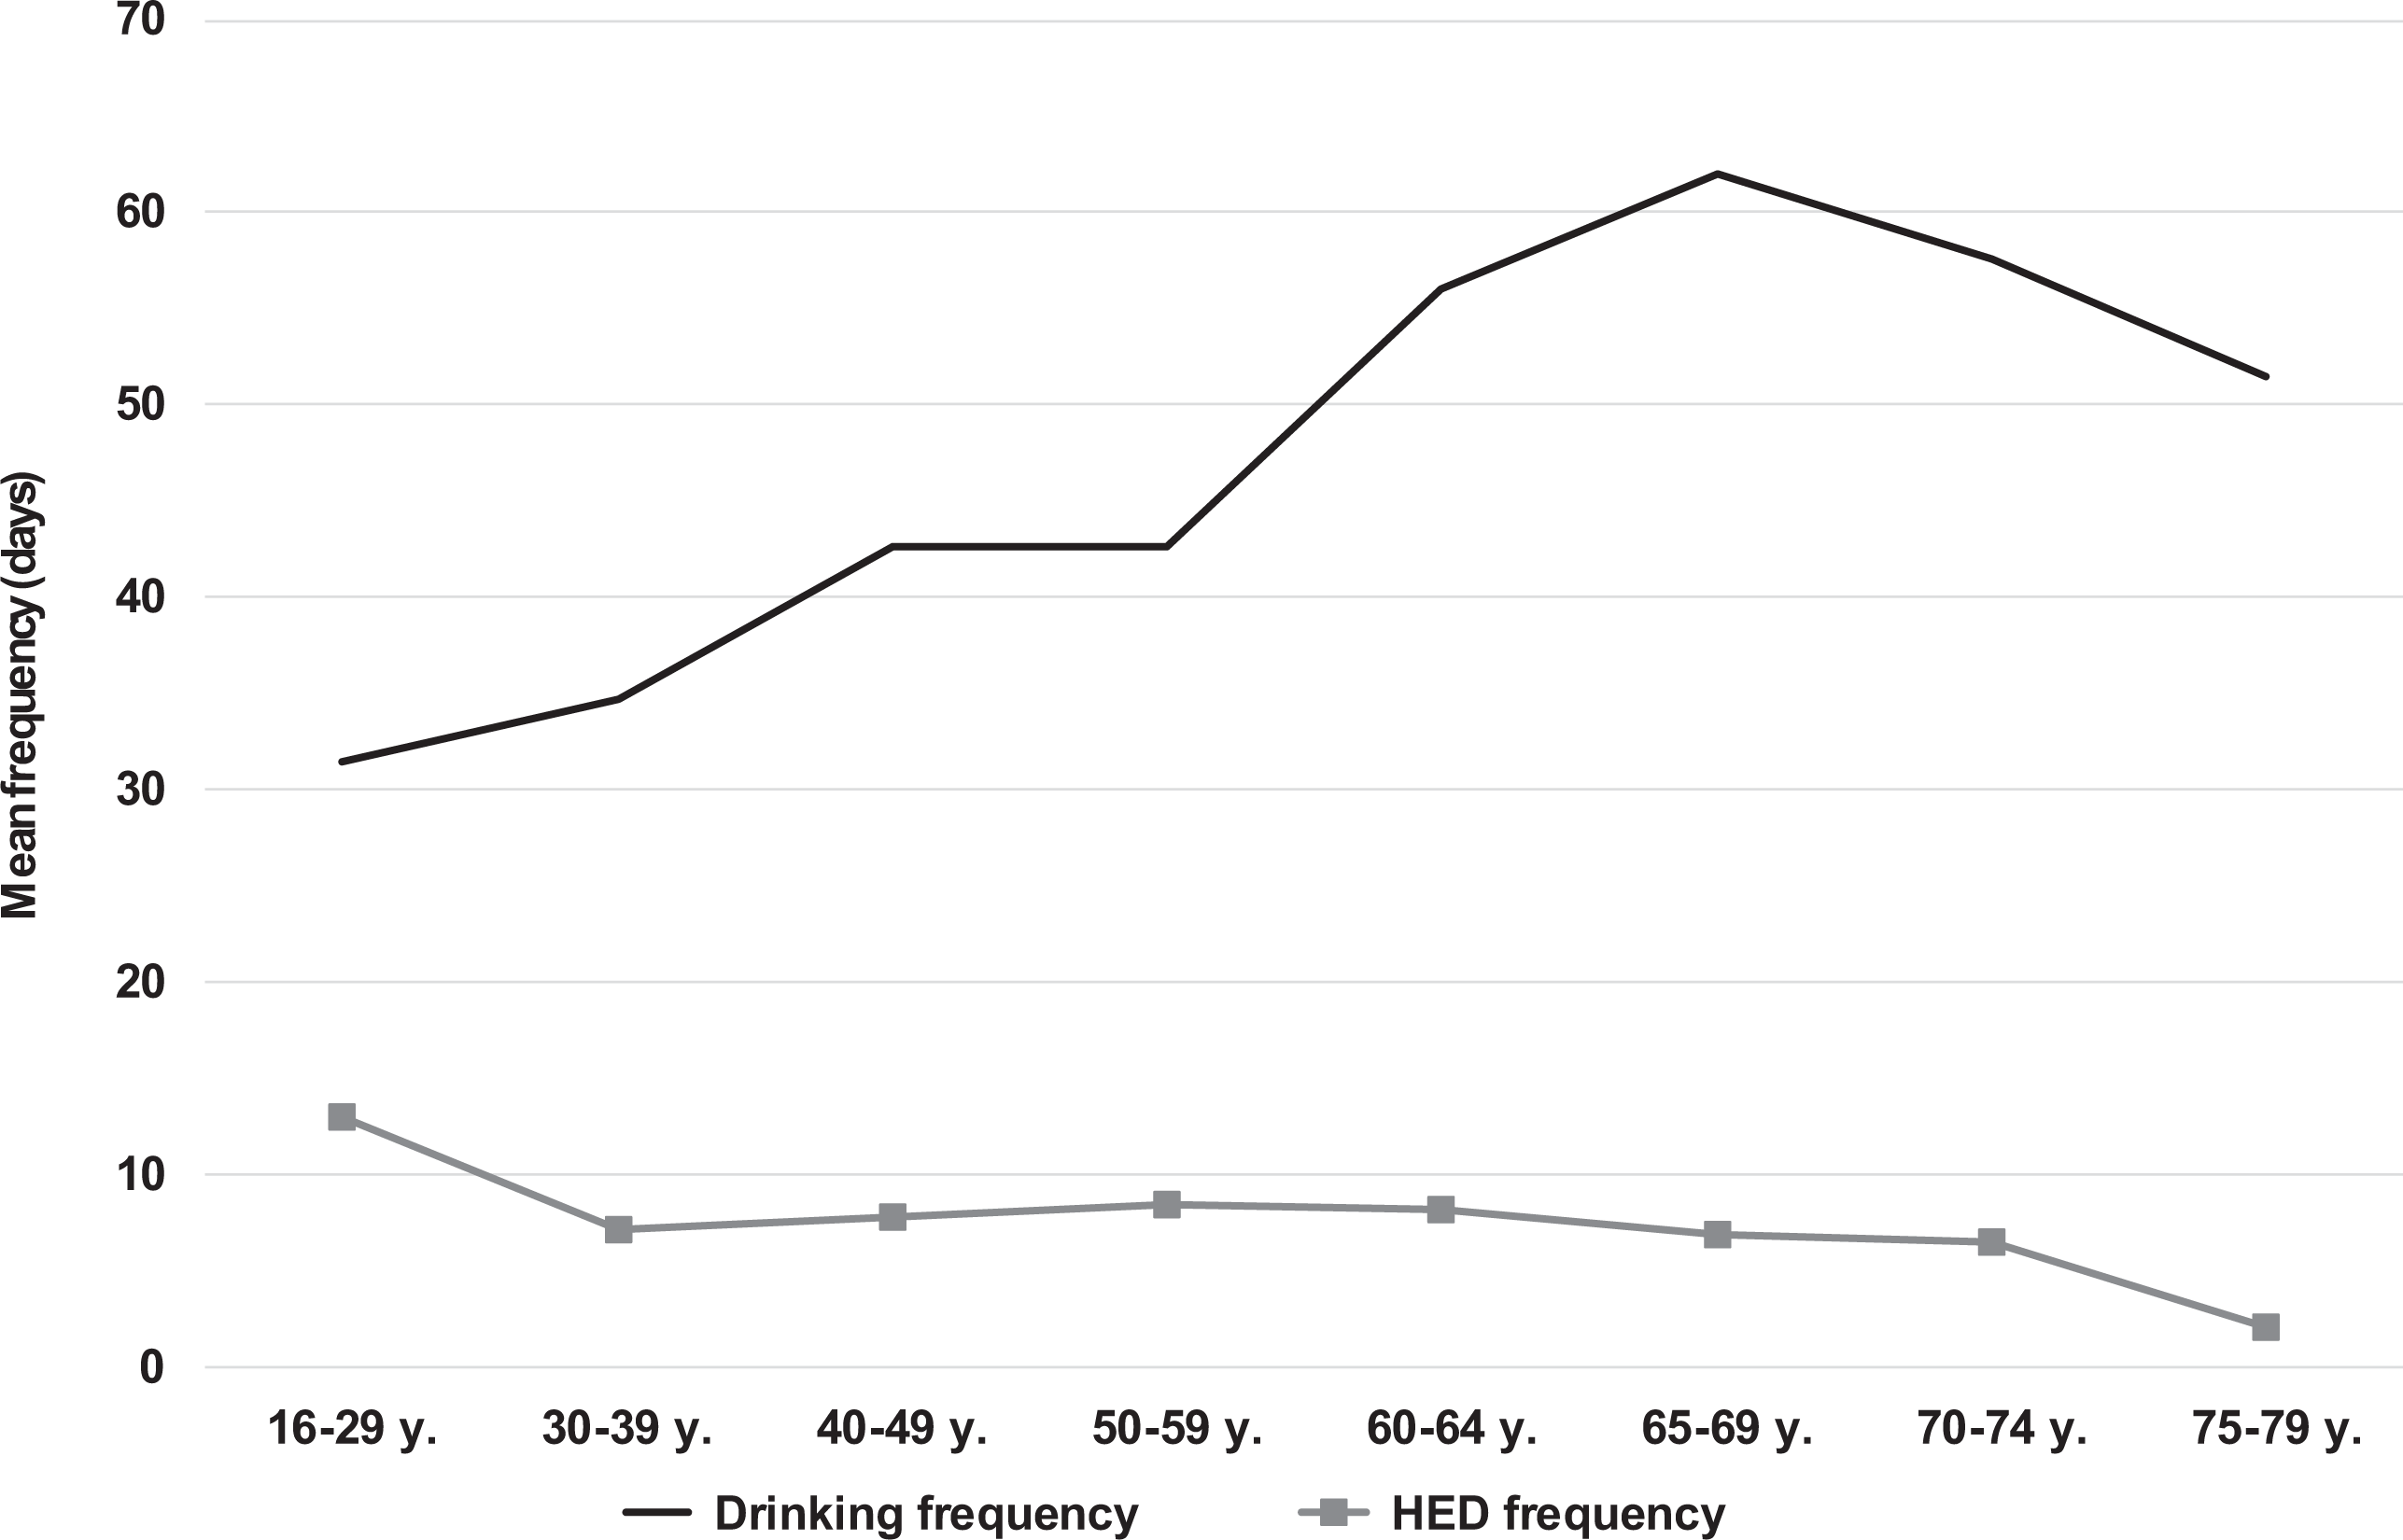
Mean frequency of drinking and mean frequency of heavy episodic drinking (HED) during the past year by age group, 2018/2019.
Discussion
The aim of the present study was to examine drinking habits among older men and women in Norway between 1985 and 2019. The results revealed several noteworthy trends in alcohol use among older adults in Norway during the past three decades. First, the overall proportion of current drinkers among older Norwegians increased substantially between 1985 and 2019, and the increase was particularly large among women aged 60 years and older. Today, the majority of older adults aged 60 years and older report drinking alcohol. Second, the proportion who reported drinking frequently increased in all age groups, both for women and men. However, the relative increase in frequent drinking was most marked between 1985 and 2012/2013, among women and those aged 60 years and above. Although there has been an overall increase in drinking frequency, the most recent figures show that frequent drinking is less prevalent than current drinking. Third, between 1985 and 2019, there has been an increase in any heavy episodic drinking among older age groups 60+ years. In the period 2012–2019, however, the proportion reporting frequent heavy episodic drinking has remained fairly stable. The most recent data show that the majority of older adults drink relatively few alcohol units (1 or 2) on typical drinking occasions, and that only a small share of older adults report frequent heavy episodic drinking.
The results in this study are in line with other studies addressing alcohol use among older people in Norway between 1973 and 2004 (Horverak & Bye, 2007), and between 1985 and 2008 (Bye & Østhus, 2012), which has shown that an increasing share of older adults have used alcohol and that they did so relatively frequently. This study showed that the increase among older adults continued until 2012/2013 and then levelled out. While Bye and Østhus (2012) found that the increase in the proportions of current drinkers and frequent drinkers were similar for women and men, this study showed that the increase in both measures was particularly marked for older women in all four age groups.
Moreover, Bye and Østhus (2012) also found that frequent heavy episodic drinking was rare among older adults, and particularly among women. They found that this tendency was stable in the study period (1985–2008). This corresponds with our findings, which revealed no increasing trend for frequent HED, only an increase for any HED in the period. Similarly, a more recent study showed that an increase in drinking frequency among older adults between 2002 and 2008 was not accompanied by any substantial increase in the frequency of drinking to intoxication (Brunborg & Østhus, 2015). This is in line with the findings in the present study, i.e., increased drinking frequency among older adults was not accompanied by a corresponding increase in risky drinking, operationalised as the typical number of alcohol units per occasion and frequent heavy episodic drinking.
Thus, the increasingly common alcohol consumption observed among older adults in Norway seems to be due mainly to an increase in the number of moderate alcohol consumers and/or an increase in situations involving moderate alcohol consumption. A noteworthy finding is that, for all measures of alcohol use applied in the current study, the increase was most marked among women, and especially women born shortly before and after World War II. Women who grew up in the post-war era had a higher standard of living and experienced a general liberalisation in attitudes towards drinking. This generation of women also were more represented in workplaces than their mothers and grandmothers and thus had greater purchasing power and more access to alcohol, which also became more available (Horverak & Bye, 2007). Moreover, today’s elderly are healthier and live longer than the generations before them, in addition they have better economy, more leisure time and they seem to bring their established new habits regarding alcohol consumption into later life. Due to the liberalisation in attitudes towards alcohol use over the past decades (Nordlund, 2008), it may also be that adults in Norway who previously were abstainers began drinking in older age. This was not possible to examine with the current data. Thus, to further explain the changes in older adults’ alcohol use, this issue could be addressed in future studies.
This study suggests that both the age and gender gaps traditionally found for alcohol use in Norway are closing. However, a larger proportion of men than women continue to report heavy drinking episodes in general. The present study did not include a measure of average quantity (volume). However, studies from Norway consistently show that men in all age groups drink more often and greater quantities than women, with the exception of wine, which is the preferred drink among the older generations (e.g., Bye & Rossow, 2019). The rapidly changing demographics of Norway with a growing proportion of elderly, and the increasing number of older adults who drink alcohol, may entail a potentially large-scale public health challenge in the years to come. For example, older adults often have a decreased tolerance for alcohol, and often suffer from conditions that worsen when drinking alcohol, such as impaired balance and confusion (Hartikainen et al., 2007; Woolcott et al., 2009). Consequently, we may expect that alcohol use, and in particular acute effects of heavy episodic drinking, will increase the risk of unintentional injuries such as falls. Studies show that the incidence of accidental falls increases with increasing age: each year around a third of those aged 65 and above, and about half of those aged 85 and above have at least one accidental fall (Pfortmueller et al., 2014). In addition, there are clear indications that simultaneous drug and alcohol use in older adults constitutes a particular risk factor for accidental injuries (Ilomäki et al., 2013). Older women have a higher life expectancy than men, and will continue to constitute a larger proportion of older adults. However, even though older women are at particular risk of experiencing adverse effects of alcohol use, e.g., due to their lower ability to metabolise alcohol compared to men (Blow & Barry, 2002; Epstein et al., 2007; Wilson et al., 2014), older men still drink larger quantities and more often than older women and are thus still at greater risk of harming themselves and others.
Methodological considerations
The strength of this study is that it is based on national representative surveys and that it contains comparable measures of alcohol use over a period of more than three decades. However, some methodological considerations warrant attention. First, the prevalence of alcohol use is probably underestimated because heavy drinkers are typically underrepresented in surveys, and because alcohol use is underreported by survey respondents in general (Johnson, 2014). In addition, the degree of underestimation might have changed over time. For example, it has been shown that societal tolerance of alcohol use in Norway has increased in accordance with an increase in alcohol consumption (Nordlund, 2008), thus implying that the tendency to underreport might have been larger earlier, e.g., in 1985 than later, as in 2019. Hence, the changes in actual alcohol use among older adults in fact might be less pronounced than what was found in the current study. However, whether or not this is the case is impossible to determine using the current data. Underreporting of alcohol use may also vary between age groups. To our knowledge, no Norwegian study has examined whether underreporting varies by age. However, an Australian study showed that underestimation of alcohol use has varied between 15–49%, but underreporting did not vary systematically between younger and older age groups. Underreporting was more marked for young men and middle-aged women and less marked for young women and older women (Livingston & Callinan, 2015). Thus, it is difficult to determine how potential age differences in underreporting may have affected the results of the current study. Second, the methods used for data collection on the questions related to alcohol use varied between postal questionnaires completed by means of self-administration and telephone interviews. In general, survey modes that rely on respondents’ self-administration are found to report larger amounts of alcohol use than those modes that require interviewers to directly ask about alcohol use. However, these mode effects are greater for the more sensitive illicit substances, such as cocaine, as compared to alcohol use (Johnson, 2014).
Conclusions
This study shows that during the past three decades, there has been a marked increase in the proportion of older adults in Norway who drink alcohol and who drink relatively often. The increasing trend was most pronounced in the period between 1985 and 2012/2013, and for women. Especially women born around World War II seem to bring established drinking habits into old age. Our study has shown that even though the majority of older adults are current drinkers, relatively few are drinking frequently and most older adults drink small amounts of alcohol on typical drinking occasions. Thus, the findings from this study clearly illustrate that the observed increase in drinking frequency among older adults in Norway is not accompanied by a corresponding increase in risky drinking patterns such as heavy episodic drinking. Nevertheless, considering that the share of older adults will increase in the years to come, and the fact that older adults, and particularly women, are more vulnerable to the adverse effects of alcohol than younger individuals, further research on older adults’ alcohol use is needed. Thus, it is important to continue monitoring the trends in older adults’ alcohol use, including those aged 80 years and older, as well as the possible effects of these changes on their health and their risk of being injured or involved in accidents. More knowledge about volume of alcohol consumed and drinking context among the elderly is also warranted.
Footnotes
Availability of data
The data used for the current study are available from the corresponding author on reasonable request.
Acknowledgements
The authors are grateful for valuable comments by Christopher Tigerstedt and Kim Bloomfield on a previous version of this article.
Declaration of conflicting interests
The authors declared no potential conflicts of interest with respect to the research, authorship, and/or publication of this article.
Funding
The authors disclosed receipt of the following financial support for the research, authorship, and/or publication of this article: This study was funded by the Norwegian Institute of Public Health. Some of the data used here are from “The Health Survey 1985 and 1995” and “The Living Conditions Survey 2005, theme Health”. Data are collected by Statistics Norway (SSB). Data have been prepared and made available in anonymous form by NSD-Norwegian Center for Research Data AS. Neither SSB nor NSD is responsible for the analysis of the data or the interpretations made here.