
Abstract
Aims:
The principle aim of this study was to investigate changes in alcohol consumption among adolescents in Stockholm from 2010 to 2016. A further aim was to investigate whether there are divergent or similar trends in alcohol consumption among elementary schools in Stockholm from 2010 to 2016 and, if there are diverging trends, to examine how the differences might be explained.
Methods:
Data were analysed using multilevel mixed effects linear regression, in which individual students represented one level and schools the second level.
Data:
Student-level data were derived from the Stockholm School Survey for the years 2010, 2012, 2014 and 2016 (n = 15481). School-level data (n = 132) were derived from registries of the Swedish National Agency for Education.
Results:
The results showed that there was an almost 45% decline in total alcohol consumption among ninth-grade students in Stockholm between 2010 and 2016. The decline was similar among all analysed consumption groups. Two factors were found to statistically explain some of the general decline: more restrictive parental attitudes towards alcohol and, more importantly, decreasing alcohol consumption among the students’ peers. The downward trends among schools between 2010 and 2016 were universal but not identical, but when parental attitudes towards alcohol and peers’ alcohol behaviour were controlled for, the diverging school trends in alcohol consumption were considerably more equal.
Conclusions:
School constitutes a social context for the student of which both parents and peers are important parts, and the diverging changes may be due to the norms and behaviours, influenced by parents and peers, characterising these schools.
Since 2004, overall alcohol consumption among adolescents has declined in Sweden (Nilsson, Leifman, & Andreasson, 2015; Norstrom & Svensson, 2014; Raninen, Livingston, & Leifman, 2014). According to the theory of the collectivity of drinking cultures, any change in the population average of alcohol consumption will result in a corresponding change at all levels of consumption, from very moderate drinking to the heaviest drinking (Skog, 1985). This has indeed been shown to be the case. Raninen et al. (2014) demonstrated a decline in Swedish adolescent alcohol consumption between 2004 and 2013 in all consumption deciles, and a similar pattern was also found in the Swedish adult population between 2004 and 2011, although there was no decline in consumption found among those older than 50 years (Raninen, Leifman, & Ramstedt, 2013). In Stockholm, however, there seems to have been a polarisation in adolescent alcohol consumption between 2000 and 2010 (Hallgren, Leifman, & Andreasson, 2012) and from 2000 to 2014 (Zeebari, Lundin, Dickman, & Hallgren, 2017), when consumption appears to have increased or remained stable among the heaviest drinkers but decreased among other consumption groups. Whether these differences in trends between Stockholm adolescents and adolescents in Sweden in general can be explained by the different approaches used for the statistical analyses or by something else, e.g., the greater alcohol availability in Stockholm or the greater frequency of binge drinking among Stockholm adolescents (Hallgren, 2014), remains unclear. Regardless, more research on the social circumstances and risk factors is needed so that effective, more targeted prevention strategies can be developed.
The decline in adolescent drinking is far from a Swedish phenomenon and has been confirmed in more than 30 high-income countries (Pennay et al., 2018) and in Europe and North America (de Looze et al., 2015), but how this global trend should be understood is still under investigation. Several hypotheses have been proposed, such as successful health interventions in communities and schools, more restrictive parental attitudes towards alcohol drinking and young people’s internet habits, which may increasingly lead them to stay at home and thus under the social control of their parents (Larm, Livingston, Svensson, Leifman, & Raninen, 2018; Pennay et al., 2018; Pennay, Livingston, & MacLean, 2015). Additionally, demographic changes have been suggested (Pennay et al., 2018), although this hypothesis has not received any support in Sweden (Svensson & Andersson, 2016).
School is an obvious social setting for almost all adolescents in a modern welfare state, and during adolescence school takes on more importance at the expense of the family (West, 1997). Many studies have shown that school and peer socialisation are significant in terms of adolescents’ alcohol consumption (Carlson & Almquist, 2016; Ferguson & Meehan, 2011; Kuntsche & Jordan, 2006; Leung, Toumbourou, & Hemphill, 2014; Olsson & Fritzell, 2015; Salvy, Pedersen, Miles, Tucker, & D’Amico, 2014; Trucco, Colder, & Wieczorek, 2011) and that parental behaviour may not be sufficient to prevent the influence of peers (Trucco et al., 2011). The influence of friends has been proposed to operate in two ways: either through how adolescents perceive other adolescents’ norms concerning alcohol or through the actual alcohol behaviour of their peers (Salvy et al., 2014).
In addition to being an important social setting for children, school is also related to segregation, inequality and social class. Bohlmark, Holmlund, and Lindahl (2016) showed that since the introduction of the school choice reform in Sweden in the early 1990s, school segregation has increased. Three main factors were identified: neighbourhood segregation, parental choice and the location of independent schools. Thus, the school a student attends relates both to socioeconomic status and to ethnic background. Olsson and Fritzell (2015) concluded that school differences in alcohol consumption were largely driven by the lower rates of alcohol consumption in socioeconomically disadvantaged schools. Carlson and Almquist (2016) found that, at the school level, the socioeconomic characteristics of the city district, along with the proportions of well-educated parents and high-performing students at the school, accounted for part of the variation in alcohol use but not binge drinking. Although it remains somewhat unclear exactly how the school context relates to adolescent alcohol behaviour, it seems reasonable to conclude that alcohol preventive actions should address not only the individual level but also the broader school context (Olsson & Fritzell, 2015).
As mentioned above, parents are highly influential with regard to their children’s school choice and, consequently, school segregation, and parents can also play an important role in their offspring’s alcohol habits. Although parental influence on adolescent alcohol drinking has been thoroughly investigated (Carlson, 2018; Donovan, 2004; Larm et al., 2018; Ryan, Jorm, & Lubman, 2010; Van Der Vorst, Burk, & Engels, 2010), few studies have empirically tested the hypothesis that parental monitoring or more restrictive parental attitudes may explain the decline in adolescent alcohol consumption. However, Larm et al. (2018) showed that parental monitoring and attitudes towards offspring’s drinking in Sweden were strongly associated with whether children drank but could not explain the decline in drinking over time. This study will investigate whether parents’ and peers’ alcohol behaviours are related to school changes in alcohol consumption and whether school attributes, such as the proportion of parents who were not born in Sweden or the proportion of parents with a tertiary education, might provide an explanation.
Aims
The principle aim of this study was to investigate changes in alcohol consumption among adolescents in Stockholm from 2010 to 2016. A further aim was to investigate whether there are divergent or similar trends in mean alcohol consumption among elementary schools in Stockholm from 2010 to 2016 and, if there are diverging trends in school means, to examine how the differences might be explained.
Methods
The present study included both school-level and student-level data. The student-level data were derived from the Stockholm School Survey for the years 2010, 2012, 2014 and 2016. This survey was conducted among ninth and 11th graders attending schools located in the municipality of Stockholm, Sweden (n = 51782). While all public schools in Stockholm municipality were urged to participate, private schools participated voluntarily. Since data from the Stockholm School Surveys are anonymous an ethical review was not found to be necessary according to the Central Ethical Review Board in Sweden. The response rates for the four surveys were 75–78%. The present study was restricted to ninth-grade students living in Stockholm municipality (n = 19,558) who responded to all the analysed questions (n = 15,481). This gives a 23% difference between the full sample and the analysed sample. The reason for excluding the 11th-grade students was to focus on elementary schools and elementary students exclusively, since elementary and secondary schools differ in many respects.
Complete school-level data (n = 132) were derived from registries of the Swedish National Agency for Education which is the central administrative authority for the Swedish public school system. A total of 63 schools (47.7%) were represented for all four survey years, 19 schools (14.4%) for three years, 18 schools (13.6%) for two survey years, and 32 schools (24.2%) for only one survey year.
Data were analysed using multilevel mixed effects linear regression, in which individual students represented one level and schools the second level. The logic of a model including both random intercepts and random slopes can be described as follows:
By using the formulas
Since not all of the schools are represented at all times, there is a risk that this may bias the estimated effects, both in terms of the general development in alcohol consumption over time and the possible differences between schools. However, this possible bias was tested by introducing the number of times each school participated into the regression models. There was no effect from the variable, and other estimates were more or less unaffected. The analysed variables are address below.
Student-level variables
Yearly total alcohol consumption (litres of 100% alcohol)
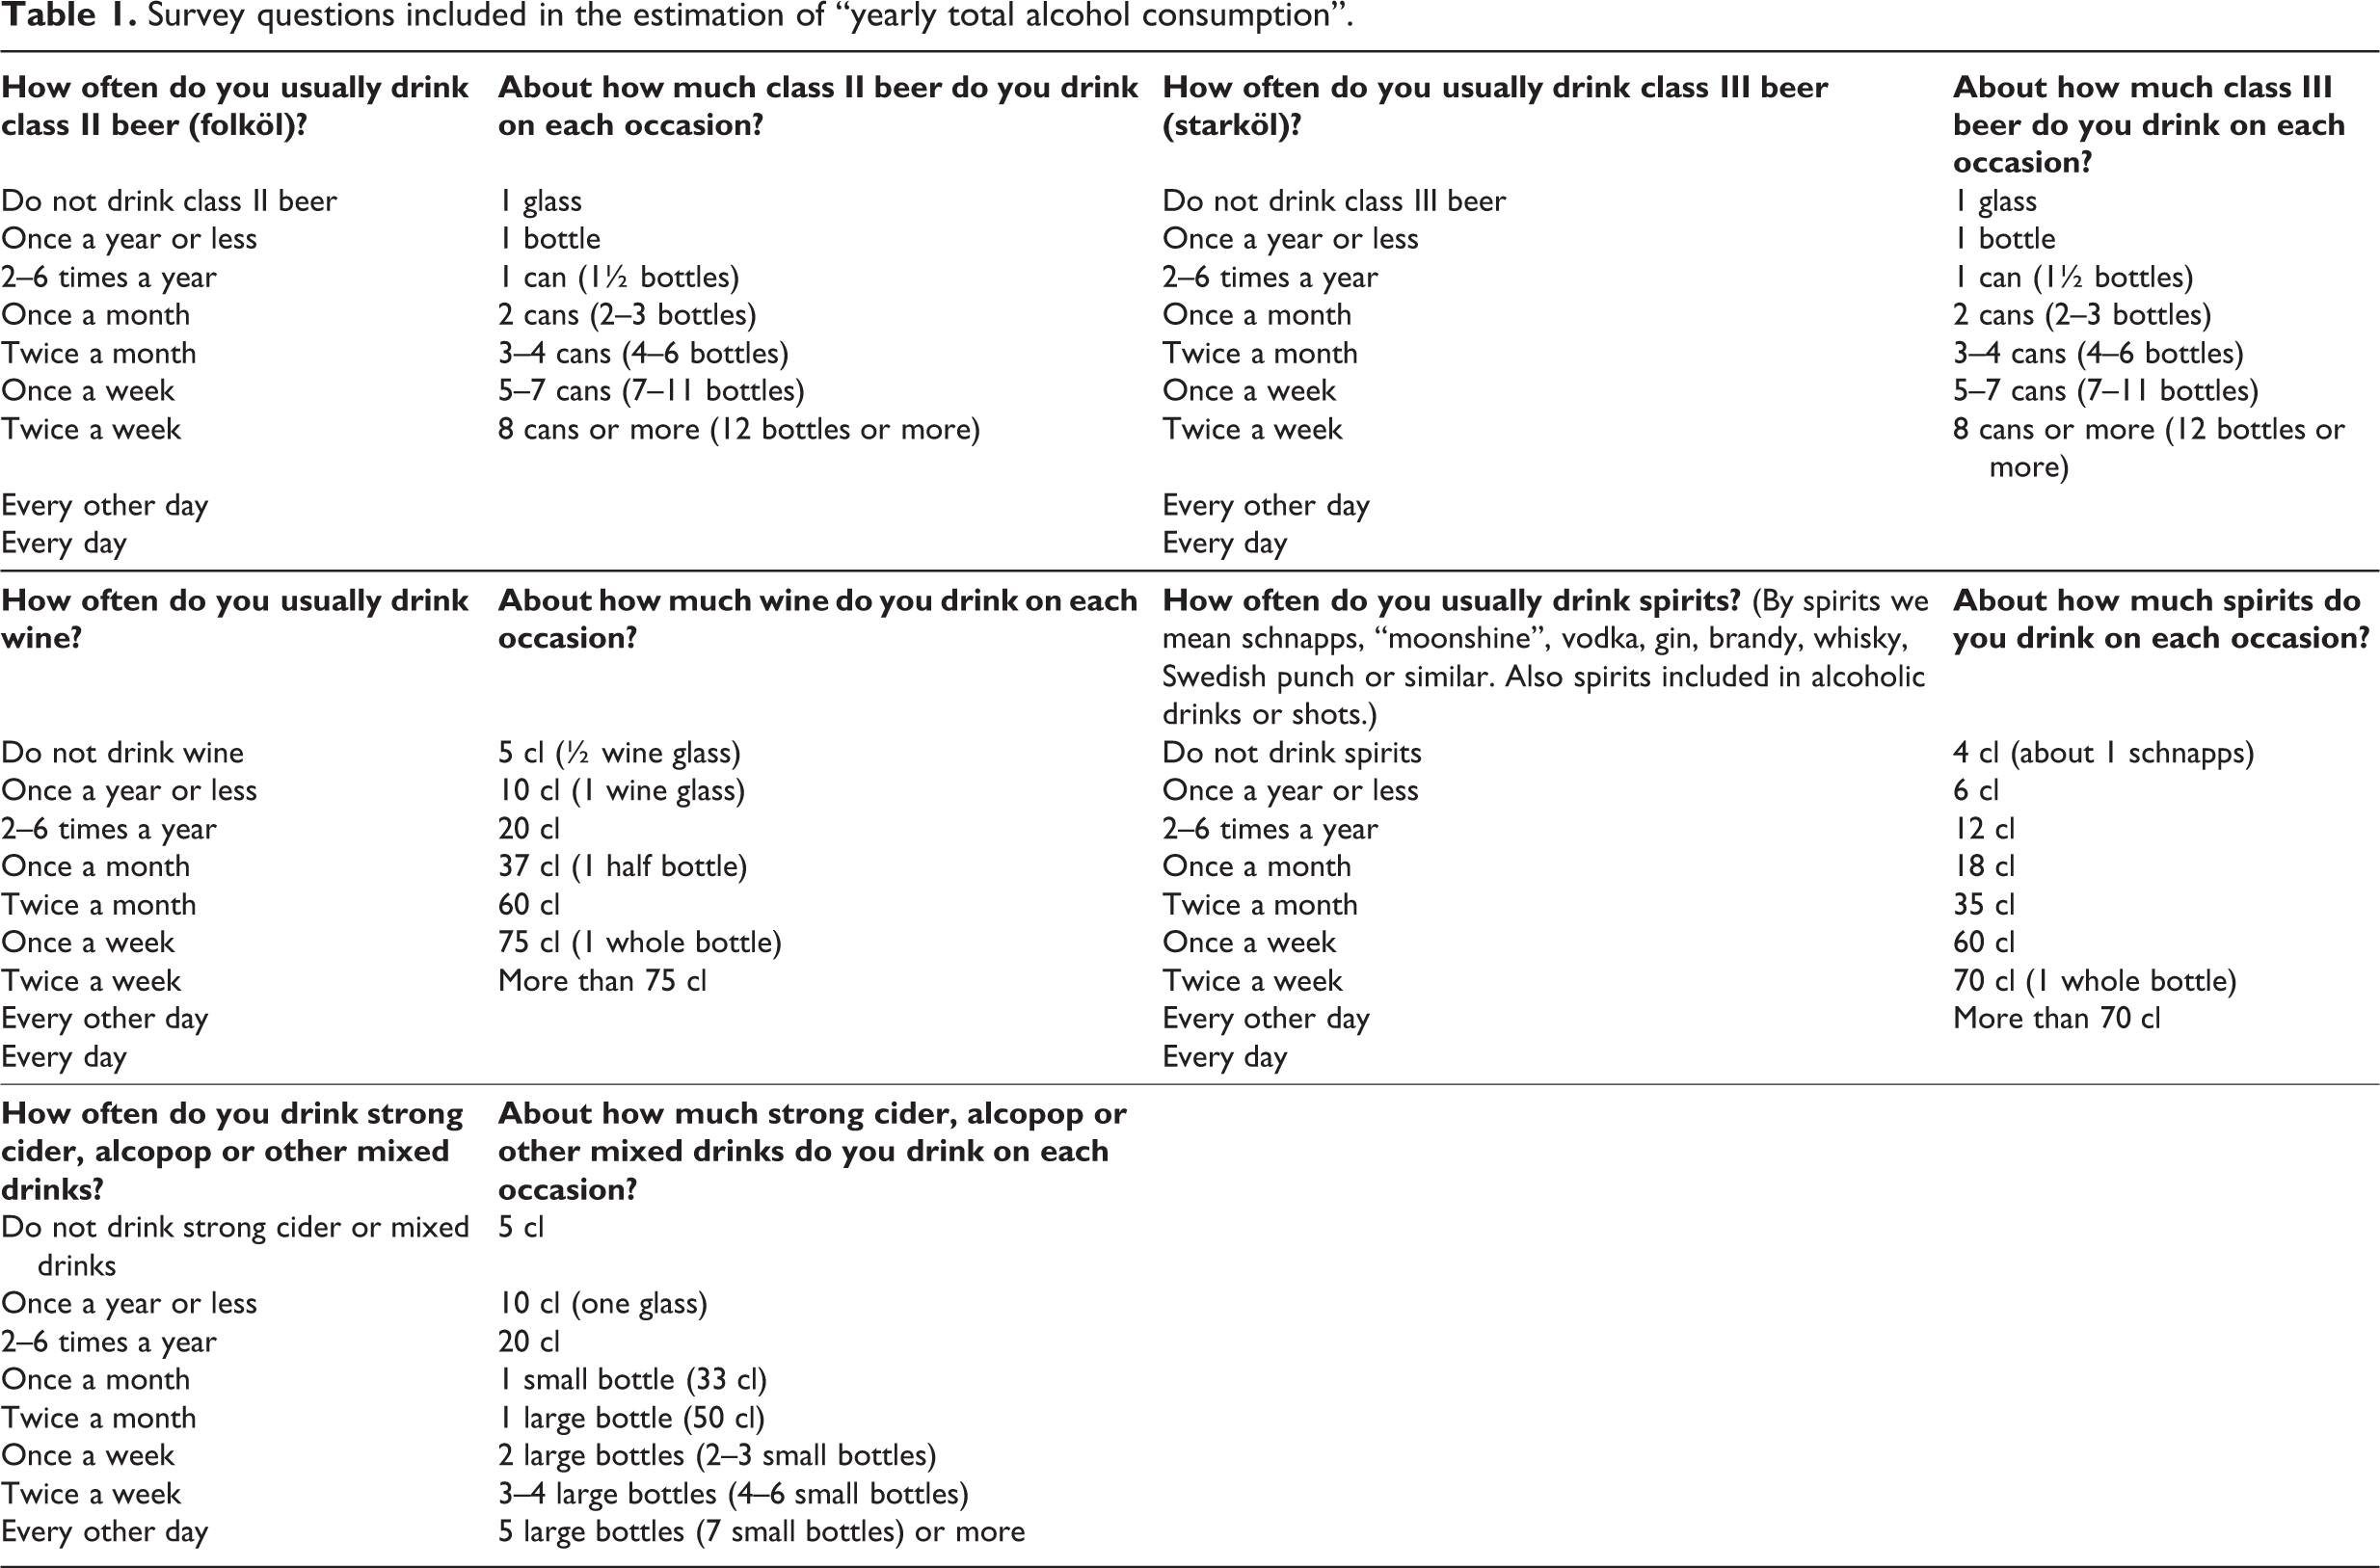
The questionnaire included several questions about alcohol consumption, e.g., type of alcohol, how often it is usually consumed during a year and how much is consumed on each occasion (Table 1). The total alcohol consumption was estimated by multiplying the frequency and volume for each type of alcohol and then weighted by the typical proportion alcohol for each type (Beer class II 3.5%, Beer class III 5.5%, Wine 10%, Spirits 40%, Strong cider or alcopop 4.7%). Thereafter all type-specific estimates were summarised. Since the dependent variable, i.e., the student’s yearly total alcohol consumption measured in litres of 100% alcohol, was highly skewed, it was transformed by first adding 1 to each student’s estimated total consumption and then logarithmised.
Year (2010 [0], 2012 [1], 2014 [2], 2016 [3])
Sex: “Are you a boy or a girl?” (Male [1], Female [2], No answer [3])
Age: “How old are you?” (≤ 15, 16)
Years in Sweden: “How long have you lived in Sweden?” (Entire life [1], ≥ 10 years [2], 5–9 years [3], < 5 years [4])
Parents’ education: “What is the highest education your parents have?”
Old elementary school (folkskola) or compulsory school (max 9 years schooling)Upper secondary schoolUniversity and university collegeDon’t know (Not tertiary/DK [1], Tertiary (at least one parent) [2])
Survey questions included in the estimation of “yearly total alcohol consumption”.
Approximately 25% of the students in the analysed sample did not know (or did not answer) the questions about their parents’ education. In this study these students were placed in the same category as those who did not have any parent with a tertiary education. Since this approach can be questioned, alternative statistical analyses including multiple imputations were tested. Since there were almost no differences between the original models and the alternative multiple imputation-models, it was decided to keep the original more simple models.
Cash margin: “About how much money do you have for your leisure activities and entertainment every month?” (0–249 SEK [125], 250–499 SEK [375], 500–749 SEK [625], 750–999 SEK [875], 1000–1249 SEK [1125], 1250–1499 SEK [1375], and ≤ 1500 SEK [1625]) [midpoint of class]
Parents offer alcohol: “Are you ever offered alcohol by your parents/guardians?” (They do not drink [1], No, they never offer me alcohol [2], Yes, they give me a taste from their glass [3], Yes, an occasional glass [4], Yes, they often give me alcohol [5])
Friends get drunk: “How many friends of yours (in and out of school) get drunk on alcohol?” (None [1], A few [2], About half [3], Most [4])
School-level variables
School percentage of parents not born in Sweden
School percentage of parents with a tertiary education
Results
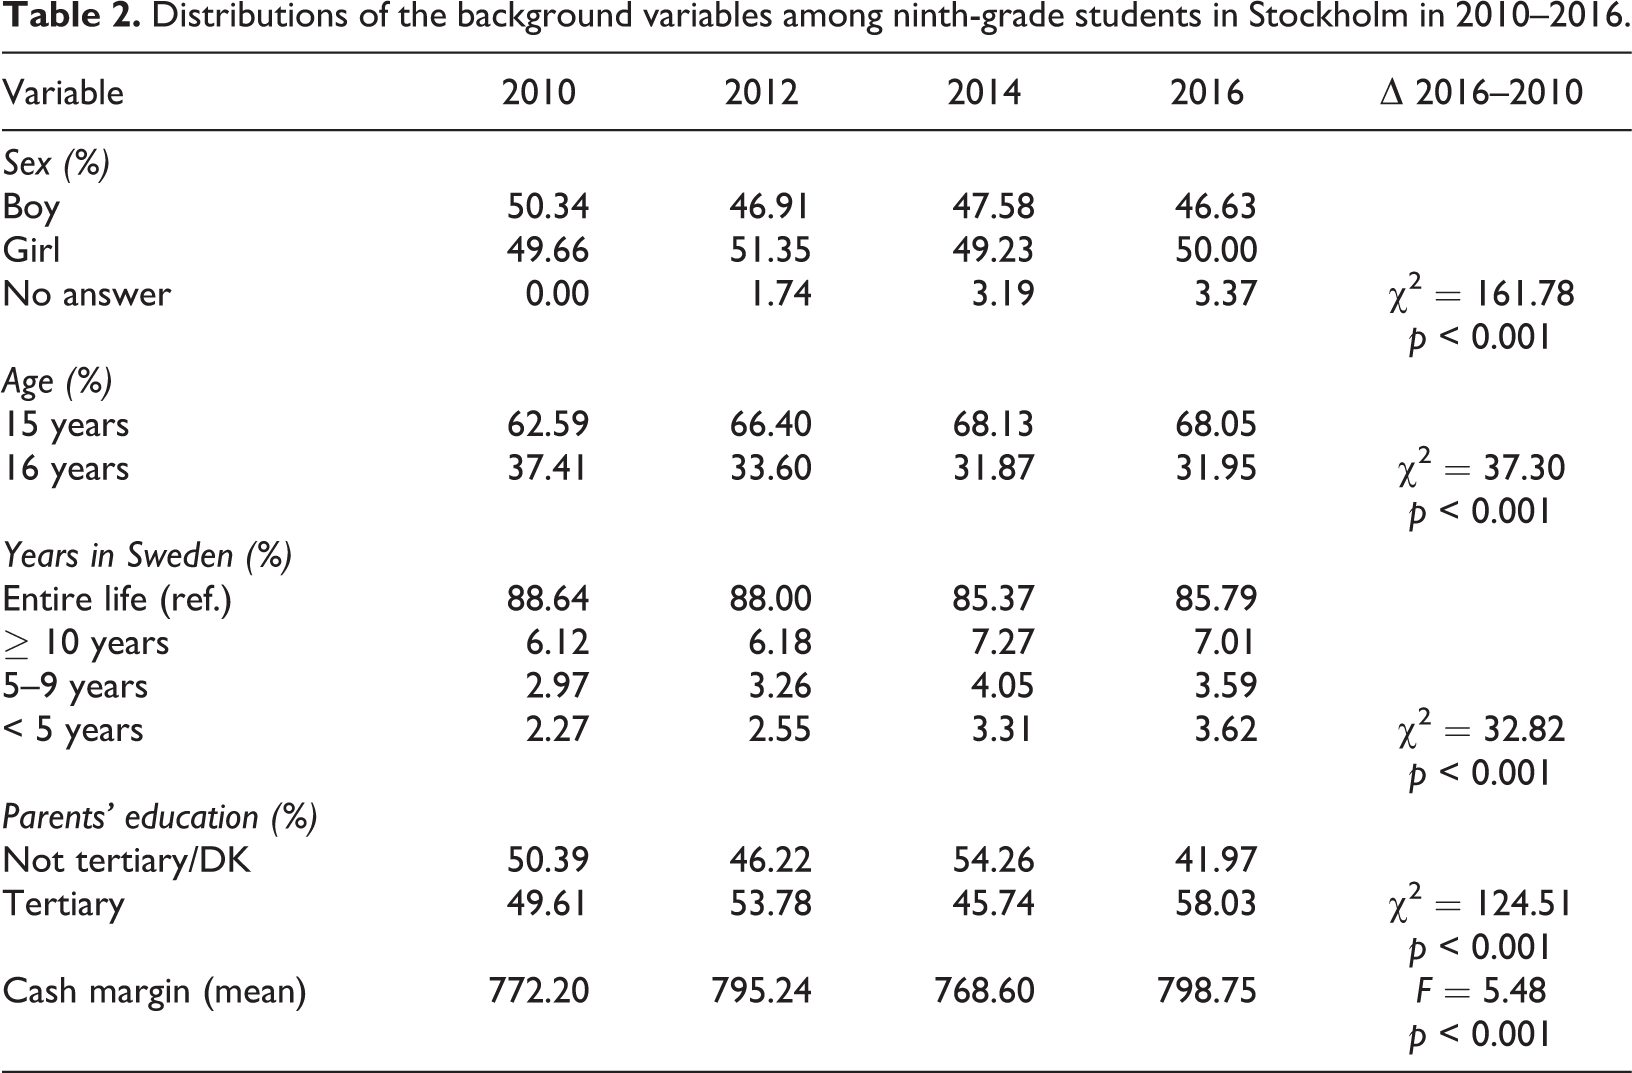
The distributions of the background variables are presented in Table 2. The distributions of the analysed variables are presented in Table 3. The mean total alcohol consumption among adolescents aged 15–16 years in Stockholm steadily declined from 2.79 litres in 2010 to 1.55 litres in 2016, which is a 44.44% reduction. When alcohol consumption is divided into percentiles, it becomes evident that the overall decline is also visible among almost all consumption groups, although consumption seems to have decreased more among groups with lower consumption, the 25th percentile excluded. In addition, the proportion of abstainers has increased during the period: from 35.87% in 2010 to 57.71% in 2016. When looking at parents’ attitudes towards drinking, we can identify a small increase in youths reporting that their parents do not drink at all, from 14.2% in 2010 to 16.9% in 2016, and among those parents who actually use alcohol, we see that they gradually adopted more restrictive attitudes towards offering their children alcohol. For example, the percentage of students reporting that their parents never offer them alcohol increased from 47.9% in 2010 to 58.5% in 2016, and the percentage of students reporting that none of their friends get drunk increased from 18.3% in 2010 to 31.9% in 2016.
Distributions of the background variables among ninth-grade students in Stockholm in 2010–2016.
Distributions of the main variables among ninth-grade students in Stockholm in 2010–2016.
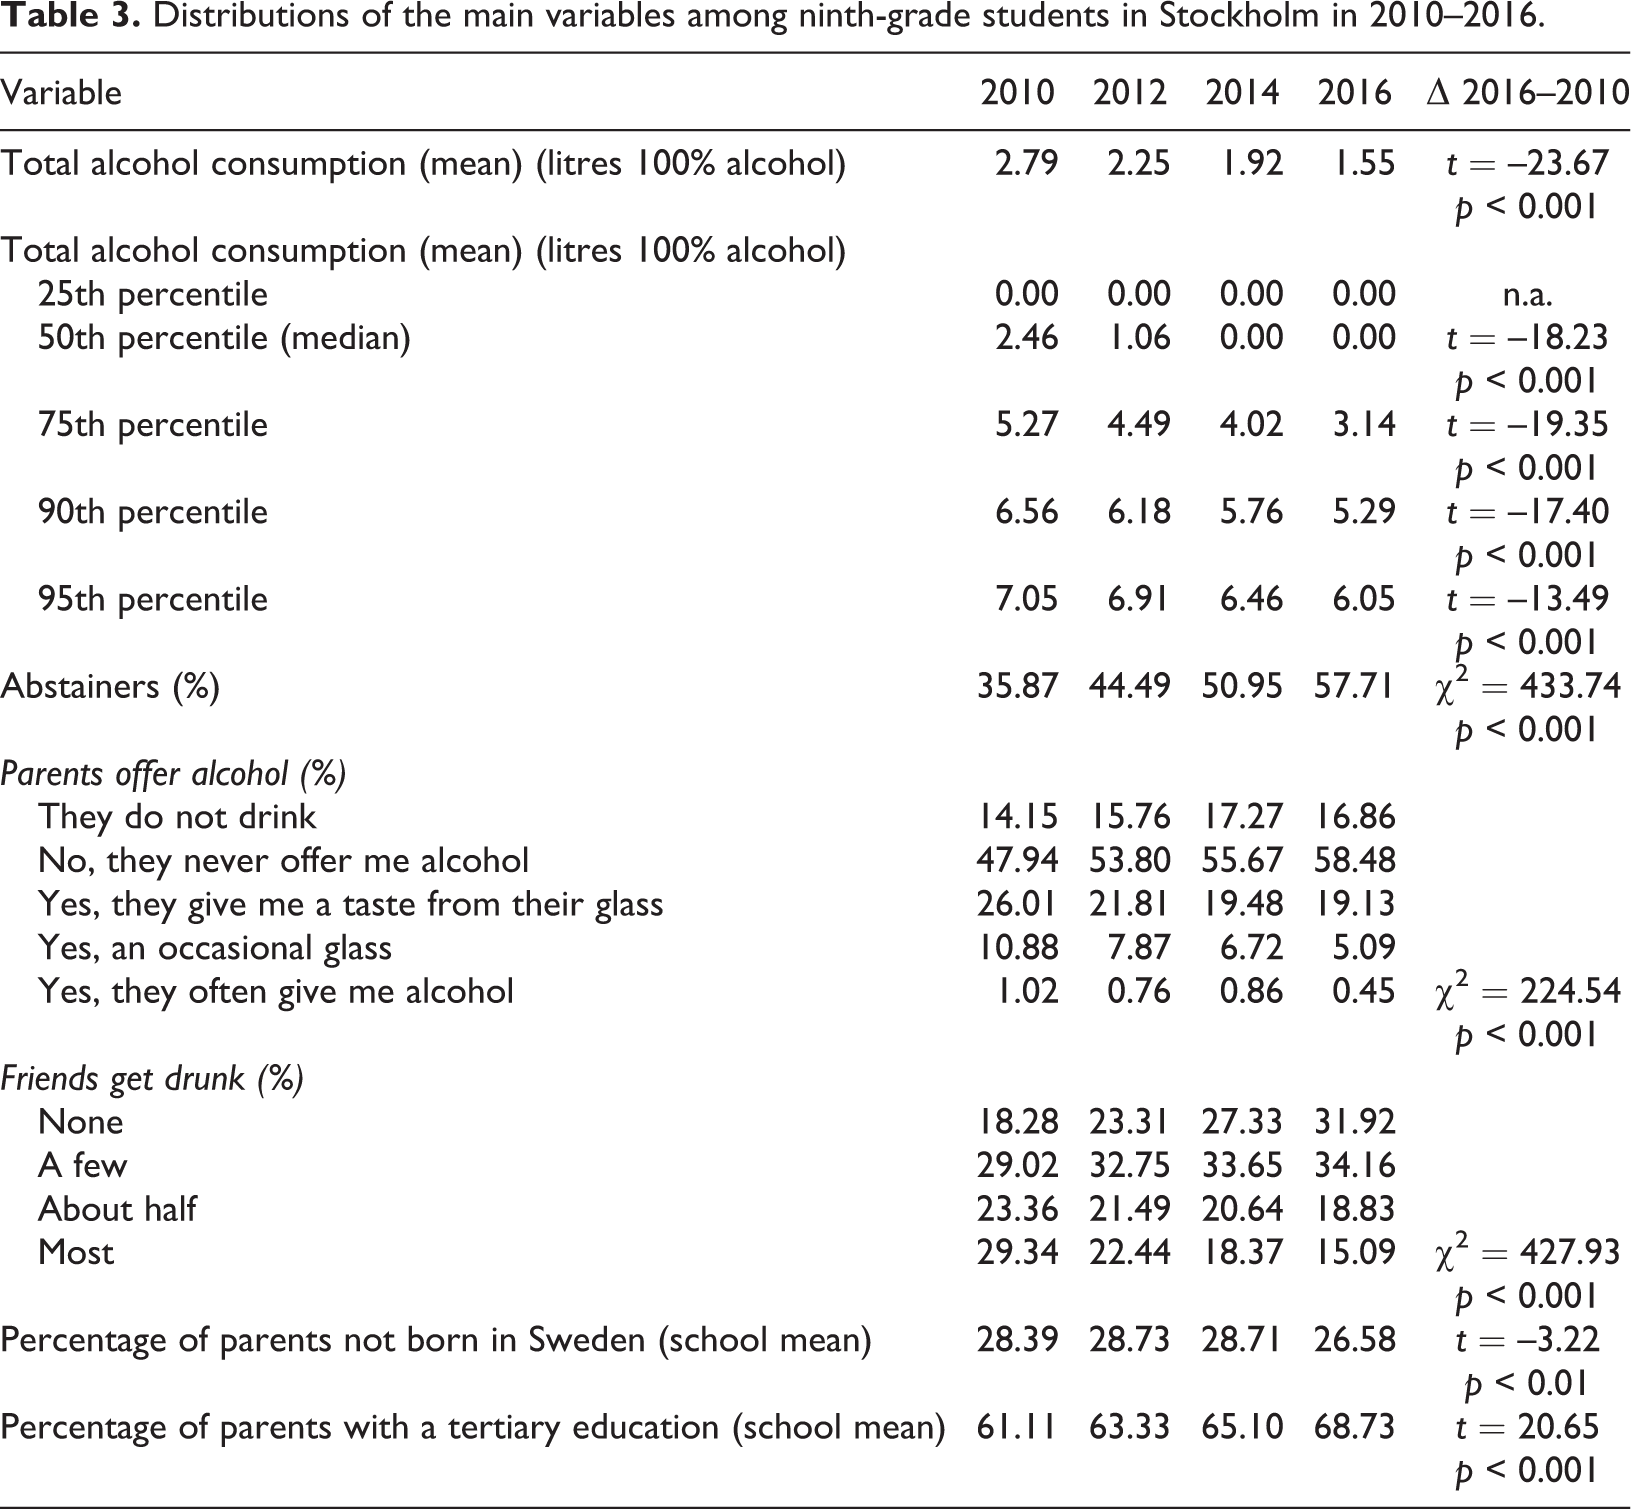
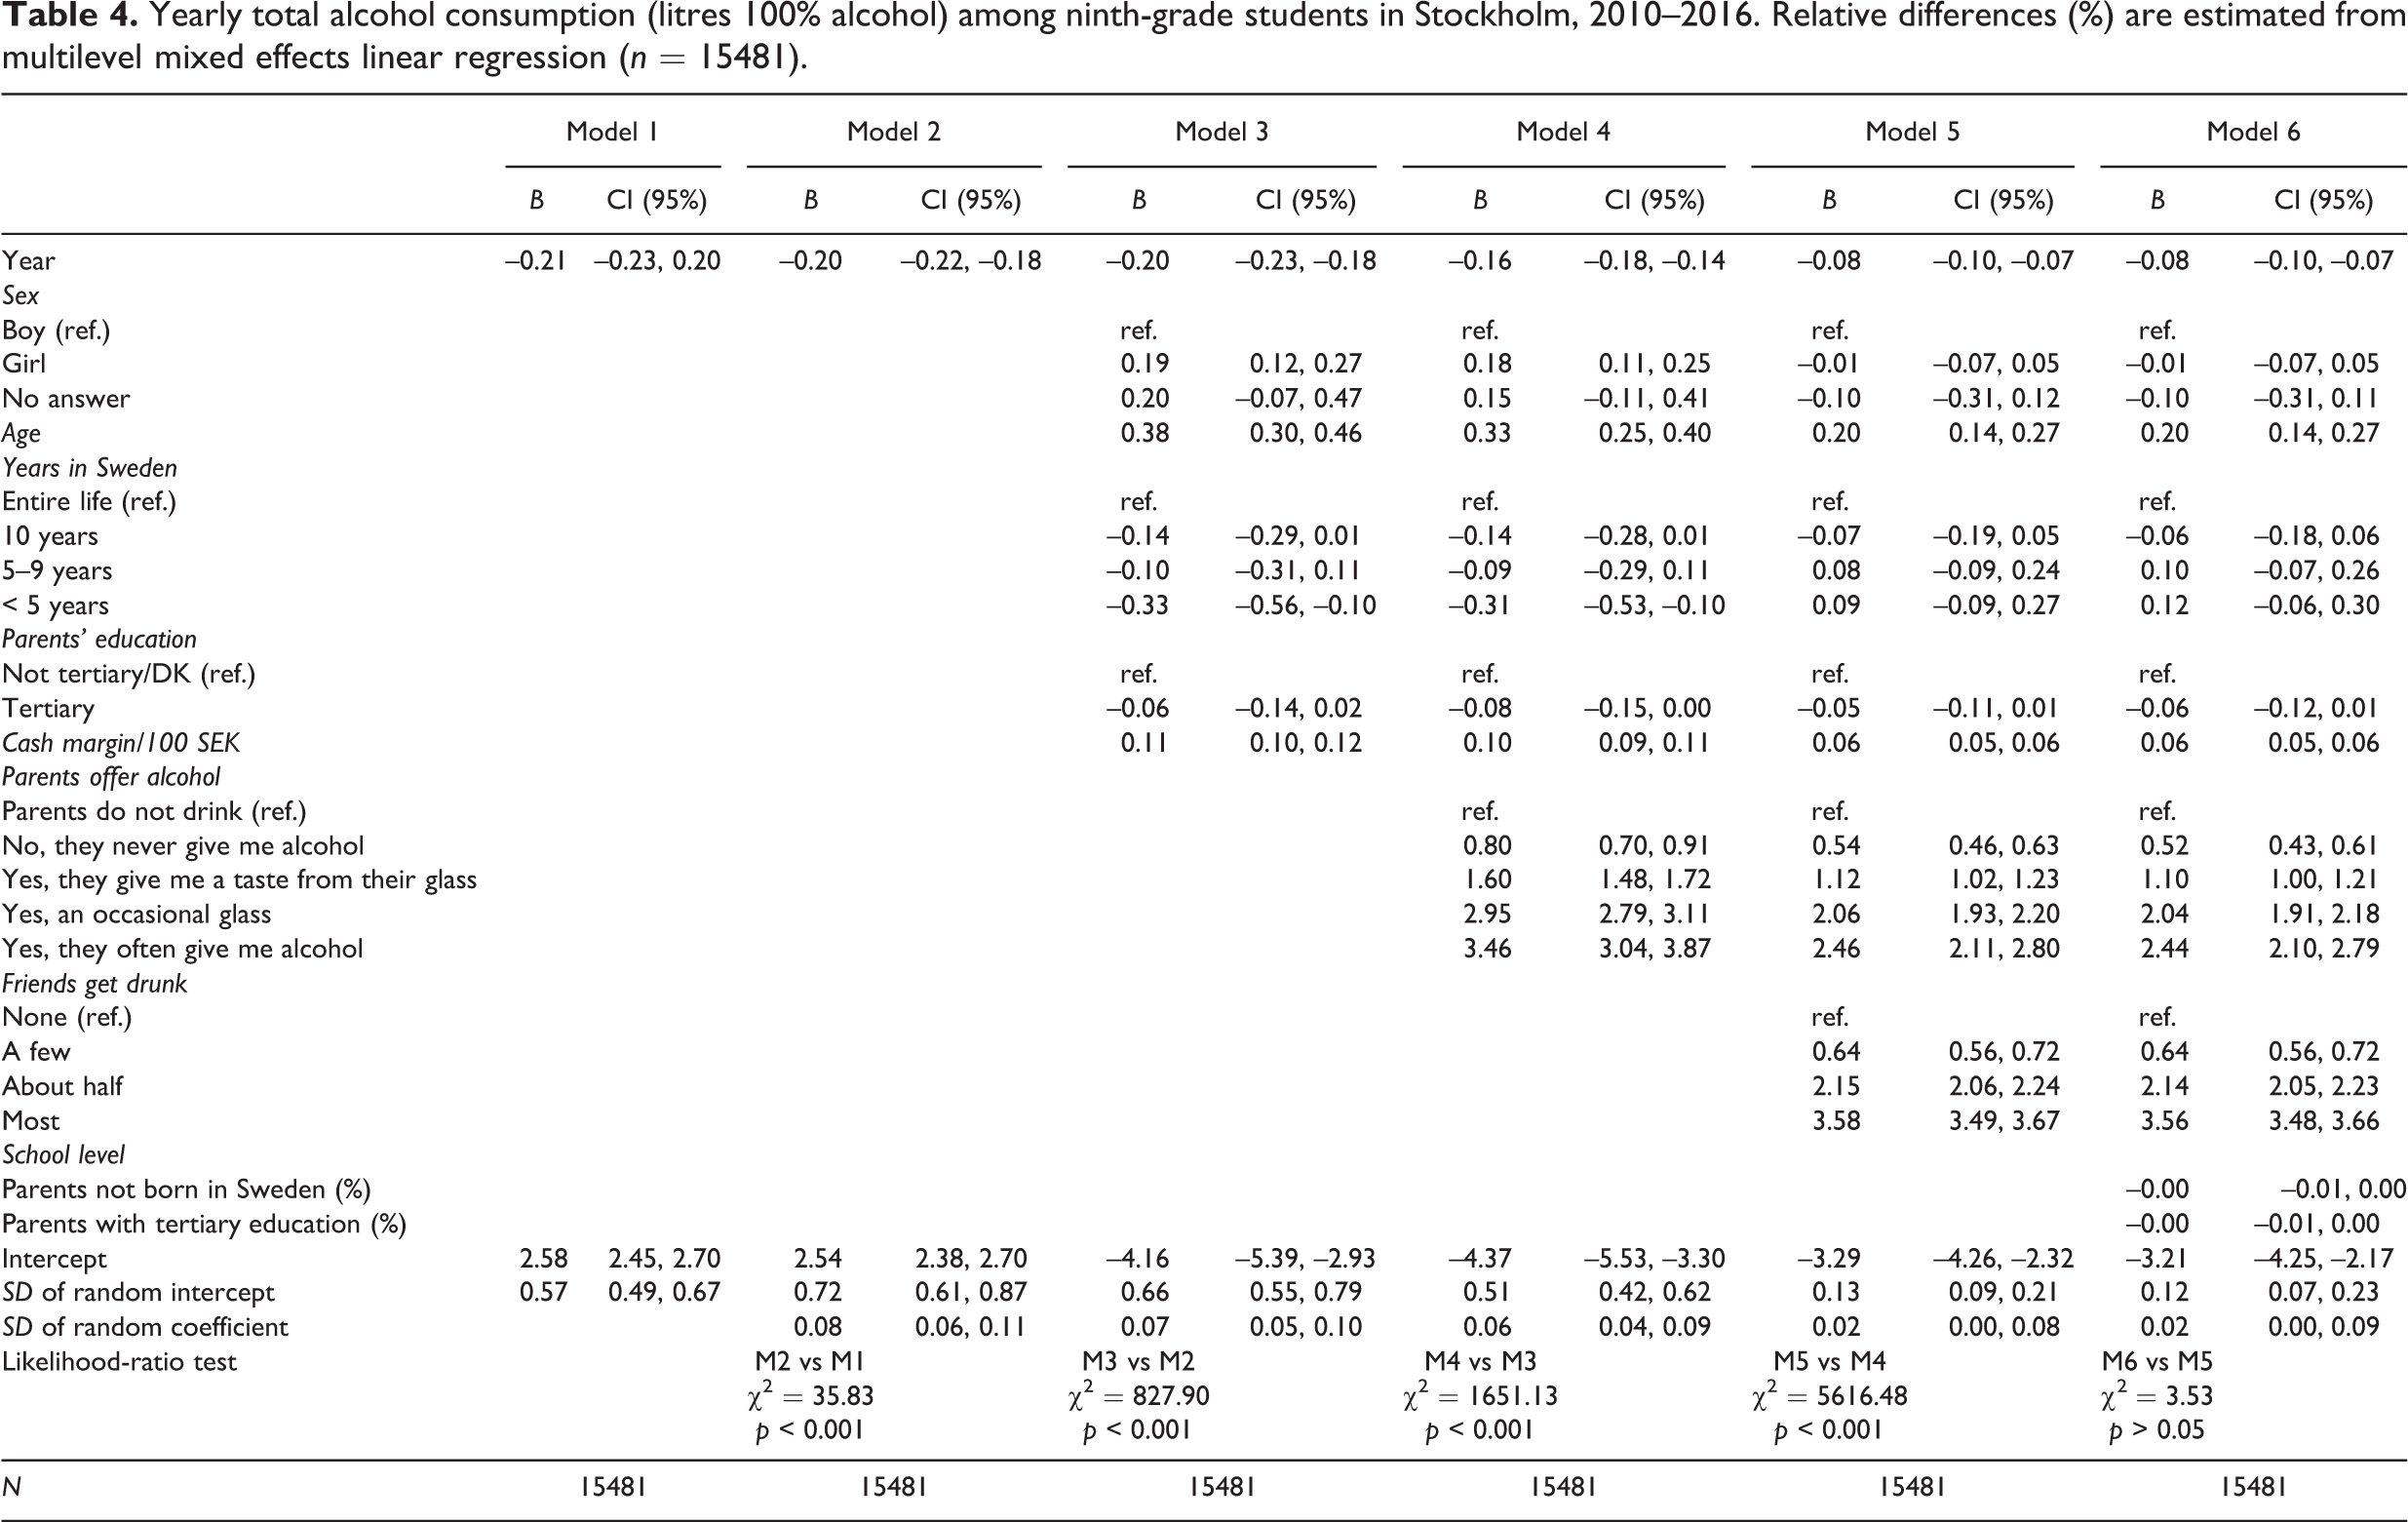
Table 4 presents the results of the regression analyses. From the intercept in Model 1, we can see that the average yearly alcohol consumption is estimated to be 2.58 litres, and from the regression effect of “Year”, the average biennial decrease is estimated to be 21%. The standard deviation of the random intercept is 0.57, based on which we can estimate that 95% of the schools have an average yearly consumption of between 1.46 litres and 3.70 litres of 100% alcohol (2.58 ± 1.96 × 0.57), which is a difference of 86.8%. Model 2 includes both a random intercept and a random slope. By introducing a random slope of “Year”, it is possible to investigate to what extent trends in alcohol consumption are diverging among schools. The standard deviation of the random coefficient is 0.08, and from this, we can obtain an interval from –0.36 to –0.04 (–0.20 ± 1.96 × 0.08), meaning that 95% of the schools had a −36% to −4% average biennial decrease in consumption over the period 2010–2016. In Model 3, the socioeconomic background variables are added. Girls consume significantly more than boys (19%), and students responding “no answer” to the question “are you a boy or a girl?” show 20% higher consumption, but this difference is not significant. With respect to the number of years lived in Sweden, only those having lived in the country for less than five years show a significant difference from those born in Sweden, with a 33% lower consumption. Parents’ education does not significantly relate to their children’s alcohol use; however, students’ cash margins do: the more money they have to spend, the higher their alcohol consumption (B = 0.11). The standard deviation of the intercept changes marginally from 0.72 in Model 2 to 0.66 in Model 3, and the corresponding change in standard deviation of the random intercept changes from 0.08 (Model 2) to 0.07 (Model 3). In Model 4, parents’ willingness to offer alcohol to their children is added. The statistical effect is strong, and the more liberal parents are towards alcohol, the higher the consumption among their children. For instance, those students who often receive alcohol from their parents have almost 3.5 times higher consumption than students whose parents do not drink at all. The effect of “Year” decreases from –0.20 in Model 3 to –0.16 in Model 4. Hence, the overall trend in alcohol consumption is somewhat weaker when controlling for parents’ alcohol behaviour, i.e., a small part of the overall decrease in adolescent alcohol consumption during the analysed period can be attributed to the increasing restrictiveness of parental attitudes between 2010 and 2016, as illustrated in Table 1. The standard deviation of the intercept decreases to 0.51, and the standard deviation of the slope decreases marginally to 0.06. Until now, no variable has convincingly explained the school trend variations. However, when the students’ friends’ alcohol behaviours are added in Model 5, some interesting results appear. First, the variable is strongly and significantly related to the students’ alcohol use: the more friends who get drunk a student has, the higher the student’s own consumption is. More interesting perhaps, is that the effects of “Year” decrease from –0.16 in Model 4 to –0.08 and that the friends’ drinking habits are closely linked to the divergent school trends in consumption. The standard deviation of the random coefficient is now 0.02, implying that when controlling for the students’ friend network, the interval ranges from –12% to –4%. That the statistical effect of friends’ alcohol habits statistically explains much of the downward trend between 2010 and 2016 lies in the nature of the matter, i.e., the more young people who reduce their consumption, the more their friends do the same. More interesting to note is how important the school context seems to be. Finally, in Model 6, two contextual variables are added, i.e., the school proportion of parents not born in Sweden and the school proportion of parents with a tertiary education. However, none of these variables are significantly related to the students’ alcohol consumption or statistically explain any of the variation in the random coefficient.
Yearly total alcohol consumption (litres 100% alcohol) among ninth-grade students in Stockholm, 2010–2016. Relative differences (%) are estimated from multilevel mixed effects linear regression (n = 15481).
Conclusion
The results from this study of Stockholm adolescents do not empirically represent any others than just young people in Stockholm and conclusions concerning young people in Sweden in general must be drawn carefully. However, similar to results from some recent studies based on national samples of Swedish adolescents (Norstrom & Svensson, 2014; Raninen et al., 2014), results from this study, and others (Zeebari et al., 2017), show that alcohol drinking also seems to have decreased among youths in Stockholm during recent years. How schools have changed in terms of alcohol consumption on a national level is, however, not yet known and therefore recent trends among schools in Stockholm and possible explanations for these cannot be generalised to a Swedish national context.
Some of the variables analysed should be considered in more detail on the basis of their validity, or lack thereof. The survey question “Are you ever offered alcohol by your parents/guardians?” has five different response options, where the first option is that the respondents’ parents do not drink at all, which is not a completely relevant answer to the question. Another problem with some of the following possible responses is that they do not clearly specify frequency or quantity. Still, it seems fair to assume that this variable measures parental behaviour as an ordinal scale and with their attitudes towards alcohol as an underlying, latent, dimension. In addition, the survey question “How many friends of yours (in and out of school) get drunk on alcohol?” has some validity problems worth considering. Here the response options do not offer any information about how many friends the respondents actually have or how many of those friends actually get drunk. This information would of course be very valuable, preferably from the social network perspective which is a point of departure in this study. However, it seems reasonable to believe that what kind of alcohol behaviour is common, or less common, in a fairly close social network, big or small, is highly relevant for the individual student.
The results show that there has been a decline in total alcohol consumption among ninth-grade students in Stockholm, and for every second year between 2010 and 2016, consumption seems to have decreased by approximately 20%, resulting in an almost 45% total reduction during this period. A similar decline appears in all the analysed consumption groups, although the relative change appears to be slightly larger among groups with lower consumption. Hence, Skog’s (1985) prediction that any change in the population average of alcohol consumption will result in a corresponding change at all levels of consumption receives some support in this study. Although Skog argued that peripheral social networks may be more influential because of their more enduring properties (Skog, 1985), this study also demonstrates the importance of close social networks.
Two factors were found to statistically explain some of the general decline: parents seem to have become more restrictive in offering their children alcohol and, more importantly, the frequency with which students’ peers got drunk decreased over the study period. The fact that friends’ alcohol habits explain much of the time effect inevitably means that the more young people who reduce their consumption, the more of their friends do the same. Moreover, the strong effect of friends’ alcohol habits shows what a great influence friends have on young people’s alcohol habits, but can of course also suggest that young people seek out drunk or sober environments. A recent study showed the importance of parental monitoring and attitudes towards offspring’s drinking in Sweden, but could not show that they were related to the trend of reduced adolescent consumption over time (Larm et al., 2018). Whether this difference in results is real, random, or depends on differences in research designs etc., remains to be answered in future research. What this study adds is that the close social networks formed by parents and friends are closely related to the school context and explain much of the school differences in mean alcohol consumption and how these schools develop over time.
School constitutes a social context for the student of which both parents and peers are important parts. Moreover, parents’ and, consequently, their children’s, social class, here manifested as attitudes, lifestyles and choices, creates a unique environment in every school. We therefore expect schools to differ in alcohol habits and to take somewhat different paths in the overall declining trend. Previous research has shown that school differences in alcohol use relate to the socioeconomic characteristics of the schools and that underprivileged schools tend to have lower levels of consumption (Olsson & Fritzell, 2015), whereas another study showed that the proportions of well-educated parents and high-performing students at the school were positively related to students’ alcohol use (Carlson & Almquist, 2016). In this study, when analysing 132 elementary schools in Stockholm, the schools’ average alcohol consumption varied between 1.46 litres and 3.70 litres of 100% alcohol yearly. The downward trends between 2010 and 2016 were universal but not identical, ranging from a 4.3% decrease every second year to a 36% decrease for the schools at which the decline was the strongest. These divergences may be due to the norms and behaviours, influenced by parents and peers, characterising these schools, and when controlling for parental attitudes towards offering children alcohol and peers’ alcohol behaviour, the diverging school trends in alcohol consumption were considerably more equal (from –4% to –12%). Although the results from this study shed some light on adolescent drinking and the school context, future deeper analyses would be desirable. For instance, analyses that examine consumption patterns and possible differences and changes in these, as well as analyses that consider the symbolic meanings of drinking or nondrinking among schools and adolescents.
From a preventive perspective, one can conclude from these results that school is a highly relevant setting and that social networks of parents and friends should be considered. Recent scientific reviews have shown that parent-based interventions seem to have an effect on adolescent alcohol use (Bo, Hai, & Jaccard, 2018; Kuntsche & Kuntsche, 2016), and a systematic review of school-based health education showed a small but significant effect (Melendez-Torres et al., 2018). Additionally, more general school environment interventions that aim to improve relationships between staff and students, classroom engagement and students’ involvement in decision-making seem to have a positive, or even more positive, effect on students’ health and health-related behaviours (Bonell, Parry, et al., 2013; Bonell, Wells, et al., 2013). Moreover, Kuntsche and Jordan (2006) argue that preventive programmes countering social influence and establishing norms of disapproval can be effective and that such programmes should include a wide range of agents, such as parents, teachers, school administrators and the community, to create an alcohol- and drug-free environment.
However, several of these intervention studies also note that more research and more reliable data are needed to obtain better knowledge of how effective preventive strategies targeting adolescents should be framed. Although there has been a conspicuous declining general trend in adolescent alcohol consumption since the early 2000s, the results from this study suggest that the local context of the school, influenced by parents’ and peers’ attitudes towards alcohol, is important. Whereas there is no hard evidence regarding how effective school interventions may be, there are still good reasons to believe that the social setting of school is fundamental.
Footnotes
Acknowledgements
We thank the City of Stockholm and The Social Development Unit for providing the data.
Declaration of conflicting interests
The author declared no potential conflicts of interest with respect to the research, authorship, and/or publication of this article.
Funding
The author disclosed receipt of the following financial support for the research, authorship, and/or publication of this article: This study was funded by ‘The Alcohol Research Council of the Swedish Alcohol Retailing Monopoly’ (grant no. 2017-0005).