
Abstract
This study examines two types of smartphone users in m-commerce: ‘Searchers’, who only search for products using their smartphones, and ‘Purchasers’, who both search and purchase using their smartphones. We offer a Unified Theory of Acceptance and Use of Technology (UTAUT) and Technology Acceptance Model (TAM)-based conceptualisation of m-commerce adoption, including new measures of key constructs. Drawing on Psychological Ownership (PO) theory, we examine differences between Searchers and Purchasers. Data collected from smartphone users in Australia reveals that smartphone network and device characteristics play negligible roles in m-commerce adoption. Instead, users’ propensity to make purchases via their smartphone is influenced by user characteristics, including self-efficacy, hedonic experiences and habitual smartphone use. These latter variables represent viable pathways for retailers to convert searchers into purchasers. We also find that, for purchasers, Perceived Ease of Use (PEOU) is an important direct driver of Intention to Purchase (ITP). In contrast, for searchers, the strong effects of PEOU on ITP are fully mediated by Perceived Usefulness. Last, we determine that psychological ownership is significantly higher among purchasers than searchers, suggesting increasing PO is an additional mechanism to transition searchers into purchasers.
Introduction
This study examines the enablers and barriers to consumers’ adoption of ‘m-commerce’, that is, consumers’ using smartphones to search for and purchase products online (Mahatanankoon & Vila-Ruiz, 2007). Easy access to product information using internet-enabled mobile devices, laptops, tablets or smartphones, and enhanced online transaction capabilities has reinvented distribution channels in many retail categories and settings (Shaw, 2014; Slade et al., 2013). M-commerce represents an increasing share of ‘e-commerce’; that is, using any internet-connected device (e.g. PC, laptop, tablet) to purchase products or services online (Chong et al., 2012).
M-commerce industry projections are positive. Shopify expects m-commerce to increase to $710.4 billion by 2025 (Shopify, 2024) and this mirrors projections that m-commerce will represent between 44% and 63% of e-commerce sales by 2025 (eMarketer, 2020; Insider Intelligence, 2022). Further growth is likely from the increased use of mobile payment apps such as PayPal, Apple Pay and Amazon Pay.
Evidence suggests that while many consumers use their smartphone to search for product information online (i.e. ‘m-search’), not everyone makes the transition to m-commerce, that is, making an online purchase using their smartphone. Of the three main devices used for e-commerce, conversion rates using smartphones remain the lowest. Figures from 2022 suggest these conversion rates are 3% for desktops, tablets and laptops compared with 2% for smartphones (Adobe Experience Cloud Team, 2023). Similarly, cart abandonment – where shoppers add items to their ‘cart’ for purchase, but fail to complete their transaction, has consistently remained higher for smartphones compared with desktops and tablets, with rates of 85.7%, 80.7% and 73%, respectively (Miller, 2021).
Among Australians, the reasons cited for abandonment include a website’s lack of optimisation for the smartphone (23%), lengthy and complex checkout processes (38%) and lack of availability of a preferred payment method (35%) (O’Brien, 2022). Despite m-commerce not being new, the level of m-commence adoption is still surprisingly low. In 2022, 62% of Australian consumers reported using their smartphone to shop online, so almost 40% of users are still reluctant to use m-commerce (Statista, 2023).
Given the size and remaining potential of m-commerce, our research explores factors influencing m-commerce adoption. These include attributes of the smartphone technology that can be addressed by smartphone designers, network managers and e-commerce retailers. To achieve this, we examined two cohorts: (i) ‘Purchasers’, who are described as m-commerce users who both search and purchase online using their smartphones, and (ii) ‘Searchers’, those who search but do not purchase online. Our study identifies perceptual and behavioural differences between these two cohorts explaining their contrasting adoption behaviours.
As our study relates to the acceptance and use of smartphone technology and m-commerce adoption, the conceptual model draws primarily on the Unified Theory of Acceptance and Use of Technology, UTAUT2 (Venkatesh et al., 2012), which builds upon the original contributions captured by TAM, the Technology Acceptance Model (Davis, 1989). We also use Psychological Ownership (PO) theory (Hulland et al., 2015; Pierce et al., 2001) to predict and explain observed differences between purchasers and searchers and provide theoretically grounded explanations for our findings. PO exists when individuals feel strongly that an object is ‘theirs’, a sense of possessiveness, and a psychological tie with the object (Hulland et al., 2015). We reveal purchasers have higher PO of their smartphones than searchers, which offers an explains for their different m-commerce adoption behaviour.
Our study makes various theoretical contributions. First, we combine aspects of the UTAUT2 and the TAM frameworks to provide a detailed examination of m-commerce adoption. Second, we introduce PO theory to interpret our descriptive statistics and structural modelling results, and provide useful insights into the motivations and behaviours of smartphone users in m-commerce. Third, our results suggest m-commerce studies should look beyond product and service attributes, to individual user characteristics, to uncover potent drivers of m-commerce adoption. We also offer newly developed and tested scales for PO and TAM-related variables for future technology adoption studies.
Our results also provide managerially actionable insights into m-commerce adoption. While none of the smartphone Device/Network characteristics drive adoption, we find significant influences from the individual-level User Characteristics, such as users’ self-efficacy to search, the extent to which using m-commerce is entertaining and enjoyable, and how habitually users search using their smartphones. A key finding for managers is that a focus on product/service attributes at the expense of understanding the impact of user characteristics is likely to be incomplete in strategically addressing m-commerce uptake.
Theoretical frameworks and conceptual model
Many exemplary technology adoption models were first developed in organisational contexts. The original Technology Acceptance Model (Davis, 1989) and TAM2 (Venkatesh & Davis, 2000), examined e-mail acceptance within organisations, while TAM3 concerned IT adoption (Venkatesh & Bala, 2008). Likewise, the original UTAUT (Venkatesh et al., 2003) is based on intra-organisational technology adoption. In contrast, Venkatesh et al. (2012) extended UTAUT into a consumer adoption context; as such, their offering – labelled UTAUT2 – is thereby used as a basis for our model specification.
Our dependent variable is behavioural intention, specifically users’ Intention to Purchase using their smartphone. While UTAUT2 uses Behavioural Intention to predict User Behaviour, as our study is cross-sectional, we did not measure actual purchase behaviour. Instead, purchasers report their Actual Intention to Purchase using their smartphone, whereas searchers report their Expected Intention to Purchase. While there may be the usual issues with respect to the attitude-behaviour link, our empirical application demonstrates sufficient predictive power to explain variation in and the strength of respondents’ stated intentions, by including relevant variables drawn from the literature (Conner & Norman, 2022).
Accordingly, we include five UTAUT2 dimensions in our conceptual model to predict behavioural intention: Performance Expectations, Facilitating Conditions, Effort Expectancy, Hedonic Motivation and Habit. Turning first to the Performance expectations, we include three variables to capture that aspect of UTAUT2. As m-commerce requires the use of small input-output surfaces and a need to render complex website content clearly for users, the adequacy of the smartphone Screen size for searching is included in our model. By extension, we also include how well Web content displays on the smartphone as fundamental to formulating performance expectations among m-commerce users (Chin et al., 2012; Wong & Hsu, 2008). As noted earlier, 23% of Australians abandoned searching due to websites’ lack of optimisation for smartphones, hindering m-commerce adoption (O’Brien, 2022).
We also include Actual/Perceived purchase security, a belief by purchasers/searchers respectively, that their personal financial information will not be viewed, stored or manipulated by inappropriate parties while searching/purchasing using their smartphone (Chin et al., 2012; Flavián et al., 2006). Extant research suggests perceived security during search or purchase can inhibit m-commerce adoption (e.g. Chau et al., 2020; Chellappa & Pavlou, 2002; Chin et al., 2012; Hwang & Good, 2014; Wong & Hsu, 2008), hence its inclusion here.
Similarly, we capture the UTAUT2 dimension Effort Expectancy by including a measure of a user’s Self-efficacy to search for products on their smartphone (Venkatesh & Bala, 2008). Users with high self-efficacy will require less effort than those with low self-efficacy and rate their smartphone as useful and easy to use.
Consistent with UTAUT2 (Venkatesh et al., 2012) we include Hedonic Motivation to search in our model, given its importance in predicting consumers’ behavioural intention to use a technology. We also examine users’ Habitual Use of smartphones to search, consistent with UTAUT2 where it is specified as a predictor of both Behavioural Intention and Use Behaviour. In the context of this study, and consistent with Kim and Malhotra (2005), we view habit as the extent to which a smartphone user believes their search behaviour is automatic (e.g. Limayem et al. 2007), rather than as a proxy for experience using a smartphone (e.g. Venkatesh et al., 2012). However, we do include users’ experience with the smartphone in our model as a control variable, measuring the number of years users have owned a smartphone. The logic is that greater smartphone-related experiences are likely to influence users’ intention to use m-commerce (Burke, 2013).
Need for the most Innovative smartphone is included as a measure of innovativeness, as adoption can be relatively early for some users (Rogers, 2003). Thus, we expect purchasers to reflect their innovativeness through a preference for the most innovative smartphone.
Again, consistent with UTAUT2 we include two variables to capture some Facilitating Conditions in m-commerce adoption. These refer to resources and support that help users perform a behaviour (Brown & Venkatesh, 2005; Venkatesh et al., 2003). In m-commerce adoption, one’s smartphone Connection Speed to the internet and Drop-out Frequency when searching are two network attributes that could influence m-commerce adoption. Poor performance on these is likely to reduce Perceived Ease of Use (PEOU) and Perceived Usefulness, and hinder m-commerce adoption.
An important addition to our model is therefore the inclusion of those two TAM mediators of Behavioural Intention (Davis, 1989). These variables can help understand m-commerce adoption, thus it is important to accurately measure and model these mediators, as low scores could be indicative of barriers to m-commerce adoption. TAM specifies a technology’s Perceived Ease of Use and Perceived Usefulness drive adoption, because people adopt technologies that are easier to use, or allow them to do things better (Davis, 1989), hence their inclusion in our model. Last, we capture Behavioural Intent via our dependent variable Intention to Purchase using a smartphone (Venkatesh et al., 2012).
Despite criticisms of TAM as a dated framework (e.g. Bagozzi, 2007; Benbasat & Barki, 2007), we include it here as it continues to help understand consumer adoption in various market settings (e.g. Agrebi & Jallais, 2015; Burke, 2013; Hubert et al., 2019; Revels et al., 2010; Shankar, 2020; Vahdat et al., 2021). Our conceptual model is presented in Figure 1.
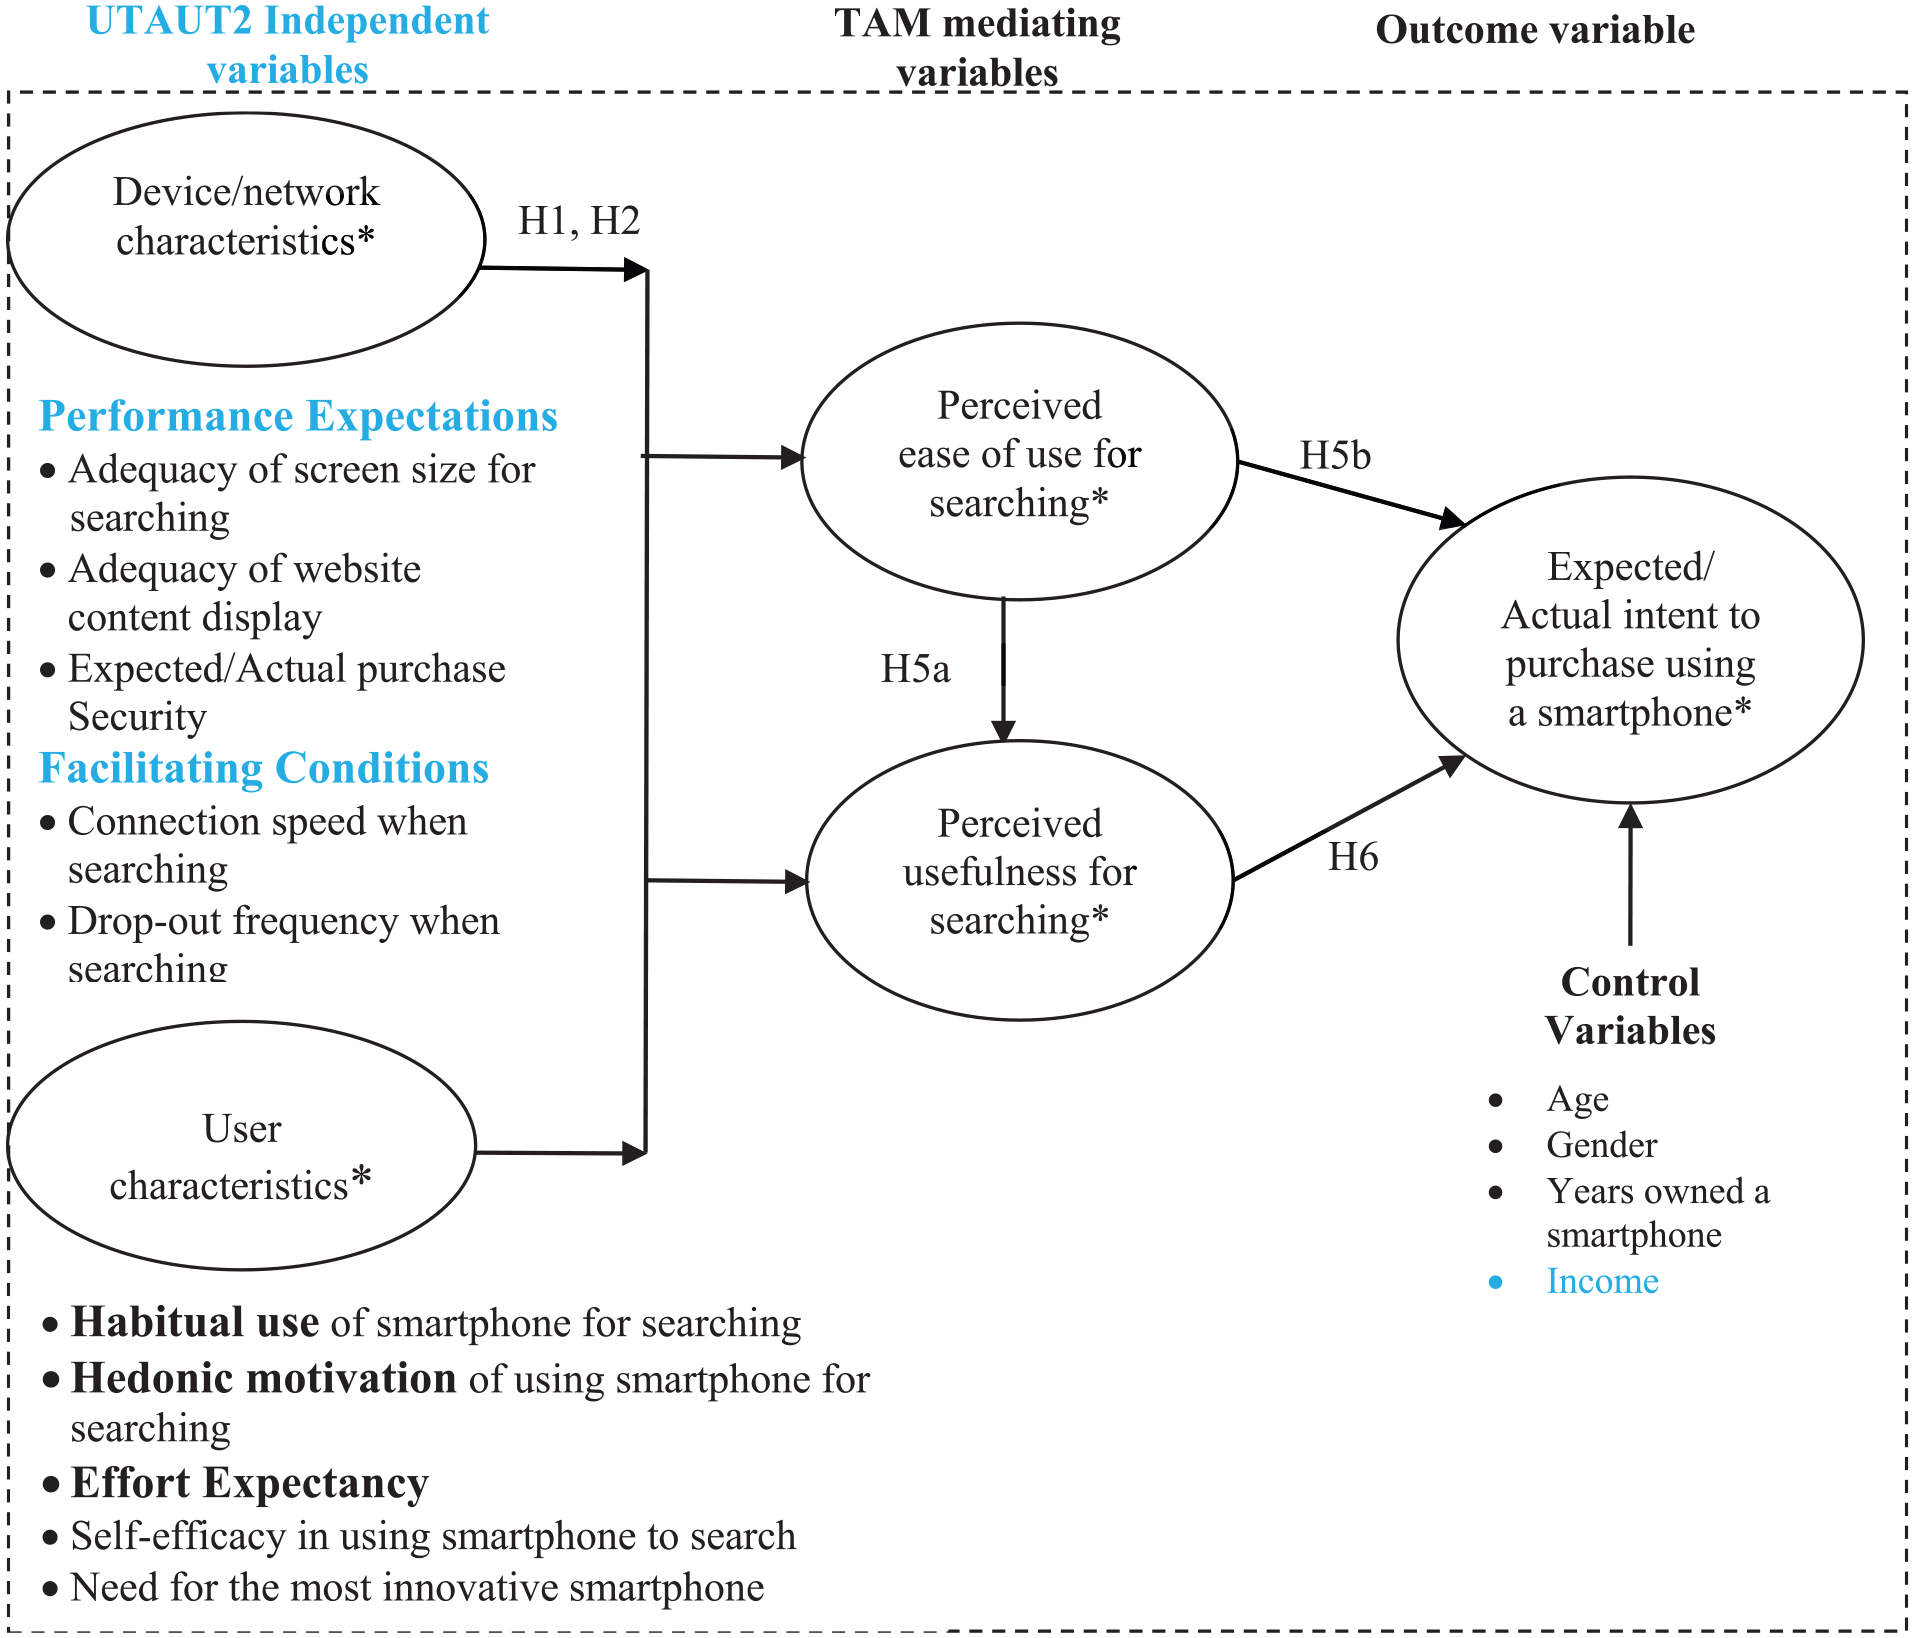
Conceptual model.
Smartphones and psychological ownership theory
We introduce Psychological Ownership (PO) theory to understand differences in m-commerce adoption. As noted previously, PO involves strong feelings of ownership and possessiveness of a ‘target’ object such that the object becomes an extension of the self (Belk, 1988; Stocchi et al., 2018) helping reinforce one’s self-concept (Jussila et al., 2015).
Smartphones are ‘not just a technological gadget, but a cultural object as well’ (Shankar et al., 2010, p. 112), a personalised tool extending beyond talk and text (Omar et al., 2021). For some, smartphones cause technostress, while for others, usage can verge on addiction (Zolfagharian & Yazdanparast, 2017). Thus, we anticipate significant PO variation among smartphone users. Importantly, we would not have this expectation of other ubiquitous and commonly used products such as microwave ovens, lawn mowers or kitchen tables. This is because such products do not elicit strong feelings of ownership and possession, or reinforce one’s self-concept (Jussila et al., 2015). As Hulland et al. (2015) suggest, PO is likely to be germane in social media applications which allow users to create and exchange content. These include social networking sites (e.g. Facebook), content communities such as YouTube (Lee & Suh, 2015) and virtual game worlds (e.g. World of Warcraft), which are accessible via smartphones.
Our use of PO therefore introduces a relatively unexplored and interesting construct to the context of m-commerce. The idea that PO is associated with m-commerce adoption is a genuinely new contribution.
We use PO theory to predict differences between purchasers’ and searchers’, and that a priori, purchasers’ PO will be higher than searchers as they are more innovative and use smartphones and their features more extensively (Burke, 2013; Park & Chen, 2007). Users with high PO in a target object have and do invest considerable time, skill, psychological and intellectual energy to intimately know their device (Jussila et al., 2015; Pierce et al., 2001; Schweitzer et al., 2019). Purchasers’ greater effectance and efficacy gained during this is associated with greater PO of their smartphone.
Similarly, smartphones engender another important PO dimension, that is, they represent a ‘home territory’ or personalised space, offering users psychic security and comfort (Jussila et al., 2015; Pierce et al., 2001). Smartphone users create their ‘place’ via personalised smartphone covers, picture galleries, selfies or links to music, movies, shows and websites to reflect their extended self (Belk, 2013; Stocchi et al., 2018).
Last, smartphones engender PO because they fulfil users’ need for stimulation and arousal (Pierce & Jussila, 2011), through creating, storing and viewing materials that arouse users’ emotions. Our arguments are consistent with Read et al. (2011) who examined consumers’ connection and emotional attachment to their e-readers, finding both dimensions positively impact attitudes and intention to use that device.
Thus, PO theory can help understand and explain m-commerce adoption. Given their greater self-efficacy, effectance and efficiency, purchasers’ high PO should be associated with a greater propensity to use m-commerce than searchers. Moreover, purchasers are likely to derive more hedonic rewards than searchers when using their smartphones. Similarly, we predict PO-based differences between purchasers’ and searchers’ ratings of smartphone Device/Network characteristics, their User Characteristics, Perceived Ease-of-use and Perceived Usefulness, and Intention to Purchase using a smartphone.
We also include four control variables: users’ age, gender, income and number of years they have owned a smartphone. Their inclusion is based on previous studies suggesting they may affect individuals’ intentions to adopt a technology (e.g. Bigne et al., 2005; Burke, 2013; Venkatesh et al., 2012).
Hypotheses development
Performance expectations
Both UTAUT2 and TAM posit that various product attributes influence adoption, and that users have performance expectations with respect to those attributes. Some work suggests m-commerce adoption is inhibited by ‘device inefficiencies’ (Mahatanankoon & Vila-Ruiz, 2007; Wong & Hsu, 2008) including usability issues arising from the smartphone device. Smartphone design involves an inherent conflict between user requirements that input/output surfaces be as large as possible, and greater device miniaturisation (Roberts et al., 2014). Users have found smartphone screens too small for m-commerce compared with PCs and tablets (Google, 2013; Mahatanankoon & Vila-Ruiz, 2007; Wong & Hsu, 2008). Readability for example can be over 50% lower on smartphone screens than desktops (Singh et al., 2011), failing in this basic performance expectation. We therefore include the Size of the smartphone screen in this study.
Similarly, online shopping websites must meet searchers’ information needs, drive site commitment and offer satisfactory user interfaces to assist choice (Chin et al., 2012; Park & Kim, 2003). Smartphones, however, can distort websites and display their content poorly (Xiao & Benbasat, 2007), including sites using recommendation agents to sort and recommend products based on consumer inputs (Punj & Moore, 2007). Even though web content designers have used ‘responsive’ website designs, adapting web page content to best fit available screen space (Warner, 2013), many websites remain poorly adapted for online shopping (Clague, 2016). Thus, we include the Adequacy of the web content display on the smartphone as a fundamental performance expectation of m-commerce users, as the better information appears on users’ screens during m-search, the more positively they will rate their PEOU and PU.
Facilitating conditions
Turning now to the m-commerce Facilitating Conditions (e.g., Yang & Forney, 2013), smartphones rely on wi-fi or mobile connections rather than fixed lines. Consequently, network characteristics could hinder m-commerce adoption. Nah (2004) for example found tolerable times to retrieve web content are as short as two seconds. Hence our inclusion of Connection speed, which should influence m-commerce adoption, as faster connection speeds should increase users’ PEOU and PU.
Conversely, smartphone Dropout Frequency during search should inhibit m-commerce adoption by reducing PEOU and PU. Although we found no studies specifically examining smartphone dropout frequency, one of the facilitating conditions in Venkatesh et al. (2012) is data transfer rates, which reduce internet usage intentions. Using this logic more frequent dropouts should reduce users’ PEOU and PU.
In addition, users may have concerns that their security might be compromised when using m-commerce (Chellappa & Pavlou, 2002; Chin et al., 2012; Chong, 2013). Consequently, we include Perceived Security during search, or purchase, because low confidence in security will reduce smartphone users’ willingness to disclose information online or undertake m-commerce related transactions (Anuj et al., 2024; Chau et al., 2020; Chin et al., 2012; Clague, 2016; Kim et al., 2010; Saeed, 2023; Zarmpou et al., 2012; Zolfagharian & Yazdanparast, 2017). For potential m-commerce adopters, security concerns add further complexity to their transition and will reduce PEOU and PU to search using their smartphones (Stancu et al., 2023). We therefore hypothesise:
H1: PEOU for searching will be higher when smartphones: (a) have larger screens; (b) display website content better; (c) connect more quickly to the internet; (d) drop-out less during use and (e) have greater perceived security during search/purchase.
H2: PU for searching will be higher when smartphones: (a) have larger screens; (b) display website content better; (c) connect more quickly to the internet; (d) drop-out less during use and (e) have greater perceived security during search/purchase.
Effects of the user characteristics
The second antecedents to m-commerce adoption we examine are User Characteristics. UTAUT2 identifies users’ habits as an important driver of behavioural intention, as repeated smartphone use is likely to lead to a more positive assessment of that technology and increase users’ behavioural intention (Venkatesh et al., 2012). Successful searches reinforce beliefs that smartphones are both easy to use and useful for searching. Conversely, users less habituated to searching via smartphone, the searchers, will search less frequently and less successfully, reinforcing negative beliefs that smartphones are difficult to use and less useful for searching.
Consistent with UTAUT2 (Venkatesh et al., 2012) we also examine Hedonic motivation to search using a smartphone. This variable reflects the pleasure that individuals derive from using a technology (Davis et al., 1992). Hedonic motivation positively influences technology acceptance, use and intention (Venkatesh et al., 2012), including in consumers’ use of mobile applications (i.e. ‘apps’) to undertake m-commerce (Patel et al., 2020). Consequently, much web content is developed to meet both consumers’ information and hedonic needs (Warner, 2013). Studies examining technology adoption (e.g. internet, online-games, virtual-assistants, mobile services) also highlight affective factors such as playfulness in m-commerce adoption (Moon & Kim, 2001; Revels et al., 2010). Bruner and Kumar (2005) suggest ‘fun’ leads to more positive attitudes to purchasing products when using handheld devices, while other work confirms the importance of user enjoyment in m-commerce adoption (e.g. Arruda Filho et al., 2020; Groß, 2015; Natarajan et al., 2017; Yang, 2012).
We also include a proxy for the UTAUT2 construct Effort Expectancy, a user characteristic, namely, Self-efficacy to search using the smartphone. Three of the Effort Expectancy items used in Venkatesh et al. (2012) relate to how ‘easy’ it is for users to access the internet or to learn how to do so using their mobile phone. A fourth item is whether the interaction with the internet is clear and understandable. All of these reflect users’ abilities and their self-efficacy, including their capacity to competently search using their smartphone, hence its inclusion in our model.
Users with high self-efficacy require less effort to learn about or use their smartphone than those with low self-efficacy, and evidence suggests low self-efficacy does inhibit m-commerce adoption (Gupta & Arora, 2017; Mani & Chouk, 2017). Consistent with this, high self-efficacy drives ease of use and innovative uses of smartphones (Park & Chen, 2007). As a result, we expect users with high smartphone self-efficacy, the purchasers, with their greater ability to search, will report higher PEOU and PU than searchers.
We also include Users’ need for the most innovative smartphone. From a DoI perspective, advanced knowledge and early understanding of technologies allow lead users to easily adopt complementary and replacement technologies (Rogers, 1995). These technologies make product-related search easier and more useful, and consistent with this, TAM-based studies suggest users’ product experience influences their PEOU and PU in web interface use (Castañeda et al., 2007), mobile apps (Vahdat et al., 2021) and online retailing (Gefen et al., 2003). Consistent with the previous discussion, we draw the following hypotheses:
H3: Smartphones PEOU for searching will be greater when users: (a) habitually use their smartphone; (b) have a high need for the most innovative smartphone; (c) have greater smartphone self-efficacy and (d) have greater hedonic motivation to search using their smartphone.
H4: Smartphones PU for searching will be greater when users: (a) habitually use their smartphone; (b) have a high need for the most innovative smartphone; (c) have greater smartphone self-efficacy and (d) have greater hedonic motivation to search using their smartphone.
Effects of perceived ease of use and perceived usefulness
Following TAM logic, PEOU will increase users’ PU and Intention to Purchase using their smartphone (Davis, 1989; Venkatesh & Bala, 2008; Venkatesh et al., 2012). In a smart-home adoption context, Hubert et al. (2019) found PEOU positively influenced PU, whilst Vahdat (2021) reported that PEOU positively influenced attitudes to mobile phone app use and purchase intentions. In a smartphone context, PEOU is associated with more positive attitudes towards m-commerce, greater PU of the smartphone and greater Intention to Purchase using a smartphone (Groß, 2015). We therefore hypothesise:
H5: The greater a smartphone’s PEOU for search the greater the (a) smartphone’s PU for search, and (b) the owner’s intention to purchase using their smartphone.
H6: The greater the smartphone’s PU for search, the greater the owner’s intention to purchase using their smartphone.
Differences in purchasers’ and searchers’ latent variable scores
As argued earlier, purchasers’ PO should exceed searchers’ and this difference will be reflected in the Performance Expectations and Facilitating Conditions variables. Here we capture these via our five Device/Network characteristics. Given their greater experience with smartphone use, we expect purchasers will rate their smartphone performance better than searchers. Moreover, purchasers will benefit more from smartphone technologies, which allow them to extend their self-identity (Belk, 2013; Pierce & Jussila, 2011), a key aspect of products that elicit high PO. High PO is also associated with controlling and intimately knowing a ‘target’ object (Pierce et al., 2001), behaviour more indicative of purchasers than searchers. Moreover, purchasers’ greater need to intimately know and control their smartphones suggests that they will prefer more innovative smartphones.
As purchasers are capable and motivated smartphone users with high self-efficacy, they should rate their smartphones’ PU higher than searchers. Moreover, purchasers’ propensity to invest time, effort, and attention into their smartphone is driven in part by their PO needs for pleasure/entertainment and stimulation (Jussila et al., 2015), and affective qualities (Bridges & Florsheim, 2008). Purchasers should therefore report greater hedonic motivation than searchers. A further prediction is greater habitual use by purchasers than searchers, as purchasers’ higher PO reinforces their existing heavy smartphone use in organising their lives in time and space (Jussila et al., 2015). Consistent with Davis (1989), greater user capability will also be associated with greater ease of m-commerce use, and intention to purchase using a smartphone. We hypothesise the following differences between purchasers and searchers in relation to the model constructs:
H7: Purchasers will rate their smartphone better than searchers in terms of (a) screen size; (b) web content display; (c) connection speed; (d) dropout frequency and (e) purchase security.
H8: Purchasers will have a higher: (a) need for the most innovative smartphone; (b) self-efficacy to search; (c) hedonic motivation to search and (d) habitual use to search than searchers.
H9: Purchasers will have a higher: (a) perceived ease-of-use; (b) perceived usefulness and (c) higher intention to use their smartphone for purchasing than searchers.
It is important to note that hypotheses H7 to H9 focus on differences in the levels of the latent variables between purchasers and searchers, and not moderating effects on the mediating and dependent variables.
Control variables
Age is included as evidence suggests younger consumers adopt m-commerce more readily (Yang, 2012) and have less difficulty processing new or complex information associated with new technologies (Morris et al., 2005). Similarly, a lack of familiarity with using smartphones to purchase inhibits m-commerce adoption among older users (Bigne et al., 2005). While some m-commerce studies suggest gender does not influence users’ intention to adopt m-commerce (e.g. Yang, 2012; Yol et al., 2006), it is a key demographic variable. Income is included as smartphones can be costly to buy and operate, and there may be an income effect. The years users have owned a smartphone is included because greater smartphone-related experience should increase their ability to search and intention to purchase (Burke, 2013; Venkatesh et al., 2012).
Research method
Sample and data collection
Respondents were recruited via a commercial panel company (Lightspeed GMI) and quota-controlled based on population statistics (e.g. age, gender) from the Australian Bureau of Statistics (2010). Qualified respondents were those who used their smartphone to access the internet and search for product information (searchers), or to search and purchase online using their smartphones (purchasers). Two questions were asked to identify searchers and purchasers. The first asked if they had searched using their smartphone; if no, the survey was terminated. The remaining respondents were asked if they had purchased online using their smartphone. Users indicating that they had searched but not purchased were categorised as searchers, those who searched but also purchased were categorised as purchasers.
Respondents were given the example of using Google via their smartphone to search for ‘accommodation providers in Terrigal’ to clarify the notion of m-search. Respondents were told that ‘making an online purchase’ referred to using their smartphone to exchange financial information to purchase a product. This yielded 230 respondents, 117 purchasers (51%) and the remaining 113 (49%) searchers.
Gender was equally split, 49% males and 51% females, over all ages, with 69% of respondents between 25 and 54 years old. The majority were employed full-time (40%), followed by those in part-time or casual employment (26%). Just over 40% held university qualifications, 24% had technical college qualifications and the remaining 36% had high school as their highest level of education. Respondents had a median annual personal income of between AUD$31,200 and $41,599. Goods purchased using smartphones were largely low involvement: tickets for movies or concerts (48%), clothing (39%), smartphone apps (37%), music (34%) consumer electronics (18%), toys (17%), books (16%), groceries (15%) and jewellery (8%).
Measures and measure refinement
Table 1 presents measurement diagnostics for the latent variables (See Appendix 1). All items’ t-statistics are significant, and each average variance extracted (AVE) exceeds 0.5, demonstrating convergent validity (Fornell & Larcker, 1981). Discriminant validity is established as the searchers’ and purchasers’ heterotrait-monotrait ratios (HTMT) are all <.85 (Henseler et al., 2015). Last, all items loaded onto the focal construct without cross-loading (Chin, 1998). The variance inflation factors for the PLS structural model are <4.0 for purchasers, and <3.4 for searchers, thus our findings are unaffected by multicollinearity.
Assessment of Measurement for Reflective Constructs.
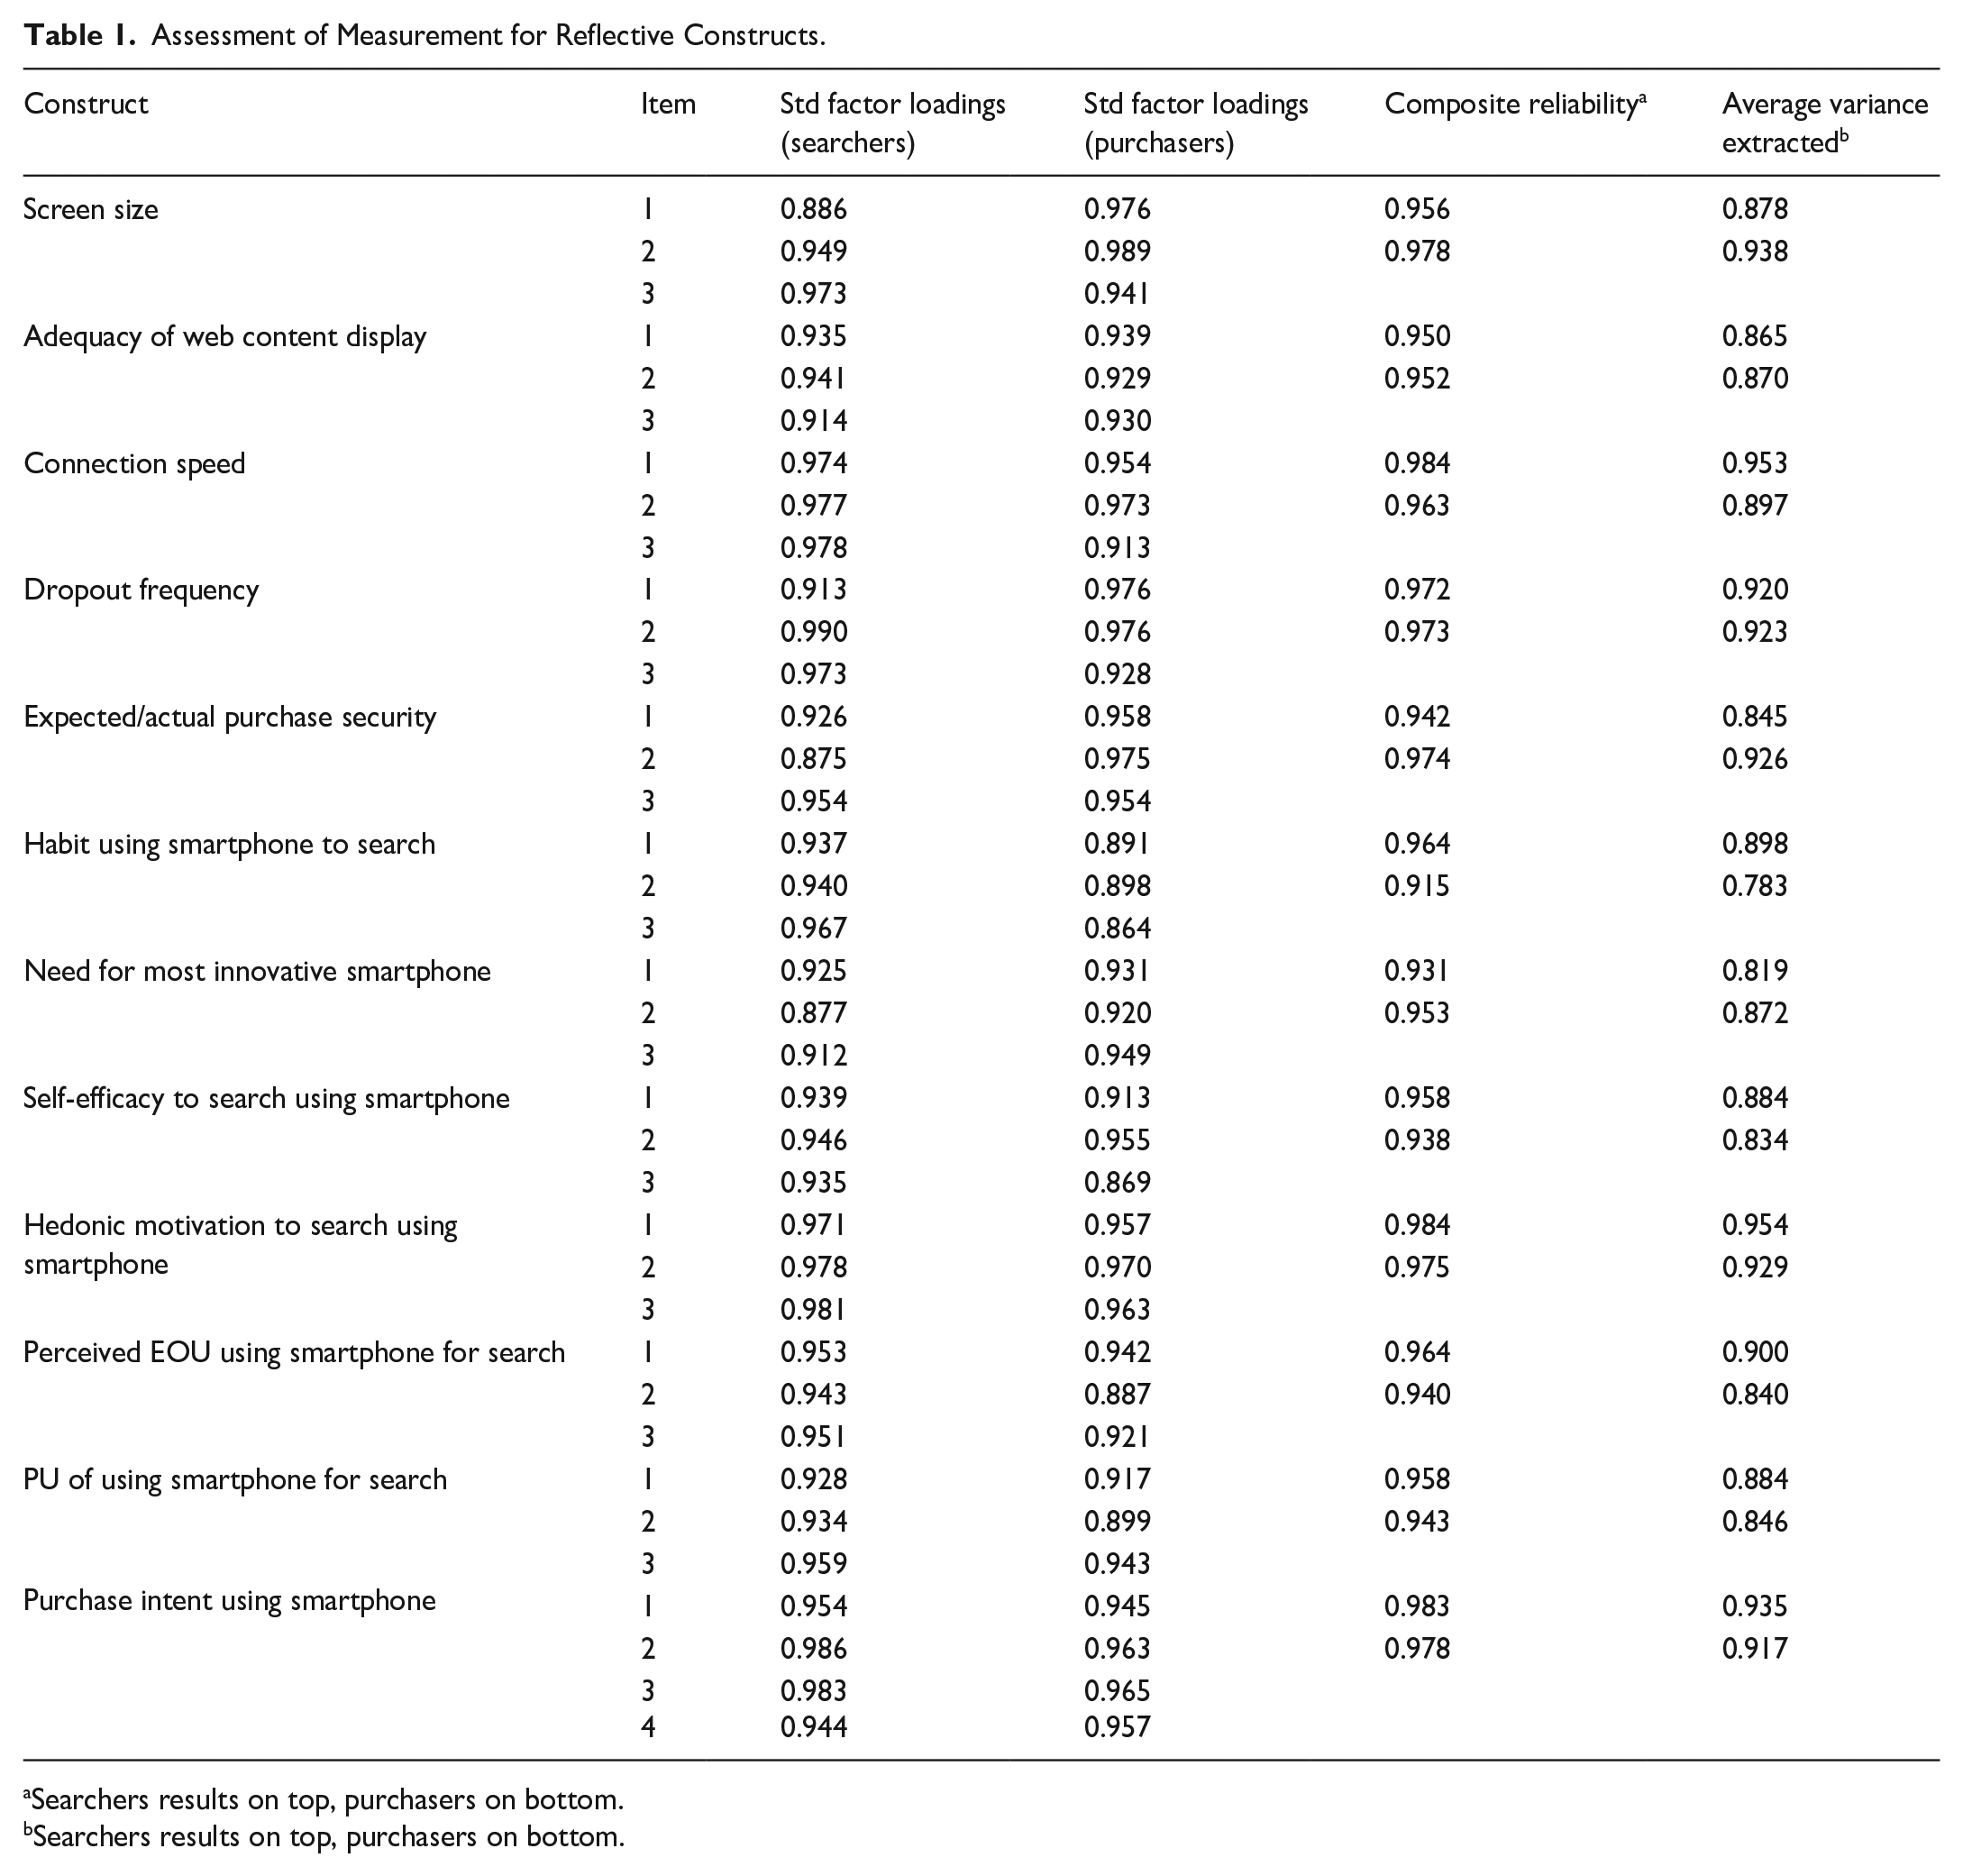
Searchers results on top, purchasers on bottom.
Searchers results on top, purchasers on bottom.
Common method bias was assessed via Kock’s (2015) full collinearity approach. The Inner VIFs for the Purchasers are all below 3.3, and for the Searchers the highest Inner VIF is 3.332, suggesting no concerns about common method bias affecting our results.
PLS model testing results
We used Partial Least Squares (PLS) to diagnose the multi-item measures and predict the endogenous variables in our multi-stage model. PLS makes no assumptions about multivariate normality, and the samples, if representative, do not need to be large (Chin, 1998). SmartPLS 4 was used (Ringle et al., 2022) for a Multi-Group Analysis (MGA) of our two groups, Purchasers and Searchers.
Given our analysis examines differences between two groups, it was necessary to test for measurement invariance. We used the ‘measurement invariance of composite models’ (MICOM) procedure in SmartPLS4 (Ringle et al., 2022). Step 1 in MICOM requires the structural model to have configural invariance. Our data satisfies this criterion in various ways. First, identical items were used for the Searchers and the Purchasers (see Appendix 1 for items), and as per Table 1, the Searchers’ and Purchasers’ standardised factor loadings are very similar. In addition, the latent variables in our model have very high Composite Reliability and Average Variance Extracted. We also treated the data for each group identically, using identical algorithm settings in our estimation (Henseler et al., 2016).
The MICOM Step 2 requirement of compositional invariance is also largely met, as 12 of the 15 permutation p values are >.05. In MICOM Step 3a, to assess whether the means of each group are the same, consistent with our results in Table 4, the only Device/Network variable in which the means of purchasers and searchers do not differ is in the Adequacy of Screen Size. Thus, these results support our predictions of different means between purchasers and searchers. In MICOM Step 3b, 6 of the 15 variances are statistically significant, and so do not have equal variances. Although we largely meet the first two MICOM Steps, but not Step 3, we are still able to conduct our two-group analysis and interpret the standardised coefficients in the structural model (Henseler et al., 2016).
In our MGA we used 5,000 bootstrap samples, and the R2 results reveal high explanatory power, predicting between 13% and 76% of the variance in searchers’ endogenous variables, and 37% and 69% for purchasers (see Table 2). The low R2 is for Searchers’ Intention to Purchase using their smartphone. The result does make some sense, as we know intuitively, and now empirically from our study that their Intention to Purchase is very low (Mean = 2.90, SD = 1.54), compared with Purchasers (Mean = 4.99, SD = 1.44). Searchers are reluctant m-commerce adopters and likely to be less susceptible to attempts to transition them to Purchasers. In addition, while we have uncovered some important variables that influence searchers’ m-commerce adoption, there are potentially more explanatory variables that could increase the R2 in future studies. To assist readers in linking these results to our conceptual framework, we also present them graphically in Figure 2.
PLS Multi-Group Analysis Results.
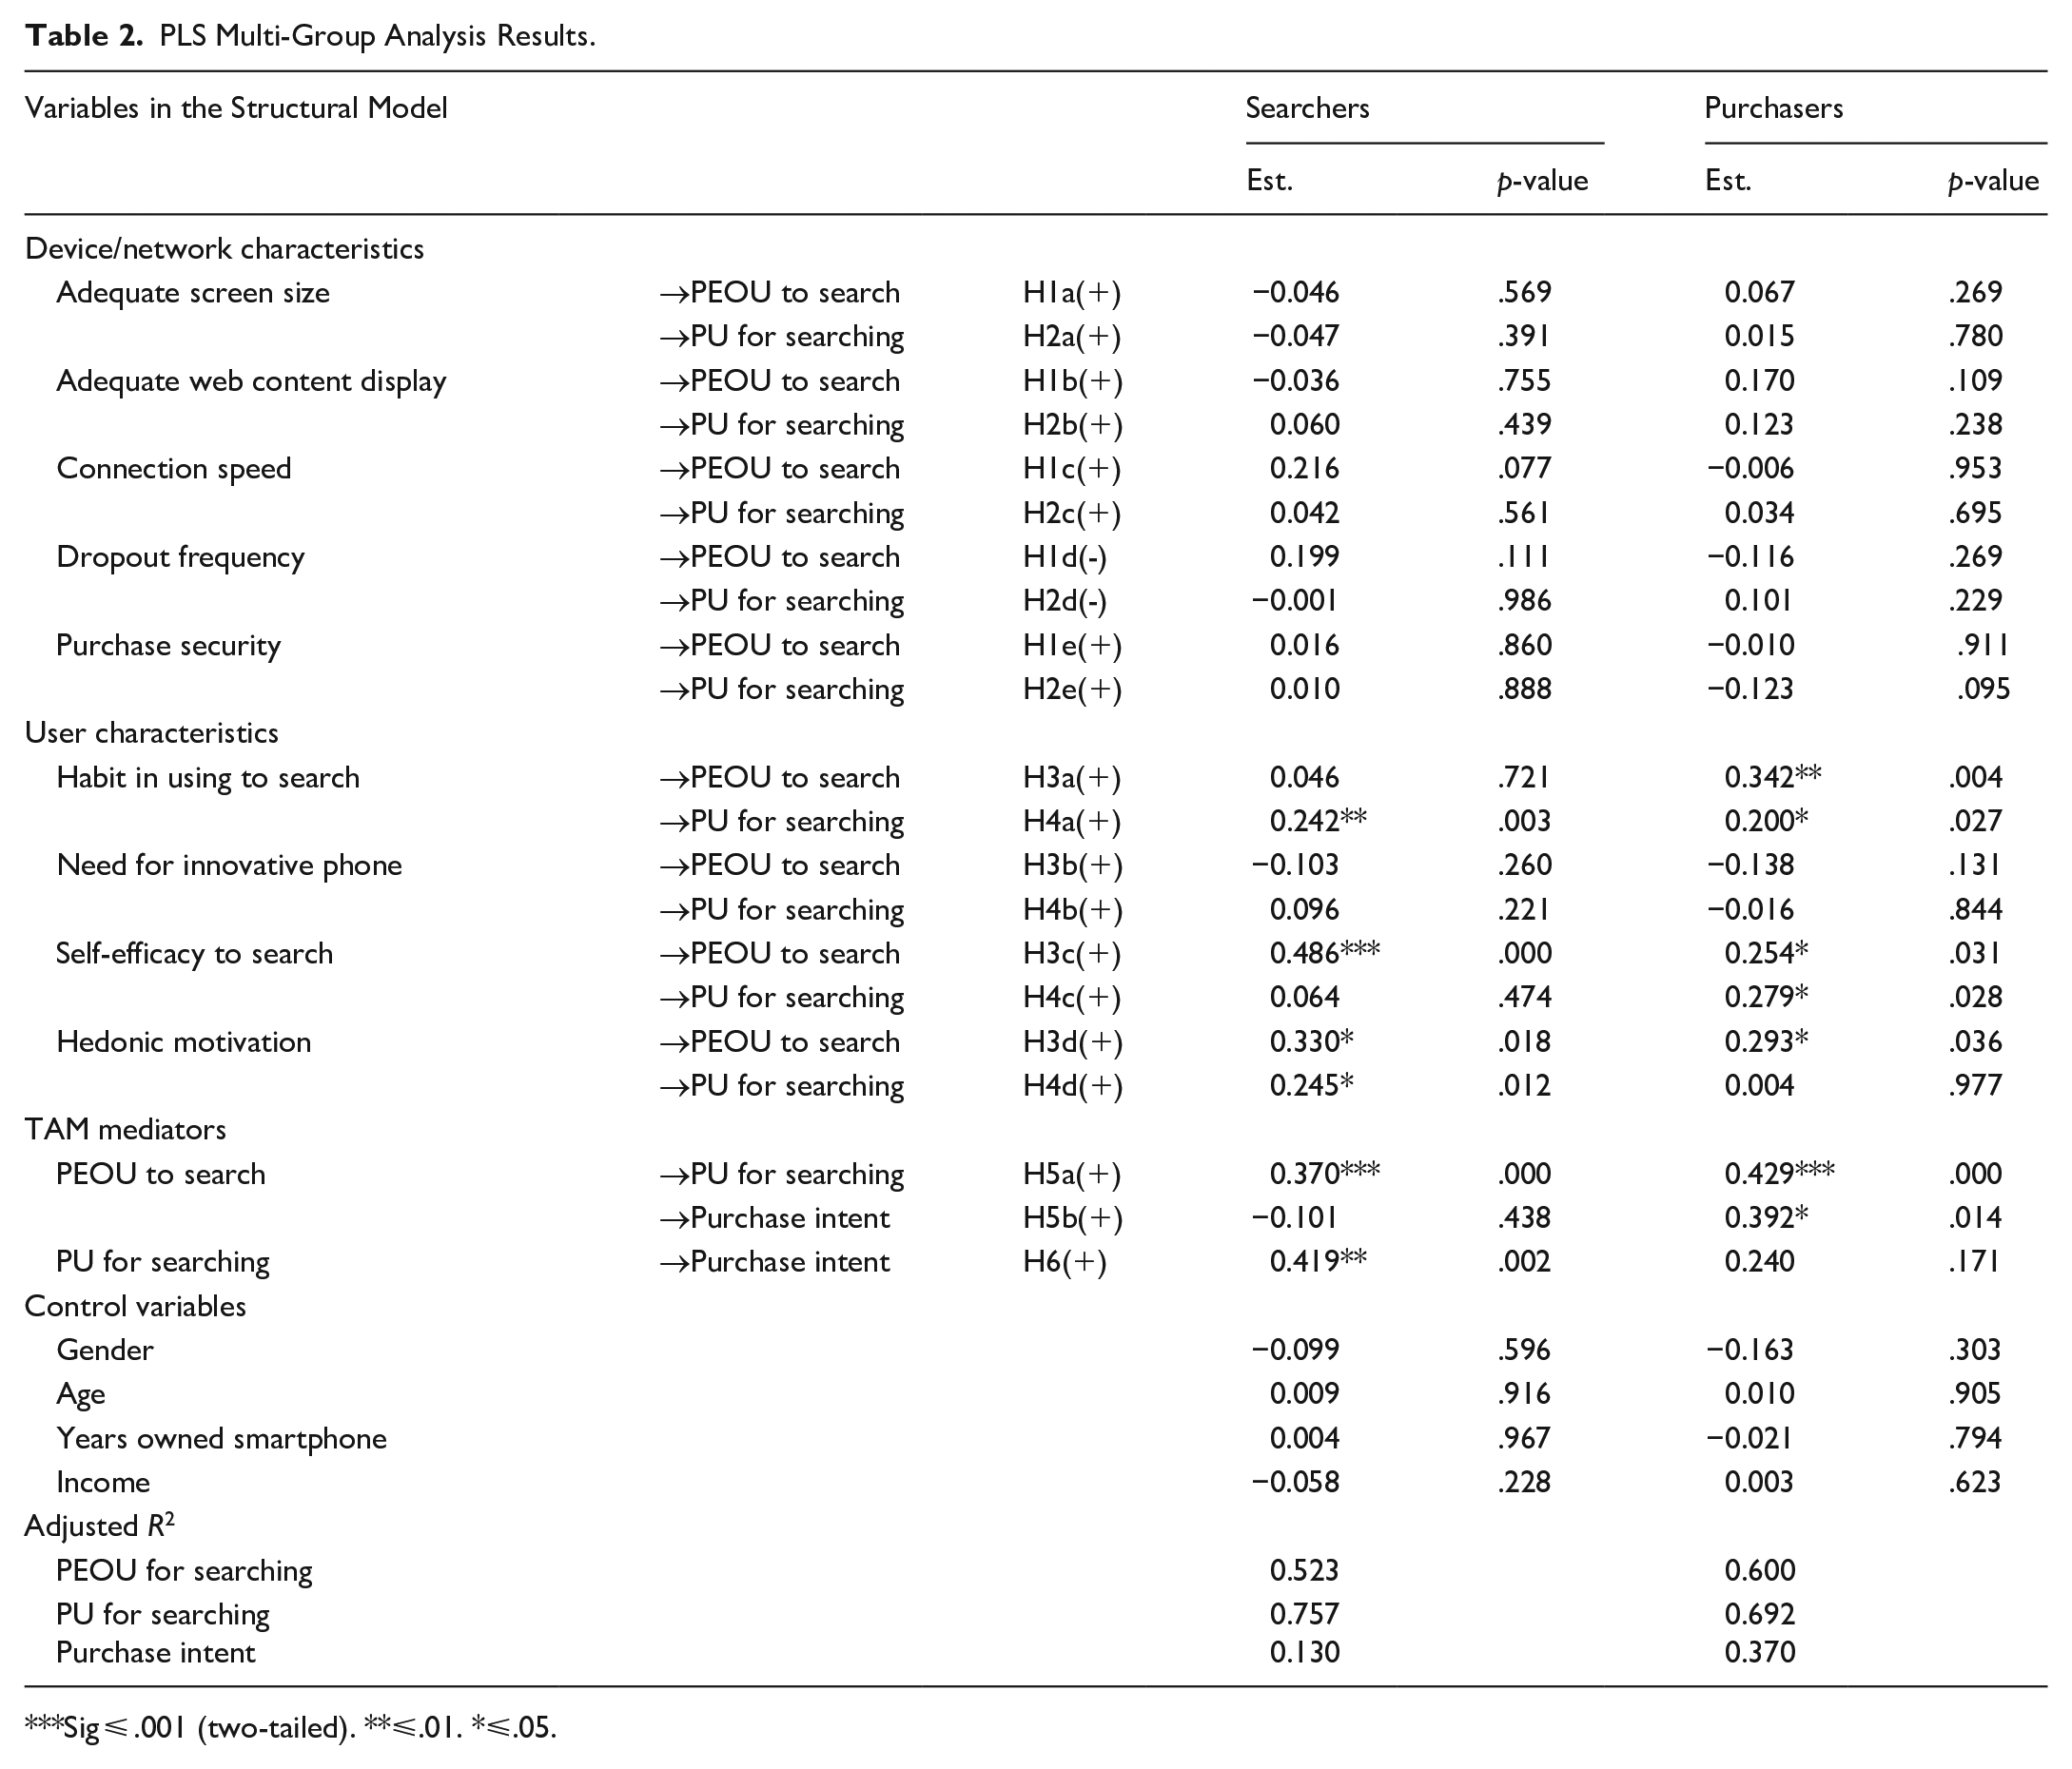
Sig ⩽ .001 (two-tailed). **⩽.01. *⩽.05.
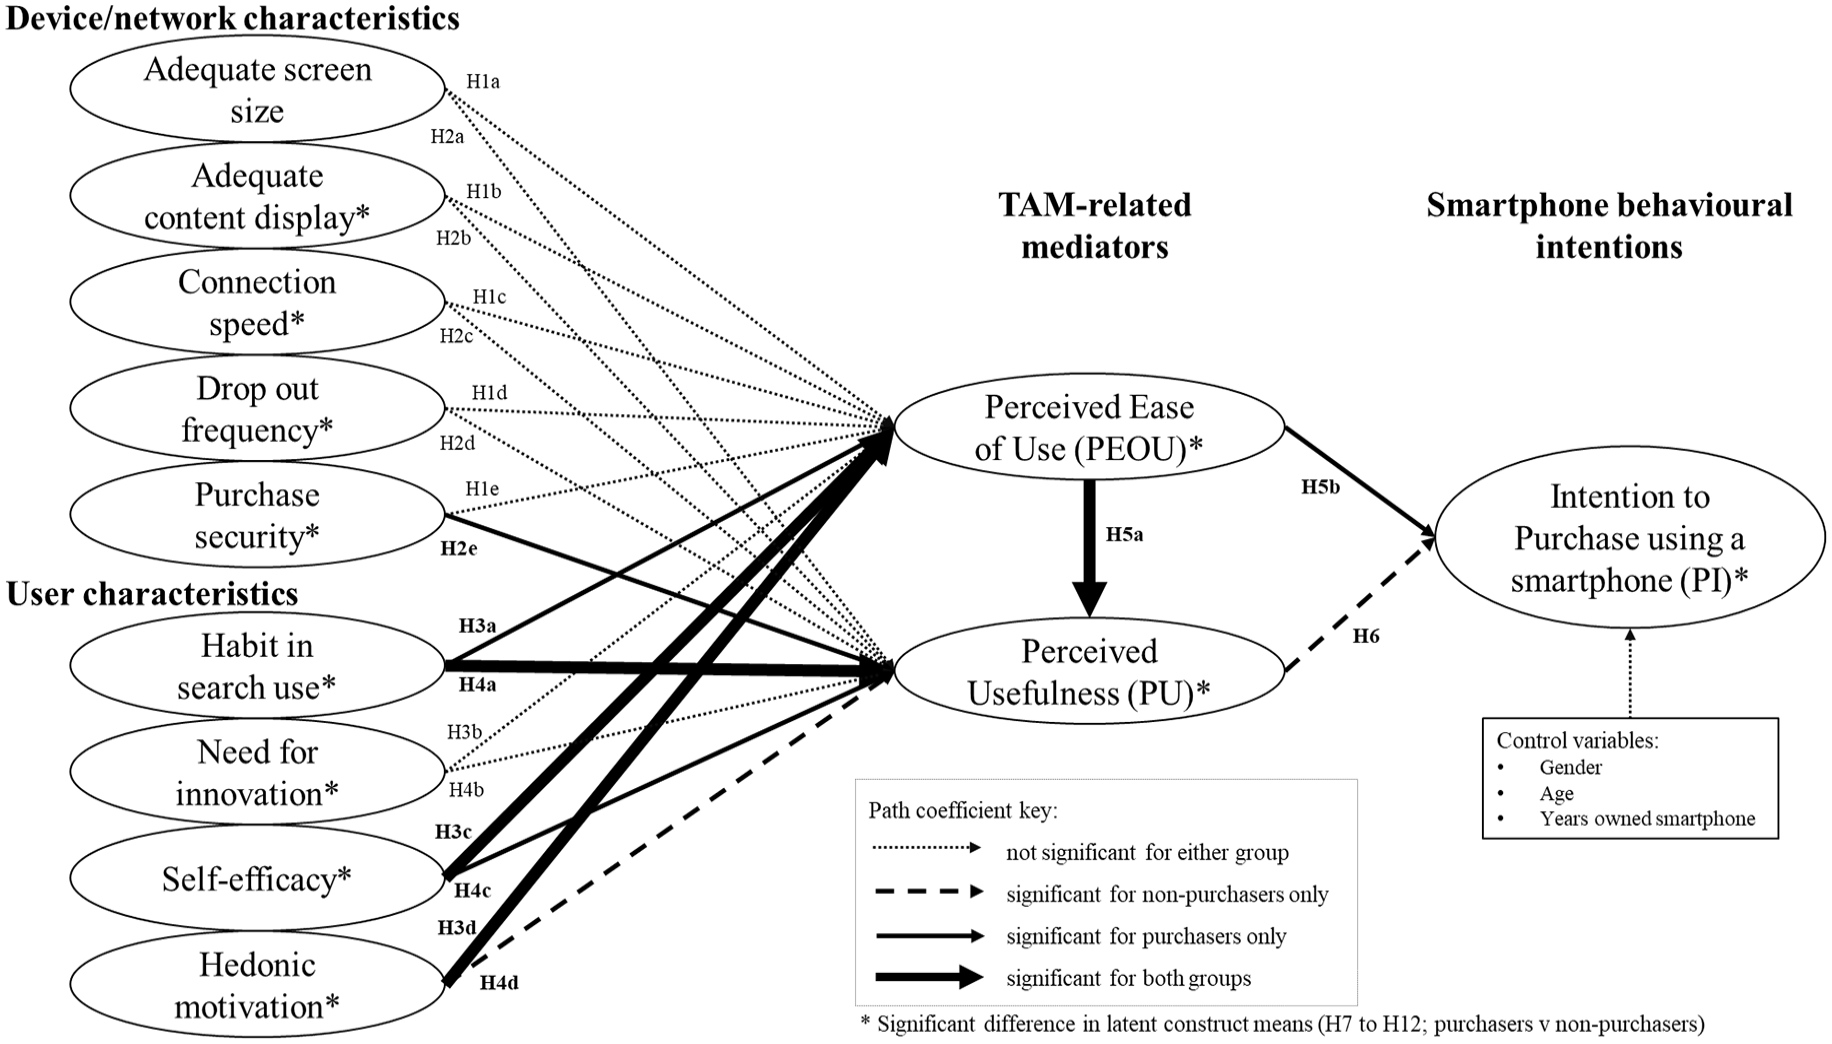
PLS model testing results (purchasers and searchers).
No path coefficients linking the Device/Network characteristics to PEOU or PU were significant for searchers or purchasers, thus H1a to H1e and H2a to H2e are unsupported, contrary to TAM in which device characteristics drive technology adoption (Davis, 1989). Neither of the two Performance Expectations concerning the smartphone device, or the two network Facilitating Conditions affect PEOU or PU, the two key mediators of adoption.
An interesting finding is that both cohorts rate the Device/Network characteristics poorly, below the scale mid-points, with the highest mean below 5 on a 7-point scale. This suggests that users adopt/use their smartphones regardless of these Device/Network inadequacies. In contrast, the User Characteristics strongly predict PEOU and PU, suggesting m-commerce adoption is driven more by users’ ‘wet-ware’, that is, human psychology, than ‘hardware’ that is, Device/Network Characteristics.
Turning first to users’ Habitual use for searching, H3a and H4a predict habit will increase users’ PEOU and PU for searching. Purchasers’ habitual use drives PEOU (β = .0.342, p < .01) and PU (β = .200, p < .01), however, searchers’ habitual use drives PU (β = 0.242, p = 0.027), but not PEOU (β = 0.046, p = 0.721). Users’ Need for the most innovative smartphone does not drive PEOU or PU (H3b and H4b) for purchasers or searchers. In contrast, purchasers’ Self-efficacy to search predicts PEOU (β = 0.254, p = .012) and PU (β = 0.279, p < .05), supporting H3c and H4c. It is worth noting that the effect of self-efficacy on PEOU is much stronger for searchers (β = 0.486, p < .001), the highest beta in our model. Searchers’ self-efficacy, however, does not affect PU for searching (β = 0.064, p = 0.474).
Hedonic motivation strongly influences searchers’ m-commerce adoption (H3d) via PEOU (β = 0.330, p = .018) and (H4d) PU (β = .245, p = .012). For purchasers, however, only H3d is significant (β = 0.293, p = .036). Thus, while hedonic motivation positively influences purchasers’ PEOU, it does not affect their PU (β = 0.004, p = 0.977). Purchasers’ PU is driven by their greater familiarity with smartphones via more habitual use, their self-efficacy, and hedonic motivation to search. This corroborates TAM-based indirect mediation of these antecedents on purchase intention (Davis, 1989).
PEOU strongly drives purchasers’ PU, supporting H5a (β = 0.429, p = .001) and purchase intent (PI), supporting H5b (β = 0.392, p = .014), consistent with TAM treating these variables as key mediators of adoption. Searchers’ PEOU strongly influences PU (β = 0.370, p = .000), but not their PI (β = −0.101, p = 0.438). One explanation for this is that the effect of PEOU on PI is mediated by the PU to search. This demonstrates the importance of PEOU, not only for Purchasers, but also Searchers. For Searchers, PEOU alone is insufficient to drive their Purchase Intent. However, its importance lies in its effect on PU, which strongly drives their Purchase Intent.
In testing this proposition our mediation tests revealed the indirect path between PEOU and PI via PU is significant for searchers (ab = .1672; t = 2.731; p < .001), but the direct path is not (c′ = −.08; t = −.646; p = 0.520) suggesting full mediation (Baron & Kenny, 1986). For purchasers, the indirect path between PEOU and PI via PU was insignificant (ab = .1066; t = 1.444; p = .149) suggesting mediation is absent. As per Table 2, the direct path between PEOU and PI is significant (c′ = .41; t = −2.627; p < .001), thus PU mediates PI for searchers, but does not for purchasers.
Last, H6 linking smartphone PU and Expected/Actual Purchase Intent was strongly supported for searchers (β = 0.419, p < .05), but not purchasers (β = 0.240, p = 0.171). This suggests more expert users such as purchasers regard a smartphone’s PU as ‘given’, and our PU means support this (Mpurch = 5.55, Mnon-purch = 4.58; Mdiff = 0.97; t = 5.76; p < .001). Again, the key variable in m-commerce adoption is PEOU.
The control variables, age, gender, the need for the most innovative smartphone and income were insignificant, corroborating Venkatesh et al. (2012) who found age, gender and experience do not predict behavioural intention in UTAUT or UTAUT2. Users’ income also had no effect on their Intention to Purchase. For robustness we replicated the results for the reflective measures using a covariance-based approach. The results were comparable and offer identical statistical and theoretical conclusions.
In summary, H1 and H2 linking the Performance Expectations and Facilitating Conditions of the Device/Network characteristics to the TAM mediators PEOU (i.e. H1a to H1e) and PU (i.e. H2a to H2e) are unsupported for purchasers or searchers. In contrast, hypotheses relating to User Characteristics (H3a and H4a), linking habitual smartphone use to PEOU and to PU, are supported, as was users’ hedonic motivation to search (H3d and H4d).
Last, H5 and H6 linking the TAM mediators and PI are largely supported with four out of six paths significant. PEOU strongly drives PU for both Purchasers and Searchers, however, PEOU drives Purchasers’ Intention to Purchase using smartphones, but not Searchers’. In contrast, PU for searching strongly influences Searchers’ Intention to purchase but does not affect Purchasers’ Intention to purchase using their smartphones.
Overall, 13 of our 21 hypotheses are supported. To test whether our path coefficients represent real effects we examined their f2 statistics (Chin, 1998; Cohen, 1977). The f2 results reveal that every significant path in our model, for both searchers and purchasers (see Table 2), represents a real effect as revealed by the R2 change. These paths range from small effects, with the lowest f2 result being .023 for Purchasers, and the highest being .239 indicating a very large effect. Similarly, for Searchers, lowest f2 result is .025, and the highest is .328 again indicating a very large effect. Thus, we believe that our structural modelling results are sound.
Comparing purchasers’ and searchers’ psychological ownership
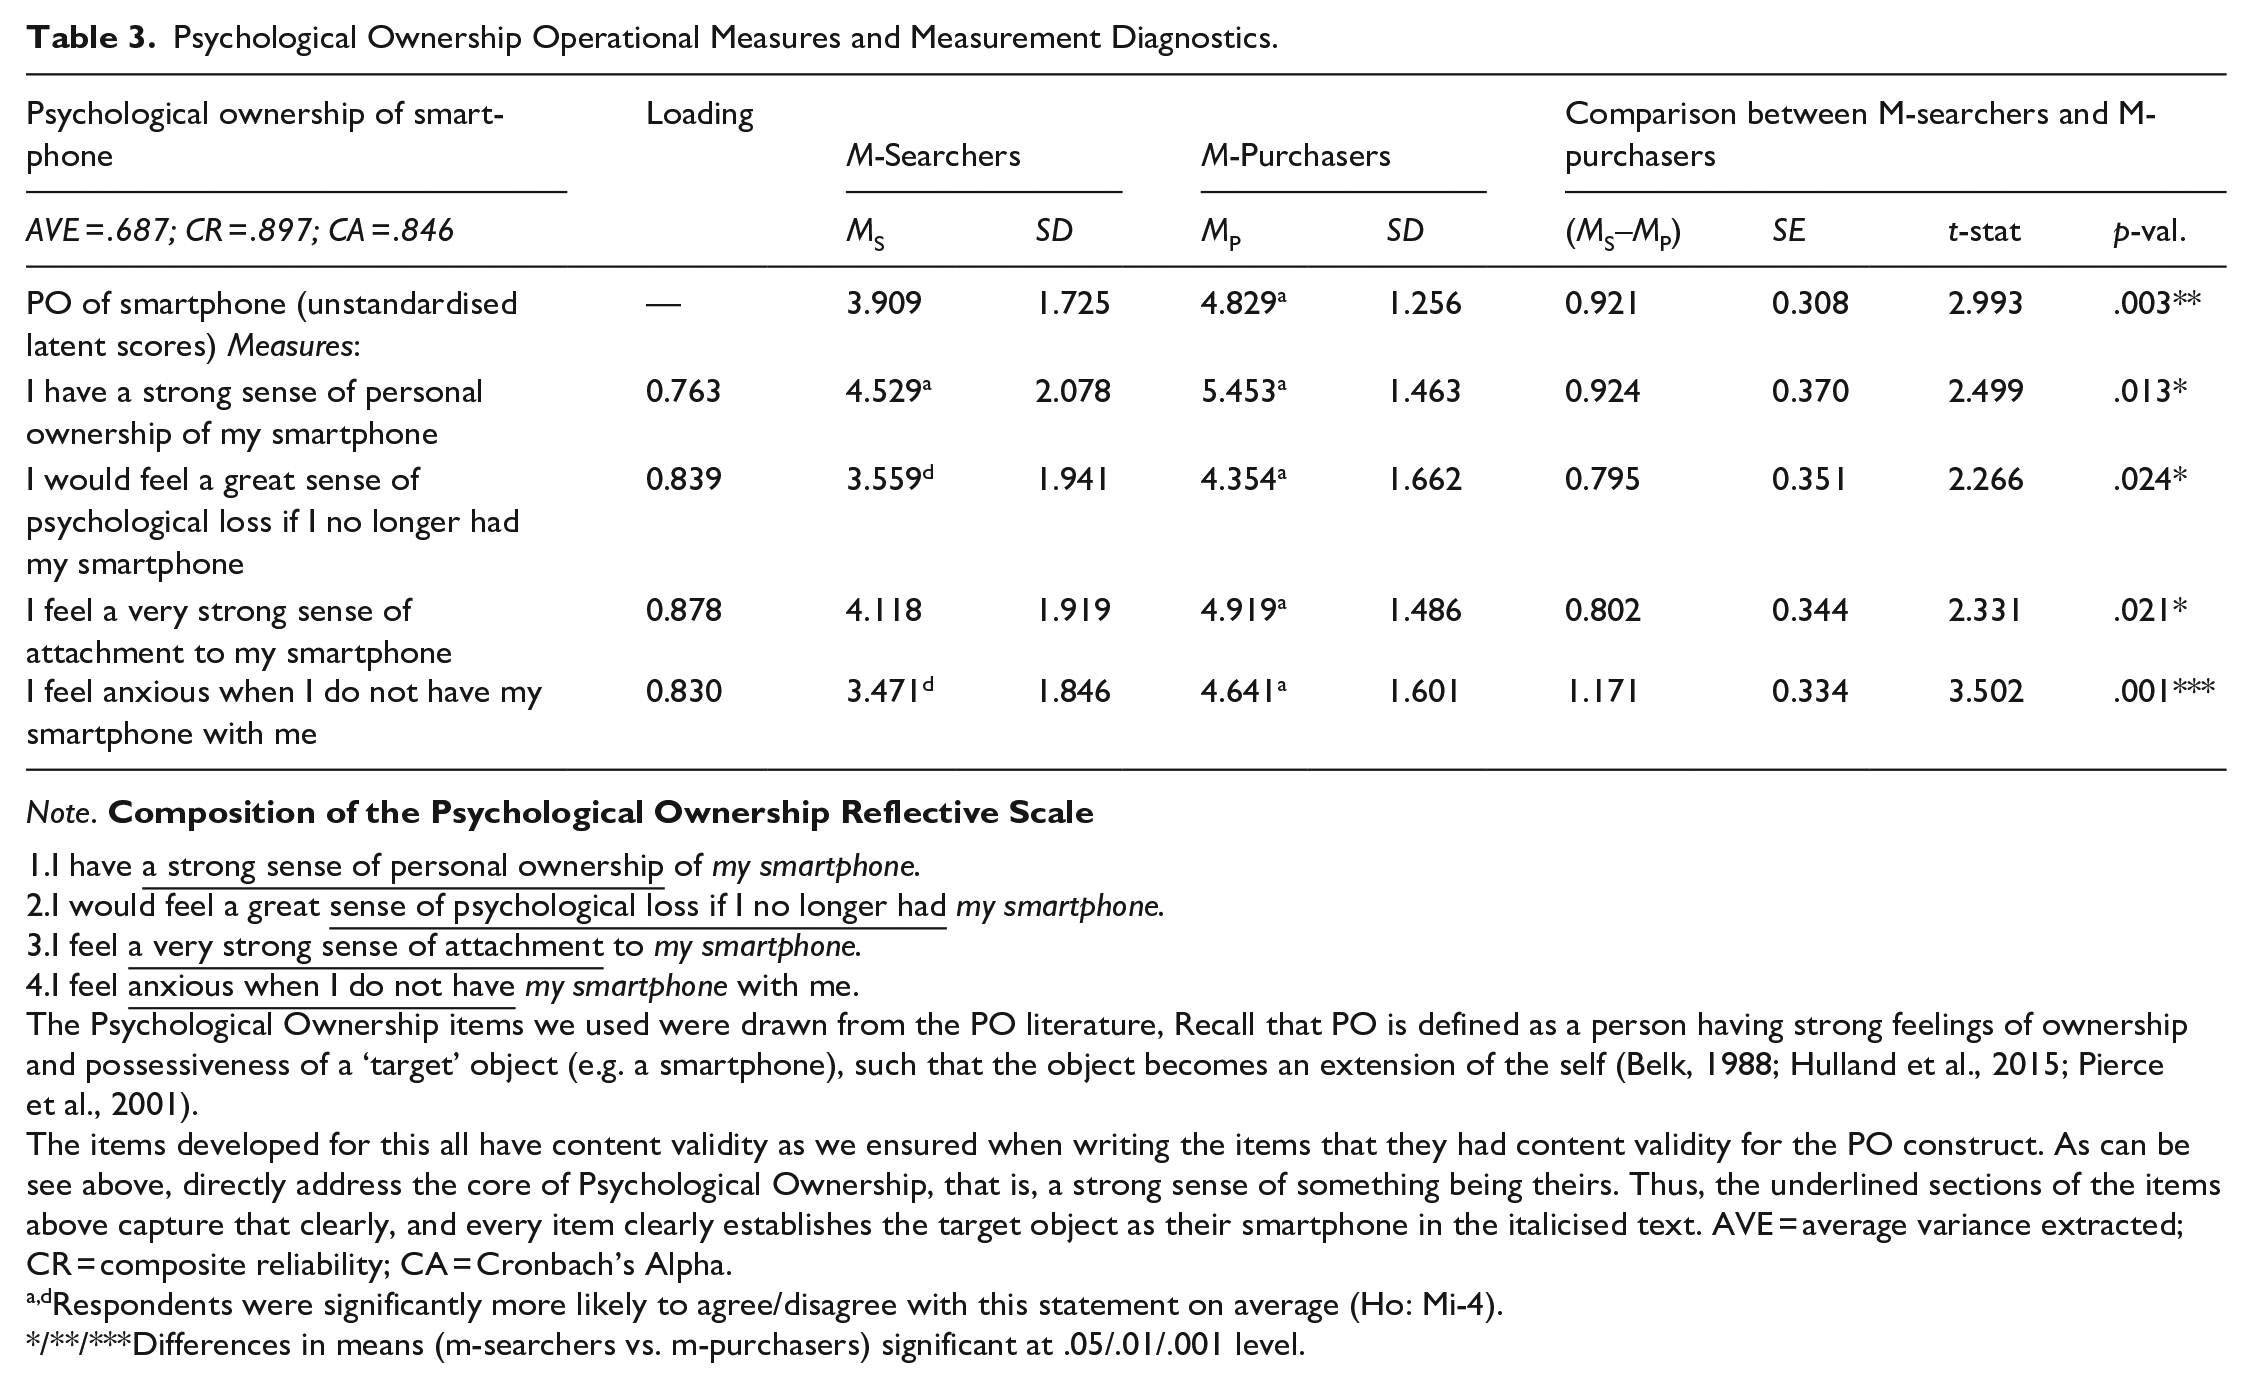
As there are few extant PO scales and none directly applicable to marketing (Hulland et al., 2015) or smartphone contexts, we adapted a reflective multi-item scale for this study (see Table 3). The standardised factor loadings of all PO items are significant, with an AVE of .687 and Composite Reliability of .897; thus, our new scale is valid and reliable.
Psychological Ownership Operational Measures and Measurement Diagnostics.
Note.
I have
I would feel a great
I feel
I feel
The Psychological Ownership items we used were drawn from the PO literature, Recall that PO is defined as a person having strong feelings of ownership and possessiveness of a ‘target’ object (e.g. a smartphone), such that the object becomes an extension of the self (Belk, 1988; Hulland et al., 2015; Pierce et al., 2001).
The items developed for this all have content validity as we ensured when writing the items that they had content validity for the PO construct. As can be see above, directly address the core of Psychological Ownership, that is, a strong sense of something being theirs. Thus, the underlined sections of the items above capture that clearly, and every item clearly establishes the target object as their smartphone in the italicised text. AVE = average variance extracted; CR = composite reliability; CA = Cronbach’s Alpha.
Respondents were significantly more likely to agree/disagree with this statement on average (Ho: Mi-4).
Differences in means (m-searchers vs. m-purchasers) significant at .05/.01/.001 level.
Our results confirm expectations that purchasers’ PO in their smartphone PO is greater than searchers’. Moreover, differences between the latent variable means between these two groups can be explained in part, by differences in PO, which manifest themselves in attitudinal and behavioural differences (see Table 4).
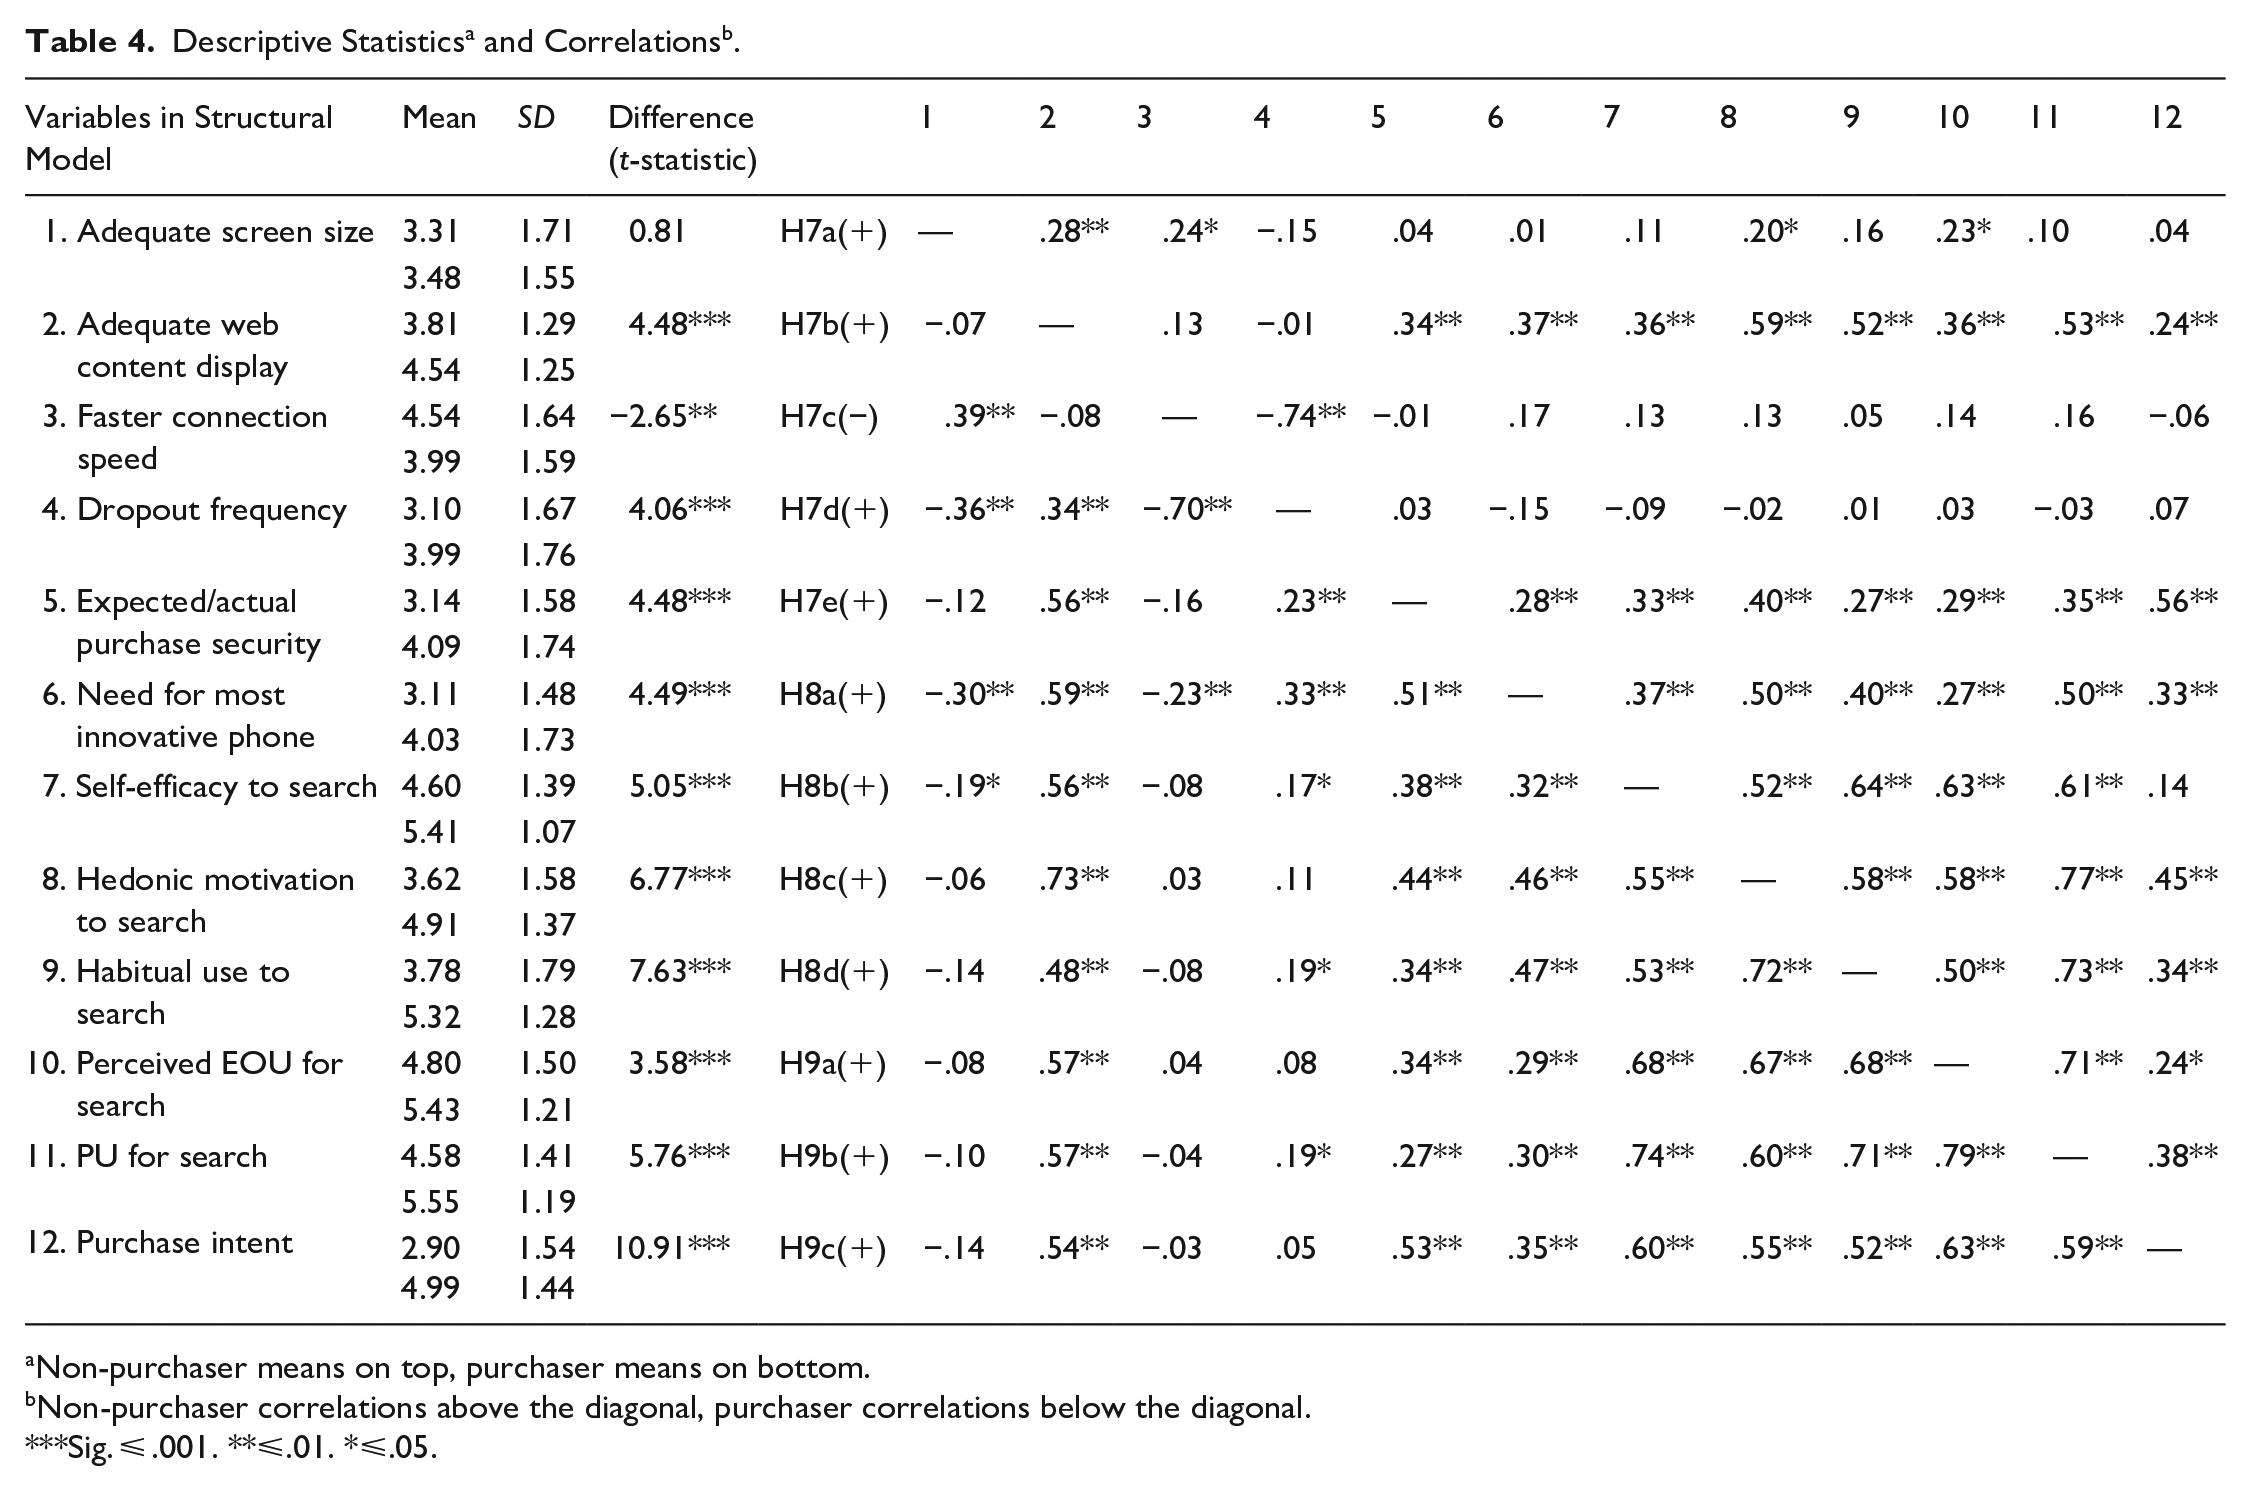
Non-purchaser means on top, purchaser means on bottom.
Non-purchaser correlations above the diagonal, purchaser correlations below the diagonal.
**Sig. ⩽ .001. **⩽.01. *⩽.05.
High efficiency on a device is indicative of higher PO (Pierce et al., 2001), and a key activity for users is organising their smartphone security. Purchasers’ greater expertise, and smartphone knowledge, make it likely they will report more favourable, and more realistic ratings of the Device/Network characteristics than searchers, whose expectations of delivery on such variables may be inflated. As the results below show, we see substantial perceptual gaps between purchasers and searchers on these attribute ratings.
There are differences in the means of all Device/Network Characteristics (supporting H7b through H7e), except the Adequacy of Screen size (H7a). Purchasers rated the adequacy of screen size no worse than searchers (Mpurch = 3.48, Msearch = 3.31; Mdiff = 0.17; t = 0.81; p = 0.418). Indeed, screen size is rated worst by purchasers and searchers, suggesting this attribute is inadequately delivered, regardless of one’s experience in using smartphones.
In contrast, purchasers rate Adequacy of Web Content display better than searchers, as per H7b (Mpurch = 4.54, Msearch = 3.81; Mdiff = 0.73; t = 4.48; p < .001). Similarly, in our reverse-coded variable, purchasers rate connection speeds better than searchers, as per H7c (Mpurch = 3.99, Msearch = 4.54; Mdiff = −0.55; t = −2.65; p < .01). Dropout Frequency is also rated better, consistent with H7d (Mpurch = 3.99, Msearch = 3.10; Mdiff = 0.89; t = 4.06; p < .001), as is Expected/Actual Purchase Security (Mpurch = 4.09, Msearch = 3.14; Mdiff = 0.95; t = 4.48; p < .001) providing support for H7e.
Turning to differences in the User Characteristics, H8a regarding purchasers having a higher Need for the Most Innovative Smartphone is supported (Mpurch = 4.03, Msearch = 3.11; Mdiff = 0.92; t = 4.49; p < .001), consistent with them being more experienced users of m-commerce. Purchasers’ Self-efficacy is also higher than searchers as per H8b (Mpurch = 5.41, Msearch = 4.60; Mdiff = 0.81; t = 5.05; p < .001), and this result, combined with the results of the PLS MGA, suggests self-efficacy is one of the key variables driving m-commerce adoption.
Given their higher PO, we expect purchasers will have more stimulating and rewarding experiences using their smartphone (Pierce & Jussila, 2011) and report higher Hedonic motivation to search than searchers’. Our results confirm this difference in H8c (Mpurch = 4.91, Msearch = 3.62; Mdiff = 1.29; t = 6.77; p < .001).
In addition, consistent with purchasers’ early m-commerce adoption, they Habitually Use smartphones to search more than searchers; hence, H8d is supported (Mpurch = 5.32, Msearch = 3.78; Mdiff = 1.54; t = 7.63; p < .001).
Given their greater knowledge and heavier smartphone use, purchasers should rate smartphones Easier to Use than searchers (H9a), and our results support this (Mpurch = 5.43, Mnon-purch = 4.80; Mdiff = 0.63; t = 3.58; p < .001). Similarly, purchasers rate their Perceived Usefulness to search higher than searchers (Mpurch = 5.55, Mnon-purch = 4.58; Mdiff = 0.97; t = 5.76; p < .001), supporting H9b.
Last, the largest difference we observed between these cohorts is their Actual/Expected Intention to Purchase using their smartphone. Purchasers’ Actual intention is much greater than searchers’ Expected intention (Mpurch = 4.99, Mnon-purch = 2.90; Mdiff = 2.09; t = 10.91; p < .001), supporting H9c. Searchers’ Expected Purchase intention is well below the mid-point of the scale, indicating a significant barrier to their m-commerce adoption. This mirrors industry data, and as mentioned earlier, while m-commerce is not new, the market penetration of m-commence is still surprisingly low. In 2022, 62% of Australian consumers reported using their smartphone to shop online, thus almost 40% of users are still reluctant to use m-commerce.
An important conclusion from our study is not simply that these differences in Searcher and Purchaser means are substantial, but that influencing those means is managerially actionable, and will be discussed in a subsequent section.
Theoretical implications
Our study has several theoretical implications. First, our use of both UTAUT2 and TAM in our study reaffirms their usefulness as frameworks to examine technology adoption. UTAUT2 specifies a range of important variables driving adoption, including those relating to the product itself such as performance expectations about the device, conditions facilitating m-commerce adoption, and importantly, user characteristics such as hedonic motivation, and habitual use.
Our inclusion of the TAM mediators also provided important insights, revealing the route to Intention to Purchase is different for Searchers and Purchasers, but that PEOU is the pivotal mediator for both cohorts. Our decision to explicitly examine both the Device/Network characteristics and User Characteristics allowed us to uncover an important counterintuitive result, that is, that none of the Device/Network characteristics influence adoption. In contrast, the User Characteristics are powerful drivers of m-commerce adoption. Last, we add to the few studies to operationalise PO, herein within a smartphone context, and offer a new scale with excellent measurement properties to provide a starting point for scholars wishing to investigate this construct further.
Next, and consistent with Rogers’ (1995) DoI, there are substantial differences between early and late m-commerce adopters. We provide empirical evidence of barriers remaining to transitioning searchers into purchasers. Our study improves our understanding of m-commerce adoption via three conceptual lenses – UTAUT2, TAM and PO – providing a rich analysis of this phenomenon. We find major differences between searchers and purchasers in ease of use, usefulness and the intention to use their smartphone to search. There are also large differences in their ratings of the Device/Network characteristics, but contrary to TAM3 (Venkatesh & Bala, 2008), these do not drive m-commerce adoption; that role is, instead, explained by the User Characteristics.
In addition, we show how Psychological Ownership theory can inform m-commerce adoption. We reveal that smartphones are a product category that engenders high levels of PO among purchasers, who are more psychologically connected to their smartphone than searchers. Moreover, they are able to ignore Device/Network inadequacies, and are not influenced by PEOU in m-purchase intentions. This suggests there may be merit in increasing smartphone users’ PO, to facilitate m-commerce adoption.
Last, we reveal that smartphones may be associated with another form of purchase deferral to those offered in the literature (e.g. Dhar, 1997; Greenleaf & Lehmann, 1995) such as retailers being out-of-stock, overwhelming assortment sizes, lack of product information and time pressure (e.g. Huffman & Kahn, 1998). We address this issue below in the Managerial Implications.
Managerial implications
Our results provide managerially actionable insights. First, purchasers and searchers accept poor Device/Network performance, but despite this, the utility gained from smartphone use compensates for these Device/Network problems (Davis, 1989; Mick & Fournier, 1998). None of the Device/Network attributes in our model influence users’ PEOU or PU for searching. This is unexpected given they are drivers of adoption in general (Agrebi & Jallais, 2015) and m-commerce (Mahatanankoon & Vila-Ruiz, 2007; Venkatesh & Bala, 2008, Wong & Hsu, 2008). Instead, our evidence shows that smartphone Device/Network performance is sufficient to support adoption, and focusing only on these attributes to stimulate m-commerce adoption is likely to be sub-optimal.
In contrast, user characteristics strongly influence m-commerce adoption via PEOU and PU. Our findings suggest value in promoting users’ self-efficacy in using the smartphone, encouraging more habitual use of their smartphone to search and increasing the hedonic rewards for potential m-commerce adopters by making m-commerce more entertaining and enjoyable.
Importantly, searchers’ scores on all three variables are much lower than purchasers’, and there is merit in not only providing users with simple clear communications explaining how to use smartphone features that users find difficult, but also improve the hedonic experience of m-commerce use. Similarly, users’ self-efficacy can be increased by retailers by leading or improving consumers’ education (Wernerfelt, 1996). In practice, efforts by some online retailers to offer overviews or tutorials for new visitors identified via cookies, to increase users’ self-efficacy has merit.
Smartphone manufacturers could drive searchers’ m-commerce adoption via advertisements demonstrating the usefulness and ease of use of smartphones in m-commerce. The inherent satisfaction from having made a purchase should reinforce and offer experiential evidence that m-commerce is simple and satisfying, and offers usability and usefulness. This could be done via guided and assisted in-store demonstrations of smartphone apps and associated in-store kiosks to facilitate online ordering (e.g. Gao & Su, 2018) to reduce complexity and promote adoption (Rogers, 1995). This is particularly relevant as some consumers are using e-commerce for the first time because of the COVID-19 pandemic (Soper, 2020).
Other approaches include demonstrations of the ease of use and usefulness of smartphones in general, but also of specific smartphone uses, in instructional advertisements, or verbal reassurances, such as congratulating online users on successfully completing a transaction (Jiang & Benbasat, 2007; C. H. Park & Kim, 2003). Likewise, expert users could be engaged to educate novices via advertisements, social media, word-of-mouth, reviews and chatrooms. Some retailers manage this via user discussion groups to manage frequently asked questions about troubleshooting, completing searches or purchases, and facilitating virtual communities to create ‘word of mouse’ (de Valck et al., 2009). Other solutions include changing the usefulness of searching by extending and improving decision aids, allowing sorting or filtering large assortments to manageable consideration sets (Häubl & Trifts, 2000).
Other companies have used in-store retail technologies for facilitating payments and product collection (e.g. ‘click and collect’), but also providing easier access to product information (e.g. barcode apps; iTerminals) and alerting consumers to offers and discounts when in the retailers’ vicinity (Rese et al., 2019). Our results indicate that these initiatives should increase user self-efficacy and in turn, facilitate m-commerce adoption.
Our results confirm the importance of hedonic motivation in converting smartphone users to m-commerce, thus searching and purchasing should be a pleasurable experience (Davis, 1989). Consumers’ hedonic motivations are often overlooked, and in a smartphone context former Vice President of mobile at eBay, Steve Yankovich, noted: ‘From image recognition and bar code scanning to push alerts and geofencing, the technologies packed in these mobile phones are all prime opportunities for retailers to make shopping fun, relevant and easy’ (Siwicki, 2012).
Our findings suggest that recommendation agents – and virtual decision aids designed to identify consumer preferences and to suggest products for consideration – should not only assist and simplify users’ search, but do so in a way that increases consumers’ pleasure from providing input or receiving such recommendations (Xiao & Benbasat, 2007).
In the context of smart retail stores (e.g. enabling shopping using apps and a smart basket), Roy et al. (2019) found hedonic aspects of the retail experience significantly improved co-creation experiences, brand equity and word-of-mouth intentions. Similarly, branded apps focusing on utilitarian outcomes, and offering entertainment value are associated with a higher willingness to pay for such apps (Stocchi et al., 2018). Our study reinforces the viewpoint that retailers and brands should continue investments in smartphone technologies to offer not only function, but also fun to satisfy users’ hedonic needs.
The underlying dimensions of PO offer new insights into how to influence adoption. PO involves efforts on the part of users to intimately know their devices. Given this, smartphone designers should ensure these devices are easy to use. Our structural modelling results clearly suggest that PEOU is the key variable mediating Intention to Purchase, not only for Purchasers, but more importantly, for Searchers.
Users with high PO in their smartphones have and do spend more time and effort learning about their smartphones. These efforts help them build a ‘home territory’ or personalised space, offering psychic security and comfort (Jussila et al., 2015; Pierce et al., 2001), and satisfy users’ need for stimulation and arousal (Pierce & Jussila, 2011). Smartphones are an ideal device for achieving these ends, thus adding or improving smartphone functions that satisfy these needs should help transition reluctant users to m-commerce.
As reported earlier, there are large differences between purchasers’ and searchers’ habitual use of their smartphones. Purchasers habitually use their smartphones to search more than searchers, hence searchers do not reach the same level of effectance and efficiency in using their smartphone. This is consistent with Searchers low rating of Perceived Usefulness (Mean = 4.58, SD = 1.41). Recall that Searchers Intention to Purchase is not directly influenced by PEOU. Rather, their ITP is influenced indirectly, via the important link between PEOU and PU. As such, it is vital that Searchers perceive the smartphone is useful, as a vital step in transitioning them to m-commerce.
Another important finding is that smartphones remain a secondary device for searching and purchasing. As shown in Table 5 below, Searchers prefer to use a PC or a laptop (84%) rather than a smartphone device (4%). Similarly, purchasers prefer to search using a PC or laptop (61%) rather than to search using a mobile device (29%). In addition, an overwhelming proportion of consumers prefer to search from home (79%) rather than while shopping (22%). This indicates smartphones are less preferred than other devices for both cohorts, and that e-commerce is more attractive when undertaken at home rather than outside the home.
Use of Smartphone Device (Frequency, Location and Preference).
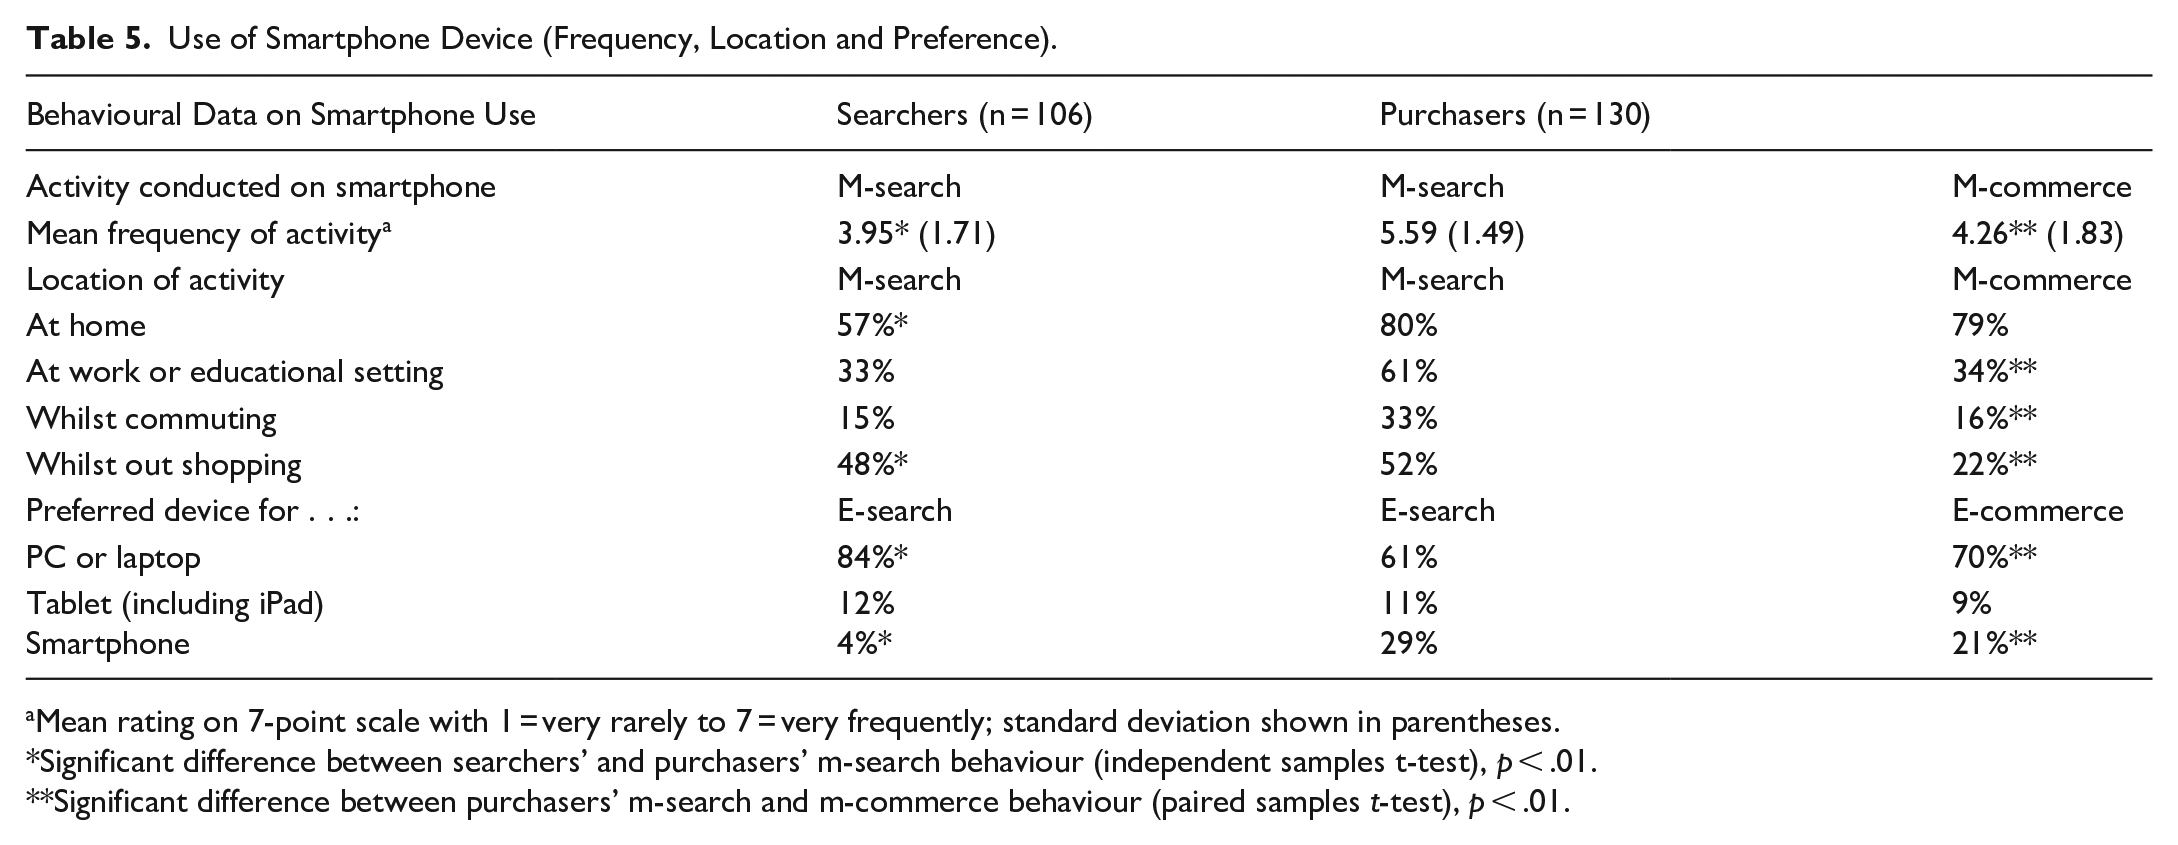
Mean rating on 7-point scale with 1 = very rarely to 7 = very frequently; standard deviation shown in parentheses.
Significant difference between searchers’ and purchasers’ m-search behaviour (independent samples t-test), p < .01.
Significant difference between purchasers’ m-search and m-commerce behaviour (paired samples t-test), p < .01.
These figures parallel market data, with conversion rates for purchases made via tablets, desktops, and smartphones among online shoppers worldwide in 2020 being 3.41%, 2.59% and 1.86%, respectively (Statista, 2021). A related issue is that 61% of m-commerce users search for products at work or in educational settings using their smartphone, but only 34% use it to purchase. Thus, potential delays in decision-making occur in this channel as consumers search via smartphone, but wait to access their laptop to finalise purchases. For retailers, such delays are concerning, leading to a loss of custom to competitors’ offerings or a loss from purchase abandonment (Dhar, 1997).
Hence the transition from m-search to m-commerce represents an additional form of choice deferral to those offered in the literature (e.g. Dhar, 1997; Greenleaf & Lehmann, 1995). Much work on choice deferral focuses on explanations regarding product choices and the impact of retailers being out-of-stock, overwhelming assortment sizes, lack of product information and time pressure (e.g. Huffman & Kahn, 1998). However, our study provides another explanation for consumers’ delaying decision-making, that is, smartphones are currently unacceptable for many consumers to use for purchasing online.
Retailers need to manage deferral by understanding and offering multiple channels for consumers to search and purchase products enabling them to use both online (e.g. desktop, smartphone) and bricks-and-mortar (Chang & Burke, 2007) channels. This would involve integrated omnichannel solutions that maintain customer engagement over the decision-making process and over multiple channels (Prahalad & Ramaswamy, 2000).
Solutions include locking consumers into the initial selection made on their smartphones, to later re-access that selection on another device. This could involve a transferrable shopping cart accessed via membership, registered log-in or facilitated by an app. Alternatively, retailers could encourage extended consumer loyalty by building social or structural bonds. This could include discounts for customers in loyalty programs, sending greeting cards or gifts on special occasions, and customised services or products from the e-tailer (Hsieh et al., 2005). Similarly, some firms attempt to reduce m-commerce ‘friction’ via a ‘buy button’ alongside internet searches to move the consumer through the m-commerce adoption process (Lipsman, 2015).
Last, our findings show intent to purchase using a smartphone takes different paths for purchasers and searchers. Consistent with TAM (Davis, 1989) the impact of PEOU on purchase intent for searchers was fully mediated through its impact on PU for searching. Thus, the key to searchers’ transition to m-commerce is the TAM mediator, PEOU. Higher PEOU strongly drives searchers’ PU, which in turn strongly drives their Intention to Purchase. Thus, searchers’ low PEOU will reduce PU, and in turn, Intention to Purchase.
For purchasers, PEOU directly influences purchase intent and PU for search, however, the link between PU and purchase intent was not significant. Purchasers already rate PU for search highly, and increasing perceived usefulness would not affect purchase intentions. This highlights the importance of PEOU in driving purchase intent for both purchasers and searchers.
Limitations and directions for future research
This study has various limitations, including our choice of Device/Network characteristics. Our selection was guided by the literature and by our qualitative research. Despite their excellent measurement properties, the variables had no statistically significant effect on PEOU or PU. Future research could identify and investigate other salient Device/Network characteristics.
We also focused on individual rather than joint decisions. Future research could examine specific influences such as social norms to account for individuals’ roles in joint purchase decision-making (Malhotra & Galletta, 1999). One reason for purchase deferral may be that consumers need to discuss purchases with a partner, delaying purchases until both parties jointly review options using devices viewable by both simultaneously (e.g. home computer). Future research could more thoroughly investigate these contextual issues.
It would also be useful to explore whether the product category heightens the effects of some variables. For example, security concerns may be greater for financial products or high-involvement items. Similarly, users’ concerns about screen size may be more salient for visually intricate products or those with considerable detail to evaluate, with many terms, conditions or features to assess (Roberts et al., 2014). The framework and associated measures developed here provide a basis for these and further extensions.
It would have been useful to test for endogeneity using two stage least squares with instrumental variables. However upon examination, there were no suitable instrumental variables in our dataset to be used as instruments, and is a potential limitation of our study. We did however test a series of structural models, of increasing complexity, and found no unusual beta coefficient nor r2 changes that would suggest endogeneity was a problem. Future research could build suitable instrumental variables into the study from the outset.
Finally, PO theory was introduced to explain users’ m-commerce adoption. PO is seldom examined in the literature despite its promise to improve theoretical insights within technology contexts (Hulland et al., 2015). As Belk (2013, p. 477) notes: ‘. . .the current wave of digital technologies is fundamentally changing consumer behaviour in ways that have significant implications for the formulation of the extended self. It’s time for an update’.
Footnotes
Appendix
Operational Measures.
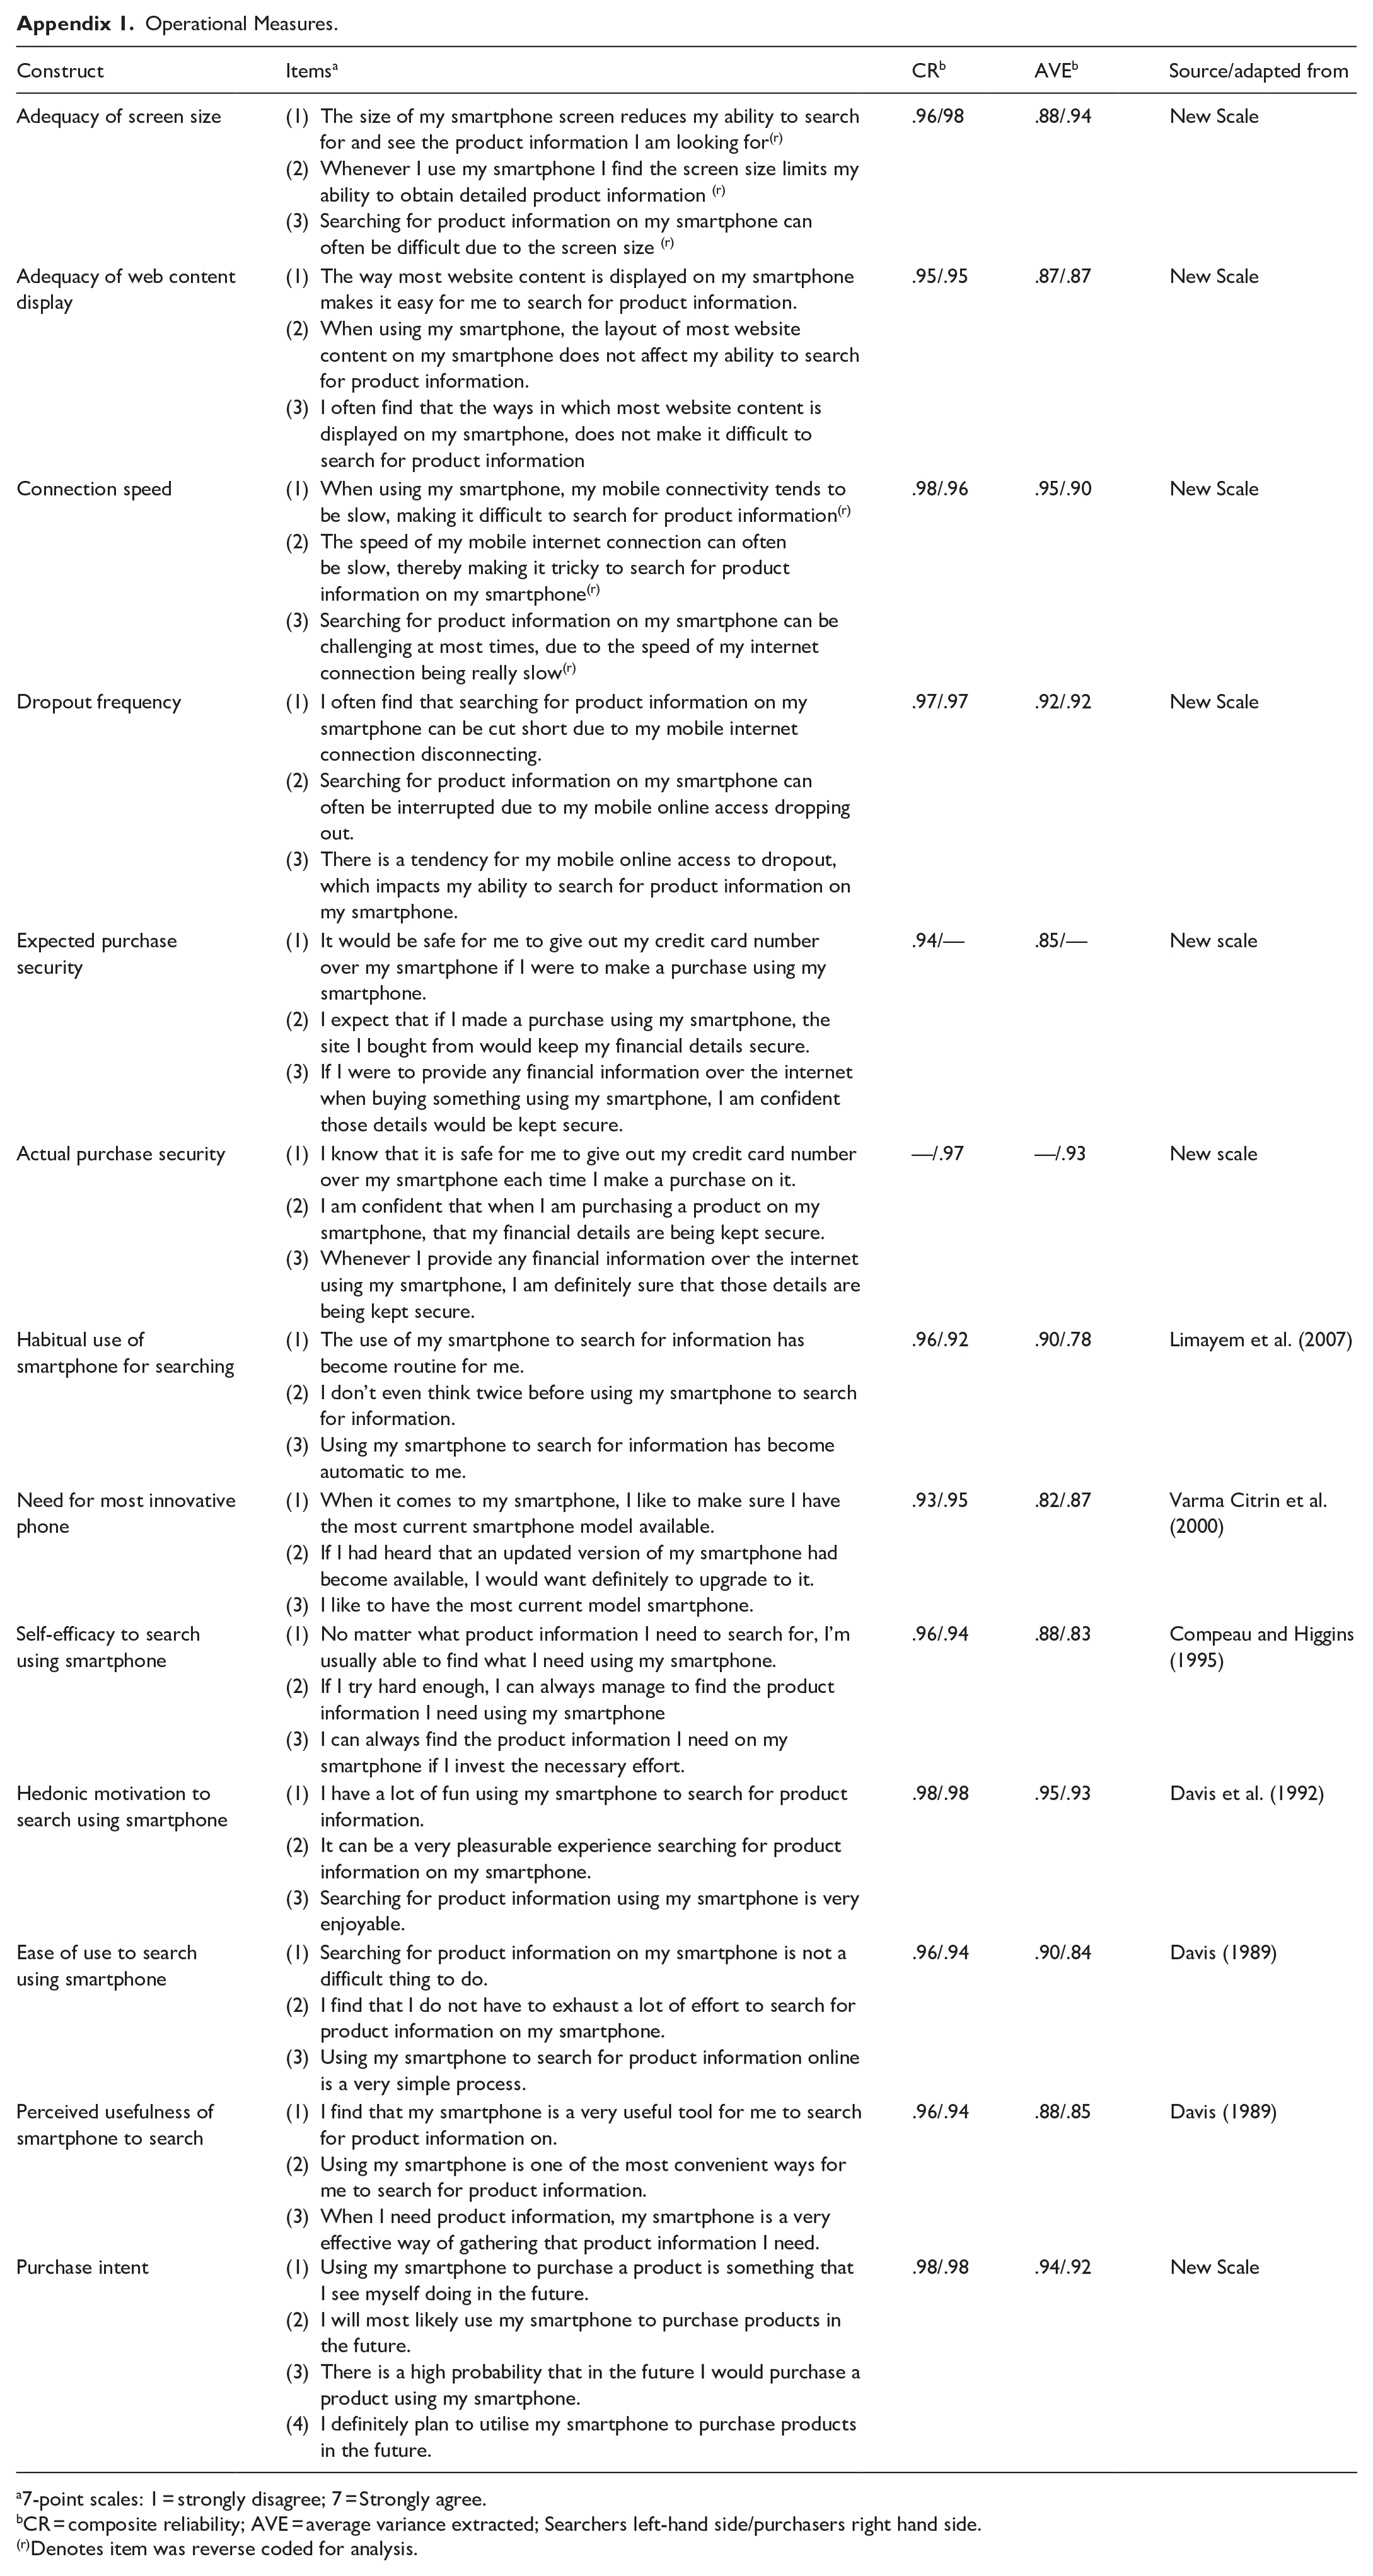
| Construct | Items a | CR b | AVE b | Source/adapted from |
|---|---|---|---|---|
| Adequacy of screen size | (1) The size of my smartphone screen reduces my ability to search for and see the product information I am looking for
(r)
(2) Whenever I use my smartphone I find the screen size limits my ability to obtain detailed product information (r) (3) Searching for product information on my smartphone can often be difficult due to the screen size (r) |
.96/98 | .88/.94 | New Scale |
| Adequacy of web content display | (1) The way most website content is displayed on my smartphone makes it easy for me to search for product information. (2) When using my smartphone, the layout of most website content on my smartphone does not affect my ability to search for product information. (3) I often find that the ways in which most website content is displayed on my smartphone, does not make it difficult to search for product information |
.95/.95 | .87/.87 | New Scale |
| Connection speed | (1) When using my smartphone, my mobile connectivity tends to be slow, making it difficult to search for product information
(r)
(2) The speed of my mobile internet connection can often be slow, thereby making it tricky to search for product information on my smartphone (r) (3) Searching for product information on my smartphone can be challenging at most times, due to the speed of my internet connection being really slow (r) |
.98/.96 | .95/.90 | New Scale |
| Dropout frequency | (1) I often find that searching for product information on my smartphone can be cut short due to my mobile internet connection disconnecting. (2) Searching for product information on my smartphone can often be interrupted due to my mobile online access dropping out. (3) There is a tendency for my mobile online access to dropout, which impacts my ability to search for product information on my smartphone. |
.97/.97 | .92/.92 | New Scale |
| Expected purchase security | (1) It would be safe for me to give out my credit card number over my smartphone if I were to make a purchase using my smartphone. (2) I expect that if I made a purchase using my smartphone, the site I bought from would keep my financial details secure. (3) If I were to provide any financial information over the internet when buying something using my smartphone, I am confident those details would be kept secure. |
.94/— | .85/— | New scale |
| Actual purchase security | (1) I know that it is safe for me to give out my credit card number over my smartphone each time I make a purchase on it. (2) I am confident that when I am purchasing a product on my smartphone, that my financial details are being kept secure. (3) Whenever I provide any financial information over the internet using my smartphone, I am definitely sure that those details are being kept secure. |
—/.97 | —/.93 | New scale |
| Habitual use of smartphone for searching | (1) The use of my smartphone to search for information has become routine for me. (2) I don’t even think twice before using my smartphone to search for information. (3) Using my smartphone to search for information has become automatic to me. |
.96/.92 | .90/.78 | Limayem et al. (2007) |
| Need for most innovative phone | (1) When it comes to my smartphone, I like to make sure I have the most current smartphone model available. (2) If I had heard that an updated version of my smartphone had become available, I would want definitely to upgrade to it. (3) I like to have the most current model smartphone. |
.93/.95 | .82/.87 | Varma Citrin et al. (2000) |
| Self-efficacy to search using smartphone | (1) No matter what product information I need to search for, I’m usually able to find what I need using my smartphone. (2) If I try hard enough, I can always manage to find the product information I need using my smartphone (3) I can always find the product information I need on my smartphone if I invest the necessary effort. |
.96/.94 | .88/.83 | Compeau and Higgins (1995) |
| Hedonic motivation to search using smartphone | (1) I have a lot of fun using my smartphone to search for product information. (2) It can be a very pleasurable experience searching for product information on my smartphone. (3) Searching for product information using my smartphone is very enjoyable. |
.98/.98 | .95/.93 | Davis et al. (1992) |
| Ease of use to search using smartphone | (1) Searching for product information on my smartphone is not a difficult thing to do. (2) I find that I do not have to exhaust a lot of effort to search for product information on my smartphone. (3) Using my smartphone to search for product information online is a very simple process. |
.96/.94 | .90/.84 | Davis (1989) |
| Perceived usefulness of smartphone to search | (1) I find that my smartphone is a very useful tool for me to search for product information on. (2) Using my smartphone is one of the most convenient ways for me to search for product information. (3) When I need product information, my smartphone is a very effective way of gathering that product information I need. |
.96/.94 | .88/.85 | Davis (1989) |
| Purchase intent | (1) Using my smartphone to purchase a product is something that I see myself doing in the future. (2) I will most likely use my smartphone to purchase products in the future. (3) There is a high probability that in the future I would purchase a product using my smartphone. (4) I definitely plan to utilise my smartphone to purchase products in the future. |
.98/.98 | .94/.92 | New Scale |
7-point scales: 1 = strongly disagree; 7 = Strongly agree.
CR = composite reliability; AVE = average variance extracted; Searchers left-hand side/purchasers right hand side.
Denotes item was reverse coded for analysis.
Declaration of conflicting interests
The author(s) declared no potential conflicts of interest with respect to the research, authorship and/or publication of this article.
Funding
The author(s) received no financial support for the research, authorship and/or publication of this article.