
Abstract
Mobile air cleaners (MACs) have been proposed as a supplementary solution to combat the spread of respiratory aerosols in school classrooms. To determine which, where and how to use MACs, seven small- and medium-sized MACs were selected and assessed for different settings and configurations by 1) a decay test for determining the clean air delivery rate (CADR), and 2) a perception test with a panel of subjects, together with physical measurements, of noise and air movement. The findings show that to achieve the desired CADR (appr. 1000 m3/h for 30 students per classroom), the key factors are the induced airflow pattern and the location of the MACs. MACs with an upward air supply toward the occupied zone showed much higher CADR (max. 775–1332 m3/h) than those with a horizontal air supply (max. 219–333 m3/h). Moreover, using multiple devices simultaneously was crucial when the room size was increased, and combining mechanical ventilation could improve aerosol removal. Achieving a sufficient CADR would always lead to a noise level above the limit of 35 dB(A), yet sometimes the rating of the panel was more than 50% acceptable. The air velocities mostly fulfilled the requirement (<0.2 m/s), which aligned with the positive panel assessment. Hence, the evaluation by a panel of subjects can help to optimize the use of MACs in a classroom.
Introduction
For years, the COVID-19 pandemic has significantly raised the public’s concern for indoor air quality (IAQ) and the need for effective ventilation and air cleaning. This is due to the airborne transmission of SARS-CoV-2, primarily through pathogen-laden respiratory particles, also called infectious aerosols. Such aerosols are released when individuals breathe, speak, cough or sneeze, serving as a key route for cross-infection amongst indoor occupants.1–4 Since school classrooms are indoor spaces with a dense occupancy and a long-occupied time per day, there is a high risk of such cross-infection to take place. 5 During the pandemic, schools worldwide were closed to prevent further outbreaks. 6 Such measures, consequently, hindered the teaching and learning activities and affected children’s mental and physical health adversely,7,8 which is far from ideal and should not be the only option for combating new crises in the future. Therefore, better strategies for ventilating/air cleaning to minimize the transmission of infectious aerosols in classrooms are needed.
For decades, problems with IAQ and ventilation in classrooms have been widely reported. For instance, in studies conducted in the United States of America, 9 the United Kingdom, 10 Italy, 11 China, 12 Denmark, 13 France 14 and the Netherlands, 15 IAQ-conditions and ventilation performance in classrooms were often found to be unsatisfying or insufficient.16,17 A study by Ding et al. 18 on Dutch secondary schools during the COVID-19 pandemic showed that with full student occupancy, nearly half of the classrooms had a CO2 concentration exceeding the upper limit of the national guideline and one-eighth had a ventilation rate per person lower than the minimum requirement, even with windows and doors open almost all the time. For the post-pandemic era, after gradually returning to normal, the opening of windows and doors is foreseen to be limited due to other aspects of indoor environmental quality (IEQ), such as thermal comfort and acoustics. Considering that most classrooms only have natural ventilation and renovating the entire building for installing a centralized ventilation system is not always feasible, alternative options should be provided to ensure a good IAQ. 19
Air cleaning, by definition, means ‘the use of equipment that removes particulate, microbial or gaseous contaminants (including odours) from air’. 20 More specifically, according to a recently released ASHRAE standard (ASHRAE 241-2023), within the scope of controlling infectious aerosols, air cleaning refers to ‘reducing the concentration of infectious aerosols in the air through capture and removal or by inactivation’. 21 Previous studies have shown the ability of air cleaning devices to eliminate particulate matters (PMs) (as well as other contaminants) to improve IAQ and its benefits for occupants’ health.22–24 Air cleaning technologies that are commonly used for removing aerosols include filtration (normally with high-efficiency particulate air (HEPA) filters), electrostatic, plasma/negative ion, ultraviolet germicidal irradiation (UVGI, particularly UV-C with a wavelength of 180–280 nm) and photocatalytic oxidation (PCO). 25 For the past decade, commercial air cleaning products have become increasingly popular due to the rising awareness of atmospheric air pollution. 26 Nowadays, driven by the pandemic, there are concerns regarding their capability to be used as a supplementary measure for reducing human-generated air pollutants, such as pathogen-carrying respiratory aerosols. 27
Amongst different types of air cleaning devices available in the market, mobile air cleaners (MACs) have the advantage of being more flexible and affordable. Although mainly designed for household or office usage, recent studies have demonstrated that MACs can also serve as a good solution for aerosol removal in school classrooms. 28 For instance, Jhun et al. 29 examined the performance of a small-sized MAC (clean air delivery rate (max. CADR) ∼200 m3/h) by week-long monitoring in two groups (control and intervention) of elementary school classrooms for air contamination. The results showed that the indoor PM level was reduced by up to 49% in the intervention classrooms, with four devices placed in the middle of the walls, in comparison to the control classrooms. Burgmann and Janoske 30 tested a large MAC (max. CADR ∼1200 m3/h) in a secondary school classroom by monitoring the decay of artificial aerosols, where the MAC was located at the back of the room. The aerosol concentration (size 0.3–10 μm) was decreased by 80% within 30 min. Curtius et al. 31 assessed the efficiency of a small-sized MAC (max. CADR ∼300 m3/h) by measuring aerosol concentration during actual lessons in a high school classroom. Four devices were placed at different locations in the room: two at the front corners, one at the centre and one at the back. According to the results, when windows and doors were closed, the aerosol concentration was reduced by more than 90% within less than 30 min, leading to an experimental CADR comparable to the nominal value.
Previous studies have also indicated that the performance of MACs in school classrooms depends on several important factors. According to Burgmann and Janoske 30 and Narayanan and Yang, 32 the location of the contaminant source plays a significant role, and the MAC should be ideally placed close to the source for a higher removal rate of respiratory aerosols. However, in real-world scenarios, it is not always possible to identify the source person, and the space available may be limited due to the activities in the classroom. A more practical approach would be to determine the location of the MAC in combination with the dimension of the device, the fan capacity, as well as the airflow pattern (i.e. the way that the air inlet and outlet are configurated in the MAC), to obtain optimal clean air delivery in the room, as discussed in a number of studies.33–36 Moreover, the number of devices adopted per classroom should also be considered based on the amount of CADR needed.31,36
Besides aerosol removal, noise and draughts generated by the MACs are also important. High noise levels of MACs were often reported in previous studies.31,37,38 However, according to surveys conducted amongst pupils and teachers, the noise generated by MACs was sometimes rated acceptable.31,38 Compared to noise, however, draught discomfort caused by MACs was less concerning. In the lab experiment conducted by Bluyssen et al., 37 when the airflow rate of the MAC was below 800 m3/h, the air velocity did not exceed 0.2 m/s, and the panel rating of the draught remained lower than 10% dissatisfied. In the field study by Curtius et al., 31 no evidence of students or teachers being disturbed by draughts from MACs was found.
To summarize, researchers have investigated various aspects of using MACs in classrooms. However, most existing studies mainly investigated a single type of MAC, usually with HEPA filters, under a limited number of conditions. Consequently, systematic strategies for using MACs in school classrooms have not yet been formed. Therefore, the present study aims to determine which, where and how to use MACs in classrooms to reduce respiratory aerosols as efficiently as possible while keeping the occupants comfortable.
Methods
Selection of mobile air cleaners
Collection of information on available mobile air cleaners
To collect information on the available MACs applicable to classrooms, existing products were searched within two ranges: 1) professional organizations or associations and 2) e-commerce platforms. In total more than 300 products were found, and were further screened based on the following criteria, which resulted in a preliminary list of 152 pre-selected products: 1) The brand develops its own mobile air cleaning products. 2) The main air cleaning technology of the product is filtration (using HEPA (high-efficiency particulate air) filter or EPA (efficient particulate air) filters), electrostatic (ES) or plasma (PL) (can be supplemented by activated carbon (AC) and/or UV-C). 3) Detailed technical specifications of the product are provided. 4) The product is available in or can be bought within the Netherlands.
Main specifications of mobile air cleaners
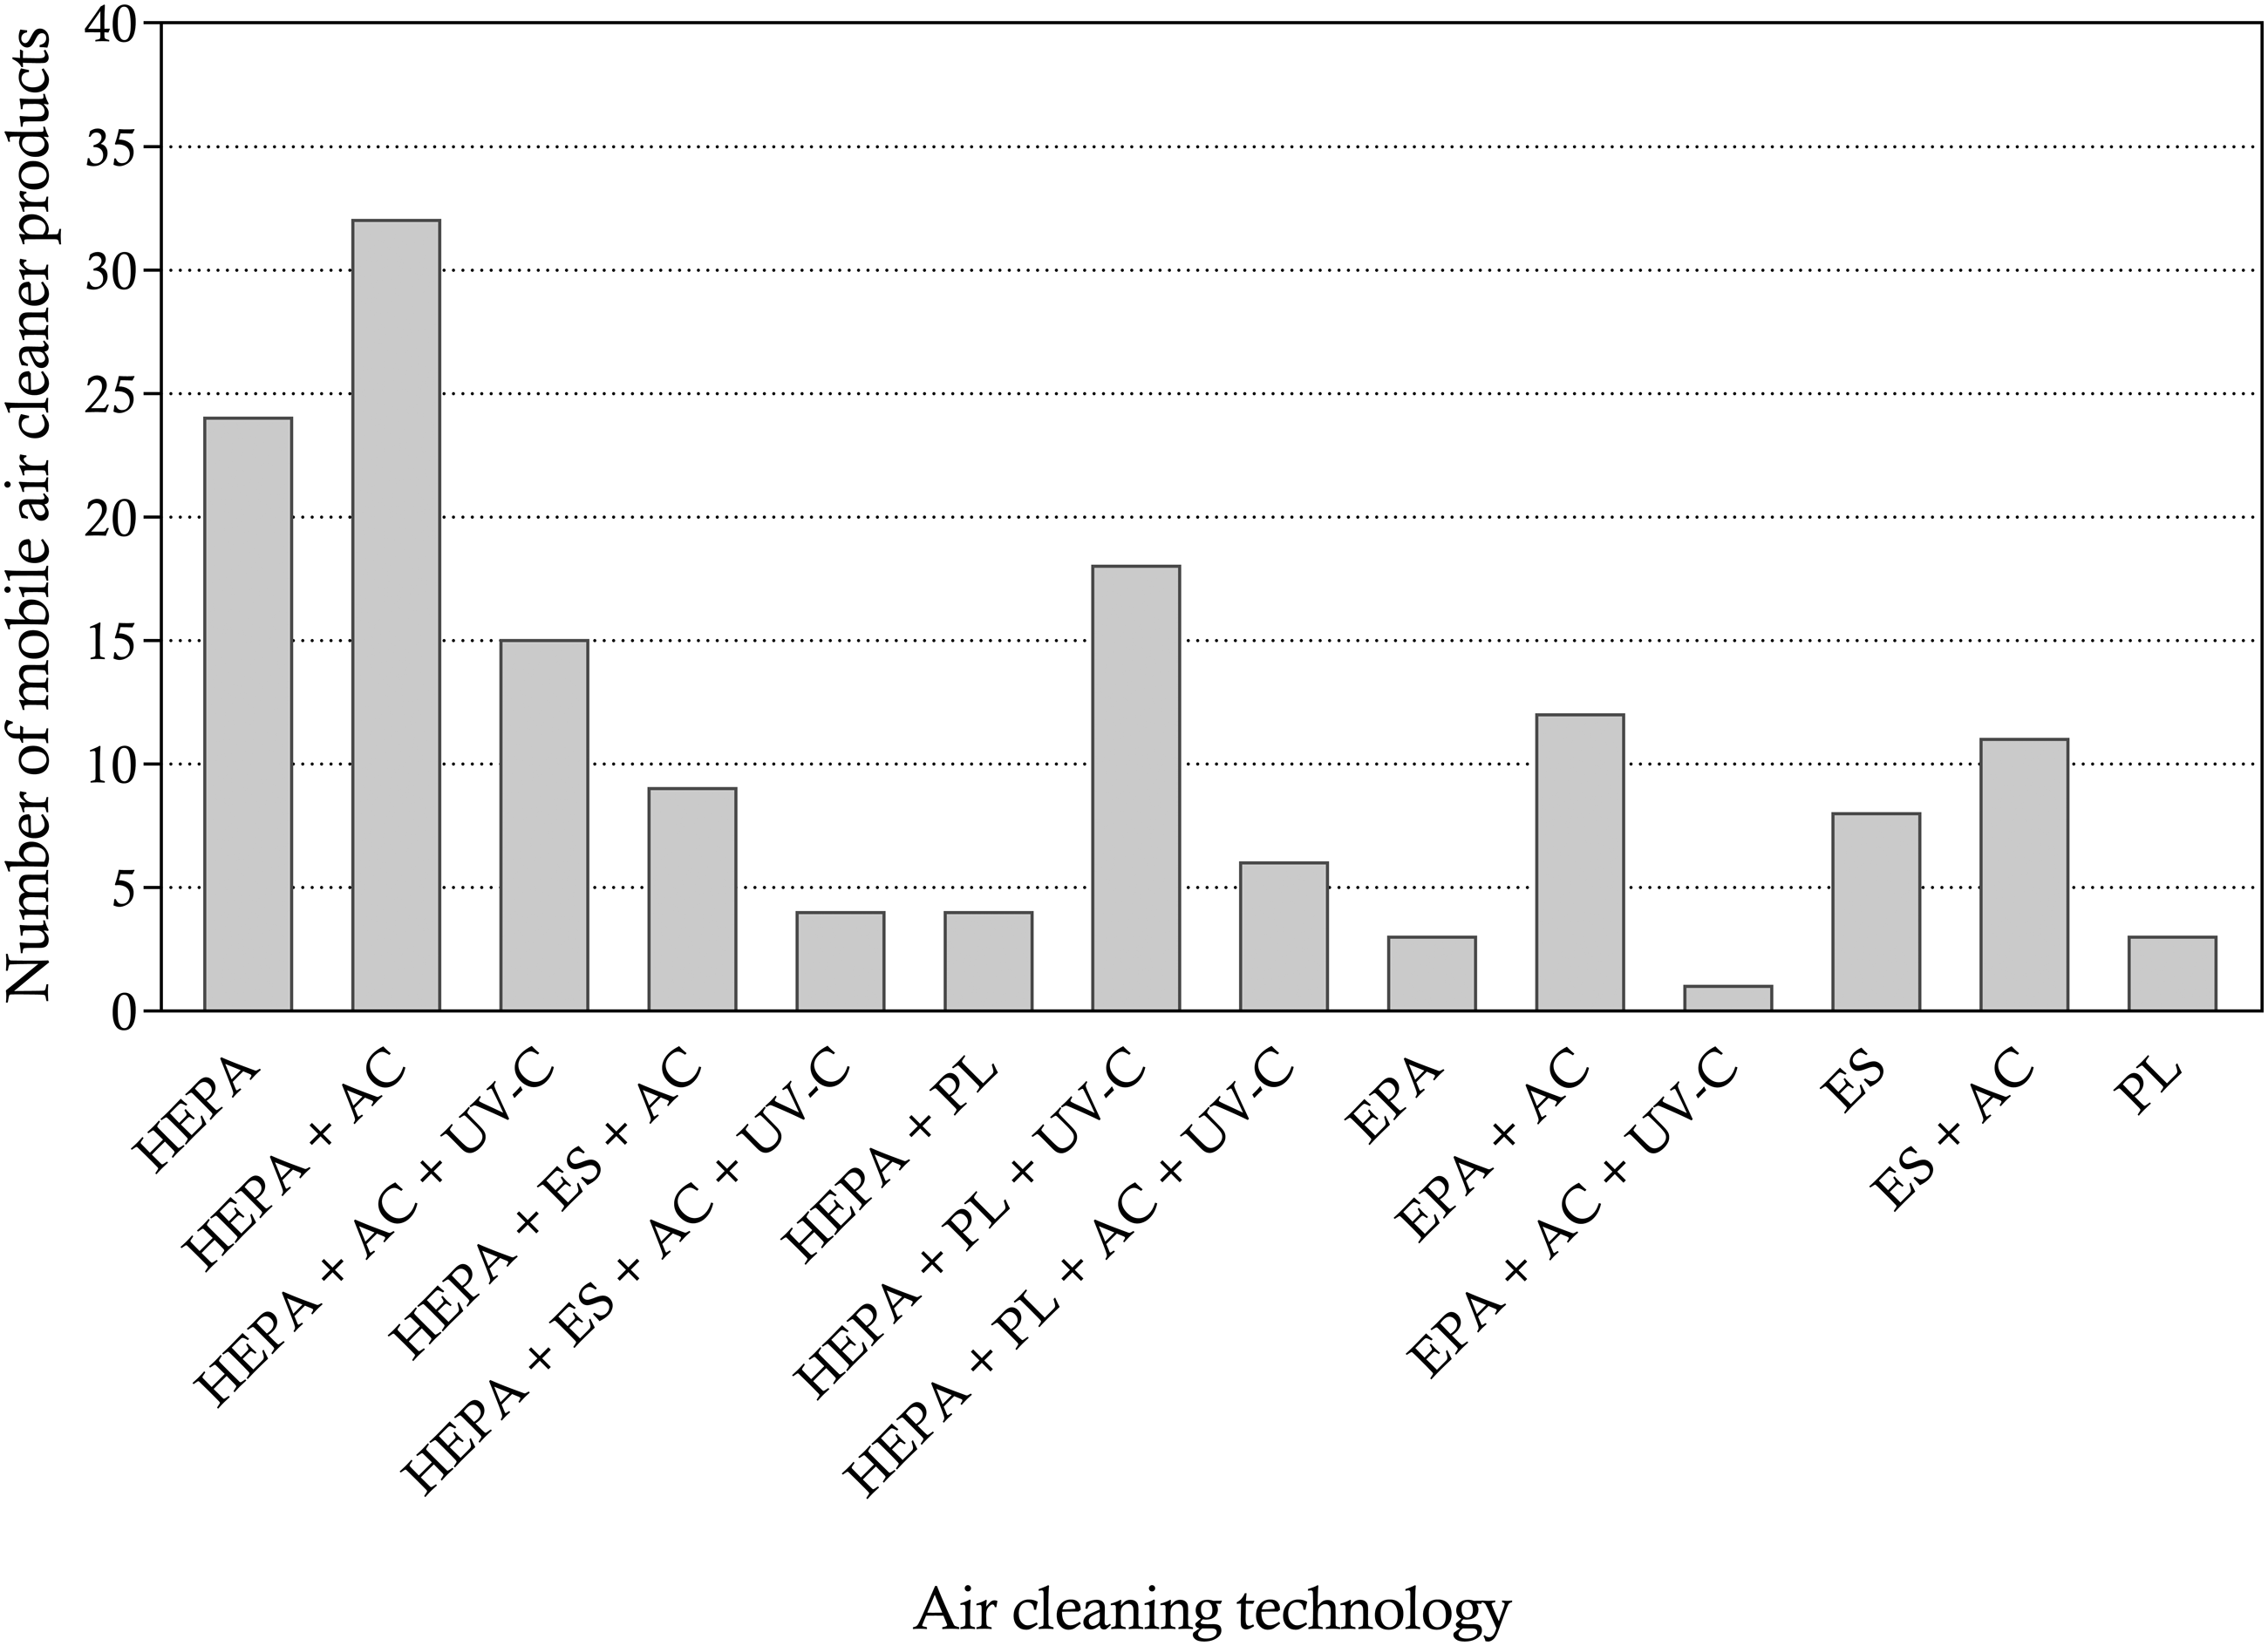
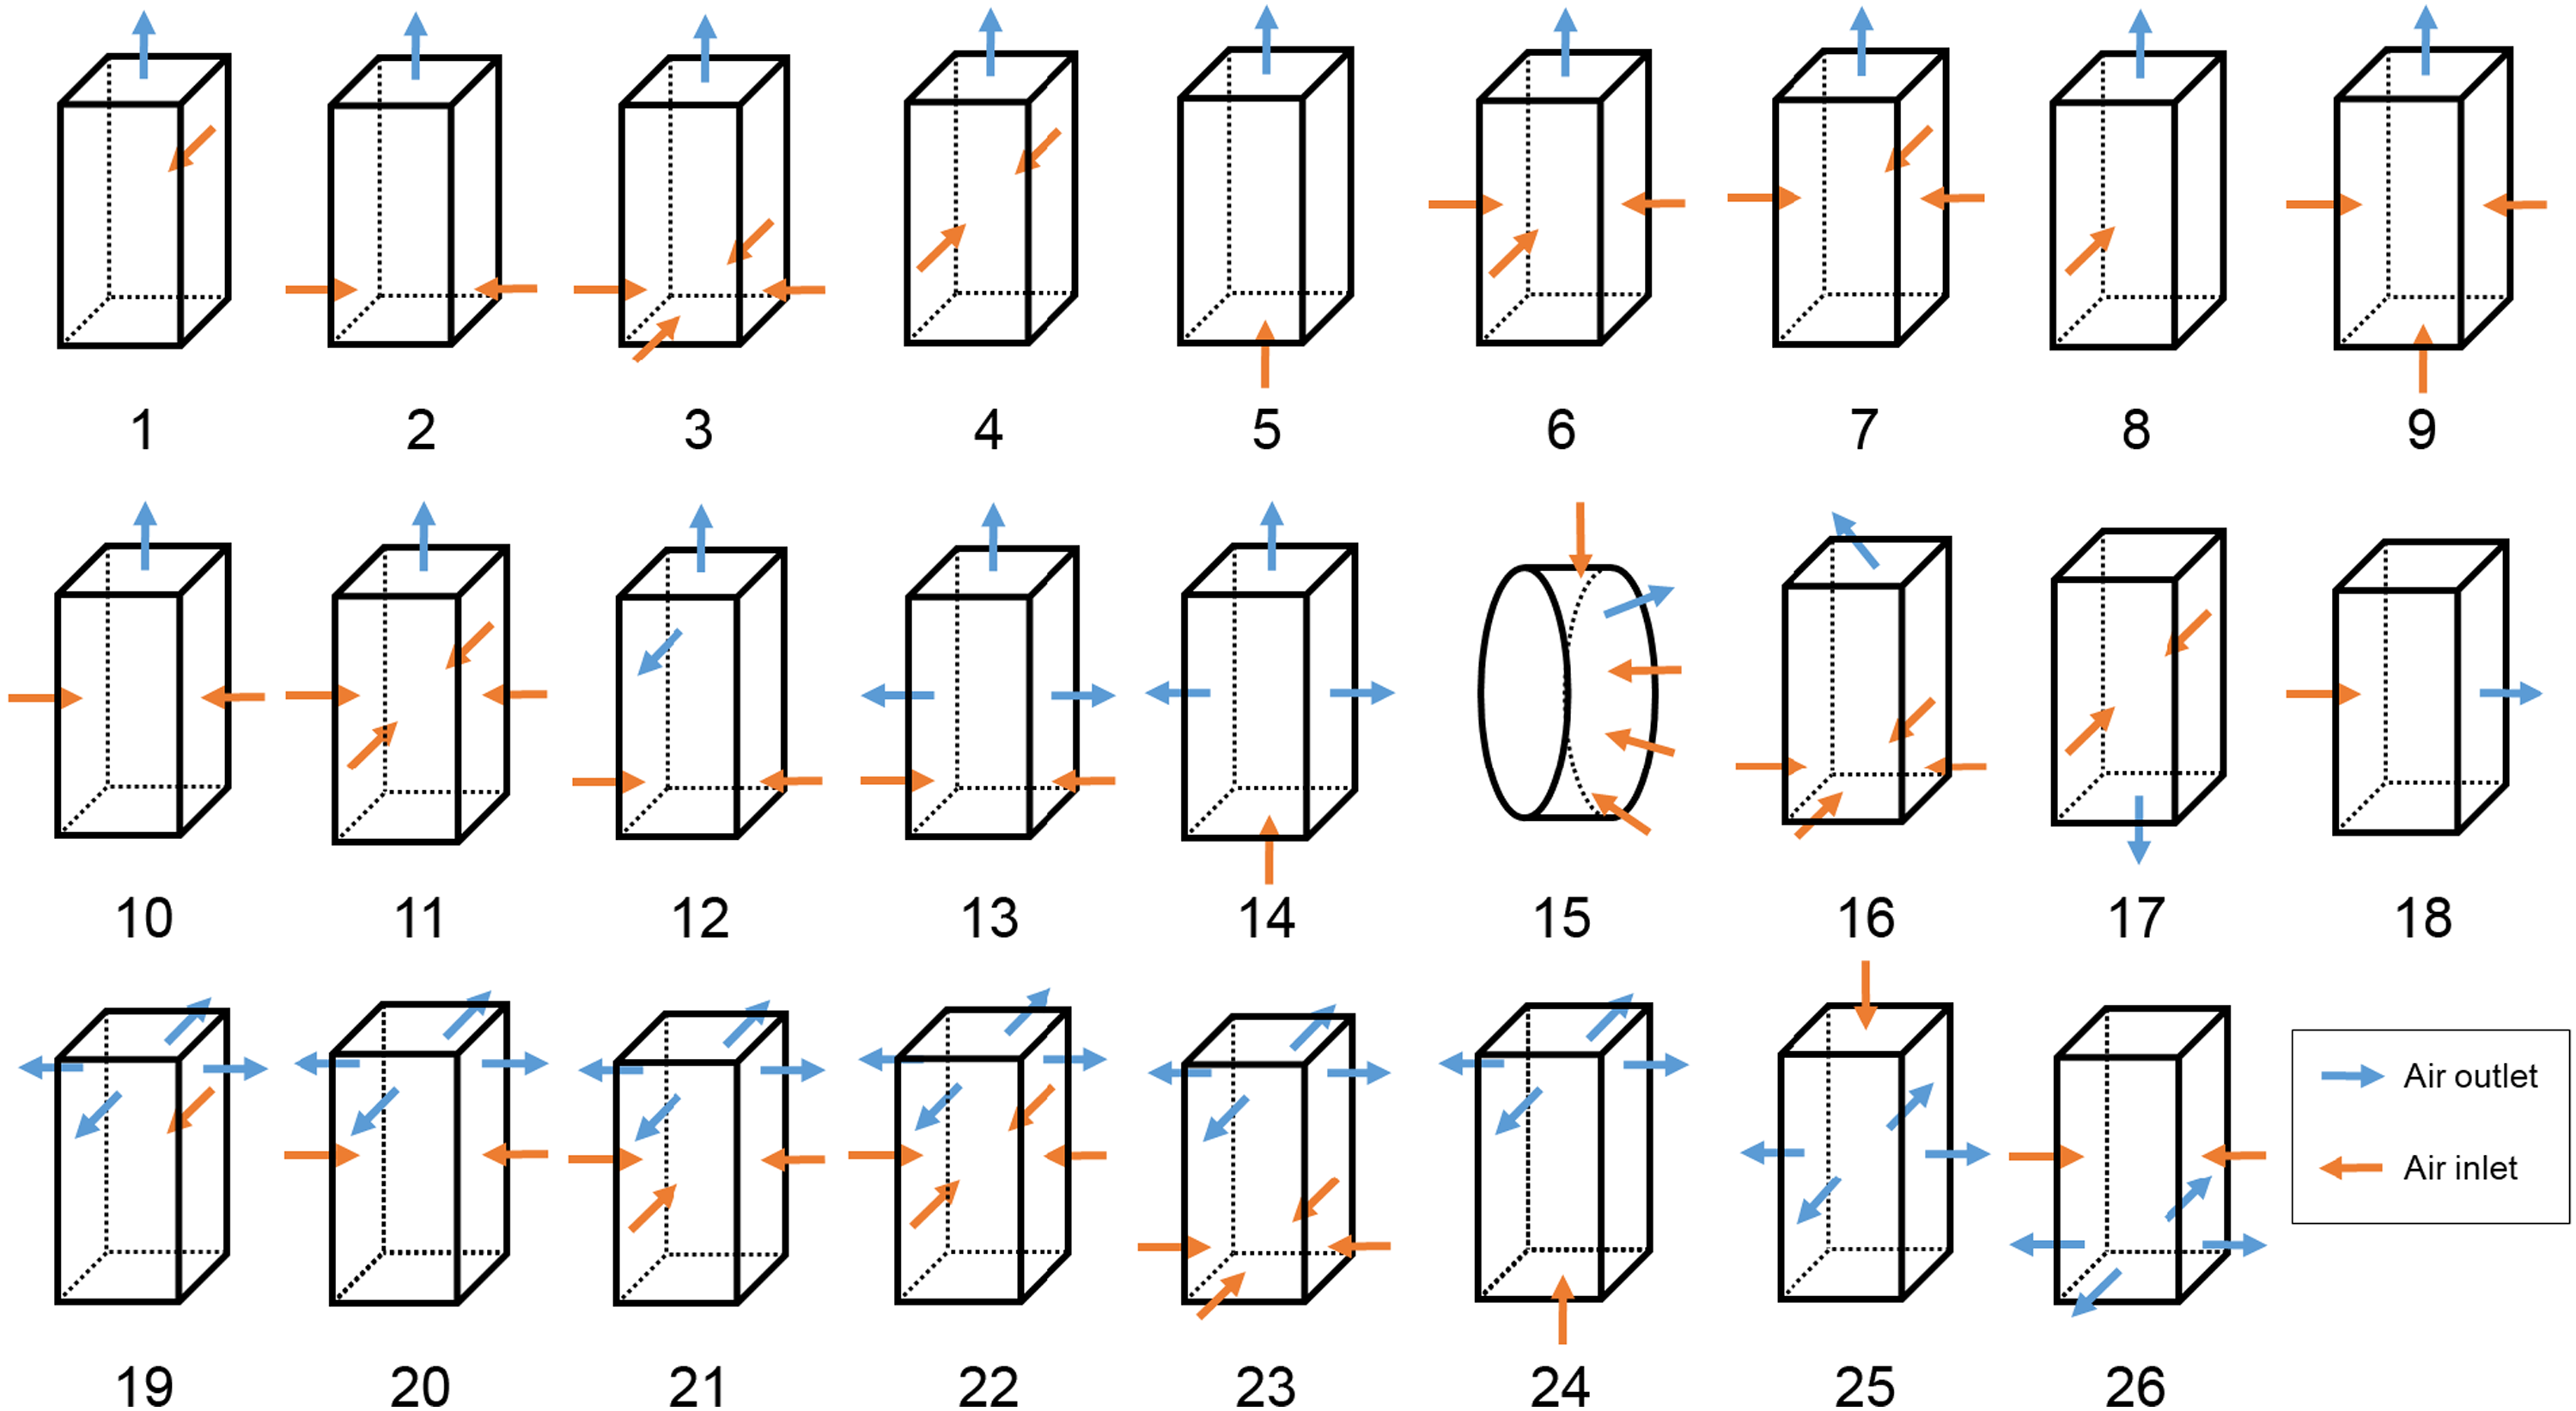
The pre-selected products were categorized and compared using the following eight parameters, based on the specifications provided by the brand: 1) Air cleaning technology: Figure 1 shows the 15 different (combinations of) air cleaning technologies equipped by the pre-selected products. 2) Airflow pattern: Figure 2 presents 26 types of airflow patterns of the pre-selected products. Most commonly, the contaminated air is sucked horizontally from the side of the device, and the clean air is supplied vertically from the top. 3) Efficiency: the pre-selected products all have a specified aerosol removal efficiency of ≥99.95%, which is equivalent to the filter class of E12 or higher as prescribed in the European standard EN 1822-1.
39
4) Fan capacity and CADR: the fan capacity is the maximum airflow rate the MAC can provide, usually in m3/h. Most of the pre-selected products have multiple settings (of fan level). For some devices, the CADR (m3/h) is specified, which equals the aerosol removal efficiency multiplied by the airflow rate or the decay rate of the aerosol concentration multiplied by the room volume, thus indicating both the efficiency and fan capacity of the device.
40
Since all the pre-selected products have an efficiency of ≥99.95%, the CADR can be considered approximately equal to the fan capacity. The fan capacity (or CADR) of the selected products varied from 60 to 2500 m3/h. 5) Noise level: the specified noise level of the pre-selected products varies with the MAC settings, which range from 18 to 60 dB(A). 6) Dimensions: generically the fan capacity of the MAC increases with its size. However, the device should also be able to fit in classrooms causing minimum hindrance to the teaching and learning activities. 7) Maintenance: the maintenance of the MACs includes, most importantly, the filter life and its cost. The supplementary AC filter and UV-C lamp may add to the cost; however, for many products, the AC filter is combined with the main filter. 8) Price: the price of the pre-selected products ranged from 60 to 7000 euros (including VAT). Air cleaning technologies equipped by 152 pre-selected mobile air cleaners. Airflow patterns of 152 pre-selected mobile air cleaners.
Selection of mobile air cleaners
To select the proper MACs for the tests, several criteria were considered both for the technical requirements and feasibility of operating such devices in classrooms: 1) Considering the testing methods used in the present study, and recommendations of certain guidelines,41,42 MACs that used UV-C were excluded. 2) To ensure efficient aerosol removal, a filter class of H13 or higher, according to EN 1822-1,
39
is recommended.
43
Hence, the MACs with an efficiency lower than H13 were excluded. 3) According to the Dutch Fresh Schools guideline, the noise level of classroom installations should be ≤35 dB(A).
44
Therefore, the MACs with a minimum noise level above 35 dB(A) were excluded. 4) To ensure a good IAQ, a ventilation rate of 8.5–10 L/s per person is recommended.45–47 Taking the student occupancy in a typical classroom as 30 persons, the total ventilation rate required is thus around 1000 m3/h. This should also be the requirement of the CADR achieved by the MACs. Considering the product size and fan capacity, for each type of MAC, a maximum of four devices can be used per classroom. Hence, the device should have a CADR ≥250 m3/h, and those that did not were excluded. 5) Considering the affordability of the schools, the total budget of MACs per classroom was set to be 3000 euros. Thus, by multiplying the price and number of devices needed per classroom, those that reached a total cost higher than 3000 euros (including VAT) were excluded.
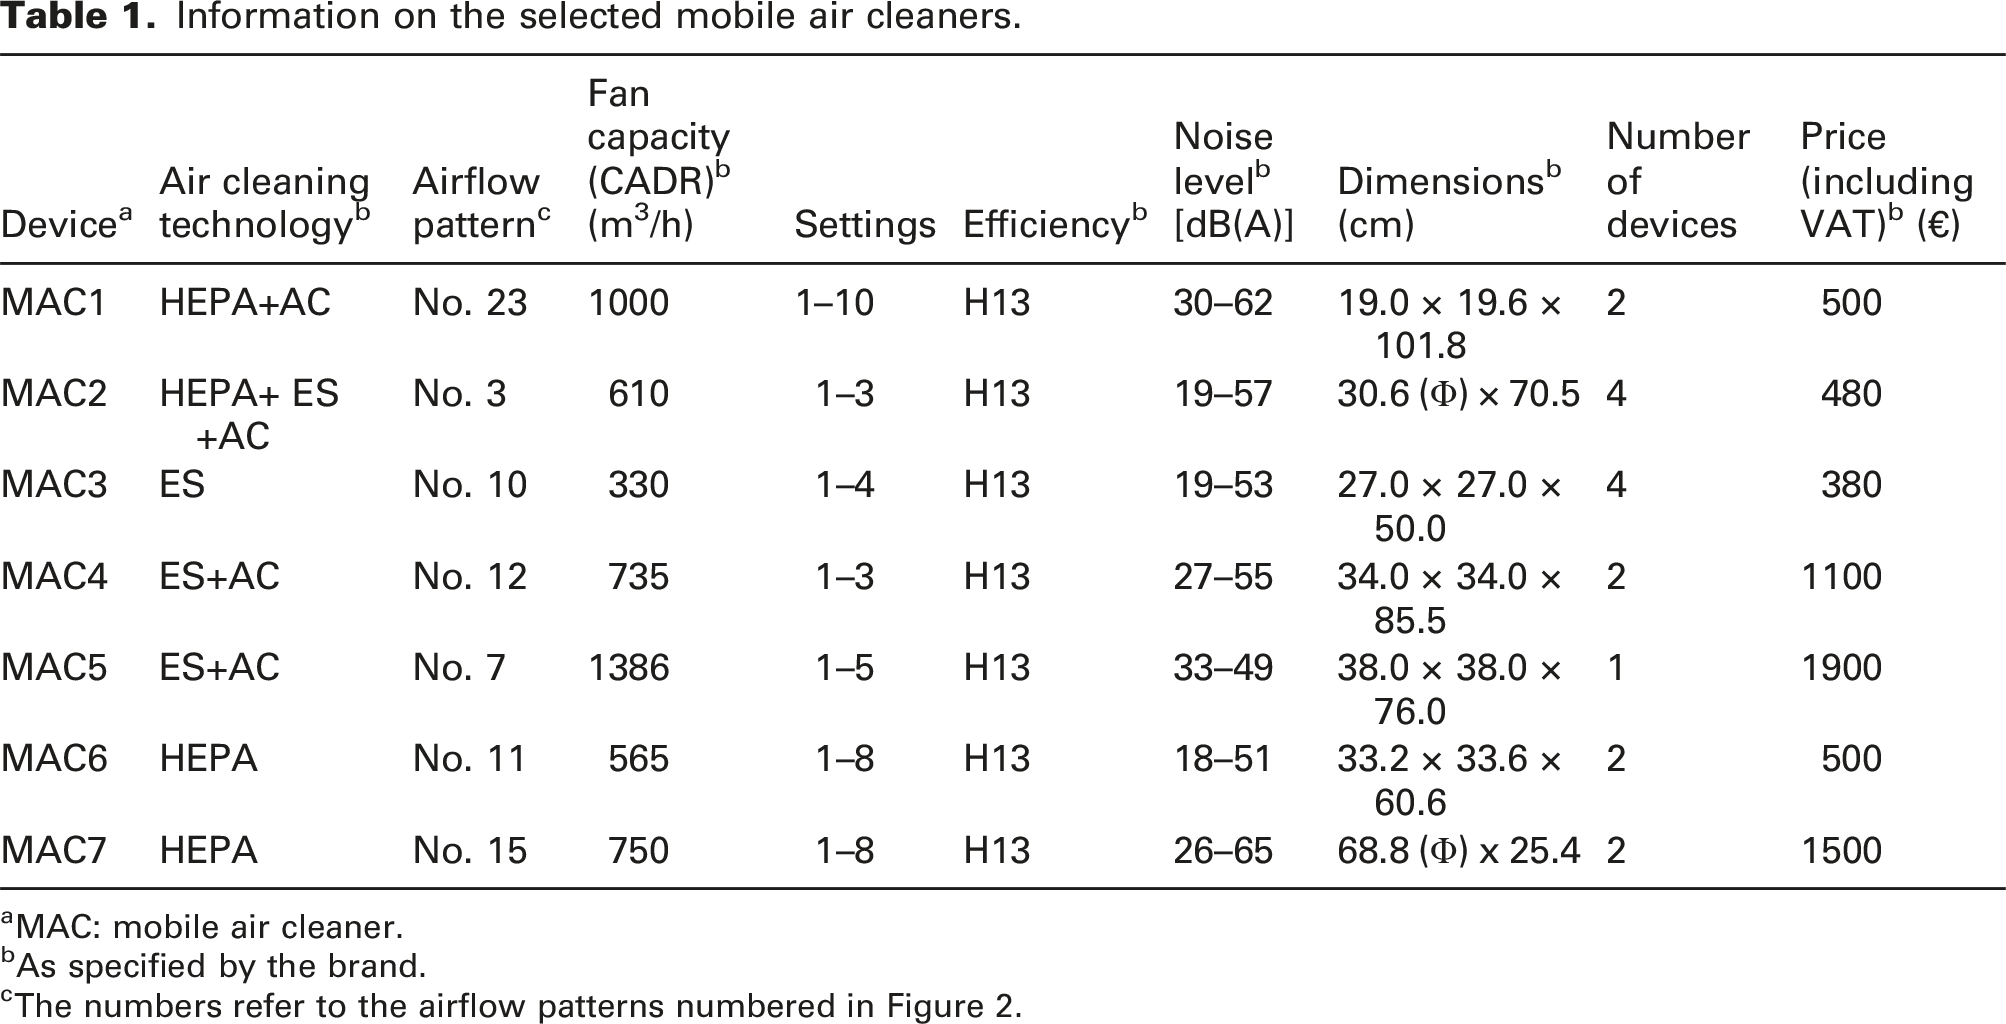
Based on the aforementioned criteria, 72 products were excluded. The remaining 70 products were then filtered by 1) reducing the number of similar products from the same brand, and 2) eliminating unpractical airflow patterns, such as a vertical air outlet from the bottom, or a stratum airflow. This led to a shortlist of 27 products, from which the most suitable one of each brand was eventually selected, considering the fan capacity (CADR), noise level, dimensions and price. The selection process is illustrated in Figure 3. In the end, eight types of floor-standing MACs were selected, representing unique combinations of air cleaning technology and airflow patterns that differed in fan capacity (CADR) and dimensions. The brands' producers were then approached to purchase the devices. However, until the end of the study, one type of device was not delivered, and thus, only the other seven were tested. Each of these seven types of MACs was given a number for identification in this study, as noted from MAC1 to MAC7. To achieve the required CADR, for MAC5, one device was required; for MAC1, MAC4, MAC6 and MAC7, two devices were required; for MAC2 and MAC3, four devices were required. The detailed information is listed in Table 1. Flowchart of the selection process of the tested mobile air cleaners. Information on the selected mobile air cleaners. aMAC: mobile air cleaner. bAs specified by the brand. cThe numbers refer to the airflow patterns numbered in Figure 2.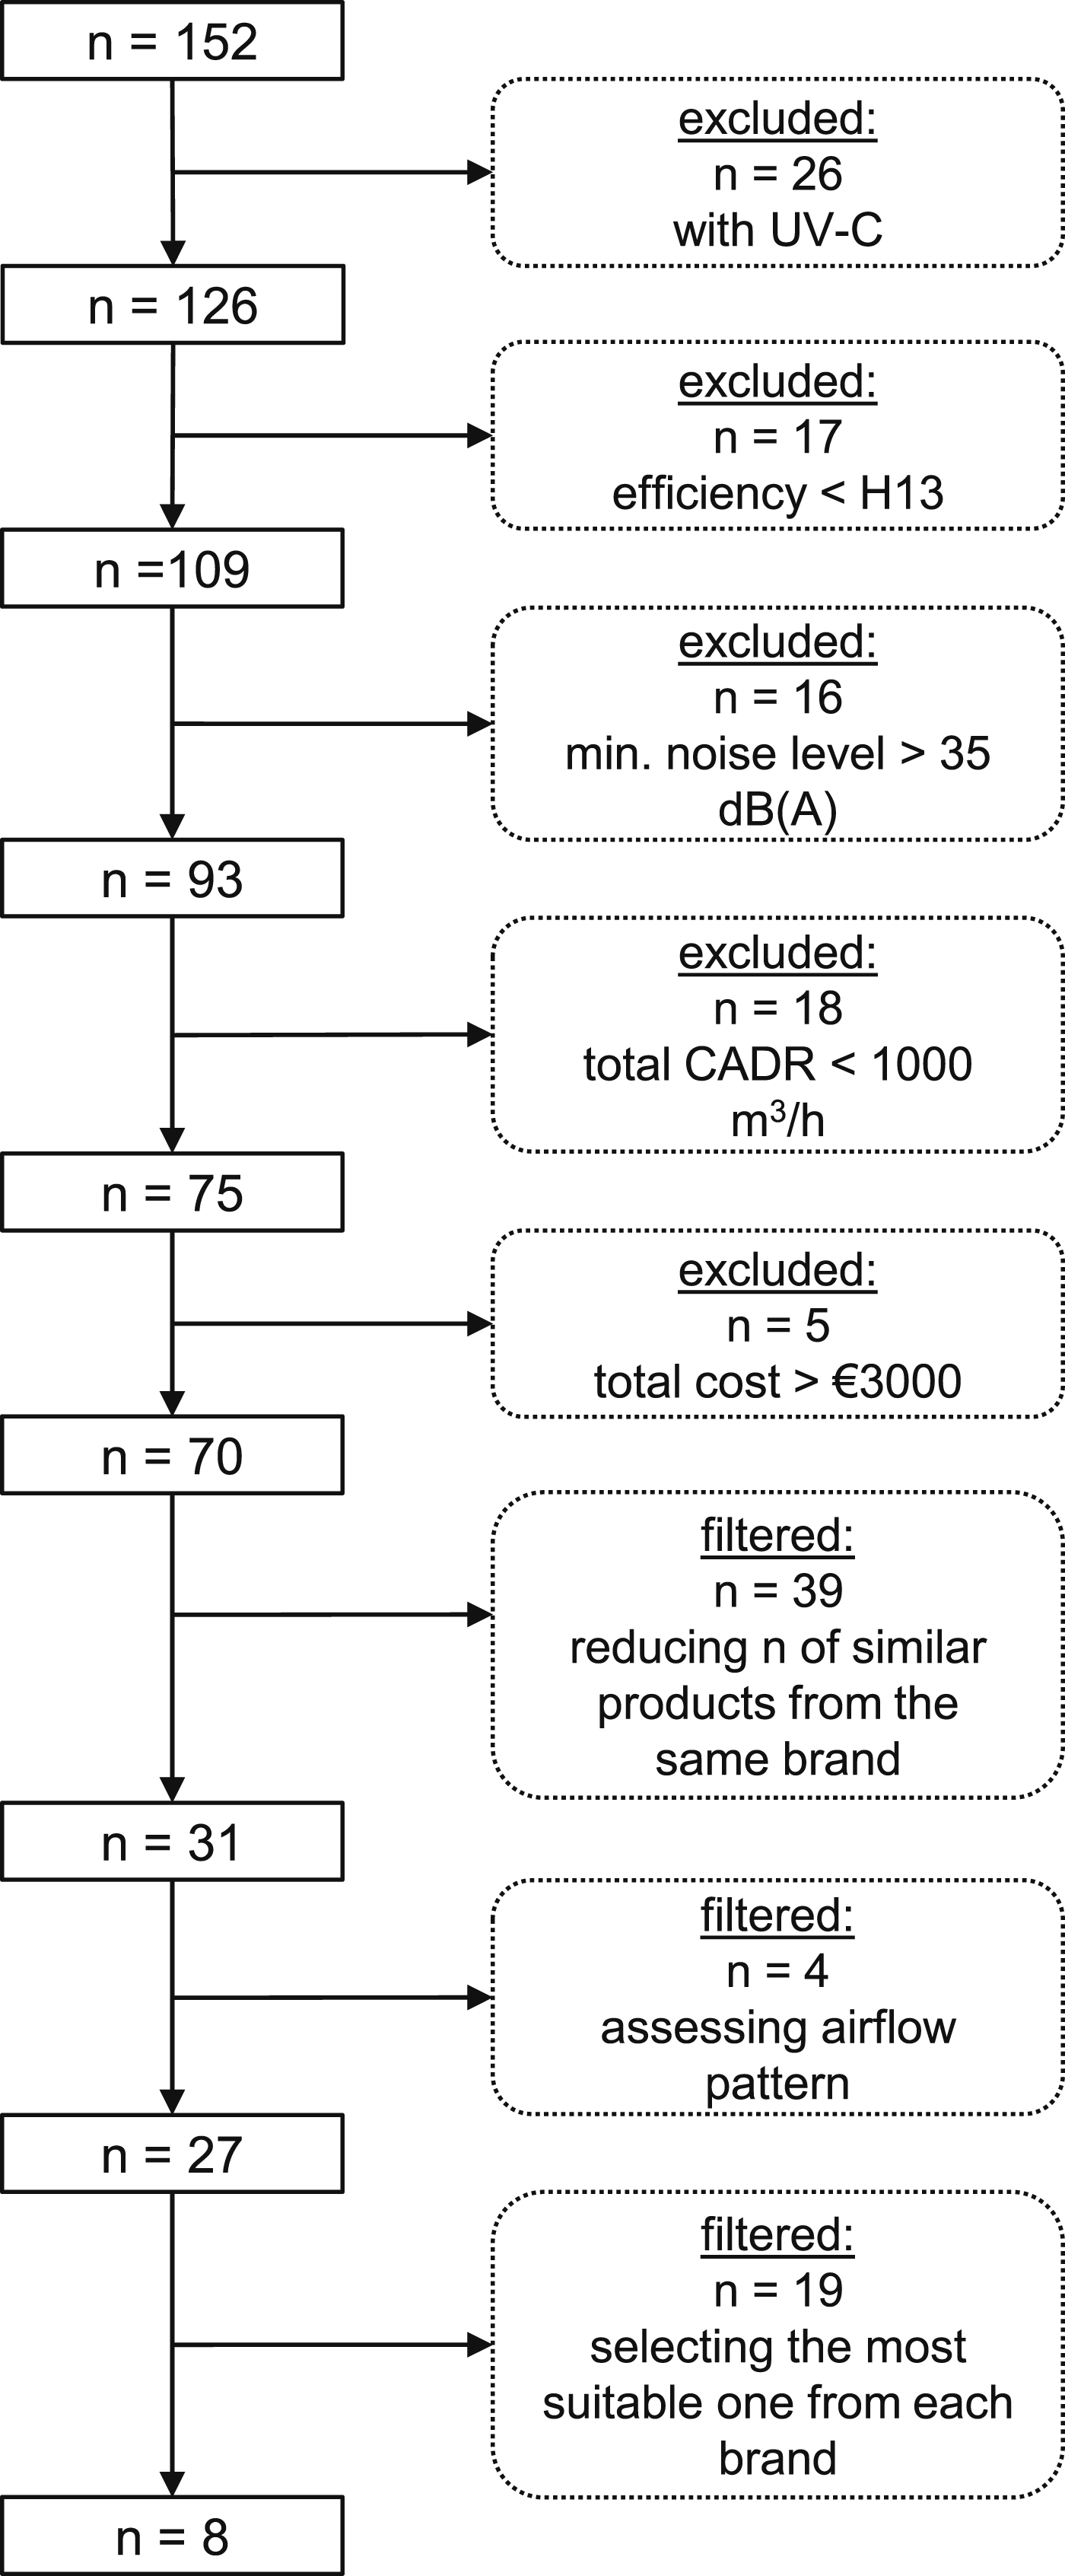
Assessment of mobile air cleaners
The assessment of the selected MACs consisted of two parts: 1) an aerosol decay test: the time evolution of aerosol concentration was monitored after filling the room with aerosols generated by a specific spraying technique, to calculate the aerosol removal rate and CADR, and 2) a panel perception test: a panel of subjects was recruited to assess the noise and air movement by completing questionnaires. The panel perception test also included physical measurements of sound pressure level and air velocity. All the tests were conducted from May to July 2023, in the Experience room of the SenseLab at the Delft University of Technology. 48 The Experience room has a size of 6.1 (l) × 4.2 (b) × 2.7 (h) = 69.2 m3, with two windows and one door, and the interior was set up as a classroom, with tables, chairs and a smartboard. The Experience room was equipped with an independent ventilation system, which can switch between mixing and displacement ventilation, with a maximum ventilation rate of 1200 m3/h and a HEPA filter of a filter class of H14.
Aerosol decay test
Aerosol generator
An aerosol generator was adopted as the source of respiratory aerosols for the decay test, using an artificial saliva liquid made of 98.5 wt.% water +1 wt.% glycerin +0.5 wt% NaCl (salt). The aerosol generator consists of an HPLC pump (model: SHIMADZU LC-10AD), a PulmosprayTM spray nozzle for generating aerosols (provided by Medspray®) and an air compressor. The latter gently blows air around the spray nozzle, dispersing the aerosols and preventing too much coalescence.
49
The PulmosprayTM contains a nozzle (spray chip), a liquid tube and an air tube. When the aerosol generator is operated, the liquid is pumped from a stock bottle to the spray nozzle using the HPLC pump at a flow rate of 0.8–0.9 mL/min. The spray nozzle produces multiple parallel liquid jets that break into droplets, which are then mixed with the co-airflow to form a constant spray. After being sprayed into the room air, the water in the droplets evaporates rapidly,
50
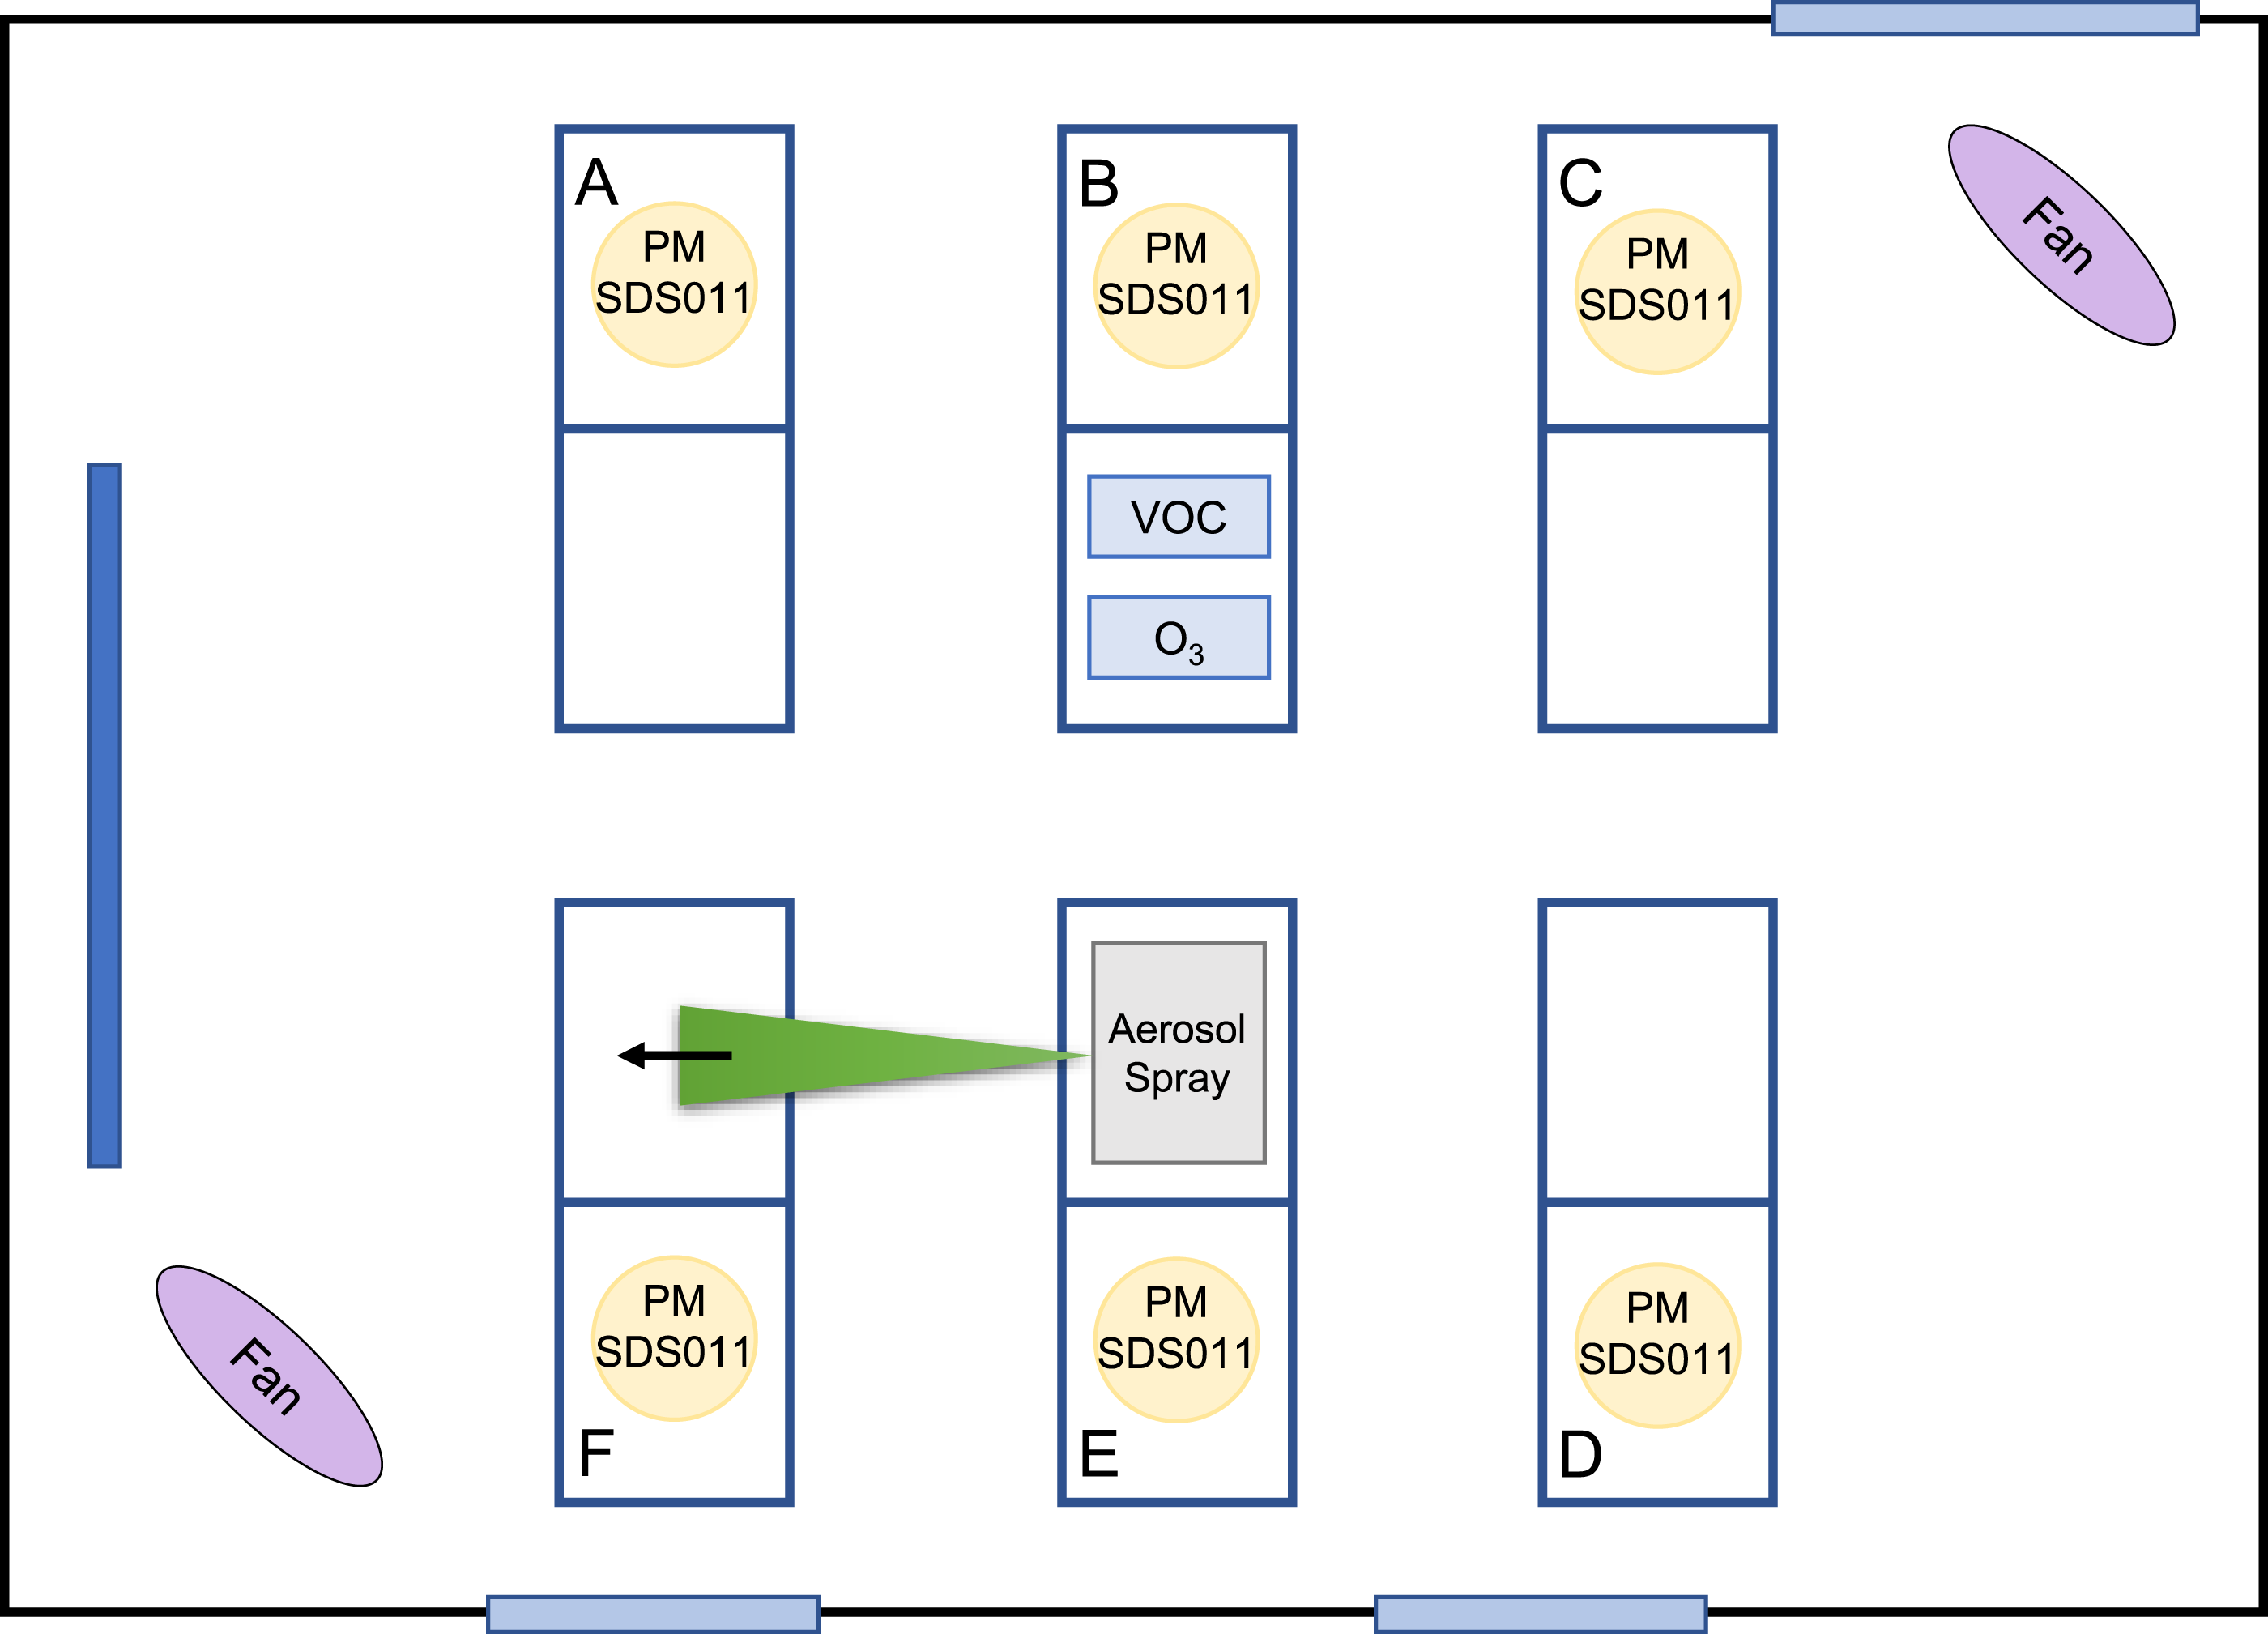
while the glycerin and salt remain in the form of aerosols. The sizes of the droplets and aerosols produced by the PulmosprayTM were previously determined using the Spraytec laser diffraction system (manufactured by Malvern Panalytical). The average size of the droplets (measured at 10 cm away from the spray outlet) was 7 μm, and the average size of the aerosols (measured at 1 m away from the spray outlet) was 4 μm. The aerosol generator was placed in the middle of the Experience room, with the spray facing the front of the room. The set-up is shown in Figures 4 and 5. Set-up of the aerosol generator. Set-up of the aerosol decay test: view from the top of the experience room, where A, B, C, D, E and F represent the tables, the dark blue rectangle represents the smartboard, and the light blue rectangles represent the door (top) and windows (bottom).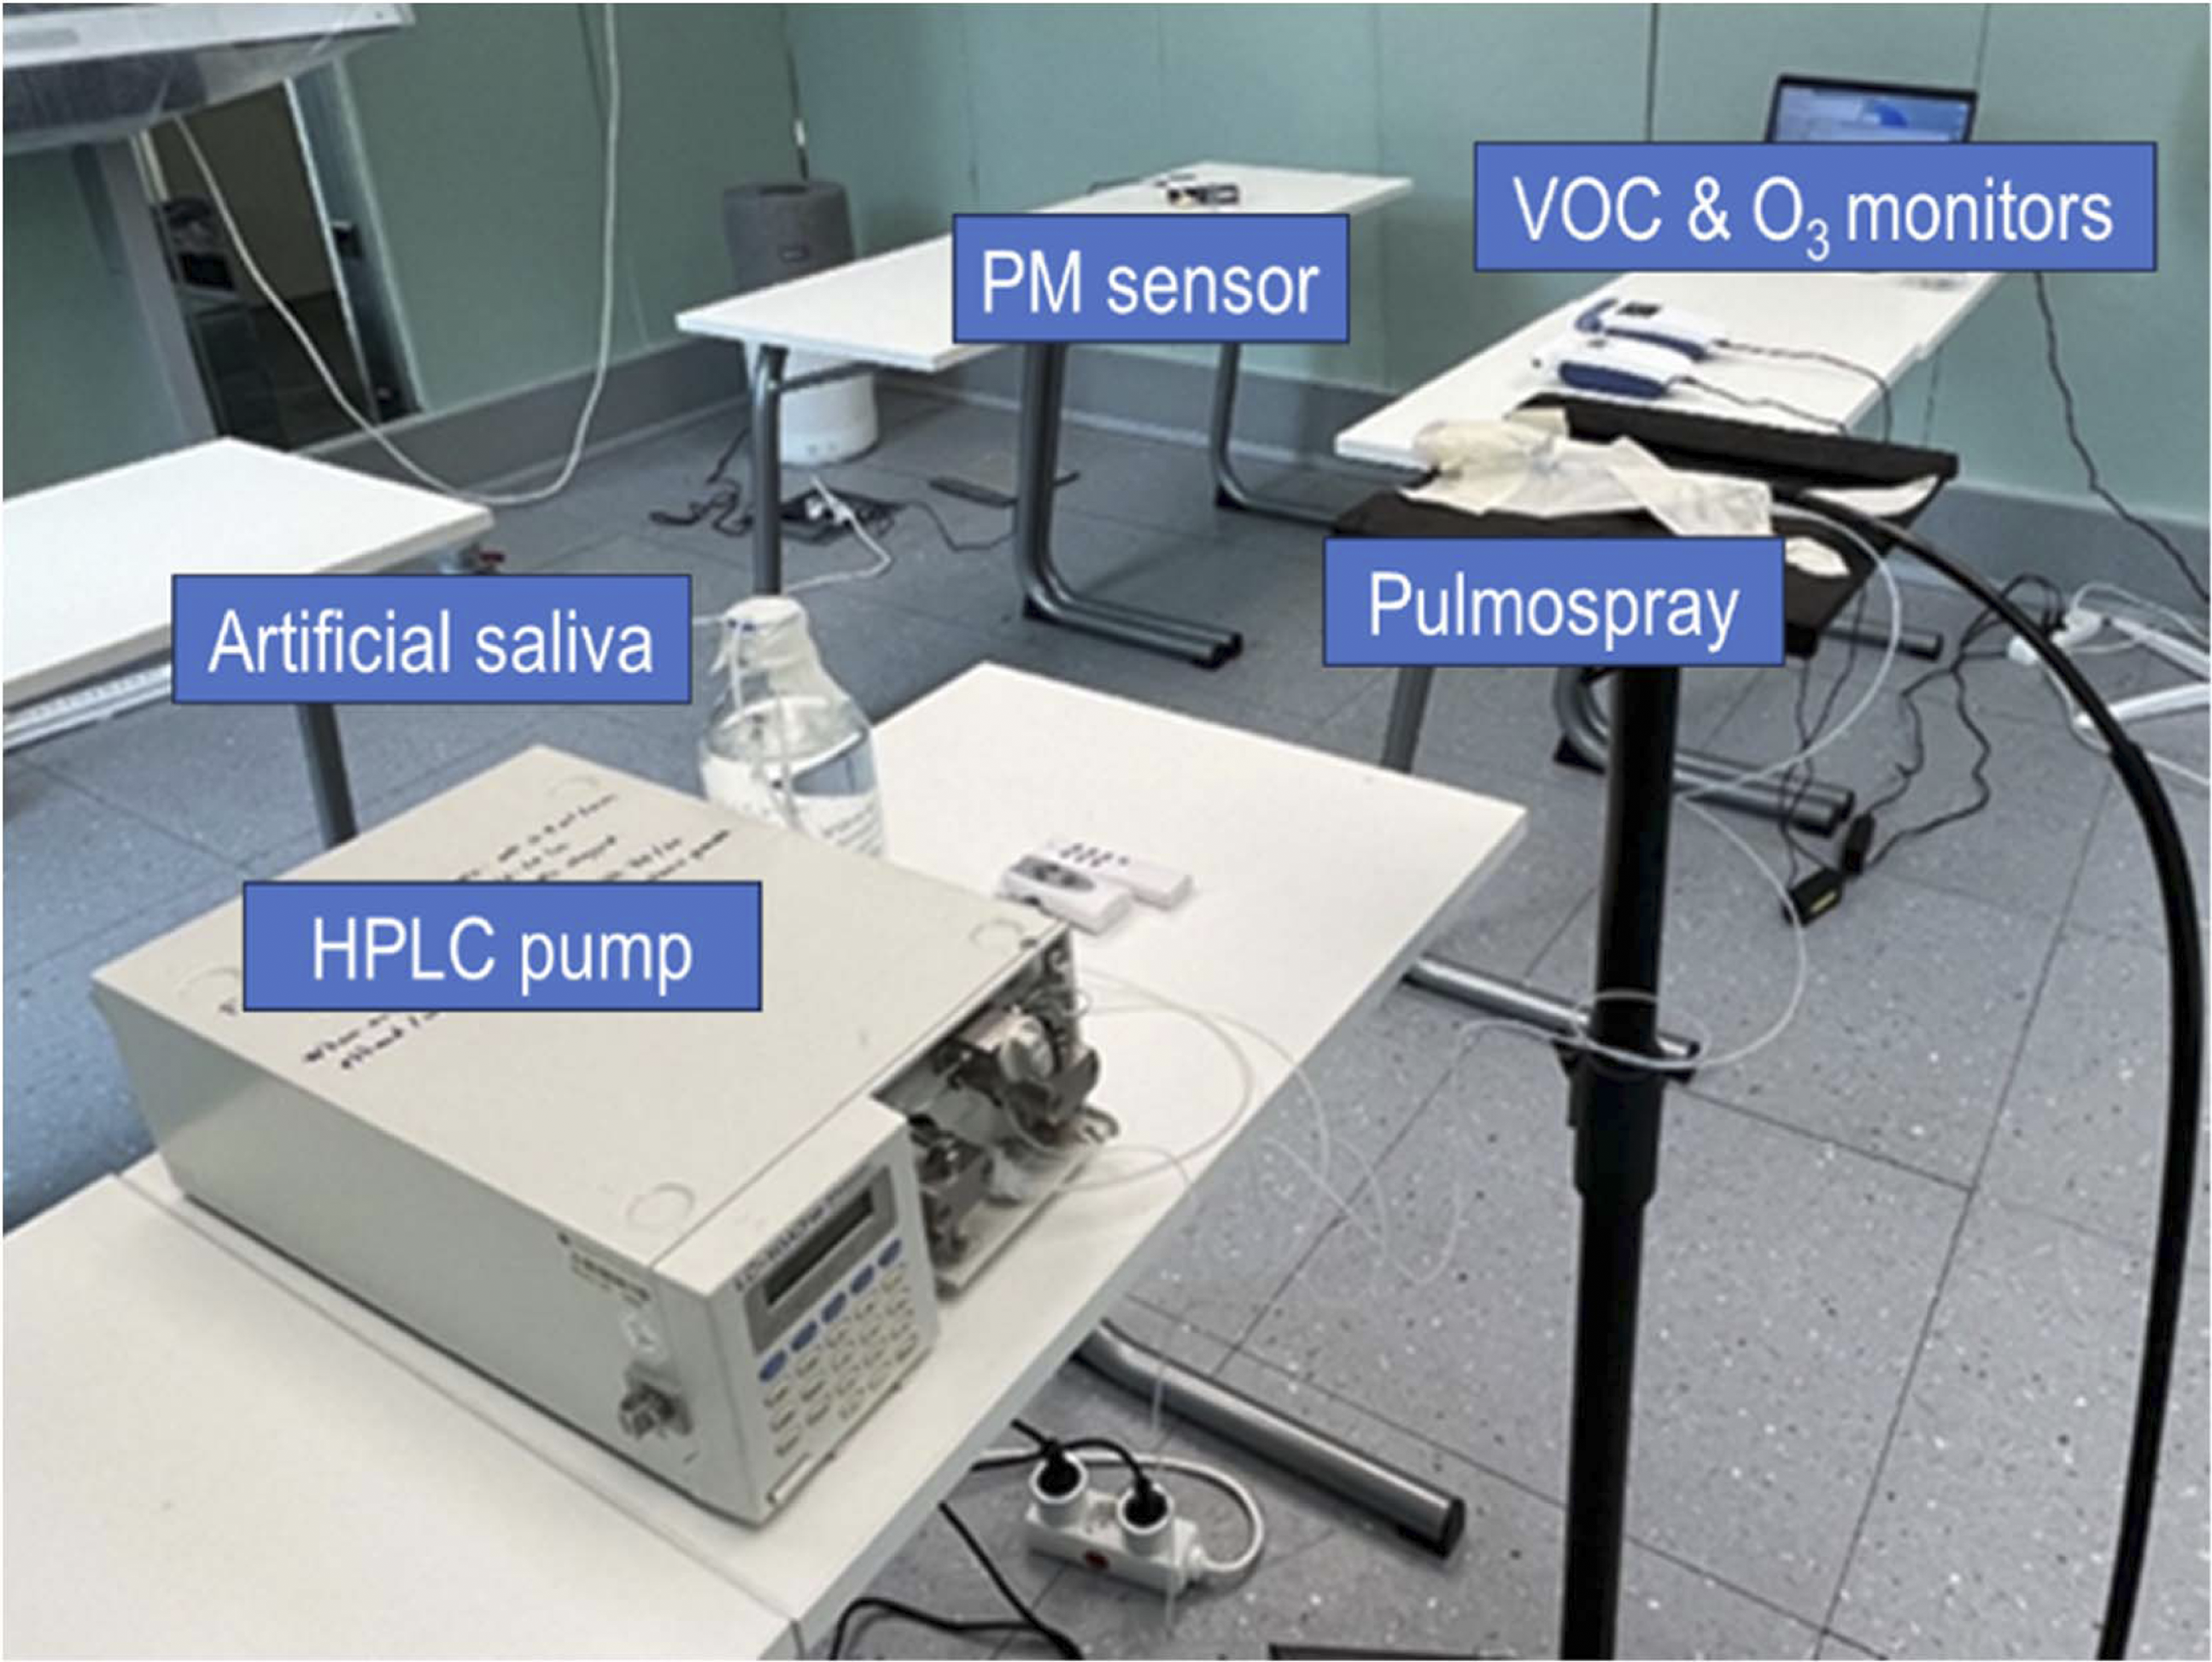
Measurement instruments
Previous studies have shown that the human respiratory aerosol sizes span a wide spectrum from 0.1 μm to over 1000 μm.51–53 Nonetheless, researchers have also found that aerosols with a size of 1–10 μm are mostly prevalent during a variety of respiratory activities for which PM2.5 and PM10 can hence be considered good representatives.54,55 The PM2.5 (particulate matters of a diameter of 2.5 μm and smaller) and PM10 (particulate matters of a diameter of 10 μm and smaller) concentrations were measured by six NOVA PM sensors (model: SDS011), which were evenly distributed in the Experience room on six tables (Figure 5). The logging interval was 10 s, and the real-time data were read out on a computer outside the room to remotely monitor the PM concentrations. Besides, the concentrations of total volatile organic compound (TVOC) and ozone (O3) were also continuously monitored by a Kanomax Gasmaster monitor (model: 2750) and an Aeroqual O3 monitor (model: Series 500), respectively, with a logging interval of 1 min, to assure the levels are within the acceptable range. These two monitors were placed on a table near the centre of the room (Figure 5).
Test conditions and procedure
Conditions of the aerosol decay test of the selected mobile air cleaners.
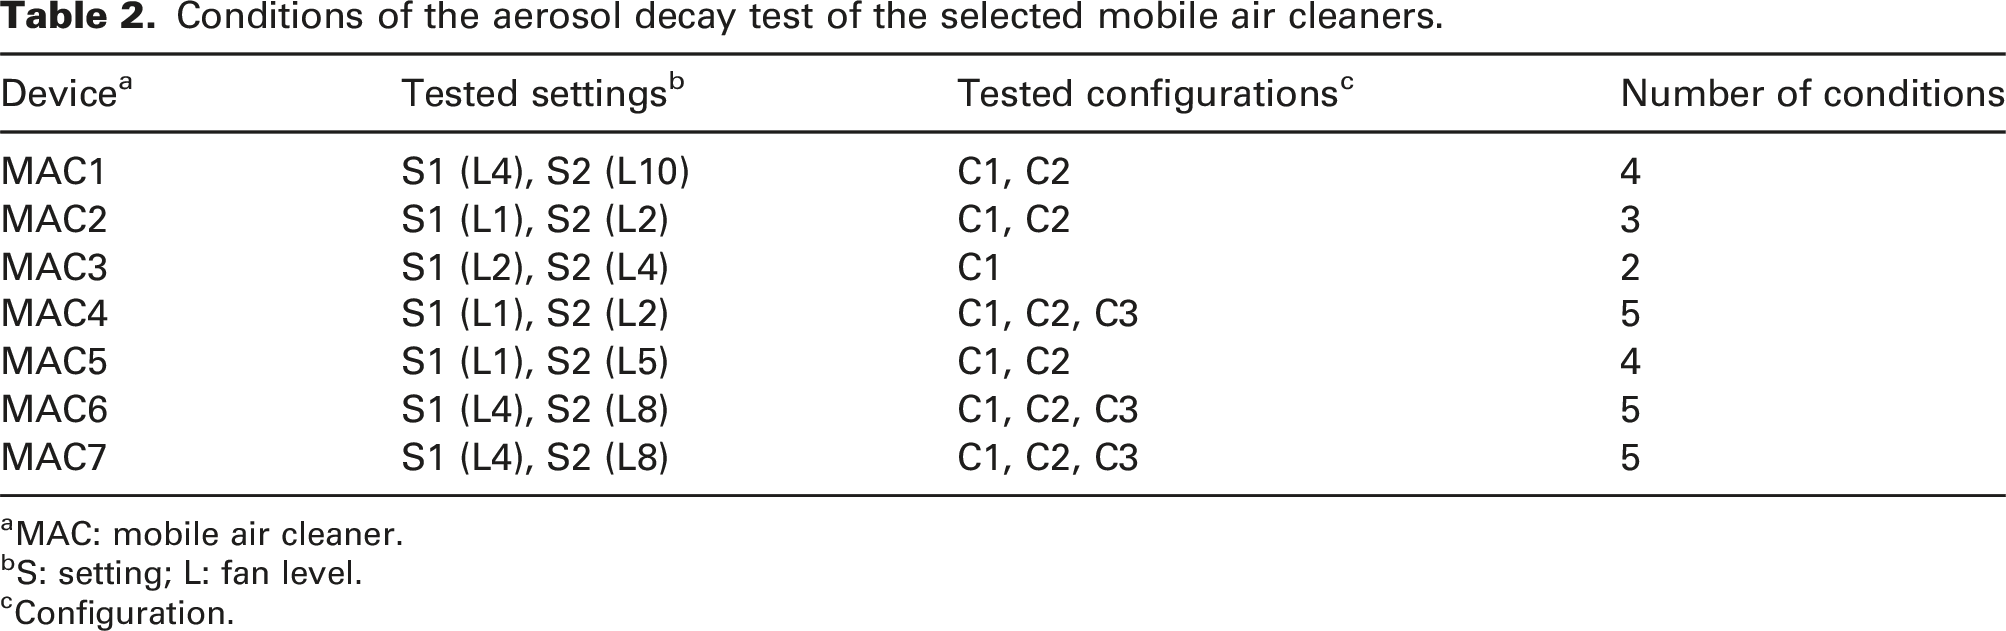
aMAC: mobile air cleaner.
bS: setting; L: fan level.
cConfiguration.
As shown in Table 1, the selected MACs all had different settings (i.e. fan levels). For each MAC, to determine the settings for the tests, a pre-test was performed to examine the noise level of each setting. Based on the results, two settings were selected for each MAC, which were: • Setting 1 (S1): the highest setting with a noise level lower than 35 dB(A). • Setting 2 (S2): the highest setting with a noise level lower than 55 dB(A), which was normally the maximum setting of the MAC, except for MAC2 and MAC4.
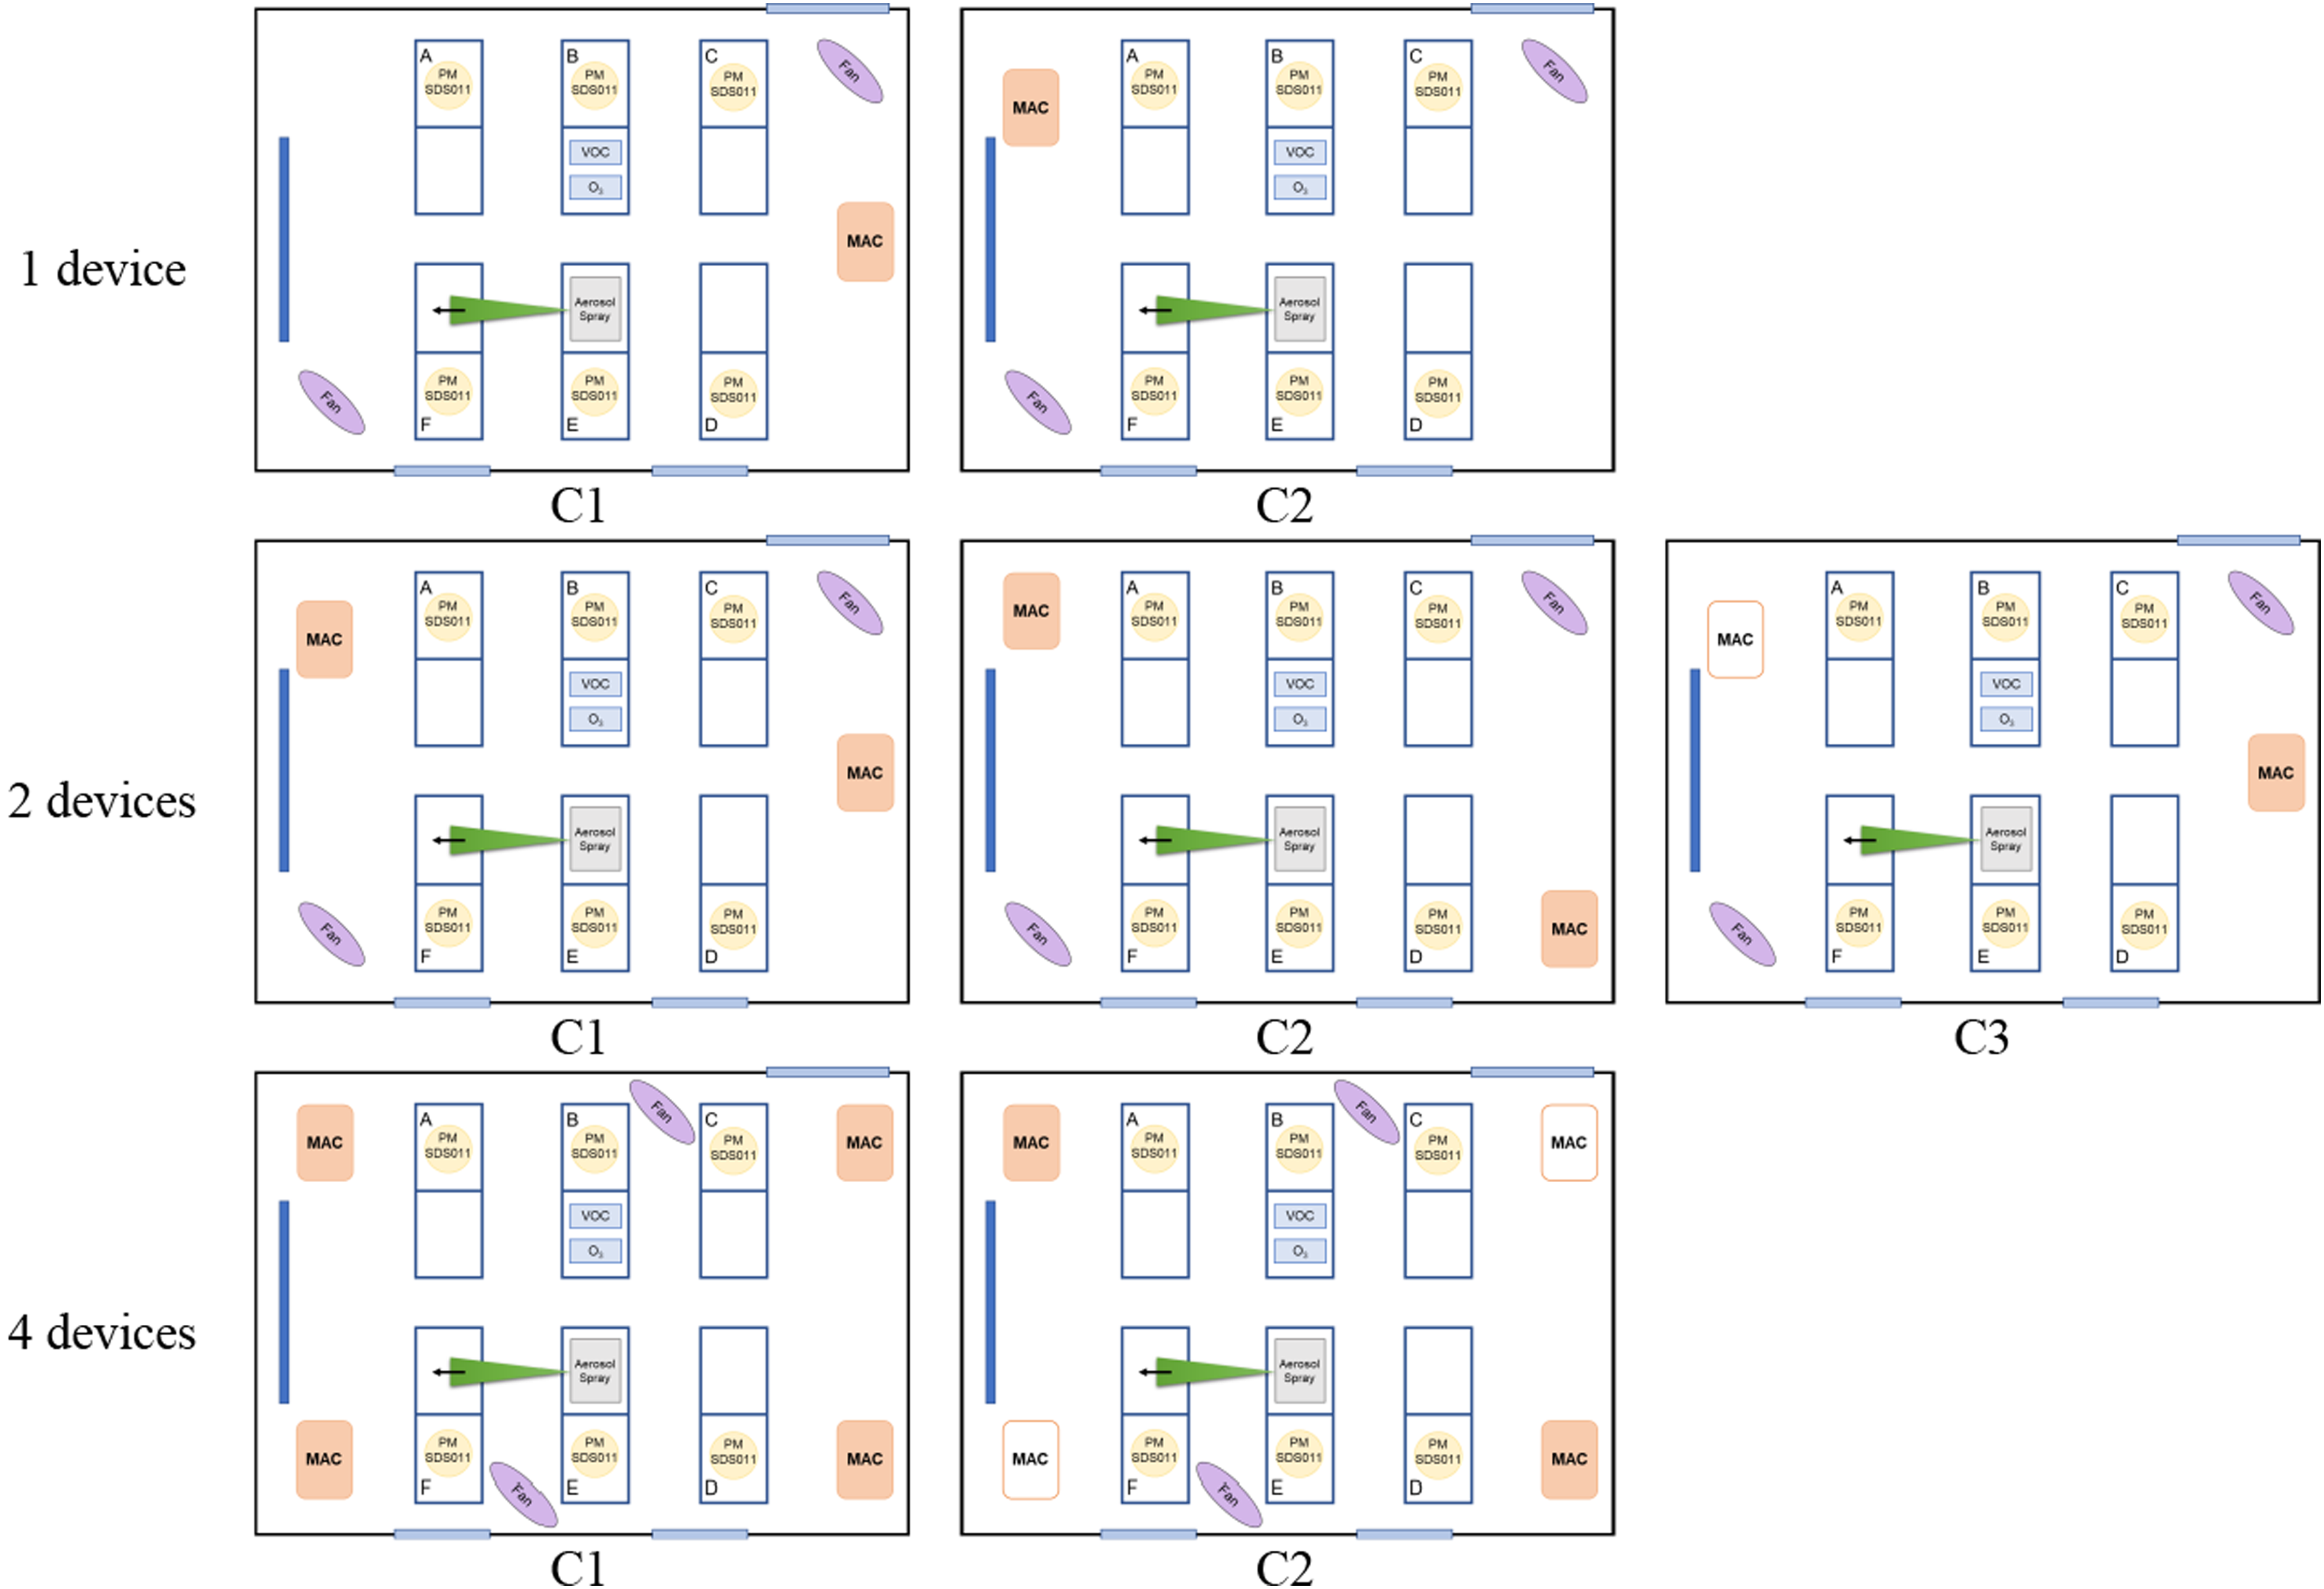
In Table 1, different numbers of devices are required for each MAC depending on the fan capacity. Hence, the configuration included both the number and location of devices, as shown in Figure 6: • For one device, configuration 1 (C1): at the middle of the back wall; configuration 2 (C2): at the front of the room, slightly on the side to avoid blocking the smartboard. • For two devices, C1: one in the front next to the smartboard, and the other at the middle of the back wall; C2: diagonally at two corners; C3: only one device, at the middle of the back wall, operating at S2. • For four devices, C1: at four corners; C2 (only for MAC2): two MACs, diagonally at two corners, operating at S2. Configurations of the mobile air cleaners for the aerosol decay test: view from the top of the experience room, where A, B, C, D, E and F represent the tables, the dark blue rectangle represents the smartboard, and the light blue rectangles represent the door (top) and windows (bottom).
Each decay test started with a build-up phase and ended with a decay phase, as shown in Figure 7. During the build-up phase, the aerosol generator was turned on to fill the room with aerosols. Two floor-standing fans were used to help accelerate the mixing process (Figure 5). When the real-time aerosol concentrations were read to be well-mixed and reached a steady state, the build-up phase was completed, normally taking 60 min. The aerosol generator and the fans were then turned off, and the MAC(s) was(were) turned on to start the decay phase. The decay phase usually lasted for 90 min, until the concentrations of both PM2.5 and PM10 decreased considerably (<5 μg/m3). Before and after each test, the mixing ventilation of the Experience room was turned on with an airflow rate of 1200 m3/h to flush the room for 15 min to maintain the aerosol concentrations at a very low level (<1 μg/m3). Procedure of the aerosol decay test.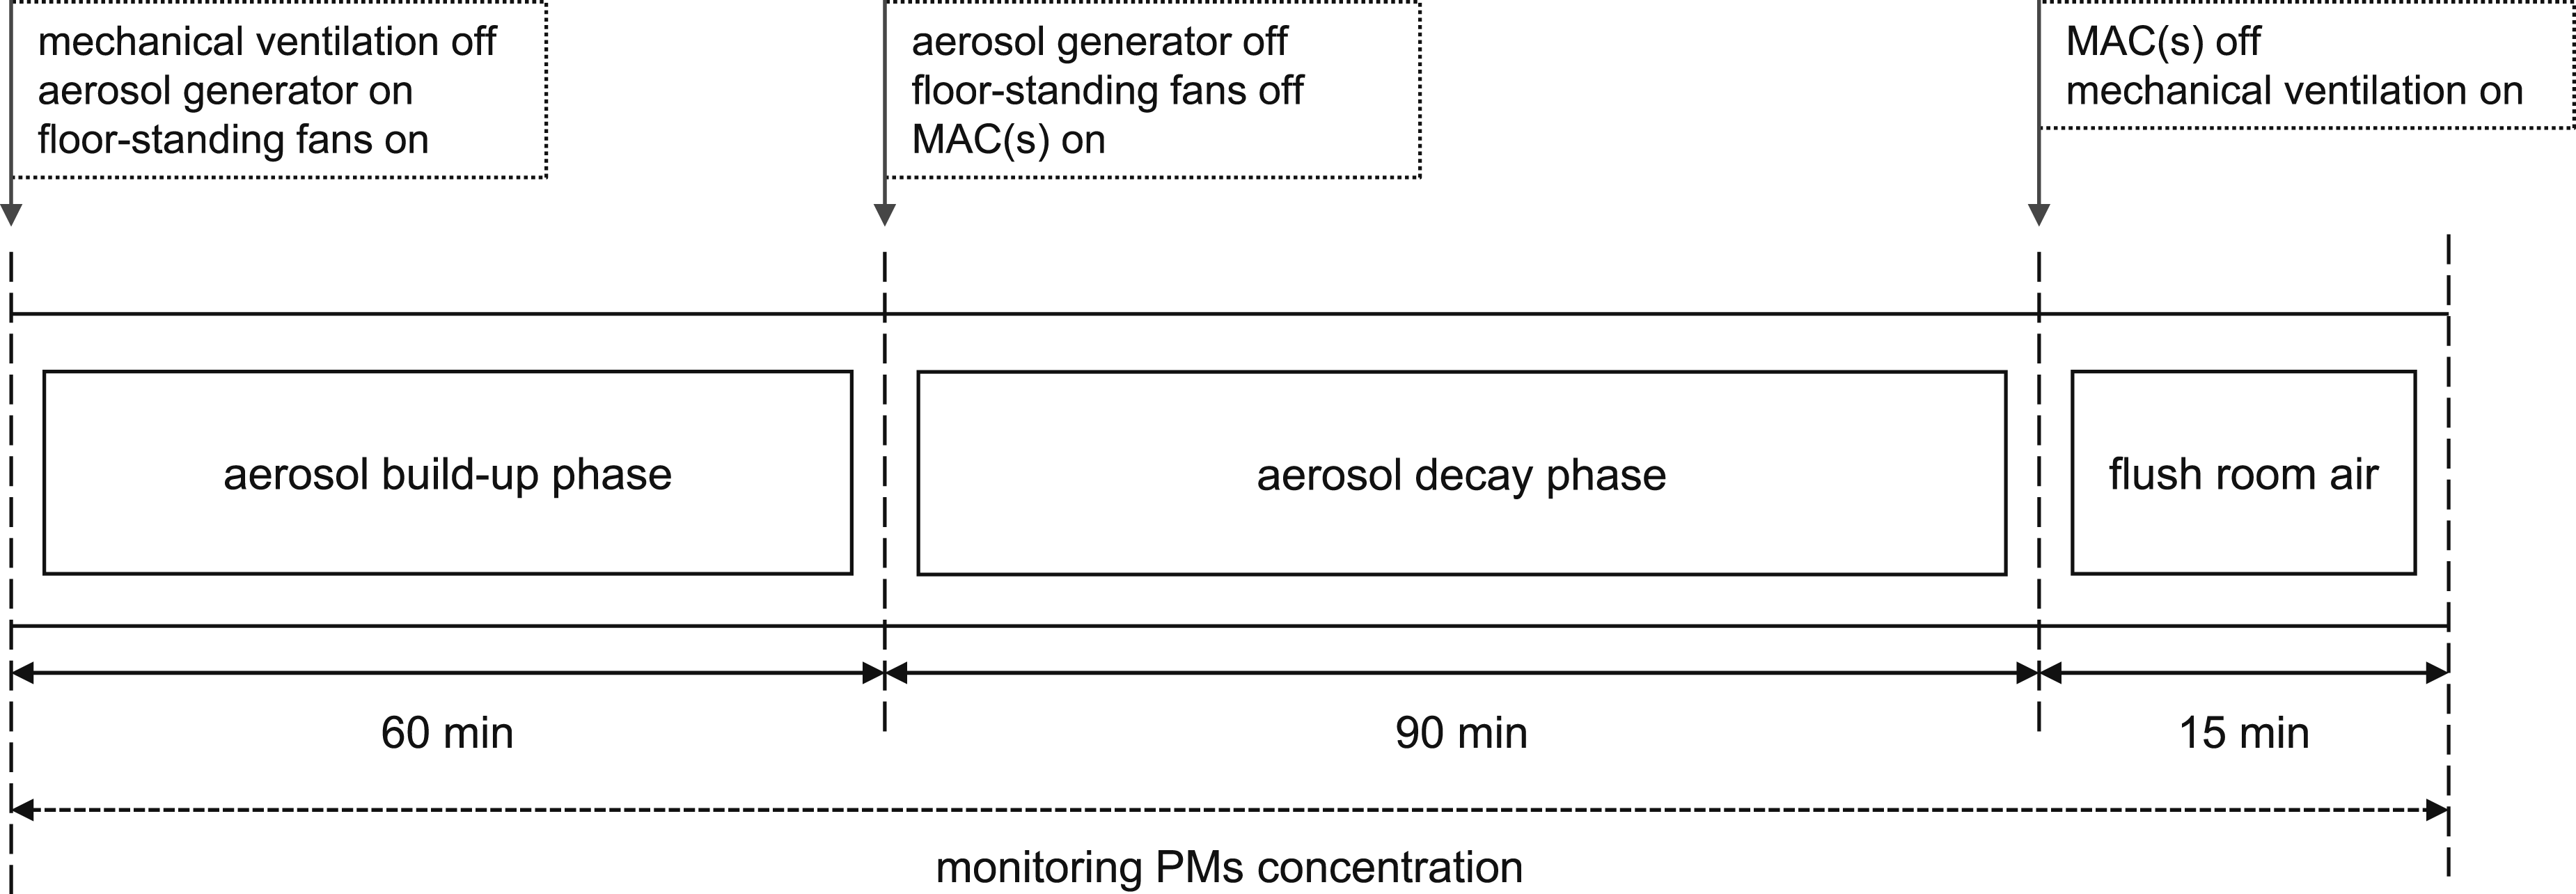
During the tests, everything was set to be remotely controlled (except for MAC5), and the mechanical ventilation system was turned off with the windows and door closed. In addition, as natural decay (possibly due to gravitational sedimentation in this room) can always take place simultaneously, independent tests of natural decay were performed at different times during two consecutive days in May and 1 day in July, without any MACs or mechanical ventilation operating in the room. Moreover, air temperature and relative humidity were measured in the meantime by six HOBO® loggers (model: MX1102 A) placed next to the PM sensors, with a logging interval of 1 min.
Aerosol removal rate and clean air delivery rate (CADR)
The total decay (with single or multiple devices, depending on the configuration) and natural decay of aerosol concentration can be described by equation (1)56,57:
Hence, 
As mentioned previously, CADR is a widely adopted indicator of the performance of MACs, as it indicates both the aerosol removal efficiency and the airflow rate the device can achieve. The CADR of the MAC (with single or multiple devices, depending on the configuration) is determined by equation (3)56,57:
Panel perception test
Subjects and questionnaires
Eight PhD students (four males and four females, aged from 28 to 35 years) were recruited as subjects for the perception tests during June and July 2023. For each perception test, a panel of six subjects (three male and three female) was formed to evaluate the sound and air movement generated by MACs. The subjects were first asked to report their perception (feel/not feel) of the sound and air movement. If they did sense any sound and/or air movement, they were further asked to rate the intensity and assessment using a five-point scale: • Intensity: for sound: from ‘quiet’ to ‘loud’; for air movement: from ‘mild’ to ‘strong’. • Assessment: for sound and air movement: from ‘bad’ to ‘good’.
For air movement, an extra question was included, asking the subjects to specify which body part(s) they sensed it.
Test conditions and procedure
Conditions of the panel perception test of the selected mobile air cleaners.
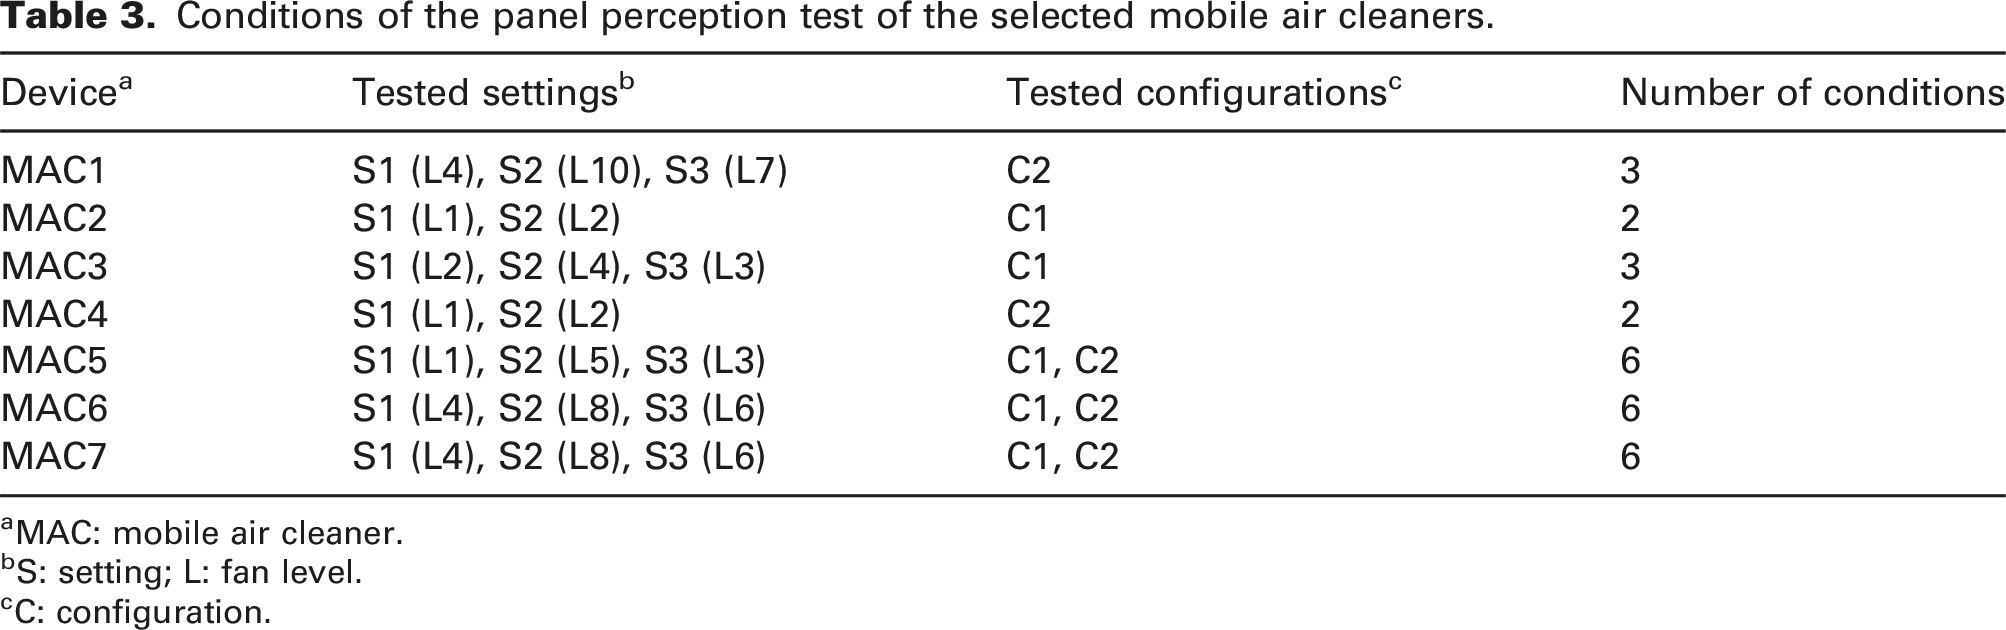
aMAC: mobile air cleaner.
bS: setting; L: fan level.
cC: configuration.
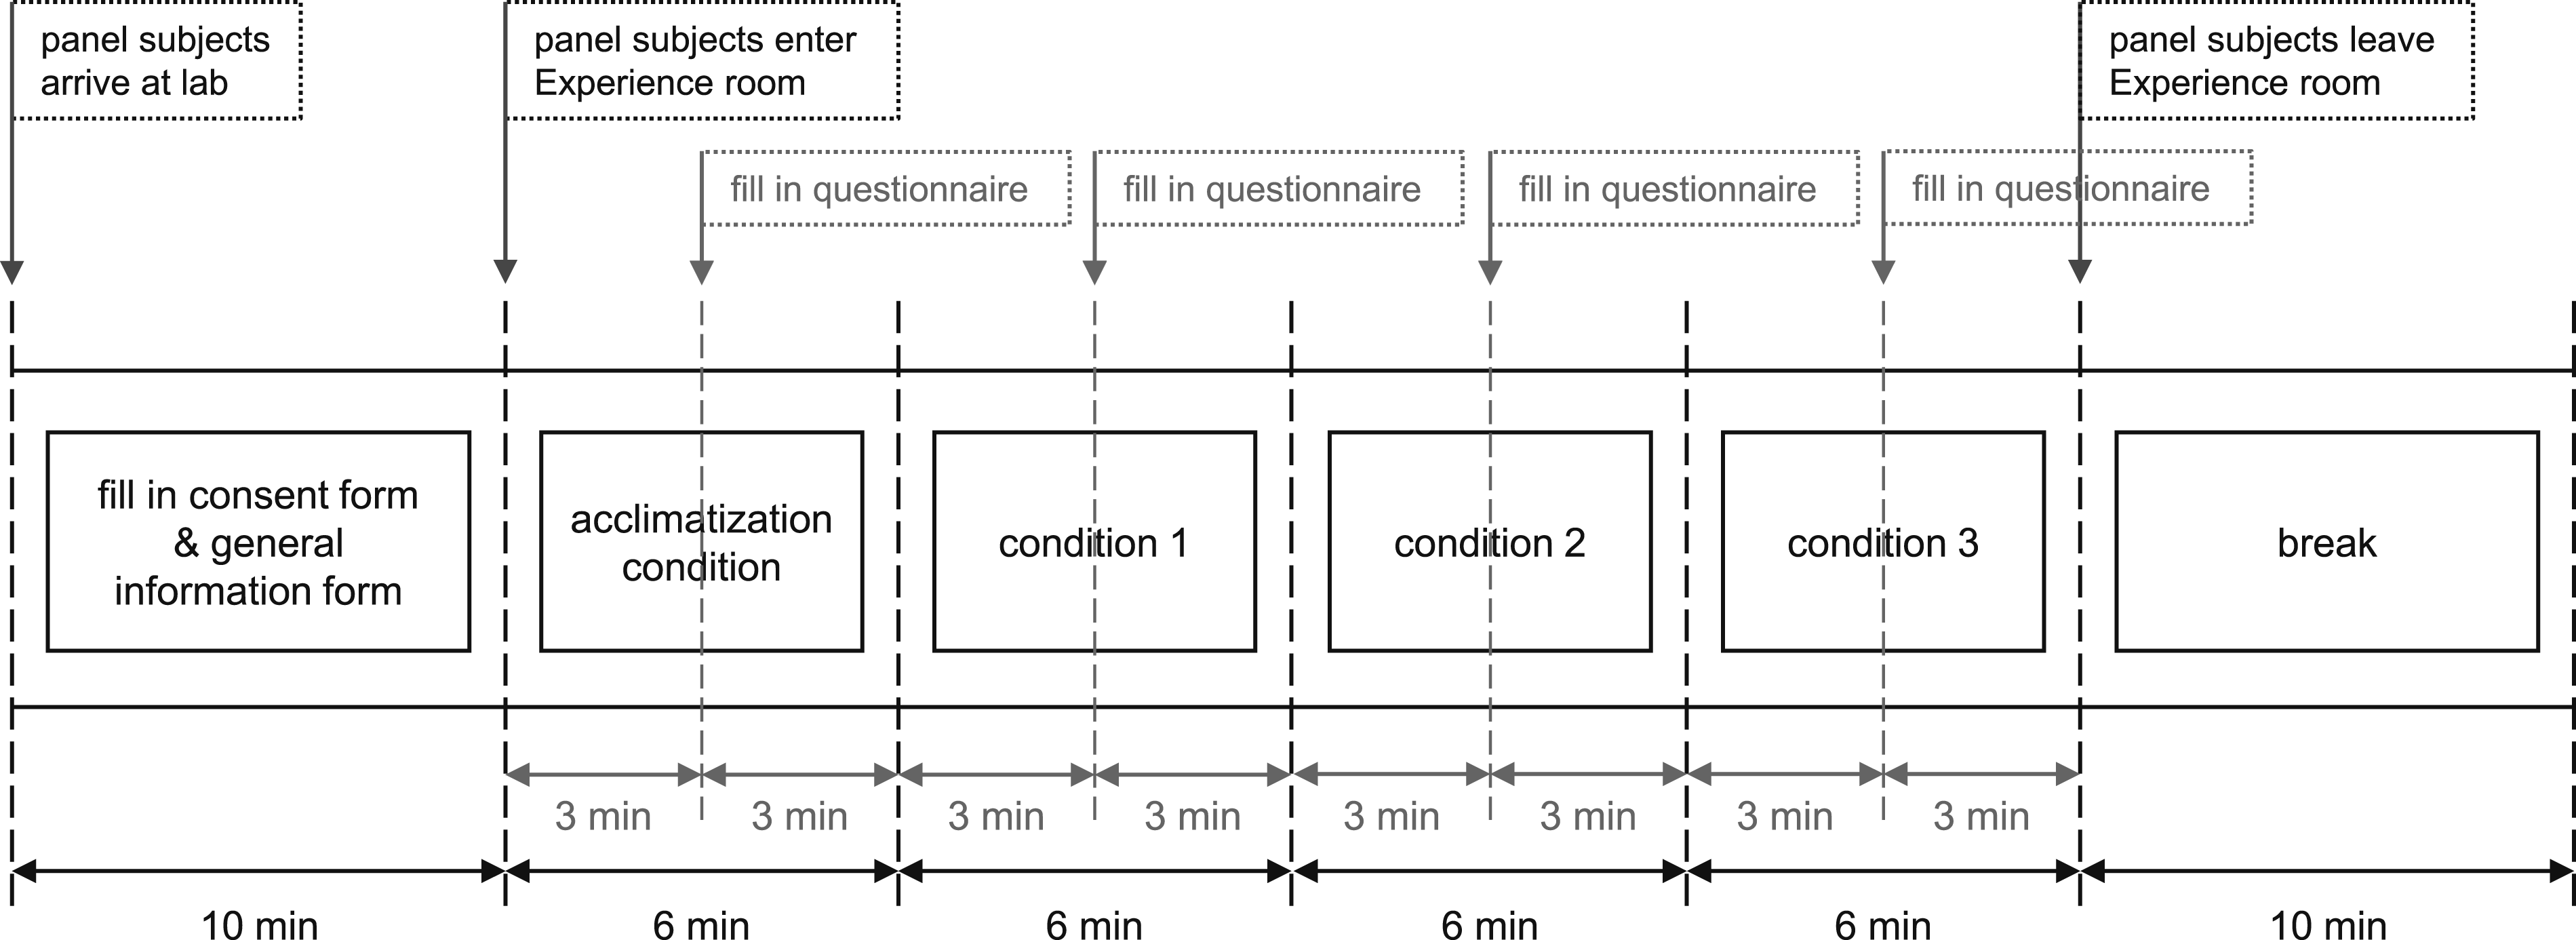
When the subjects arrived, they were asked to rest for 10 min in the waiting area while completing a consent form and a general information form to report their mood and the clothing they wore at the time, after which they were seated at six tables in the Experience room (same as the aerosol decay test) (Figure 8). Each type of MAC was tested during an independent session, which started with an acclimatization condition (MAC(s) off), followed by the real test conditions (MAC(s) on). Figure 9 shows the procedure of the panel perception test with a sample session of three test conditions. Each test condition lasted for 6 min, during which the MAC(s) was (were) turned on for 5 min, and then turned off for the last minute. The subjects were asked to complete the questionnaire 3 min after the condition started. For each session, the test conditions were conducted in a randomized order. After each session, there was a 10-min break for switching the MACs and preparing for the next session, when the subjects were asked to leave the room. The mechanical ventilation system in the Experience room was turned off during the sessions, while during the breaks it was turned on to flush the room air. In addition, air temperature and relative humidity were measured in the meantime by six HOBO® loggers (model: MX1102A), with a logging interval of 1 min. Set-up of the panel perception test: view from the top of the experience room, where A, B, C, D, E and F represent the tables, the dark blue rectangle represents the smartboard, and the light blue rectangles represent the door (top) and windows (bottom). Procedure of the panel perception test (example with a session of three test conditions).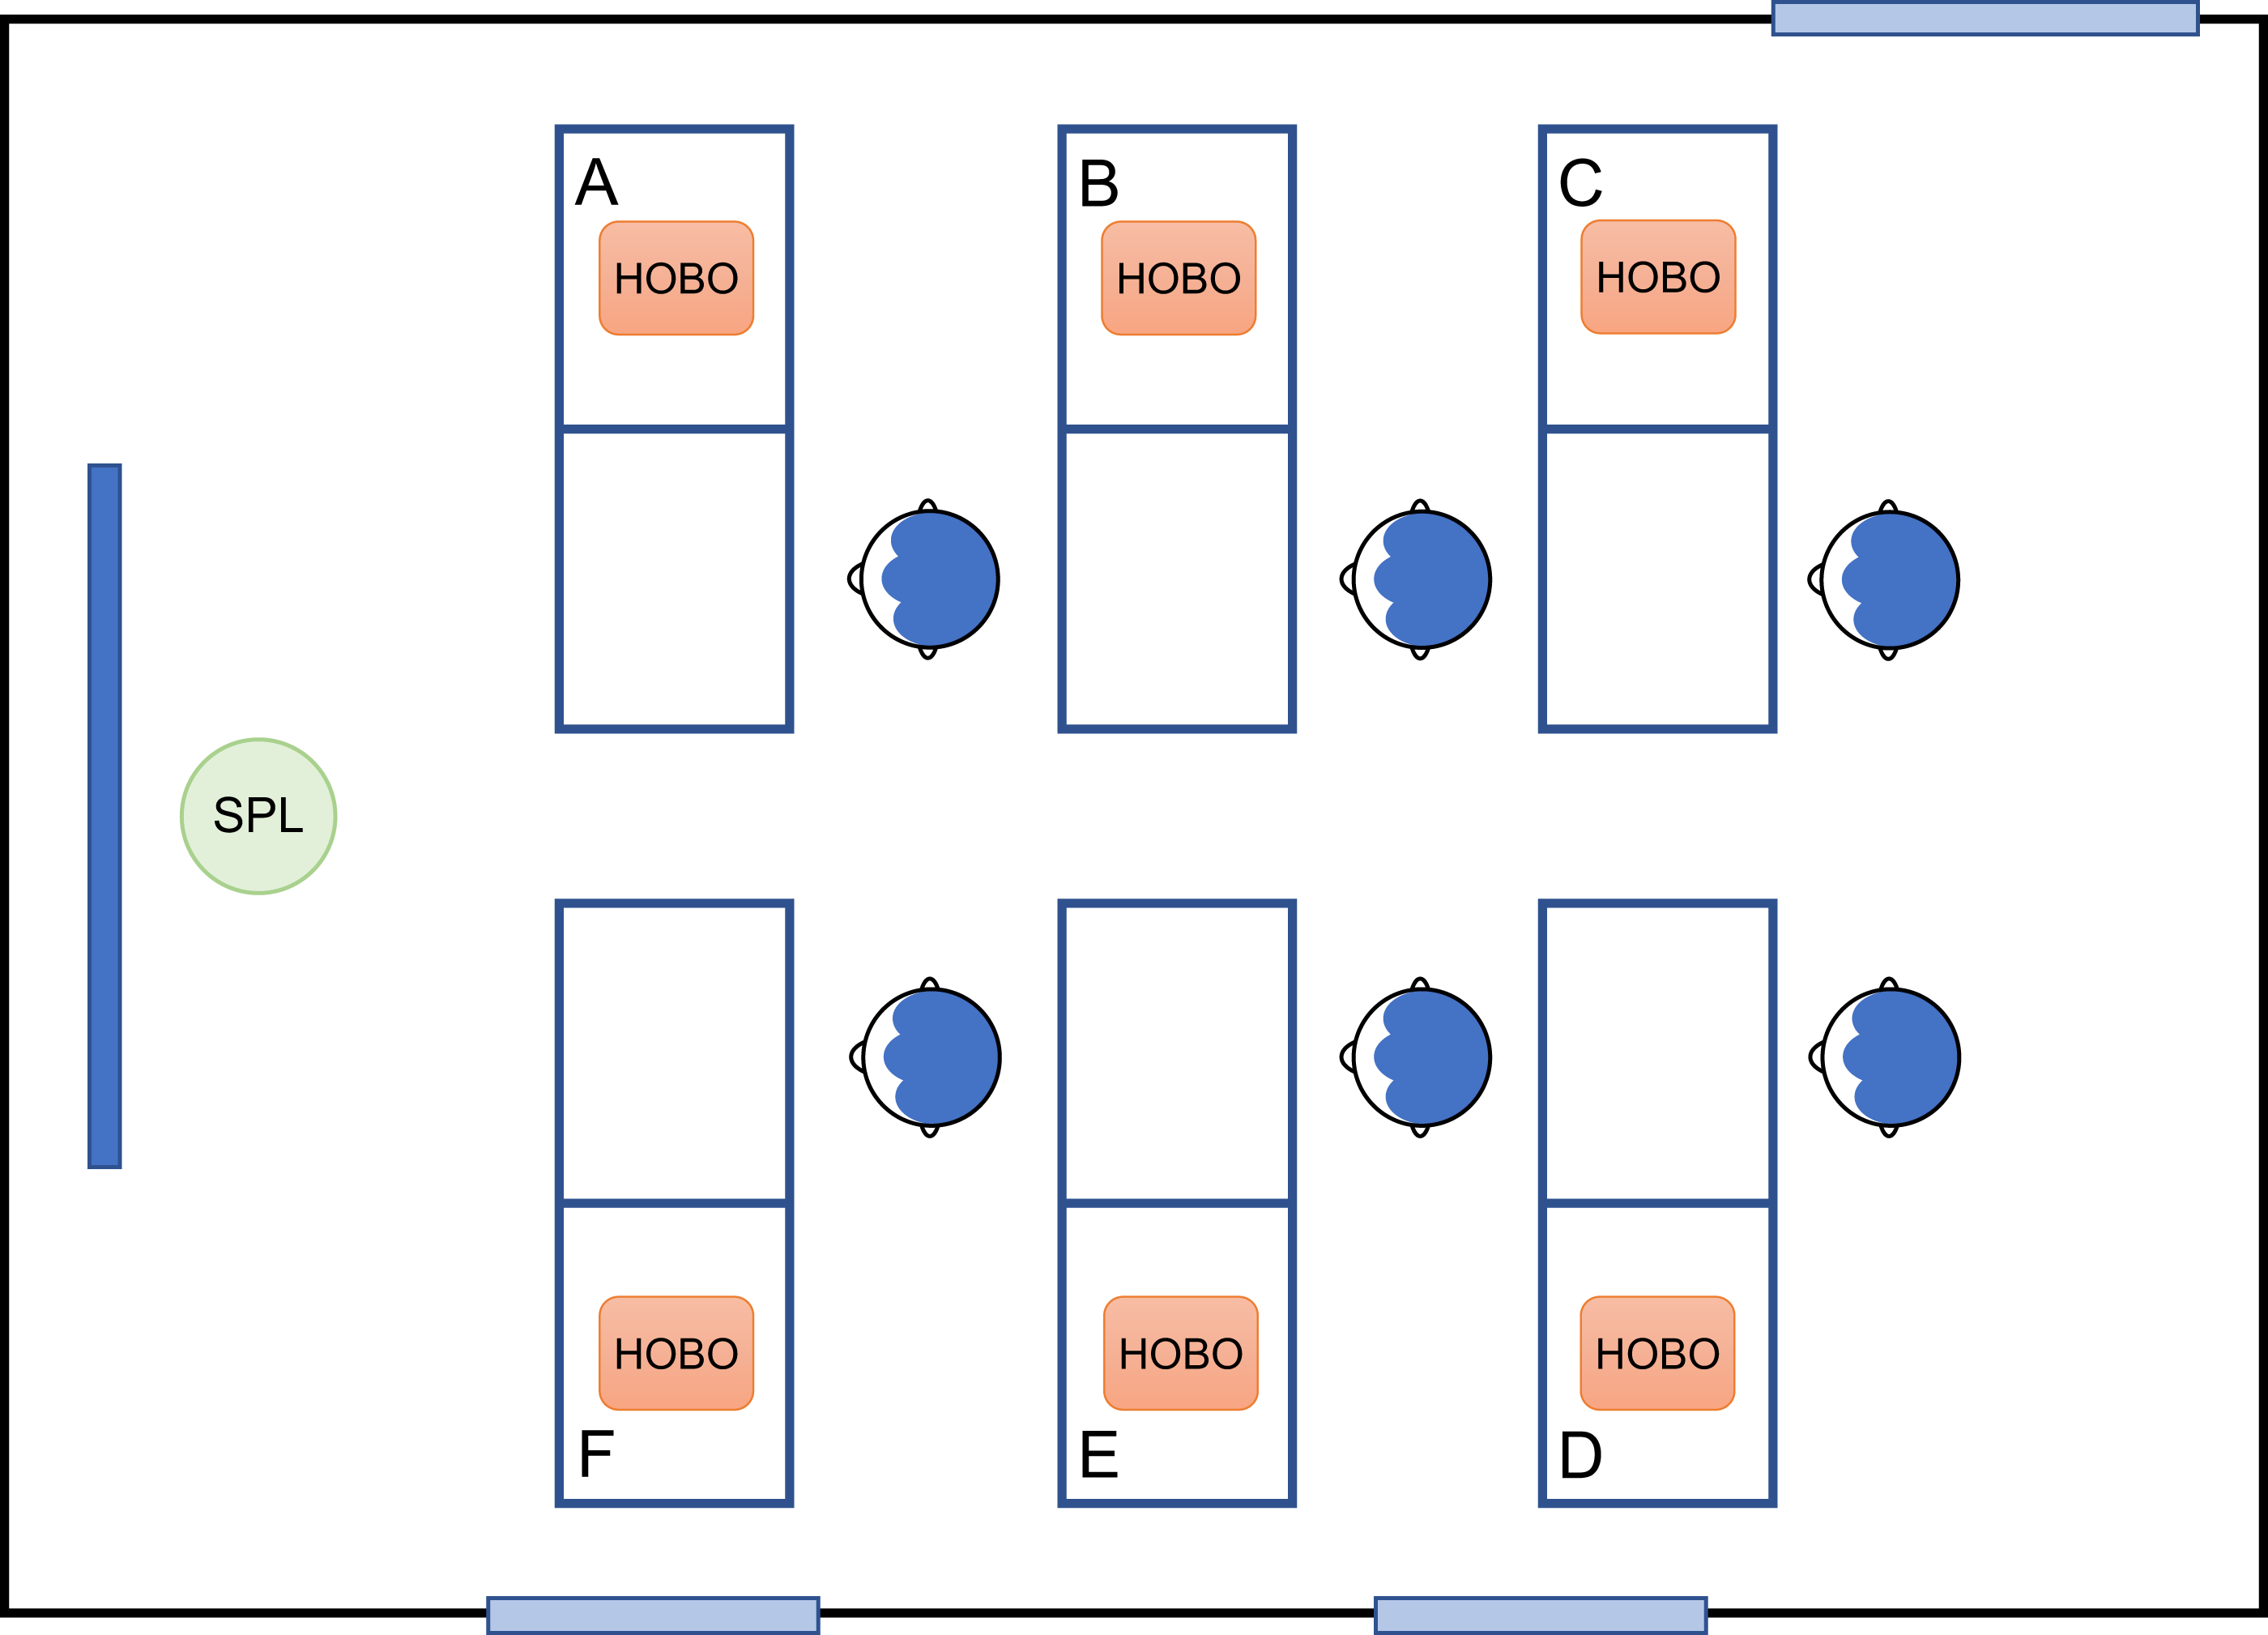
Measurements of sound pressure level and air velocity
The sound pressure level (SPL) was measured using a Norsonic sound analyzer (model: Nor140), which was placed at the front of the room (Figure 5), both during the panel perception test and after, when the room was empty. Each measurement lasted for 2 min. The air velocity was measured using a Dantec ComfortSense anemometer (model: 54T033), which was placed in front of each table where the subjects were seated, at a height of 1.1 m (breathing zone). The air velocity measurements were conducted after the panel perception test, and each measurement lasted for 3 min.
Ethical aspects
This study was approved by the Human Research Ethics Committee (HREC) of Delft University of Technology on 16th April 2023 (Case ID: 3007).
Application in a real classroom
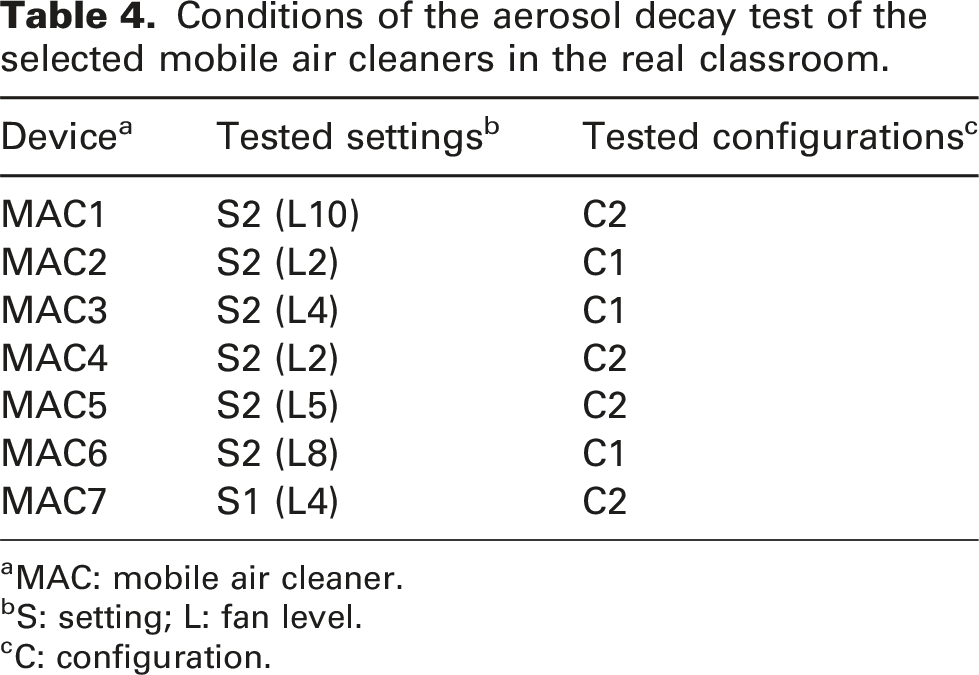
To examine the performance of the MACs in real-world scenarios and also as a validation of the results of the lab experiment, an aerosol decay test was further conducted in a real classroom at the Faculty of Architecture and the Built Environment of Delft University of Technology during July 2023. The classroom has a size of 6.7 (l) × 6.1 (b) × 3.4 (h) = 139.0 m3, with six openable windows and one door (Figure 10). The classroom was equipped with a mechanical ventilation system with air supplies on both sides and an air exhaust in the middle of the ceiling. Based on the results of both the aerosol decay test and the panel perception test conducted in the Experience room, one optimal condition was selected for each MAC to be tested in the classroom, as listed in Table 4. The procedure of the aerosol decay test was the same as performed in the Experience room, with the same instruments and set-up. One natural decay test was performed. During the test the windows and door were closed, yet the mechanical ventilation in the classroom was kept on due to building management. The calculations of aerosol removal rate and CADR were conducted using the same methods as the lab experiment. Set-up of the aerosol decay test in the classroom. Conditions of the aerosol decay test of the selected mobile air cleaners in the real classroom. aMAC: mobile air cleaner. bS: setting; L: fan level. cC: configuration.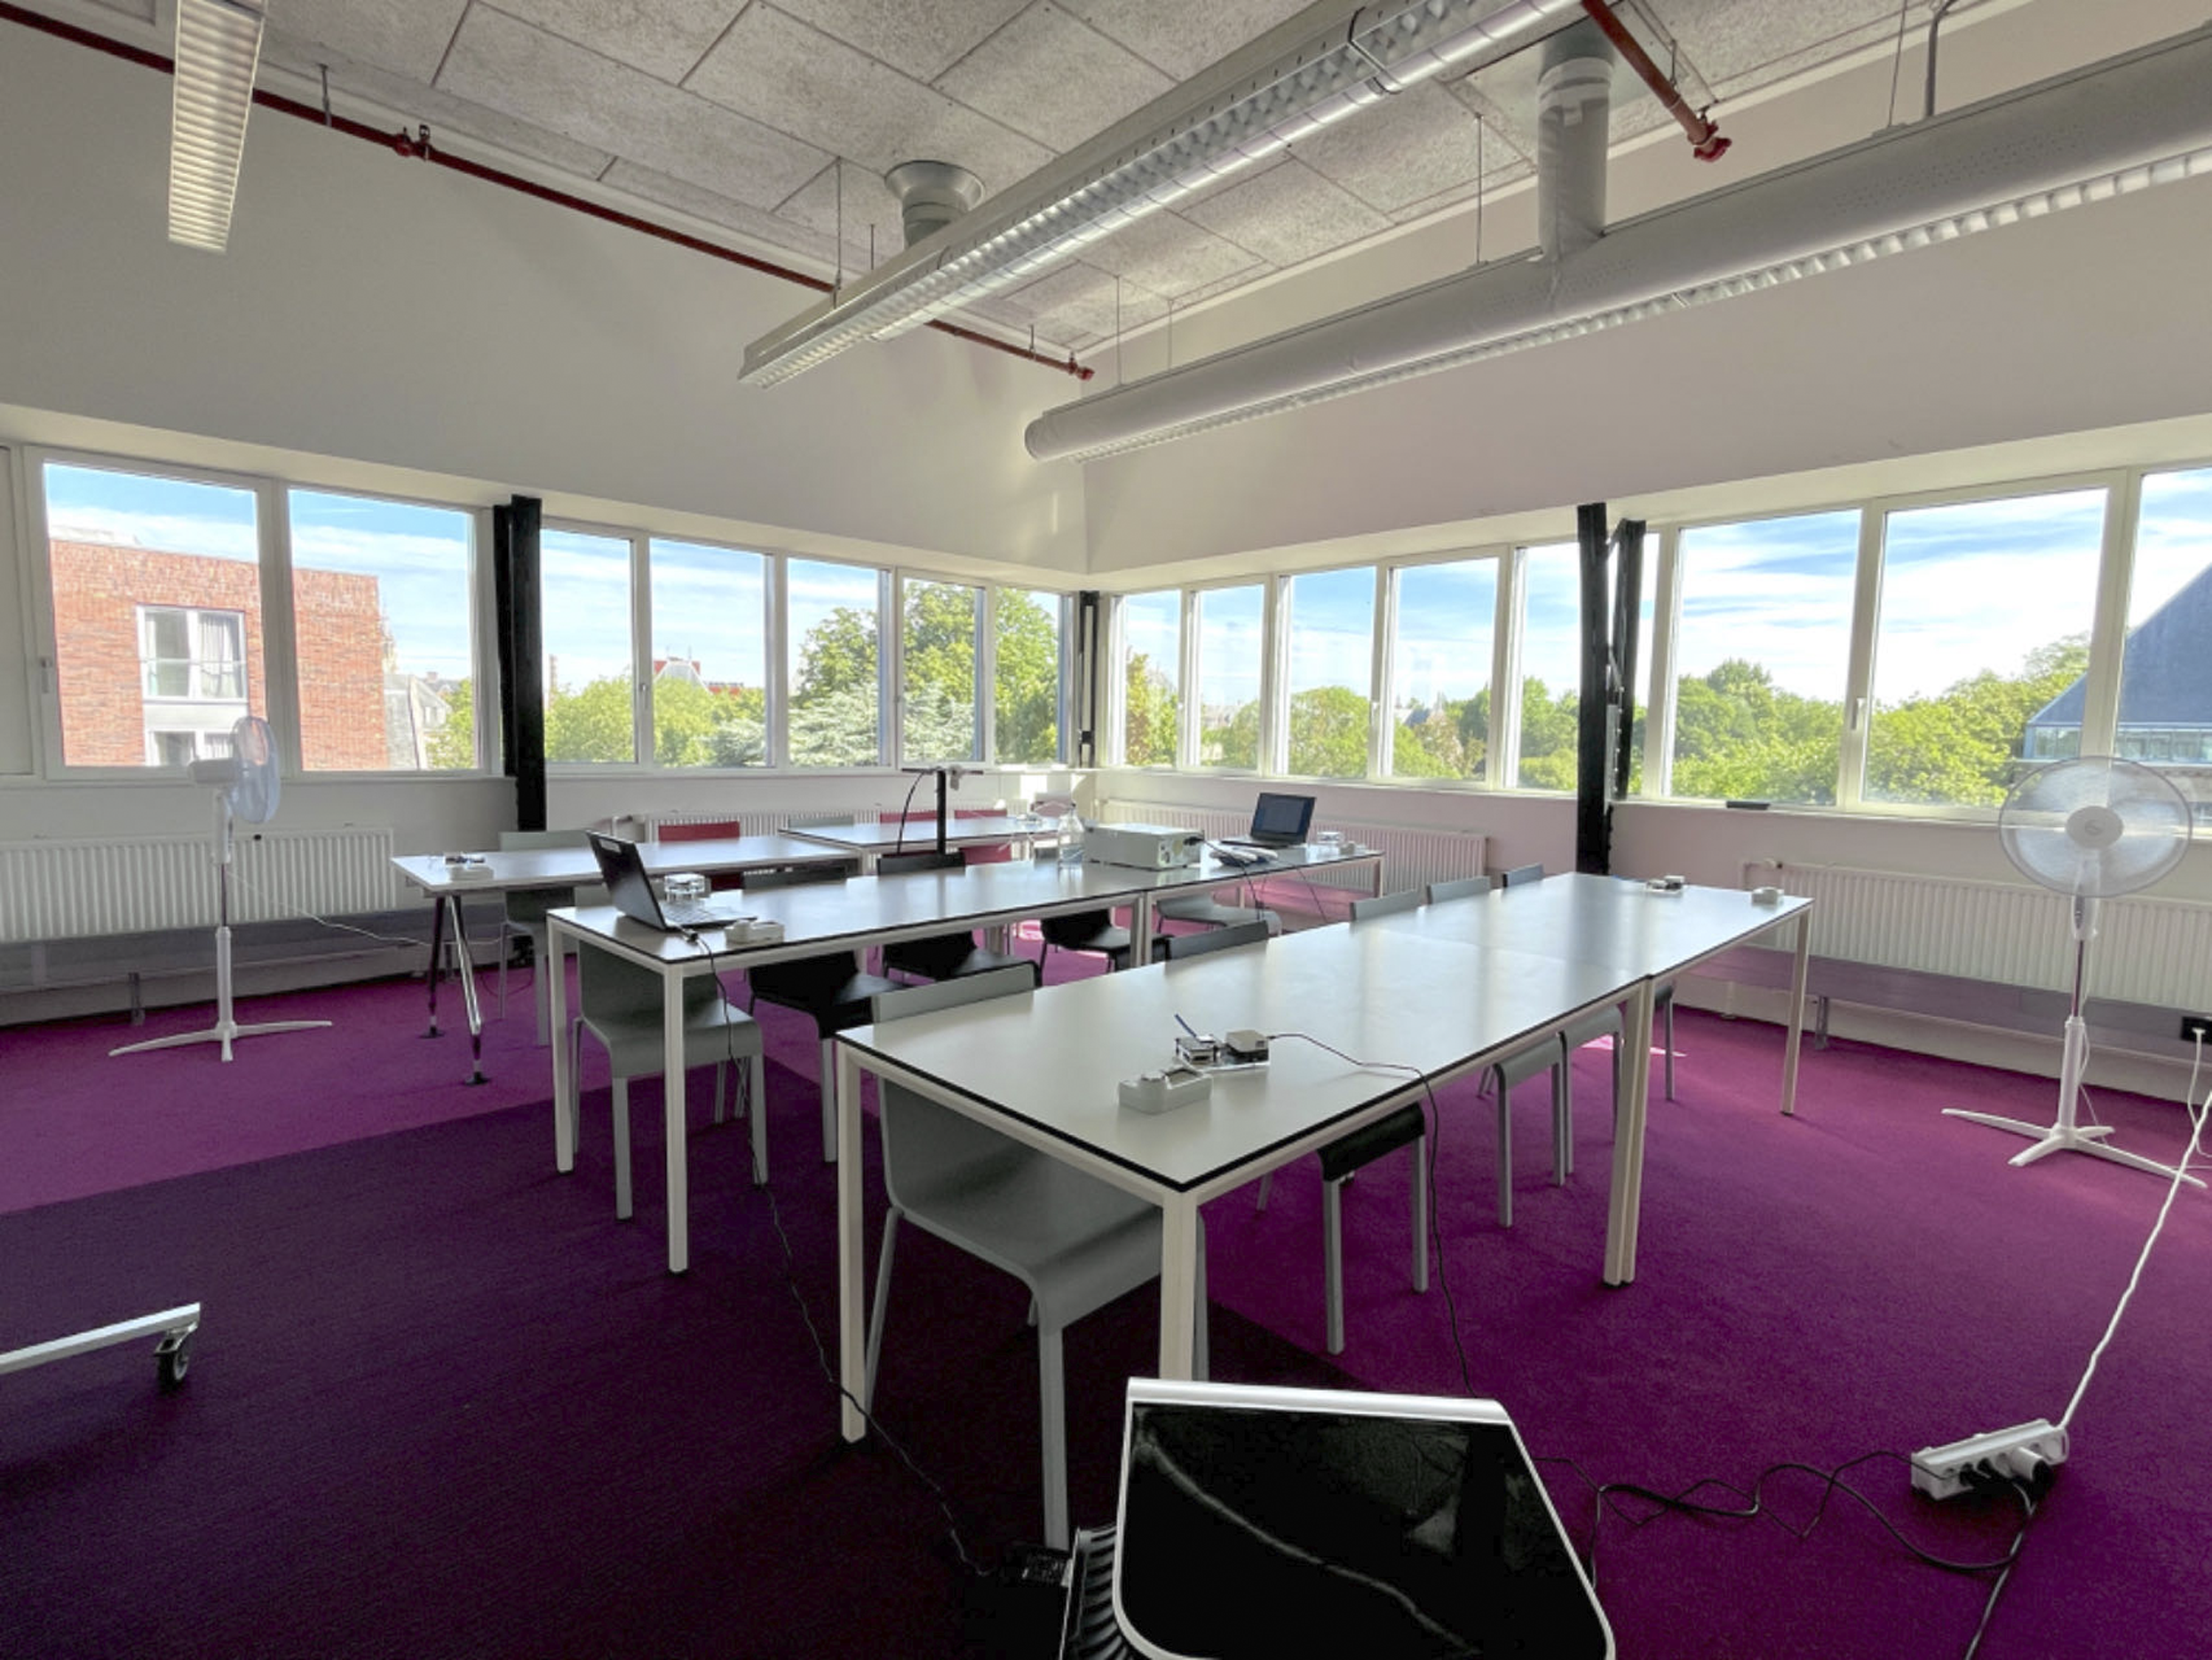
Results
Aerosol decay test
Aerosol removal rate
For all MACs, the total decay rates of both PM2.5 and PM10 were similar amongst the six sampling points (more details in dataset
58
). Hence, for each condition, the average aerosol concentration was calculated amongst the six locations at each time point, and the average total decay curve was determined using equation (1). For natural decay, Original and averaged aerosol concentrations and the fitted average decay curve of PM2.5 (left) and PM10 (right) of MAC1 operating at setting 1 under configuration 1 (S1_C1) in the experience room.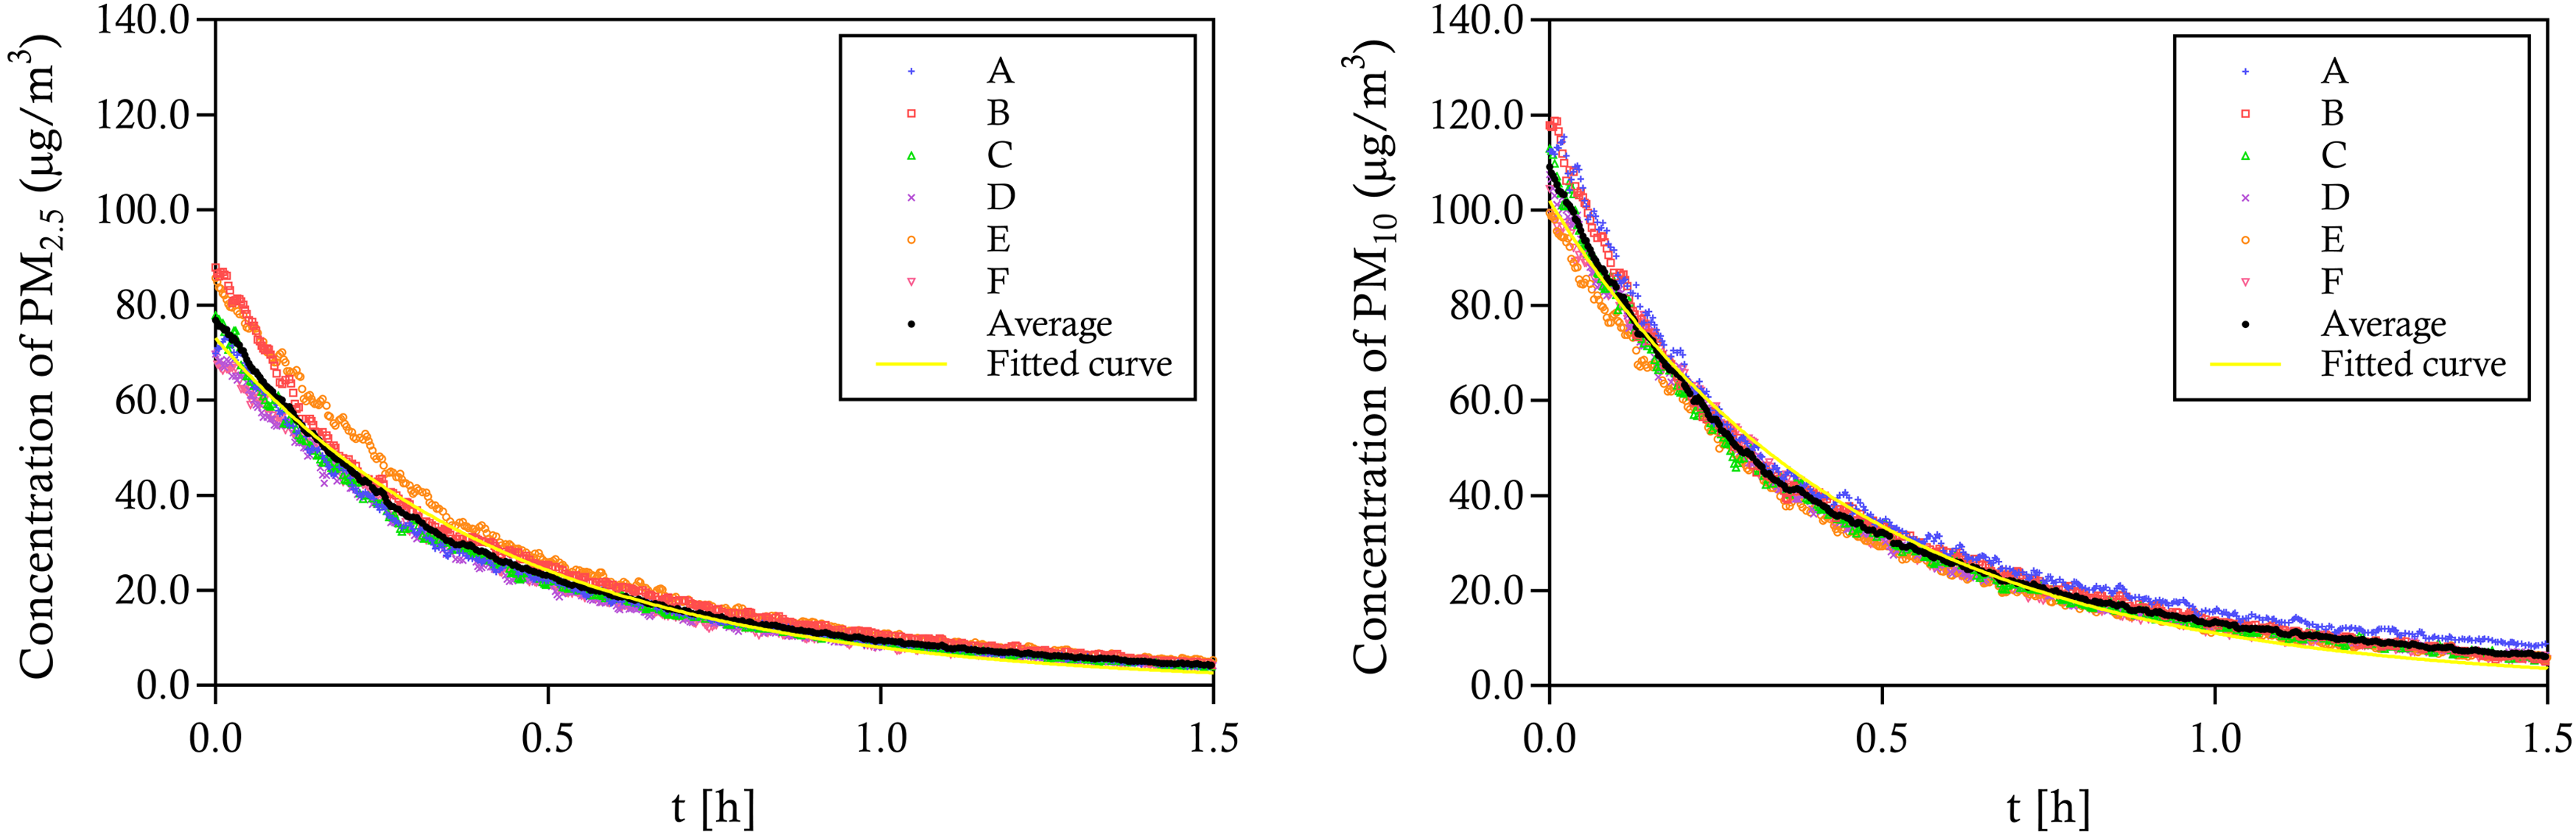
As the initial concentration 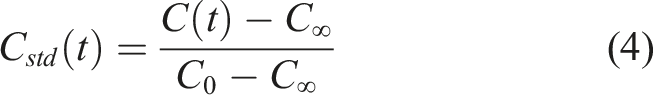
The results of the standardized average curves are shown in Figure 12. For the natural decay, Standardized fitted average total decay curves of PM2.5 (left) and PM10 (right) for the tested mobile air cleaners in the experience room. The regression functions and R2 are listed in the order of the test conditions (from top to bottom). The standardized average natural decay curves are plotted as the black dashed line (ND). (MAC: mobile air cleaner; S: setting; C: configuration).
Clean air delivery rate (CADR)
The results of CADR are presented in Figure 13 for both PM2.5 and PM10. The same as CADR of PM2.5 (left) and PM10 (right) for the tested mobile air cleaners in the experience room. The green lines denote the total amount of CADR based on 1) the minimum ventilation rate per person required by the Dutch Building Decree
45
(8.5 L/s/person and 918 m3/h in total) and 2) the ventilation rate per person recommended46,47 (10 L/s/person and 1080 m3/h in total), with an assumption of 30 student occupancy. (MAC: mobile air cleaner; S: setting; C: configuration).
Panel perception test
Sound of the mobile air cleaners
The measured SPL of the MACs with and without the panel of subjects is presented in Figure 14, and the outcome of the panel tests is in Table 5. Sound pressure level (SPL) of the tested mobile air cleaners with (left) and without (right) the panel of subjects. The red line denotes the limit of SPL [35 dB(A)] in classrooms as prescribed by the Dutch Fresh Schools guideline.
44
(MAC: mobile air cleaner; S: setting; C: configuration). Results of the panel perception test. aMAC: mobile air cleaner. bS: setting. cC: configuration. dPercentage of subjects that sensed sound or air movement generated by the MAC. eUnacceptability vote: assessment of sound or air movement >3. fUnacceptability percentage amongst subjects who sensed sound or air movement caused by mobile air cleaners. g-: none of the subjects sensed sound or air movement generated by the mobile air cleaners.
The SPL of the MACs was 1-2 dB(A) lower when the room was empty than when occupied. Under the setting of S1, almost all the MACs could maintain an SPL below 35 dB(A). However, when the setting was increased, the SPL immediately exceeded 35 dB(A) under all conditions, some even reached 50 dB(A). The SPL did not increase linearly with the setting level, as for most of the MACs, the SPL at S3 was very close to S2. Furthermore, for MAC5, MAC6 and MAC7 no significant difference in SPL was found between C1 and C2.
All subjects sensed the sound generated by the MACs under almost all conditions. The average sound intensity was mostly quiet (≤2) under S1 while loud (≥4) under S2. For MAC5 and MAC7, the sound intensity was much higher with C1 than with C2 configuration, while for MAC6, the results were the opposite. The results of the sound assessment were related to the sound intensity. Taking the score of 3 as neutral, the average assessment was mostly acceptable (<3) under S1, yet often unacceptable (>3) under S2 and S3. For MAC5 and MAC7, the sound was less acceptable with C1 than C2, while for MAC6, the results were the opposite. Nonetheless, with regards to the percentage of acceptability, for MAC2 operating under S2, although the average assessment was above 3, 50% of the subjects considered the sound to be acceptable. The same results were found for MAC4, MAC5 and MAC6.
Air movement of the mobile air cleaners
The measured air velocity of the MACs is presented in Figure 15, and the outcome of the panel tests is in Table 5. Air velocity of tested mobile air cleaners that were placed at 1.1 m in the experience room. The red line denotes the limit of air velocity for avoiding draught discomfort (0.2 m/s) in classrooms prescribed by the ASHRAE 55 standard.
59
(MAC: mobile air cleaner; S: setting; C: configuration).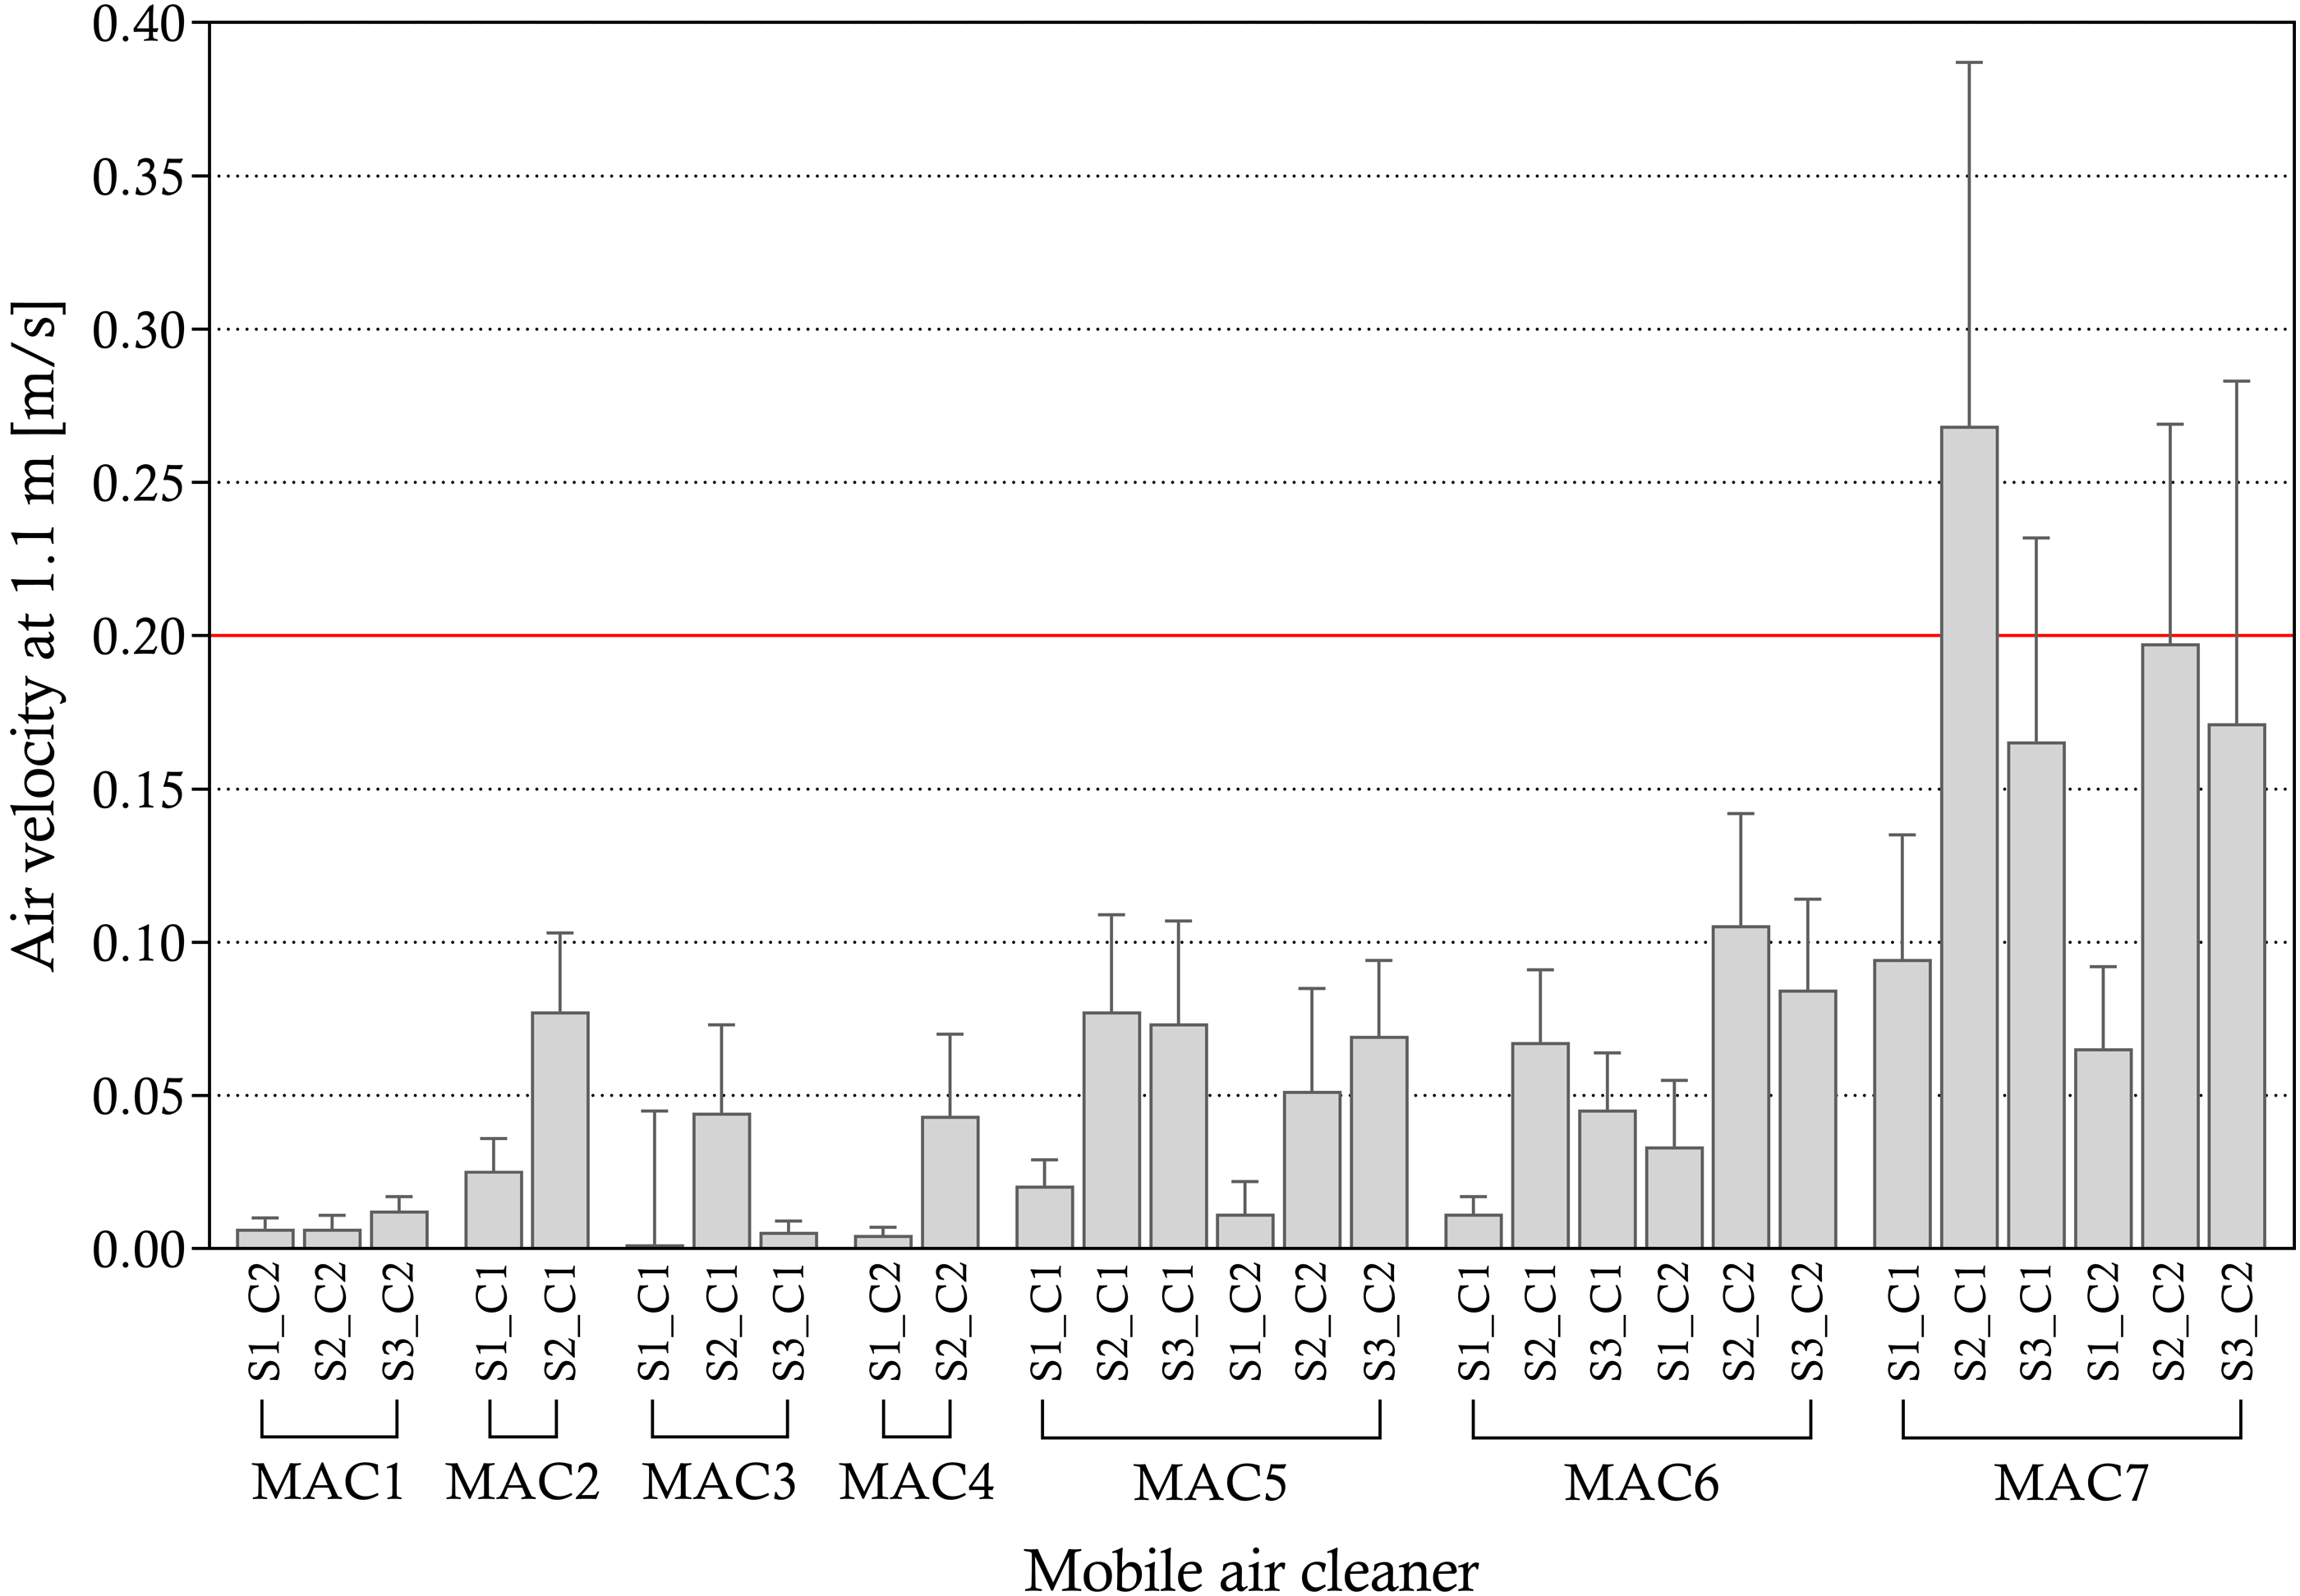
The average air velocity caused by the MACs did not exceed 0.2 m/s, which is specified in several standards and guidelines (e.g. ASHRAE 55 59 ) as the upper limit for avoiding draught discomfort (when the operative temperature is lower than 23°C), except for MAC7 under S2 with C1 configuration. The air velocity, like the sound pressure level, did not show a linear relationship with the setting, as for some MACs the air velocities under S3 were even higher than under S2. Significant differences between the two configurations were found for MAC6 and MAC7: for MAC6, the air velocity was higher with C2 than C1 configuration, while for MAC7, it was the opposite.
The number of subjects that sensed air movement generated by the MACs was much lower than that of sound. Under S1, for most MACs less than 50% of the subjects perceived air movement, except MAC7. The average air movement intensity was mild (≤2) for all conditions, except for MAC5 under S2 with C1 configuration, MAC7 under S2 with both C1 and C2 configurations. Additionally, no difference was observed between the two configurations for MAC5, MAC6 and MAC7. The air movement was assessed to be acceptable under all conditions, except for MAC5 under S2 with C2 configuration. With regards to the body parts where the subjects sensed air movement, face, arms and hands were most frequently recorded (more details in dataset) 58 .
Real classroom test
For MAC1, MAC2, MAC3 and MAC4, the optimal condition selected to be tested in the real classroom was mainly based on the results of the aerosol removal test. The optimal conditions were, for 1) MAC1 and MAC4: under S2 with C2; 2) MAC2 and MAC3: under S2 with C1 configuration. For MAC5, MAC6 and MAC7, the selection of conditions also involved the results of the panel perception test. The optimal conditions are, for 1) MAC5: under S2 with C1 configuration; 2) MAC6: under S2 with C1 configuration; 3) MAC7: under S1 with C2 configuration.
Similar to the lab experiment, the total decay rates of both PM2.5 and PM10 in the real classroom amongst six sampling points were similar (more details in dataset
58
). Hence, the average total decay curves were calculated accordingly. The natural decay in the real classroom also included the aerosol removal caused by the mechanical ventilation present, resulting in a higher Standardized fitted average total decay curves of PM2.5 (left) and PM10 (right) for the tested mobile air cleaners in the classroom. The regression functions and R2 are listed in the order of the test conditions (from top to bottom). The standardized average natural decay curves are plotted as the black dashed line (ND). (MAC: mobile air cleaner; S: setting; C: configuration).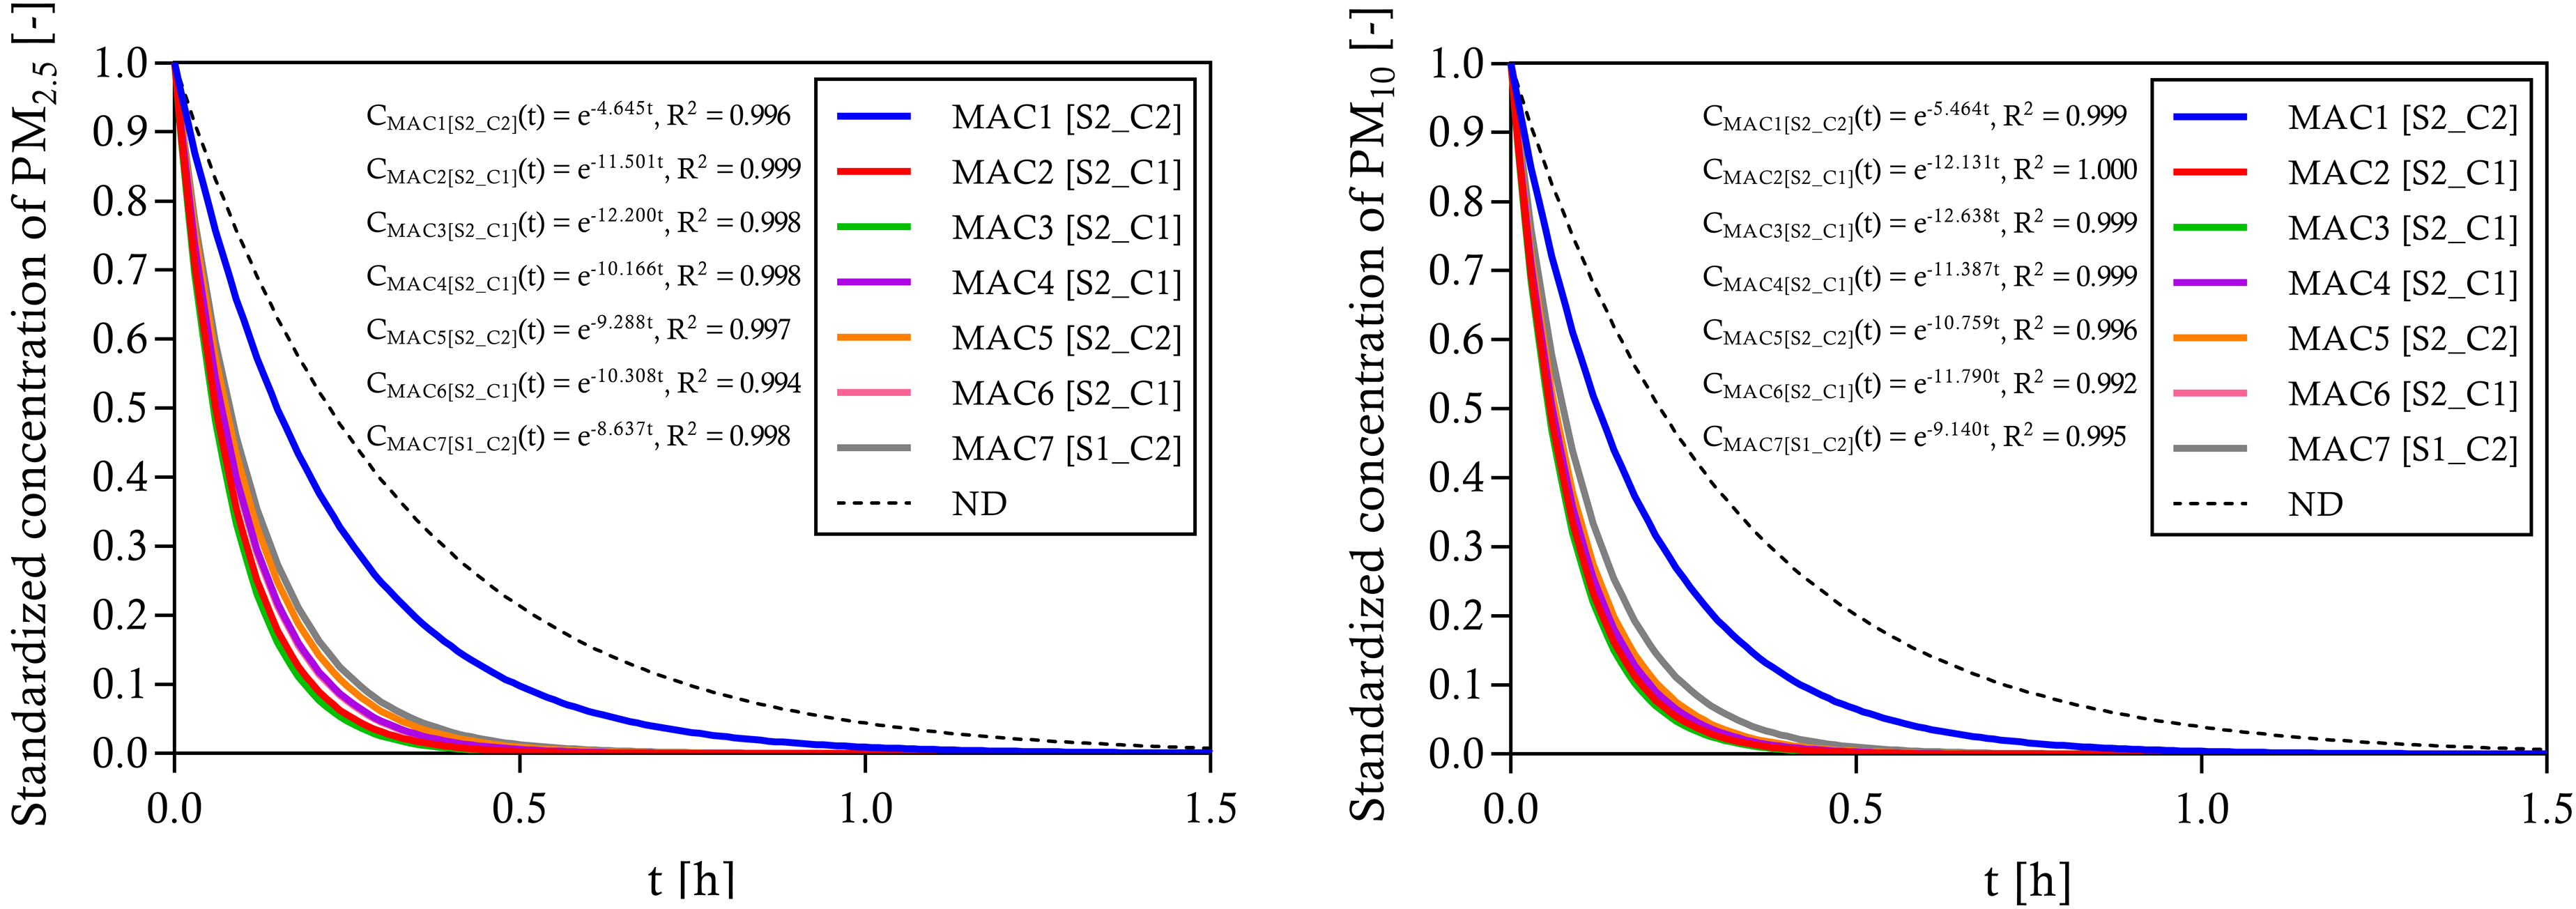
According to Figure 16, for
The results of CADR are presented in Figure 17 for both PM2.5 and PM10. The same as CADR of PM2.5 (left) and PM10 (right) for the tested mobile air cleaners in the classroom. The green lines denote the total amount of CADR based on 1) the minimum ventilation rate per person required by the Dutch Building Decree
44
(8.5 L/s/person and 918 m3/h in total) and 2) the ventilation rate per person recommended45,46 (10 L/s/person and 1080 m3/h in total), with an assumption of 30 student occupancy. (MAC: mobile air cleaner; S: setting; C: configuration).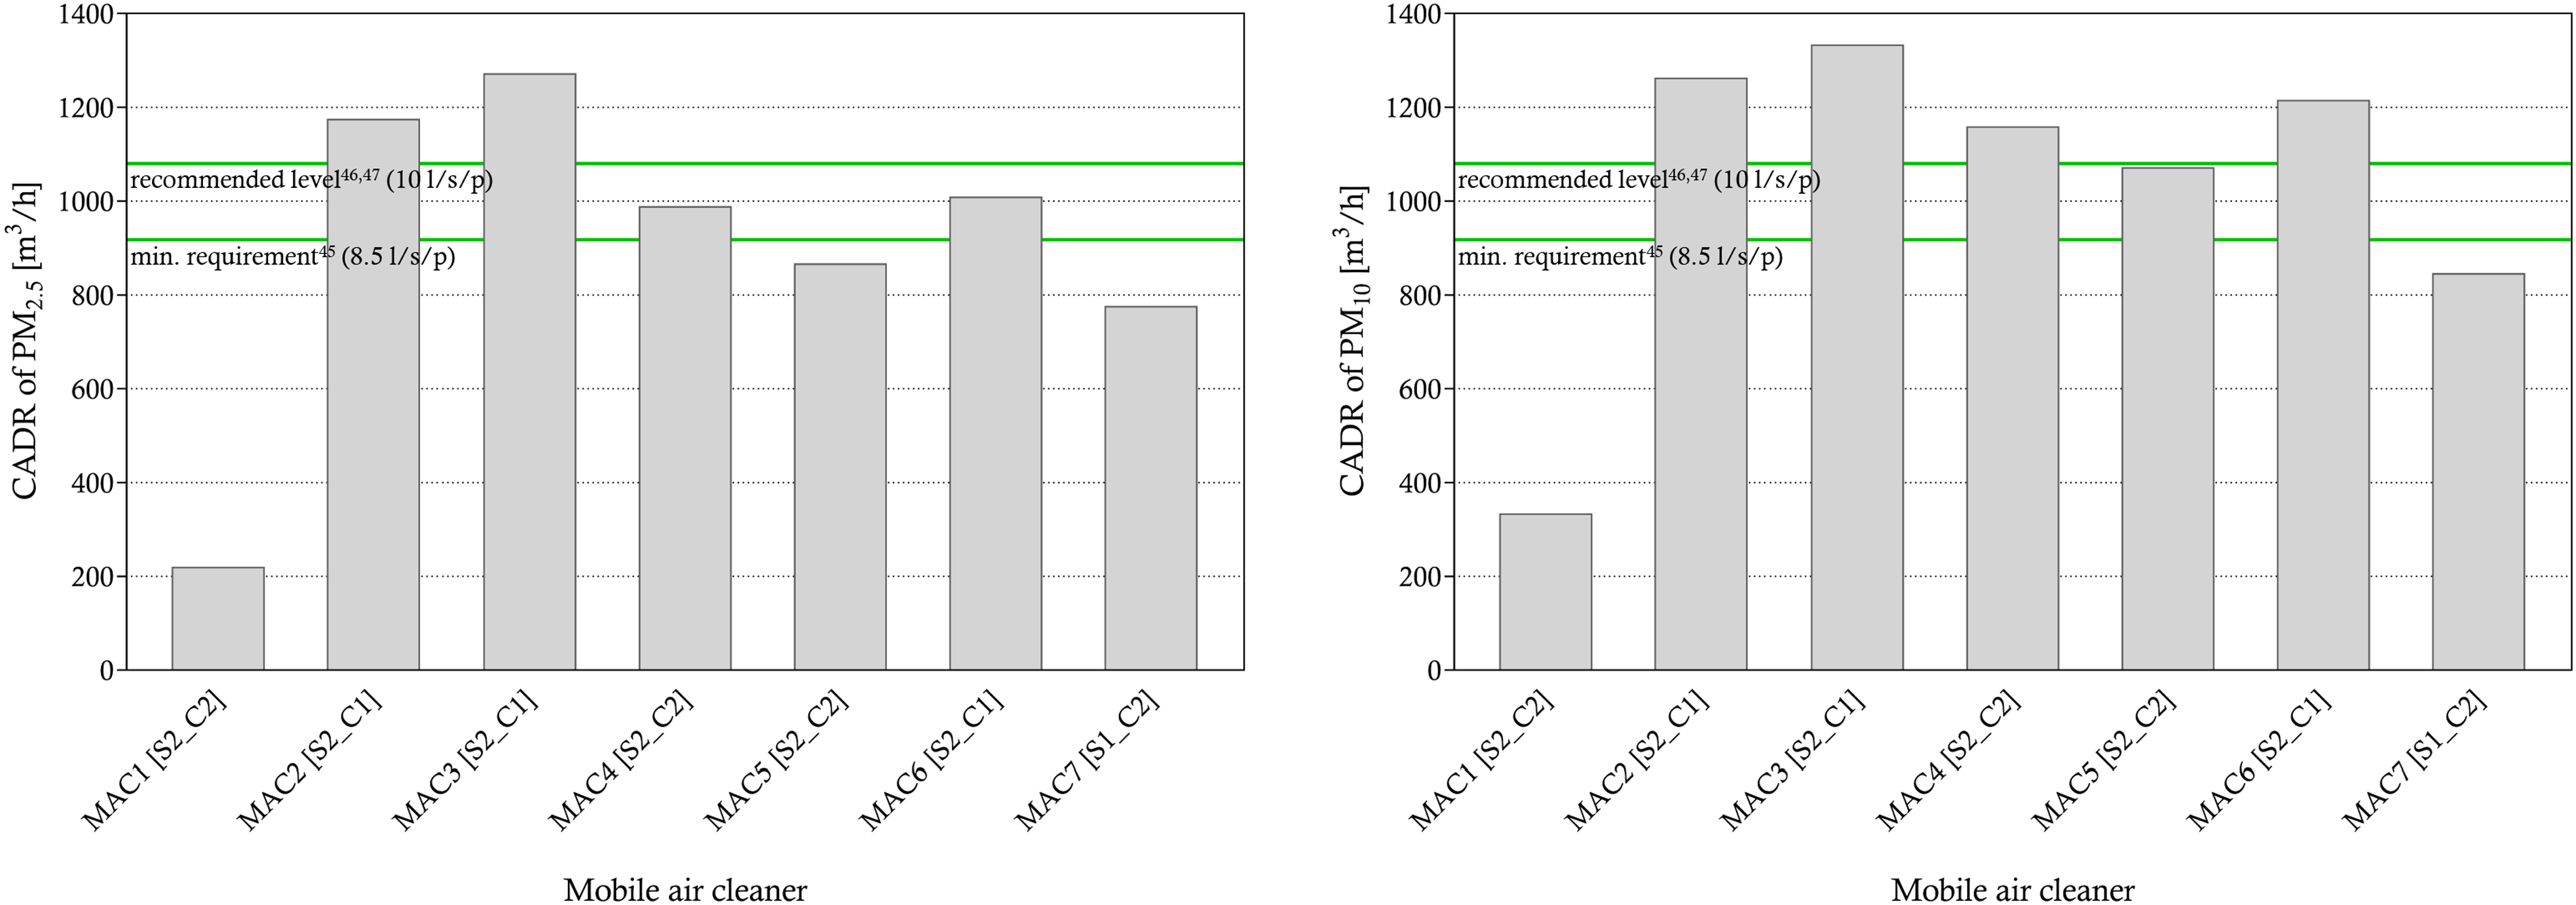
Discussion
Assessment of aerosol removal rate and CADR
The results of the aerosol decay test clearly showed that the selected MACs were able to remove respiratory aerosols evenly at different locations in the room. However, since great differences were observed amongst the MACs, certain factors were indicated to be more important than others regarding the aerosol removal rate and CADR.
For aerosol removal, MAC1, MAC6 and MAC7 used HEPA filters, MAC3, MAC4 and MAC5 used ES filters, while MAC2 had both HEPA and ES filters (Table 1). As presented in Figures 9 and 10, MAC2 to MAC6 showed similar results, while MAC1 and MAC7 were the lowest and highest, respectively, which indicates that the air cleaning technologies used by the MACs had little influence on the differences in aerosol removal and CADR.
On the other hand, such results indicate that the aerosol removal rate and CADR of the MACs were related to the airflow patterns induced by the MACs, especially the air outlet. As shown in Table 1, MAC2 to MAC6 all supplied the clean air vertically from the top (MAC4 also horizontally from the front), while for MAC1 the airflow was supplied horizontally from the top and for MAC7 radially at an angle of 45° above the horizontal plane. Therefore, for small- and medium-sized floor-standing MACs (standing at a height of 0.5–1 m), an air supply at a higher angle or vertically up can promote clean air to travel further and reach a wider area in the room. MAC7 was the only one equipped with a centrifugal fan while the other six all used axial fans, which might be the reason that MAC7 has a higher CADR than the others.
The aerosol removal rate and CADR of some MACs were also found to be associated with their in-room location. For instance, MAC5 showed a higher CADR of 100–150 m3/h under C2 than C1, which might be because, with only one device used, the location closer to the centre could better distribute the clean air throughout the room, giving the type of air supply it had. For MAC6, the CADR was higher by 100 m3/h with C1 than C2 configurations, which could be due to that the middle position in the room allowed better distribution of clean air delivered horizontally from the front. For MAC7, the CADR was 130 m3/h higher with C2 than C1 configuration under S1; yet, the difference became negligible under S2. A possible explanation could be that with C2 configuration, the airflow of MAC7 was more towards the occupied zone (where the sensors were located), yet such difference was compensated by the high airflow rate under S2.
Since the tested MACs did not achieve the nominal CADR mentioned in the specifications even in the mock-up classroom, the number of devices adopted in this study (or more) should be considered necessary for practical use in real classrooms. In addition, for MAC4, MAC6 and MAC7, although the CADR of only using one device at S2 was found to be comparable with that of two devices operating under S1, such levels of CADR did not fulfil the requirements. For MAC2, the CADR of only using two devices under S2 was not better than using four devices under S1.
In summary, when adopting high efficiency (≥H13) MACs in classrooms, it is more important to consider the induced airflow pattern generated by the devices and the air distribution in the room, which are mostly dependent on the configuration of the clean air supply and the location of the MACs. To achieve a better understanding of this, a more detailed investigation, such as computational fluid dynamics (CFD) modelling, is needed. Moreover, the aerosol removal rates can readily be used to do a risk analysis in case the aerosols contain airborne virus particles such as SARS-CoV-2. 60
Assessment of sound and air movement
Assessment of sound
Overall, the SPL and perceived sound intensity of the MACs mainly increased with the settings, and higher SPLs and sound intensities often resulted in a worse sound assessment and a higher percentage of unacceptability (Figure 14 and Table 5). The fact that most of the MACs need to operate at the maximum fan capacity to achieve a desired CADR inevitably led to SPLs always exceeding the prescribed limit. Still, in some cases, with maximum setting more than half of the panel subjects considered the sound to be acceptable. Similar results were found in studies conducted by Curtuis et al. 33 and Granzin et al. 38 Another factor that showed moderate influence on the sound was the air cleaning technology used. The MACs using only ES filters showed a lower SPL compared to the ones using HEPA filters at S1. This could be because of the lower resistance of ES filters for air to pass through than HEPA filters. However, such a difference became negligible when the MACs were operated under S2. Similar results were observed in the panel tests (Table 5). Under S1, the MACs using ES filters, the panel sensed a lower sound intensity and a better sound assessment, while under S2, the votes of the panel varied a lot, and no difference was found amongst the air cleaning technologies, which might be related to the distribution of SPL amongst different frequencies. On the other hand, the airflow pattern induced by the MACs did not show any clear relationship with the sound they generated. For MAC5, MAC6 and MAC7, the SPL was similar between the two configurations, while the votes from the subjects were significantly different, which could be due to the differences in individual sensitivity and preference of the subjects who were seated closer to the devices. Furthermore, the MACs tested with multiple devices did not show a higher SPL or a worse panel assessment than the MAC tested with one device.
Assessment of air movement
Similar to SPL, the air velocity measured for the MACs mainly varied with the settings (Figure 15). It was also partially related to the induced airflow pattern. As discussed in the previous section, for MAC1, the supplied air might be hindered by the furniture in the room and thus resulted in a low air velocity at the sampling points. For MAC7, on the other hand, because of the centrifugal fan and the narrow design of the outlet, the air was leaving the device as a concentrated jet at a high speed, which then led to a high air velocity near the occupants. The air cleaning technology and configuration of the MACs did not have any significant effect on the measured air velocities. Nonetheless, the panel’s perception of the air movement caused by the MACs was not always in accordance with the air velocity measurements (Table 5). There were fewer subjects who sensed air movement from the MACs only using ES filters, yet it did not differ amongst the induced airflow patterns or configurations. The air movement intensity and assessment, however, were more dependent on these two factors. In general, the air movement caused by the MACs was mild and was assessed as acceptable by the panel, except when MAC5 was operating in front of the room, which might be due to individual sensitivity and preferences. It is thus concluded that the air movement created by the MACs had no negative effect on occupants’ comfort, which agrees with the findings of Curtuis et al. 31 and Bluyssen et al. 37 Yet, the panel tests were conducted in the summer season, and during the tests, the mean (standard deviation) air temperature and relative humidity were 24.1°C (1.1°C) and 52.2% (8.2%), respectively. Tests should be repeated in the heating season to investigate whether such air movement is still acceptable.
Applicability in a real classroom
The results in the real classroom (Figures 16 and 17) demonstrated the applicability of using MACs with the selected settings and configurations in classrooms for aerosol removal. In the classroom twice the volume of the Experience room,
Limitations
Firstly, in this study, only the removal rate of particles (aerosols) was tested for the MACs. However, to determine whether MACs can be used as a sufficient substitute for ventilation, their removal of other indoor air contaminants (e.g. microbial and gaseous contaminants) should also be investigated. 20 Furthermore, the method used in this study for assessing aerosol removal performance, that is, the aerosols decay tests, is only suitable for MACs using air cleaning technologies that physically reduce the number of aerosols. Hence, MACs using other air cleaning technologies, such as UV-C to inactivate microbes, were not investigated. Future study is needed to obtain a more comprehensive comparison.
Secondly, the lab tests were conducted without any background ventilation, while the tests in the university classroom showed that mechanical ventilation can have certain influences on the performance of the MACs. Considering that in real classrooms there can be various ventilation conditions (natural and/or mechanical ventilation), further investigation should be performed to better understand the interactive effects between ventilation and MACs.
Thirdly, the tests were performed during summer time, while in real life, the MACs are most likely more often needed during the heating season, when natural ventilation in classrooms is limited, and the incidence of respiratory infectious diseases is, in general, higher.61–63 Since the change in outdoor air temperature and relative humidity can affect indoor air conditions, whether the MACs can maintain steady performance during different seasons remains unclear. Moreover, the change in indoor and outdoor air temperature and relative humidity can also affect occupants’ perception of the MACs.
Fourthly, the panel recruited for the perception test only contained eight adults, which was a rather small sample, and the subjects’ psychological and physiological responses to the indoor environment may differ from pupils. Thus, the results may not be sufficiently representative. Moreover, for the test in the real classroom, the perception test was not included. To comprehensively evaluate the performance of MACs in practical use, further research on their sound together with other background sound sources (e.g. HVAC installation), the sound perception and acceptability during actual teaching and learning activities, as well as the air movement and draught discomfort (possibly with background ventilation and/or infiltration), is needed.
Finally, investigations on the cost and difficulty of maintenance and a possible efficiency degradation over time of the MACs were not included, which are also important factors to be considered for real-life usage.
Conclusions and recommendations
For reducing respiratory aerosols in school classrooms, a large number of MACs were found available on the market. Several criteria, including the air cleaning technology used, the filter efficiency level, the fan capacity and the noise level, etc., can be set for preliminary selection. In this study, seven small- and medium-sized commercial floor-standing MACs were selected and tested to investigate proper strategies for practical use. The following conclusions and recommendations can be drawn:
Overall, the MACs with high-efficiency filters (filter class ≥ H13) all have the ability to remove aerosols in the room besides the natural decay. However, the primary criterion for using MACs in classrooms is to provide an adequate amount of clean air, which not all the tested MACs could achieve. A key factor to this is the airflow pattern induced by the device, especially the air outlet. In general, the MACs with an upward (either vertical or angled) air supply can better distribute the clean air throughout the room compared to the ones with a horizontal air supply. Meanwhile, the location of the devices is also crucial, as it can greatly influence the air distribution in the room, which thus needs to be well configured. Briefly, the supply airflow should be towards the occupied zone as much as possible. On the other hand, the main air cleaning technology for aerosol filtration used by the MACs, namely, HEPA or ES, did not play an important role. Furthermore, with the room size increasing, higher CADRs were observed with multiple devices compared to a single device, which suggests that two or more devices should be adopted for real-life usage. The test in the real classroom also indicated the advantage of using both mechanical ventilation and MAC for better aerosol removal, which, nonetheless, requires careful configuring.
Two other critical factors of the applicability of MACs in classrooms are noise and draught, which could vary mainly with the setting of the MACs. For sound, although at the maximum setting, the SPL always exceeded the prescribed limit, the assessment of the panel varied amongst different conditions. For the draught, the air velocities in general fulfilled the requirements, and the panel also provided positive feedback for the air movement. It is thus important to involve the evaluation by a panel of subjects to optimize the use of MACs in classrooms with minimum compromise of both the devices’ performance and occupants’ comfort.
Footnotes
Acknowledgements
The authors would like to thank Nadine Hobeika and Clara García-Sánchez from the Delft University of Technology for their assistance with the tests. The authors would also like to thank Gerrit Hardeman from the University of Amsterdam and Sietse Kuipers from the Delft University of Technology for providing instruments and materials for the tests.
Author contributions
E. Ding Conceptualization; formal analysis; validation; investigation; visualization; methodology; writing – original draft; writing – review and editing A. Giri Investigation; methodology; writing – original draft; writing – review and editing A. Gaillard Resources; methodology; writing – review and editing D. Bonn Resources; funding acquisition; writing – review and editing; project administration P.M. Bluyssen Conceptualization; supervision; funding acquisition; methodology; writing – original draft; writing – review and editing; project administration.
Declaration of conflicting interests
The author(s) declared no potential conflicts of interest with respect to the research, authorship, and/or publication of this article.
Funding
The authors disclosed receipt of the following financial support for the research, authorship and/or publication of this article: this study was funded by the Ministerie van Onderwijs, Cultuur en Wetenschap (case number: 1325610). This project was participated by researchers from the University of Amsterdam and the Delft University of Technology, both in the Netherlands.