
Abstract
With the development of photovoltaic (PV) power generation systems in single houses, research has recently focused on the prediction of PV power generation to match PV power generation with building energy consumption characteristics. However, prediction models for PV power generation under different weather conditions based on the actual monitoring data of the PV power generation system in a single house are still lacking. The present study is based on the actual monitoring of PV power generation data of a single house with a PV system that was installed in Beijing 5 years ago. We analysed the main weather factors affecting PV power generation and power conversion efficiency (PCE). The results showed a positive correlation between power generation and solar radiation, with the ambient temperature (Ta) and total cloud cover (TCC) being the main weather factors affecting power generation and PCE. Based on the analysis results, a support vector regression (SVR) model was established to predict PV power generation. In addition, the mean absolute error (MAE), mean absolute percentage error (MAPE) and coefficient of variation (R2) of the SVR model were 3.39, 34.7% and 0.86, respectively, which can accurately be used to predict PV power generation under different weather types.
Keywords
Introduction
Energy and environmental issues have recently attracted worldwide attention, and the excessive use of fossil fuels and environmental pollution are becoming increasingly serious issues. These problems can be alleviated by utilising renewable energy sources. 1 One of these sources is solar energy which is abundant, everlasting, green and cheap and has been proven to be an effective alternative energy source for global sustainable development. 2 Photovoltaic (PV) systems widely use solar energy, which has significant research value and potential applications.
Traditionally, PV systems have primarily been used for power generation in large power stations and public buildings. 3 With the reduction in the cost of PV power generation and incentive measures and policies on renewable energy utilisation issued by governments,4–6 an increasing number of PV power generation projects have been developed for household power supplies. Some factors must be considered when applying PV systems to households, including solar energy availability and land area. 7 Villages and towns contain numerous houses with large and independent roofs and courtyards; thus, solar radiation is less affected by the coverage of adjacent buildings, and the energy system is relatively independent. Therefore, these buildings are suitable for PV power generation. However, PV power generation depends on the weather and climatic conditions, which leads to intermittency and volatility. 8
Currently, most PV systems are connected to a grid to address the instability of power generation. However, a large number of grid connections cause redundancy and power wastage during the power generation peak. In addition, grid connection measures cannot maximise the conservation of building energy. Several countries including Germany, China, the United States, Denmark, the Netherlands and Belgium have introduced policies that encourage the self-consumption of electricity. 9 For PV system users in a single house, a good match between PV system power generation and building energy consumption characteristics can reduce the use of power from the grid and improve the self-consumption rate of the PV, thereby increasing profits. 10 A power grid can also reduce power-transportation losses. This matching is achieved through demand-side management and energy storage. Using these methods, the power load can be transferred and coordinated to maximise the power generated by a PV system. 11 Future PV power generation can be predicted by monitoring the system. Thus, power generation prediction can provide a reference for the coordination or transfer of the power load to match the PV system power generation using the building energy consumption characteristics.
Accurate PV power generation prediction can mitigate the impact of power generation uncertainty on the system, improve the stability of the system and reduce the maintenance cost of auxiliary equipment. 12 In recent years, attention has been drawn towards residential direct current (DC) power grid systems which are based on photovoltaic power generation forecasts. According to the predicted results, an independent photovoltaic power system can be designed and implemented to operate the residential DC power equipment.
Zamo et al. 13 divided the forecast horizon into five categories, namely, (1) intra-hour: power generation is predicted in the next 15 min to 2 h; (2) hour-ahead: the power generation is predicted in the next 2–6 h; (3) day-ahead: the power generation is predicted in the next 1–3 days; (4) medium-term: power generation is predicted in the next week to 2 months; and (5) long-term: the future monthly or annual power generation is predicted. Intra-hour prediction is important for the smooth integration of solar power into the grid. 10 However, for a single house, family members may go out to work or play during the day, and they cannot use the prediction results generated by short-term predictions to adjust home equipment in a timely manner. Therefore, it is appropriate to use day-ahead predictions to forecast the power generation of a PV system in a single house.
Previously, mathematical methods were used to predict the power generation of PV systems. However, these methods cannot accurately handle nonlinear data, and their prediction accuracy is poor. Considering these limitations, the use of machine learning to predict power generation has attracted the attention of researchers. Machine learning algorithms are considered suitable for classification, data mining and prediction because they can establish the relationship between the input and output without physical information inside the system. 14
To meet the requirements of modelling for decision-making, forecasting models rely strongly on meteorological variability, the selection of input parameters and training algorithms. 15 To select the meteorological variables and input parameters, the factors affecting the power generation of the PV system should be analysed. In addition to solar radiation, some meteorological factors may affect the power generation of PV systems. Therefore, extensive research has been conducted on this topic. Li et al. 16 studied the impact of environmental temperature on PV power generation using the power generation data of PV power stations and established a functional equation for PV power generation, air temperature and solar radiation, revealing the relationship amongst PV power generation, air temperature and solar radiation. Kelly and Gibson 17 conducted an experiment that confirmed the cloudy weather could reduce the electricity generation of photovoltaic systems, and they used solar tracking systems to improve electricity generation under cloudy conditions. Some scholars have performed experiments to study the influence of dust and dirt on power generation and PCE.18,19 Dust accumulation of 20 g/m2 on a PV panel reduces short circuit current and efficiency by 15%–21% and 2%–6%, respectively. These studies usually use the data from experiments or datasets of power stations, whereas research on the factors affecting PV systems in a single house is relatively scarce. Whether a PV system is used in power stations, laboratories or individual houses, the influencing factors should be the same. However, in different application scenarios, the actual working environment and status of the PV panels are different. For example, a PV system in a power station is regularly maintained by professional personnel, but not in a single house. These studies are based on power station data or experimental data which cannot provide an accurate reference for the selection of the input variables of the PV system power generation prediction model of a single house. Power stations are located primarily in open areas with abundant solar resources. However, the presence of trees or adjacent houses surrounding a single household can also lead to a decrease in power generation. Leaf growth or fall can lead to changes in the coverage area, resulting in varying degrees of reduction in photovoltaic power generation. Therefore, research on the factors influencing PV system power generation in a single house is necessary, as these may vary in different seasons.
For training algorithms, a suitable model must be selected from a variety of machine learning algorithms to achieve accurate predictions. In recent years, models based on nonlinear methods have been rapidly developed for the prediction of PV power generation, including artificial neural networks (ANNs),20,21 support vector machines (SVMs)22,23 and hybrid models. 24 Artificial neural networks are frequently used in combination with other methods. However, ‘overfitting and the curse of dimensionality’ can easily occur when using an ANN to predict PV power generation, 25 which may lead to poor prediction model results. Support vector regression (SVR) can easily address these problems when making predictions.23,26 Moreover, SVR allows for multiple inputs, and a model built using the SVR algorithm can handle any nonlinearity. 27 Therefore, SVR-based prediction models are widely used in PV power generation. Li et al. 21 established a prediction model using ANN and SVR algorithms, as well as the power generation and meteorological data of a PV power station in Florida, compared the prediction effects of different time resolutions, and analysed the error. Mei et al. 28 established a hybrid prediction model for weather-type identification and time-series analysis using an SVR algorithm combined with a PV power station and historical meteorological data from Wujiang District, Jiangsu Province, China. Wolff et al. 29 established a prediction model using the SVR algorithm combined with the meteorological and power generation data of 921 PV systems provided by Meteocontrol GmbH, which were compared with the physical model. De Leone 30 used PV data from a power station in Italy to establish an SVR model and predict daily power generation. Many similar studies have been conducted, most of which focused on PV power stations, 15 and the prediction results are relatively accurate and have certain reference significance for improving the stability of the power grid. However, few studies have established long-term PV system prediction models in a single house. The prediction model based on the power generation data of the PV system of the power station cannot provide a reference for predicting the power generation of the PV system of a single house and is not suitable for matching power generation with the characteristics of the building energy consumption of a single house.
Therefore, an accurate prediction model for a single house is essential to guide the matching of PV and energy consumption systems. In this study, based on the power generation data of PV systems collected in a single house for nearly 5 years and professional meteorological data provided by WheatA (software that provides meteorological data), the impacts of different weather types on the power generation of PV systems in a single house were compared and analysed. The meteorological variables that were input into the prediction model were selected based on the analysis results. Historical PV power generation data and selected meteorological variables were used to establish the SVR prediction model. After adjusting the model parameters to the best state, the mean absolute error (MAE), mean absolute percentage error (MAPE) and coefficient of variation (R2) were used to evaluate the accuracy of the model. This study aims to provide a reference for the prediction of PV system power generation in a single house and lay a foundation for matching PV system power generation with the building energy consumption system for a single house.
Methods
Sample building and PV system
To predict PV power generation accurately, the influencing factors should be analysed. In addition, a single house in the Changping District, Beijing, was selected as the sample building for long-term monitoring to test the impact of various weather conditions on the power generation and PCE of the household PV system. The sample building was south-facing and covered an area of approximately 380 m2 with three floors (two floors above the ground, 260 m2 in total, and one floor underground, 120 m2 in total). The annual power consumption was approximately 12,000 kWh. Figure 1 shows the sample building and PV panels. One part of the PV board was installed on the roof and the other part was installed in the courtyard. The PV panel adopted cadmium telluride (CdTe) film PV technology with a single area of 0.6 m2. A total of 75 PV panels were installed on the roof and courtyard, with a total area of 45 m2. The installation took place on 12 February 2017. To eliminate data anomalies generated during the initial commissioning of the installation, this study used data collected from 1 March 2017 to 31 December 2021 for analysis. Photos of the sample building with (a) courtyard and (b) roof PV panels.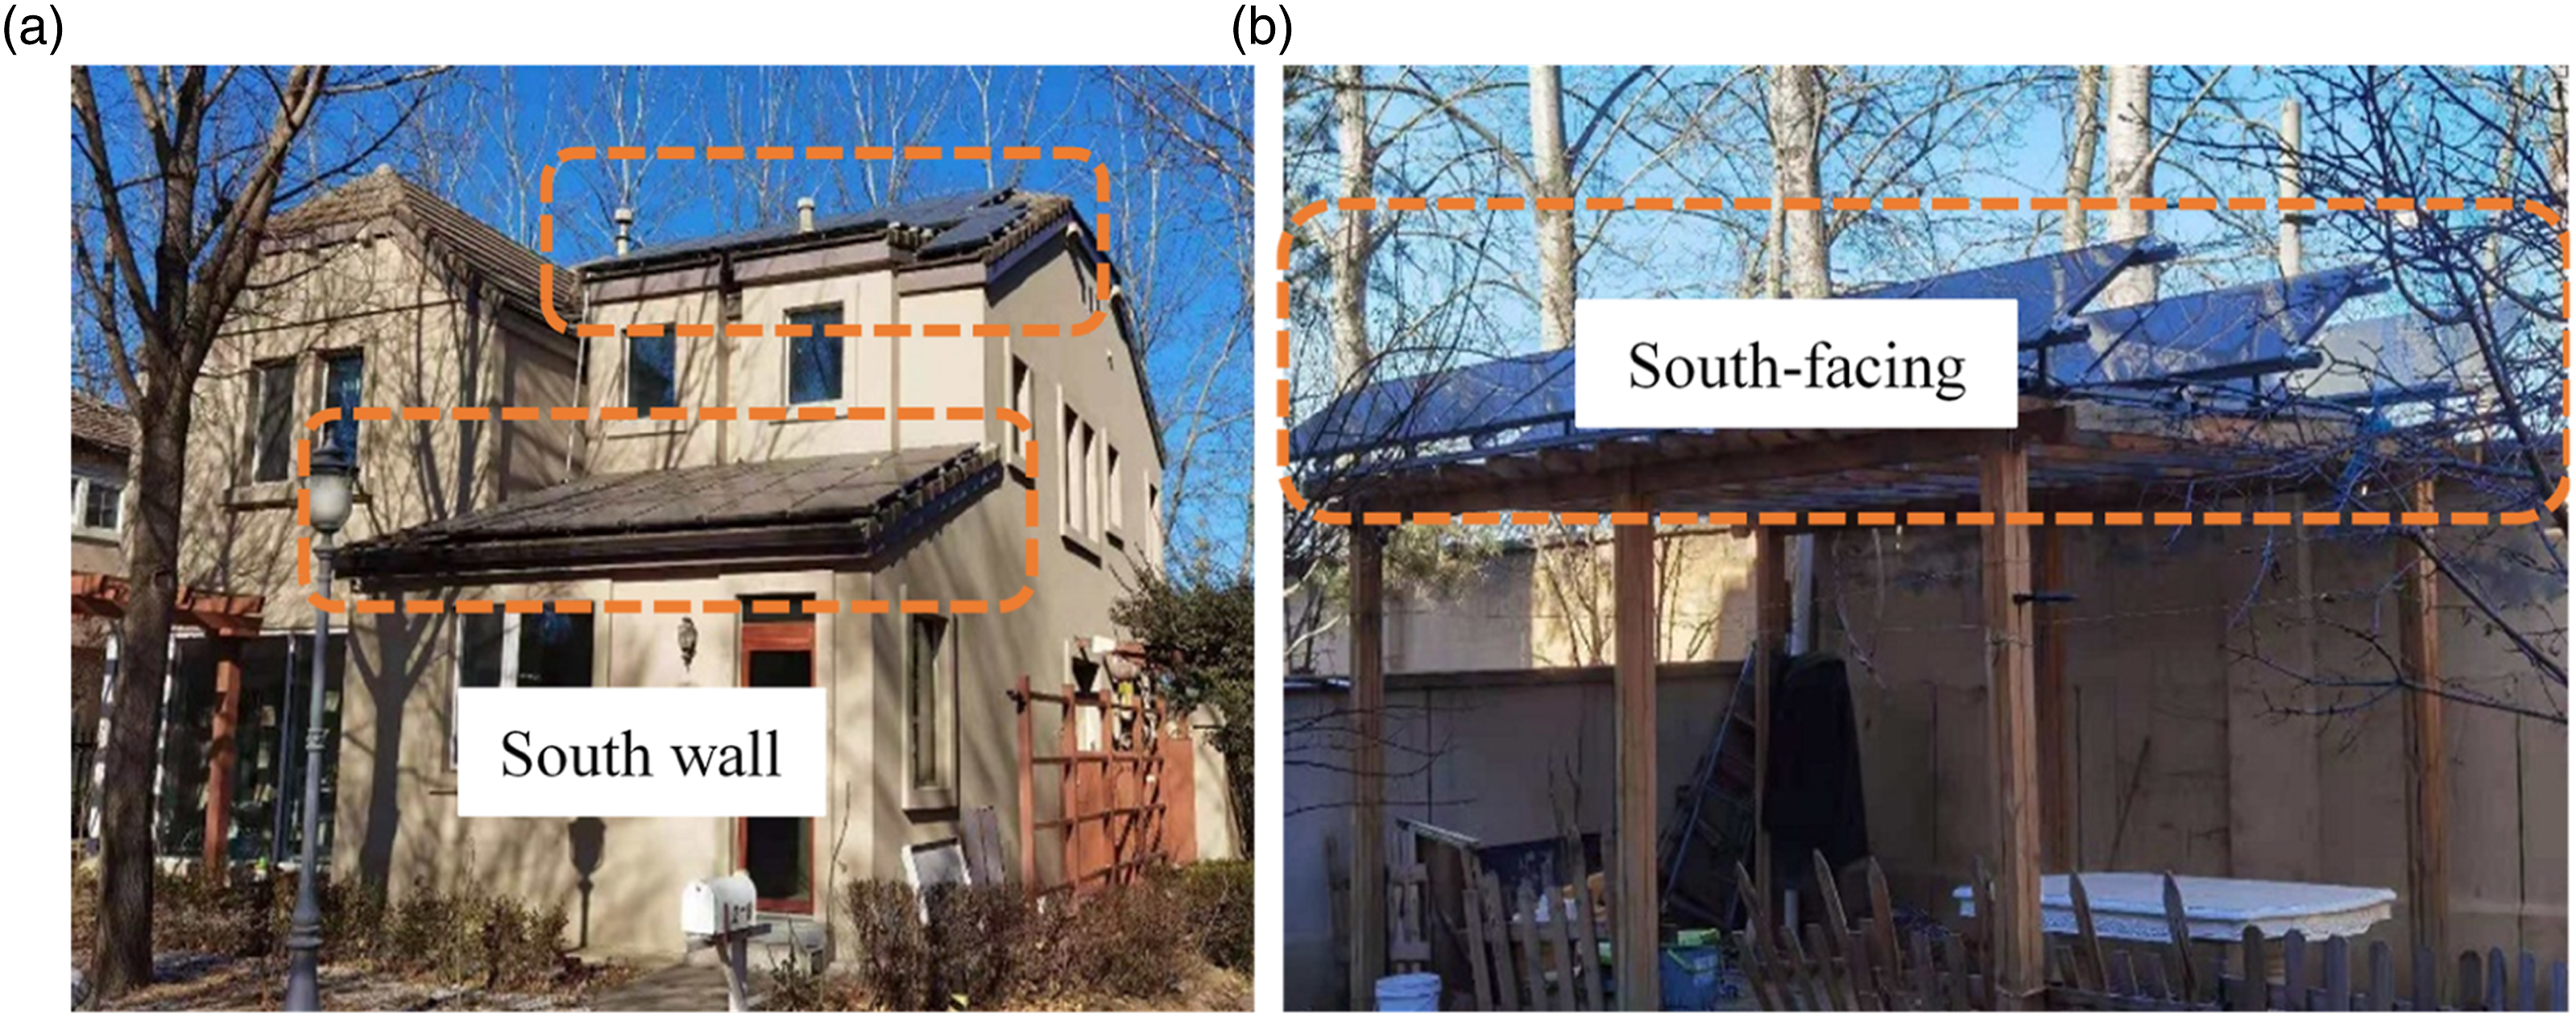
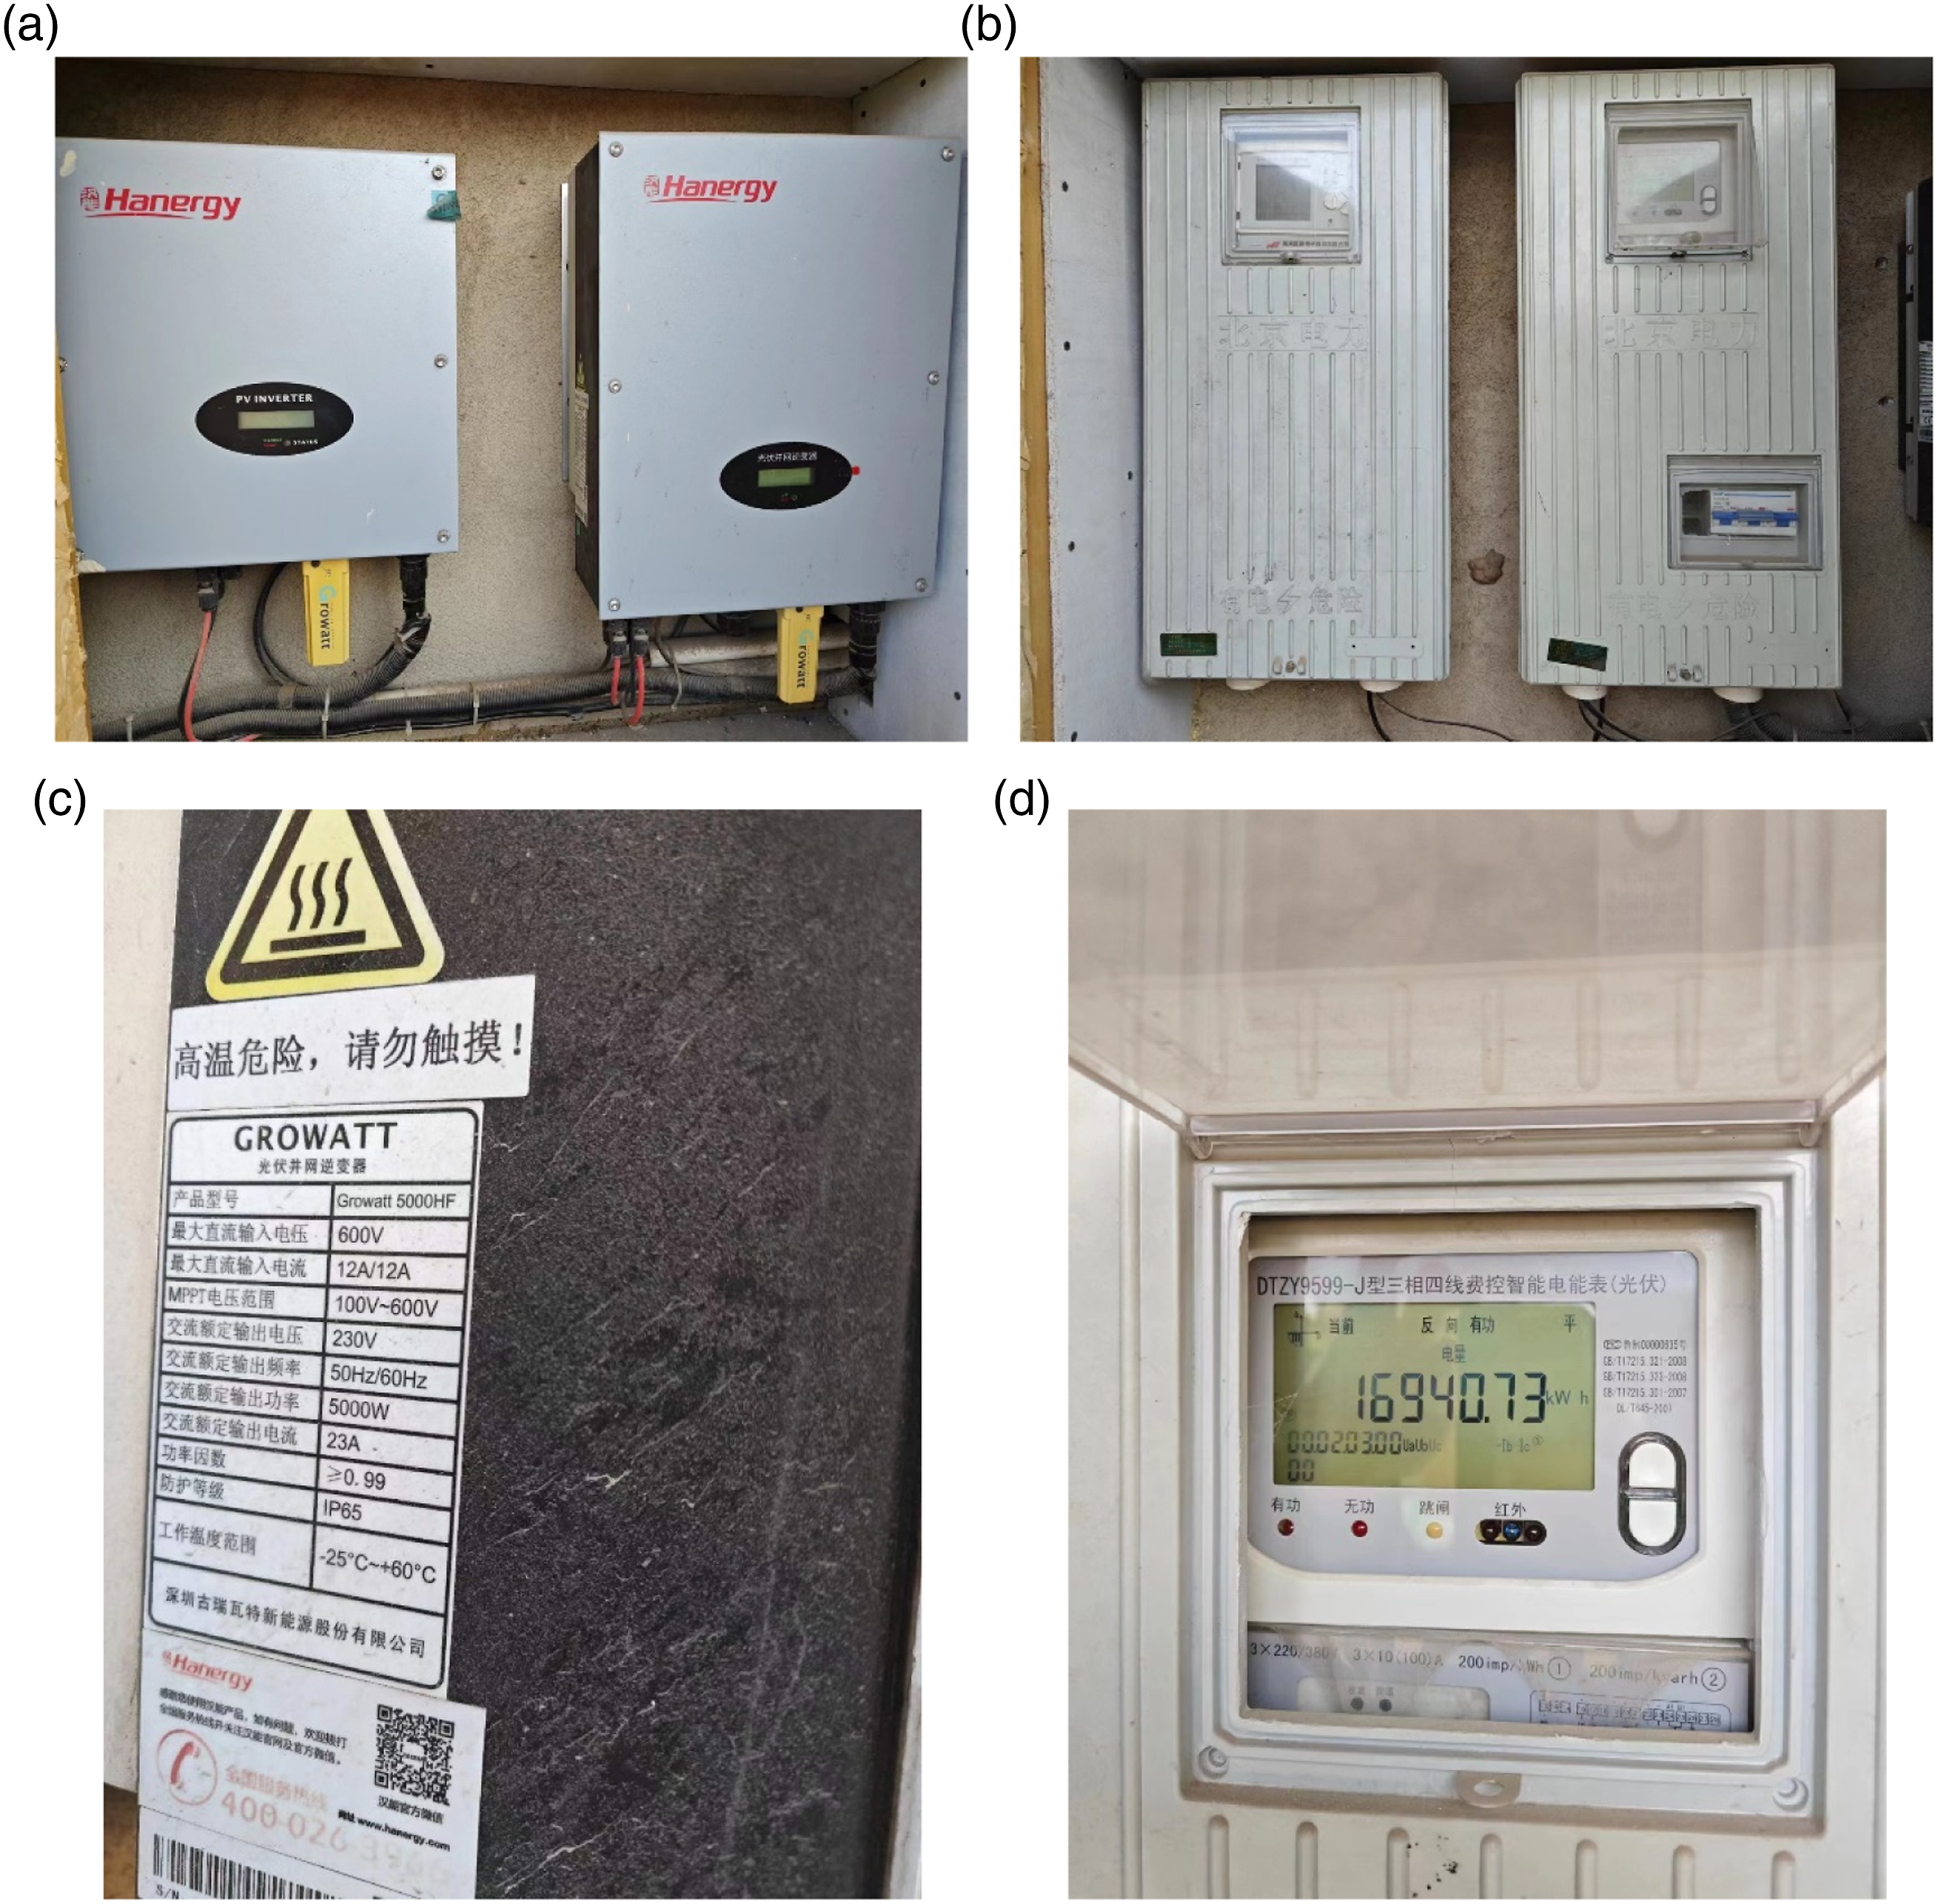
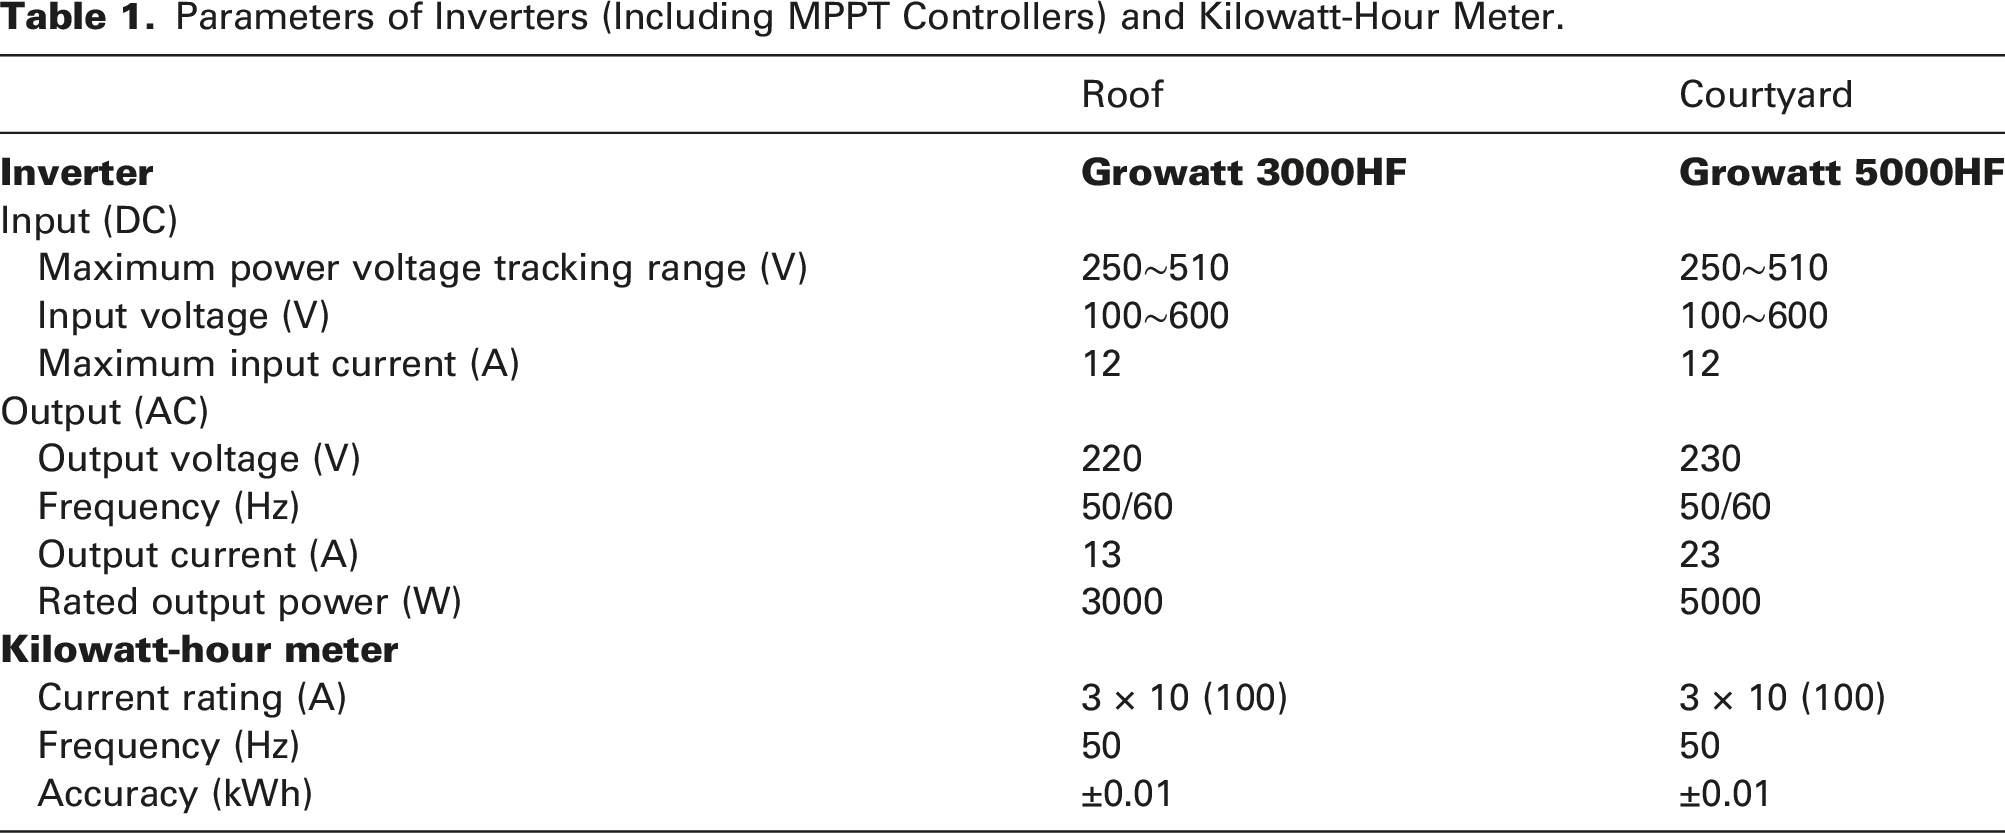
A diagram of the PV system is shown in Figure 2. The PV board was first connected to a maximum power point tracking (MPPT) controller, which could track the maximum power point to ensure that the output power of the PV power generation system was the maximum power under the current environmental conditions. The generated DC was converted into an alternating current (AC) through the inverter, which was used by the electrical equipment. The power generation of the PV system was recorded using a single-phase kilowatt-hour meter, and household power consumption was recorded using a bidirectional kilowatt-hour meter. If the power generation was greater than the current household power consumption, the remaining power was combined with the grid to restore the bidirectional kilowatt-hour meter. The PV inverter (including the MPPT controller) and kilowatt-hour meter used for recording the power generation of the PV system are shown in Figure 3. The power generation of the PV panels in the courtyard and roof was controlled and recorded using their inverters and kilowatt-hour meters, respectively. The parameters of the inverter and kilowatt-hour meter are listed in Table 1. When the PV power generation capacity could not meet the electrical load in the home, the power was supplemented by the grid, and the supplemented power was recorded using a bidirectional kilowatt-hour meter. PV system diagram. Sample building inverters and kilowatt-hour meter: (a), (b) and (c) inverters and (d) kilowatt-hour meter. Parameters of Inverters (Including MPPT Controllers) and Kilowatt-Hour Meter.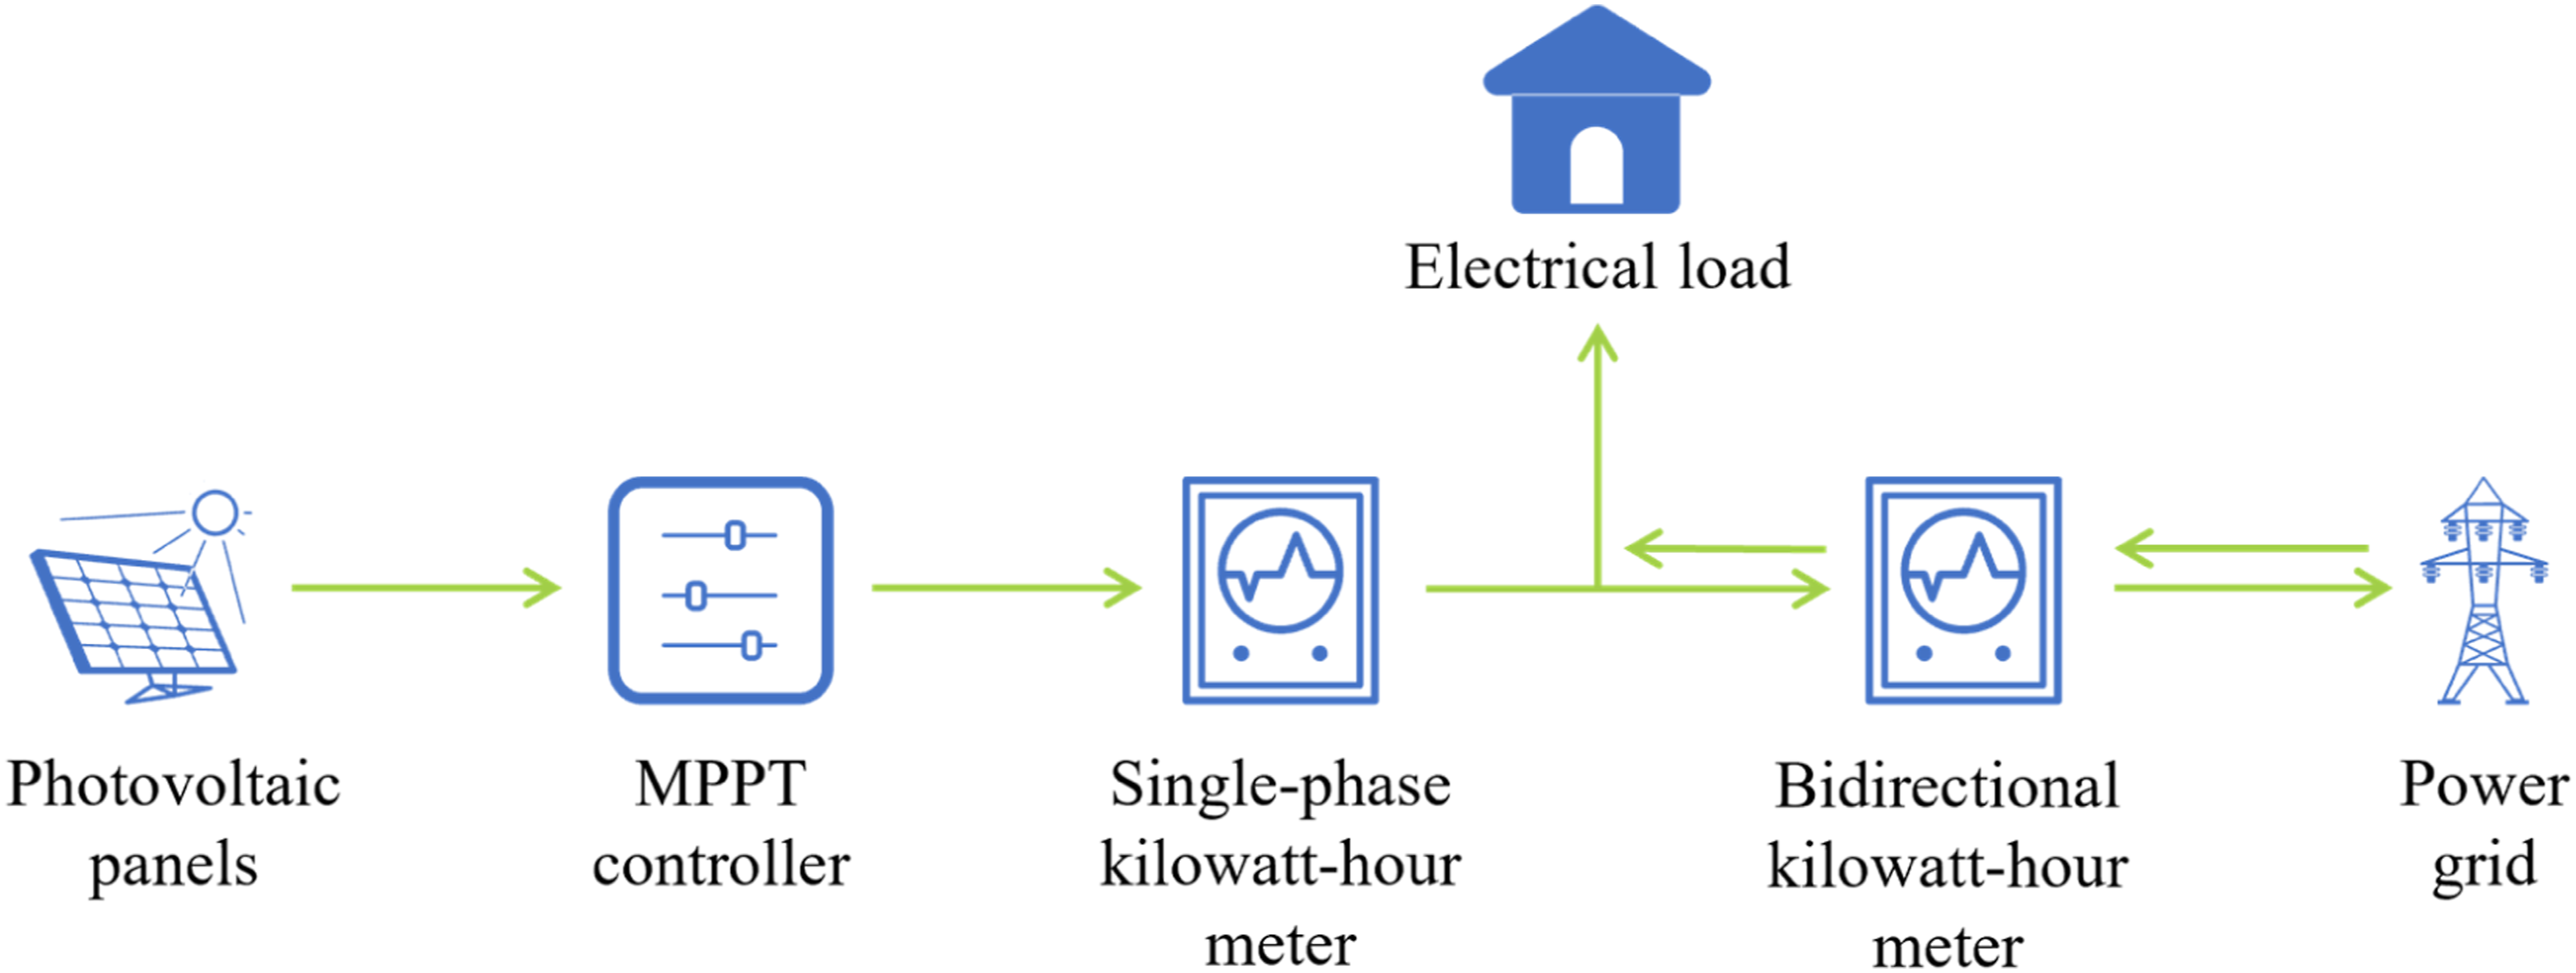
Support vector regression
The SVM is a supervised learning algorithm based on structural risk minimisation 31 that uses a small amount of sample information to achieve appropriate learning accuracy and learning time. It also has a good generalisation ability. The use of an SVM to solve problems such as data prediction is known as SVR. 27 The SVR method is effective in addressing the regression problem of nonlinear finite datasets and is widely used in the prediction of renewable energy or building energy consumption. The specific principles are as follows:
Given a dataset containing N elements 
In this study, the radial basis function (RBF), which is widely used in SVR models, was selected as the kernel function. The radial basis function is given by equation (2).
Evaluating indicators
In this study, the performance of a PV system was evaluated based on power generation and PCE. The power generation is directly recorded by the kilowatt-hour meter, and the PCE is the ratio of the electrical energy generated by the PV system to the solar radiation intensity on the PV panel, which can be written as equation (3):
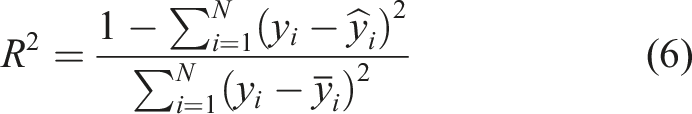
To evaluate the accuracy of the prediction model, we used MAE, MAPE and R2 as evaluation indicators. The specific calculation formulas for the indicators are shown in equations (4)–(6):

Establishment of prediction models
The Python programming language was used to establish the SVR prediction model for the PV power generation of the sample building. The entire modelling process is illustrated in Figure 4. First, the program reads the relevant meteorological and power generation data as the feature and label data, respectively. These data were then preprocessed, that is, normalised and shuffled using a random seed function. After setting the ratio between the training and test sets, the data were divided proportionally. The radial was selected as the kernel function in the SVR algorithm. Additionally, we debugged the main parameters in the program to obtain the best results. Finally, the data were normalised to obtain the final test results and calculate the evaluation parameters. Flow chart for establishing prediction models.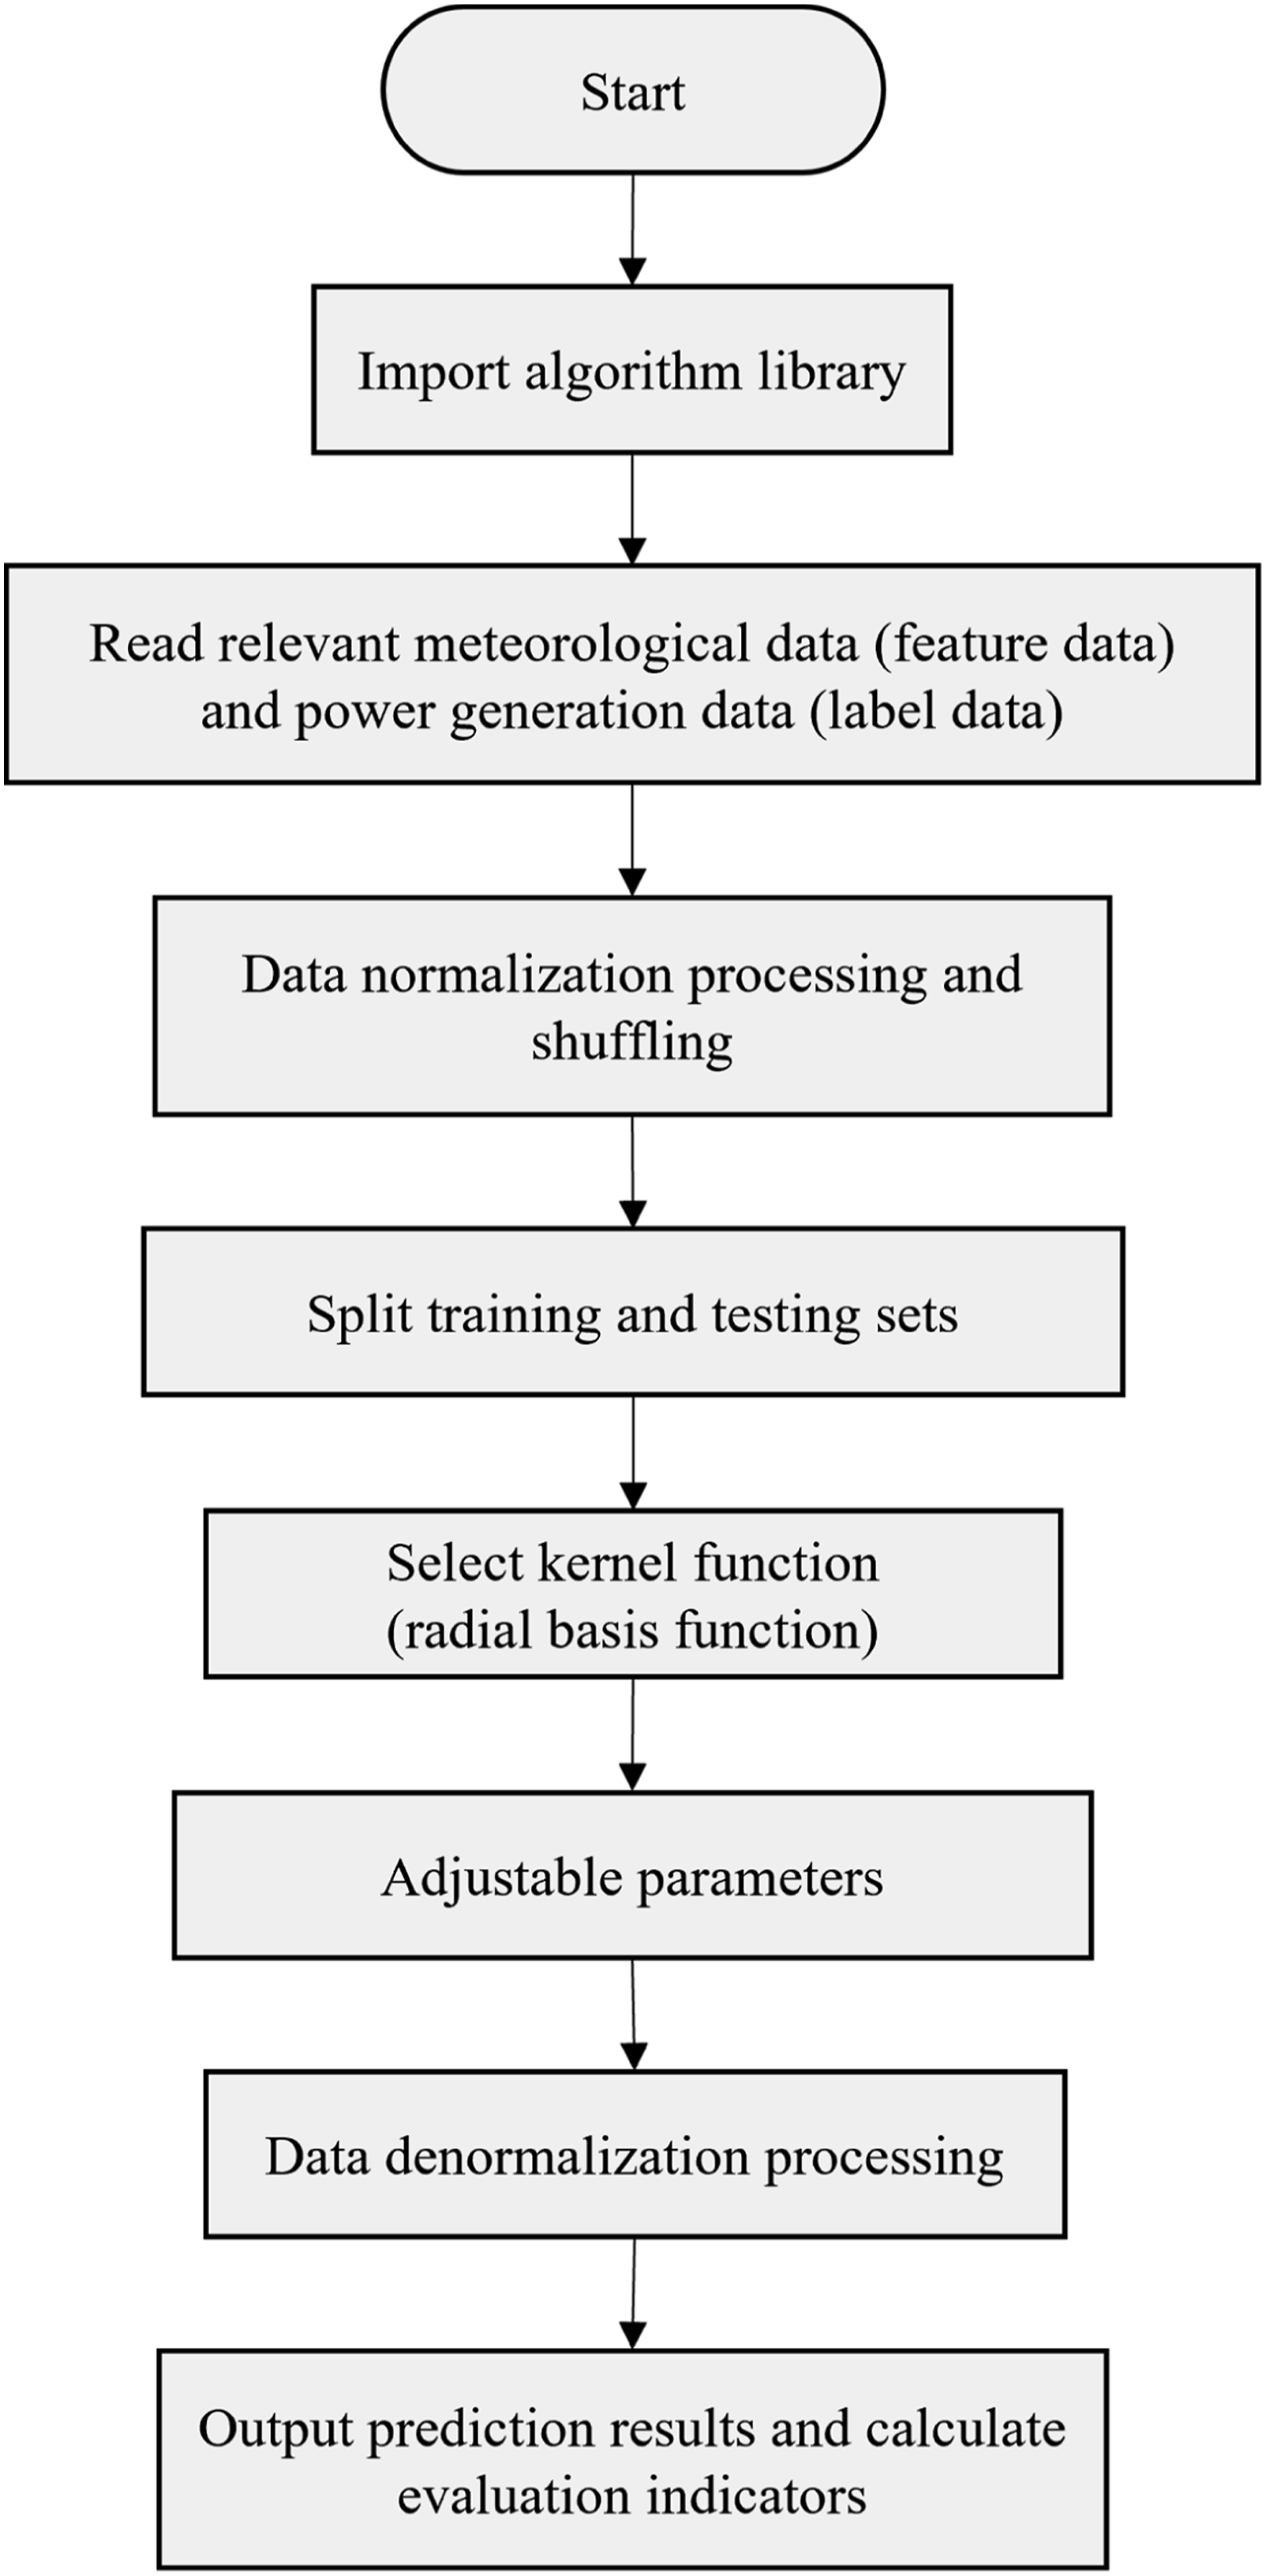
Results
Annual SSR, power generation and PCE
The energy of the PV system comes from the sun; that is, the solar radiation obtained from the PV panel directly affects power generation. Figure 5 shows power generation and SSR over approximately 5 years. A strong positive correlation was observed between power generation and SSR. A longitudinal comparison of the whole-year data (2018–2021) shows that the SSR trend was the same, and the power generation was the same at approximately 9000 kWh. Power generation and SSR in 2017–2021.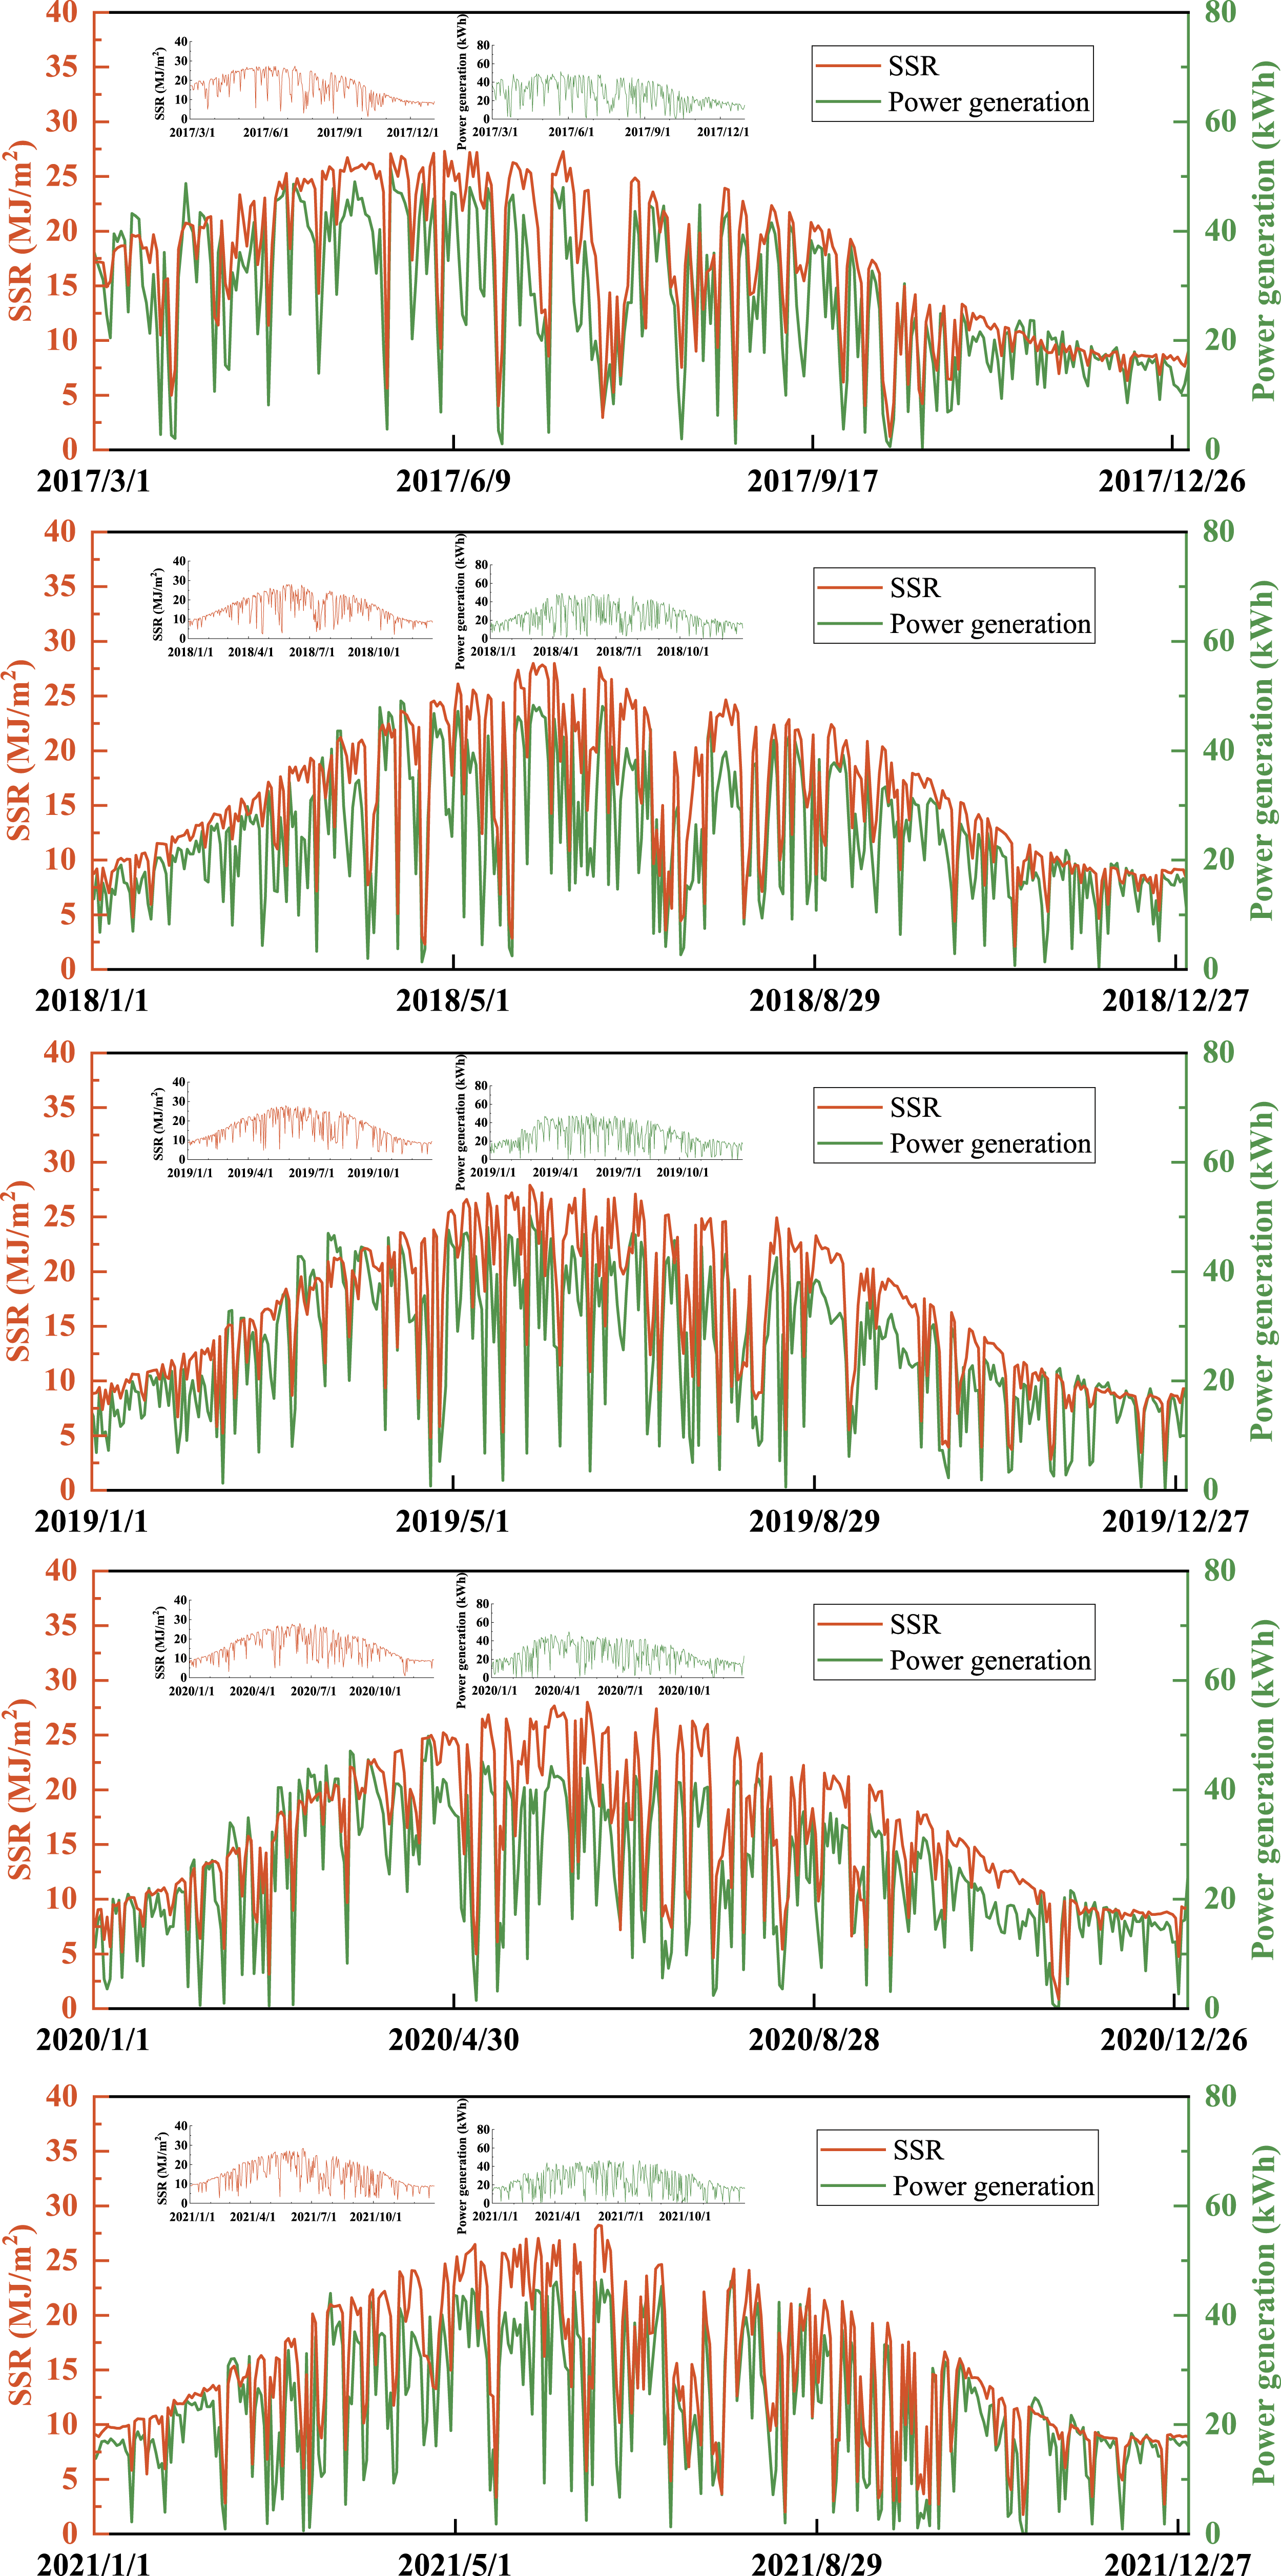
The rated PCE was determined when PV modules were produced, but different environmental conditions still affected the PCE.
33
Figure 6 shows the relationship between the PCE and SSR over nearly 5 years. The PCE of the PV system in the sample building was not affected by the SSR. The average PCE over 5 years ranged from 12% to 13%, and the peak PCE was not high under strong SSR. However, on some days, the PCE exceeded 20% or even 25%. By checking the original data, the SSR was generally low on the day when the PCE exceeded 20%, probably because the material used in the PV system of the sample building was CdTe, which can also ensure a certain amount of power generation under low-radiation conditions.
34
When the SSR was low, the PV system used in this study could generate a certain amount of power; thus, the calculated PCE was high. PCE and SSR in 2017–2021.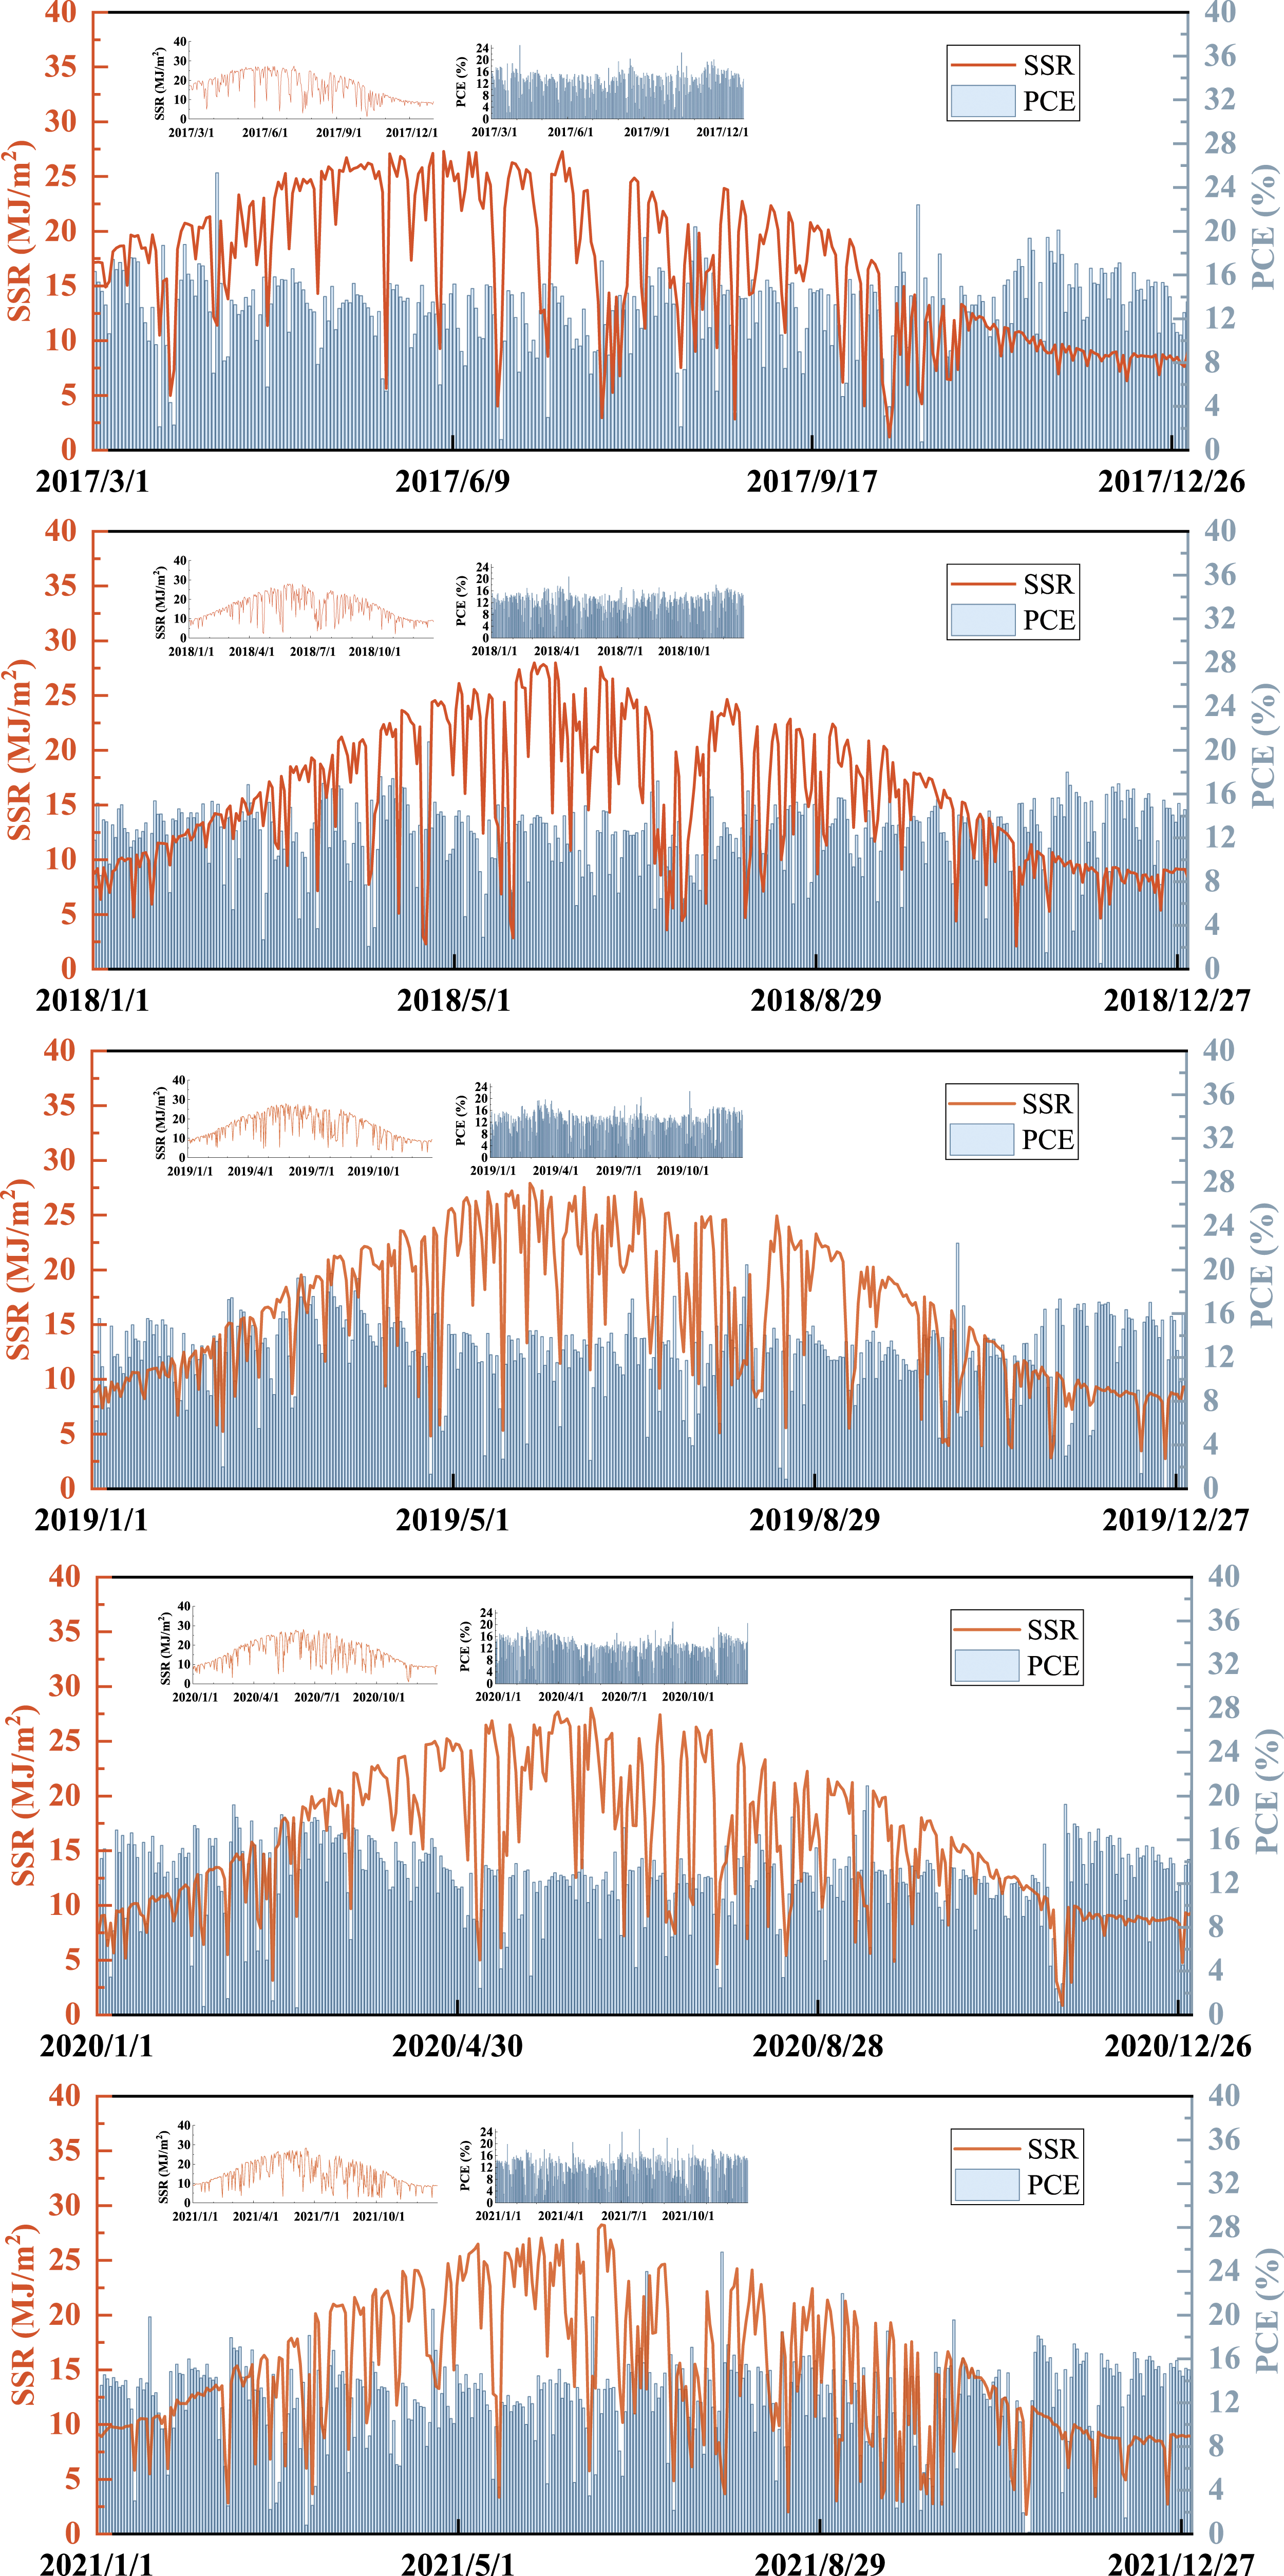
Power generation and PCE in each season
The data analysis shows that power generation and PCE exhibit different performances in different seasons. Therefore, we analysed the average power generation and average PCE in the four seasons of the 4 years (2018–2021). The seasons were divided according to local (Beijing) customs: Spring is from March to May, summer is from June to August, autumn is from September to November and winter is from December to February.
The average power generation for each season over 4 years is shown in Figure 7, and the average Ta, SSR and PCE for each season are shown in Figure 8. Power generation in each season in 2018–2021. PCE in each season from 2018 to 2021.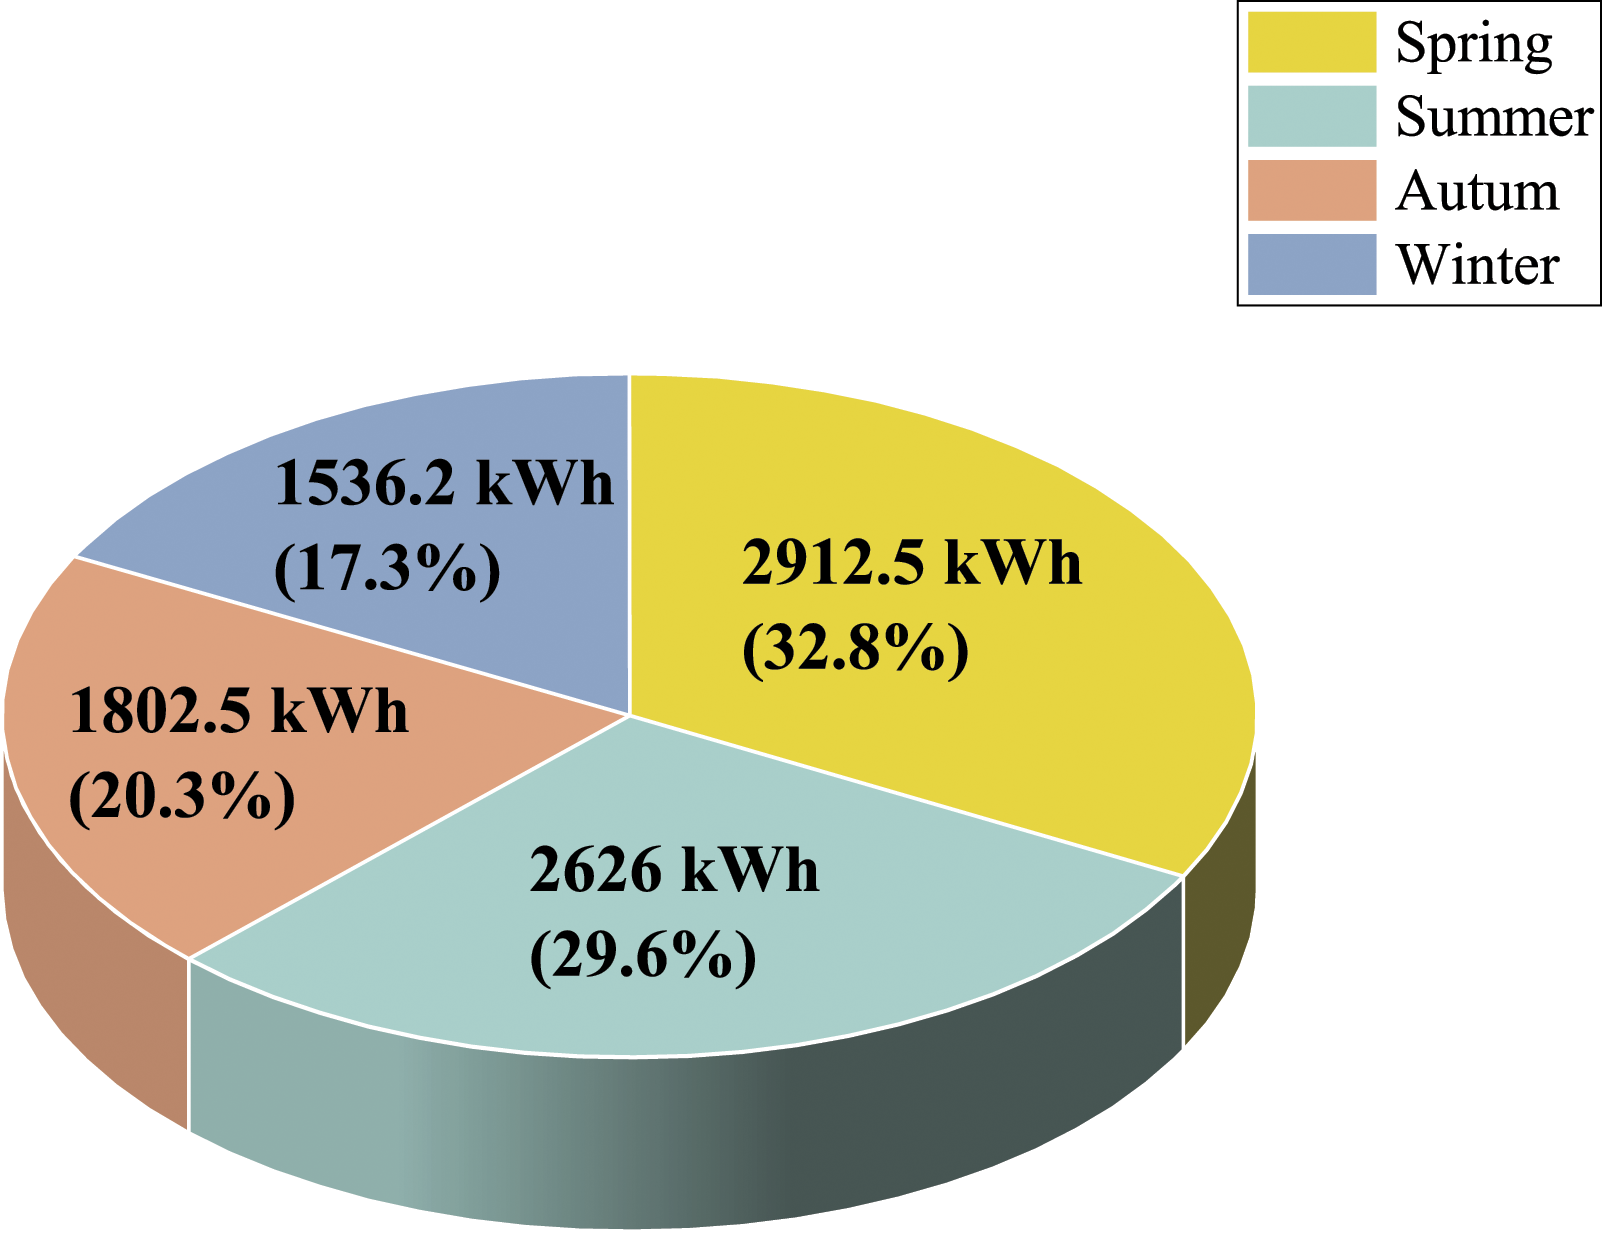
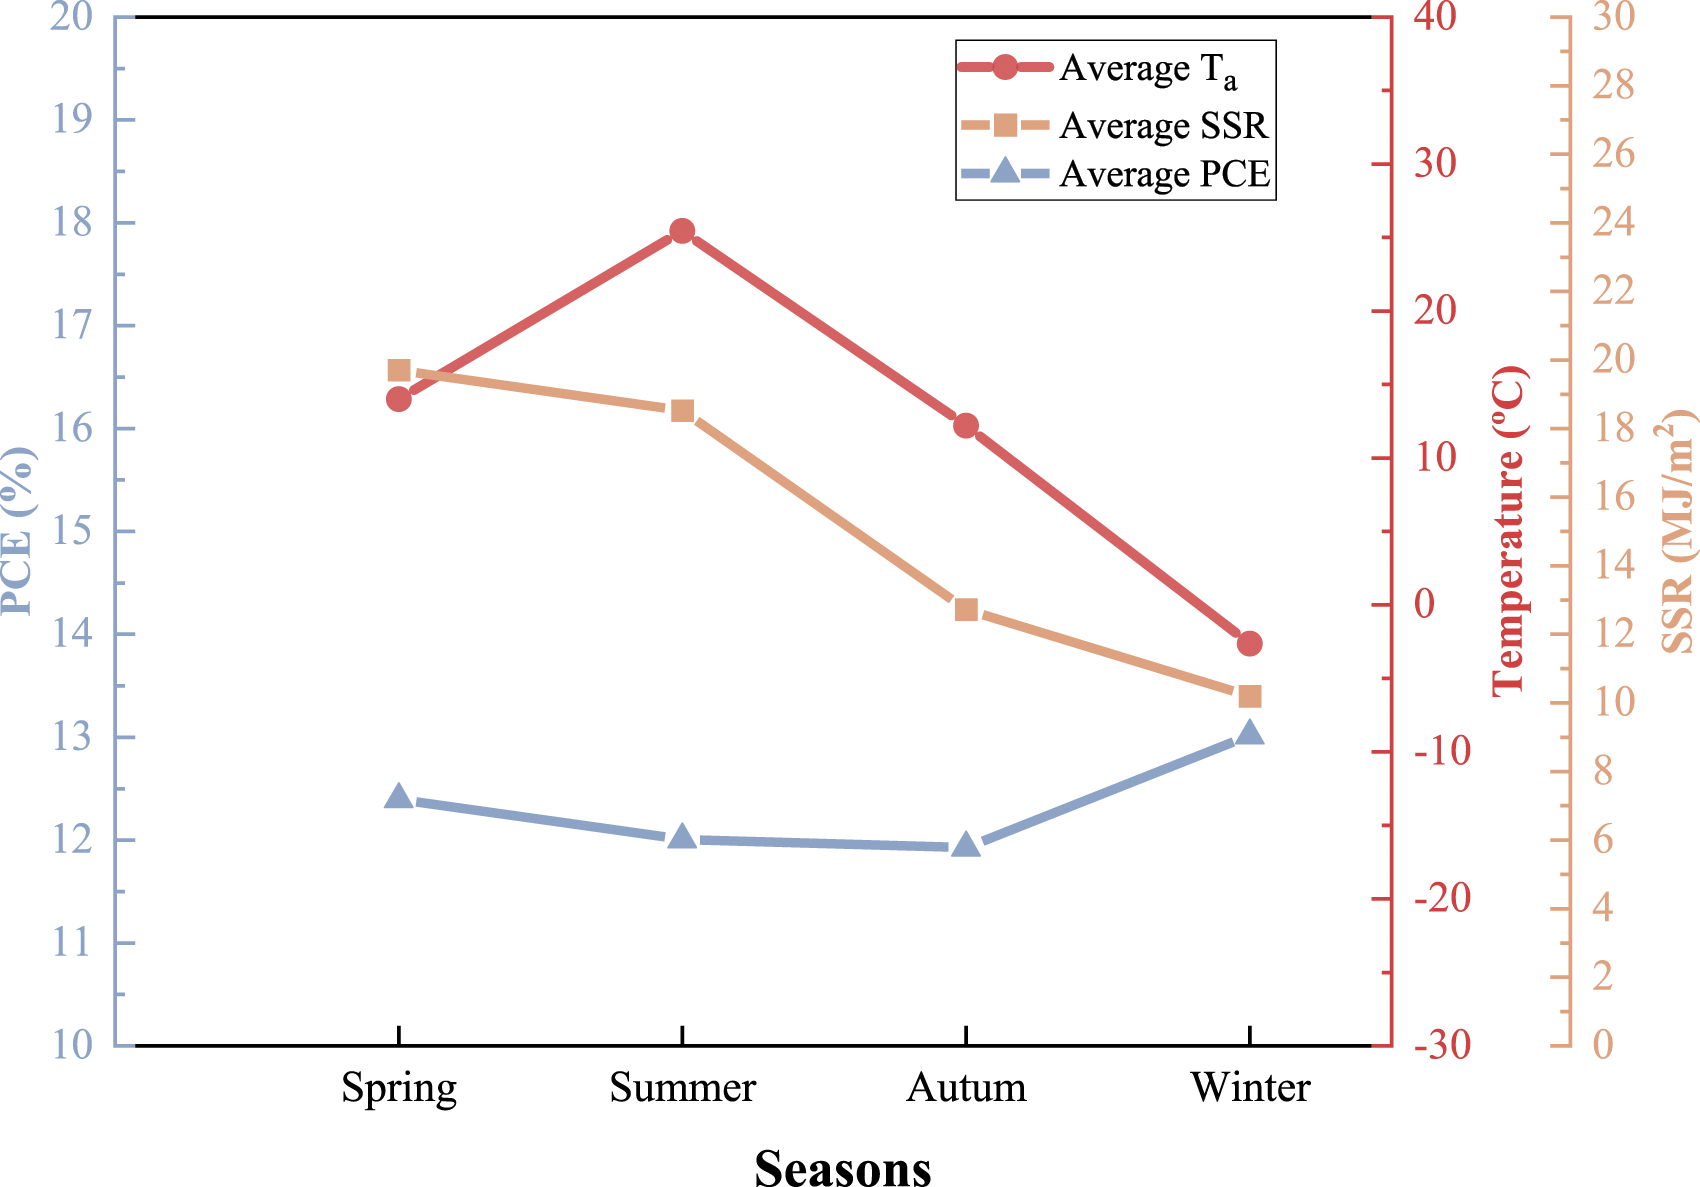
As shown in Figure 7, the average power generation in spring is the highest, accounting for 32.8% of the annual power generation, whereas it is the lowest in winter, accounting for only 17.3% of the annual power generation. As shown in Figure 8, the average PCE was highest in winter, reaching 13%, because the PCE of the PV panels was affected by Ta. The PCE decreases at high Ta and increases at low Ta. The specific impact of the temperature on the PV panels was analysed in detail. Although the PCE was the highest in winter, the power generation was the lowest of the four seasons because of the low average SSR. Unexpectedly, we found that the average SSR and power generation in summer were lower than those in spring. By checking the original data, many cloudy and rainy days were recorded, although the peak SSR was highest in summer. In addition, the SSR is often low or cloudy; thus, the average SSR in summer is lower than that in spring. Considering that weather conditions are unstable in the summer, power generation fluctuates significantly. Under special weather conditions, power generation is low. Weather conditions in the spring were relatively stable. Although the maximum power generation per day was lower than that in summer, no extremely low power generation was observed. Therefore, the average power generation was higher than that in summer.
Power generation and PCE under different ambient temperature conditions
Filter Conditions for Different Ta.
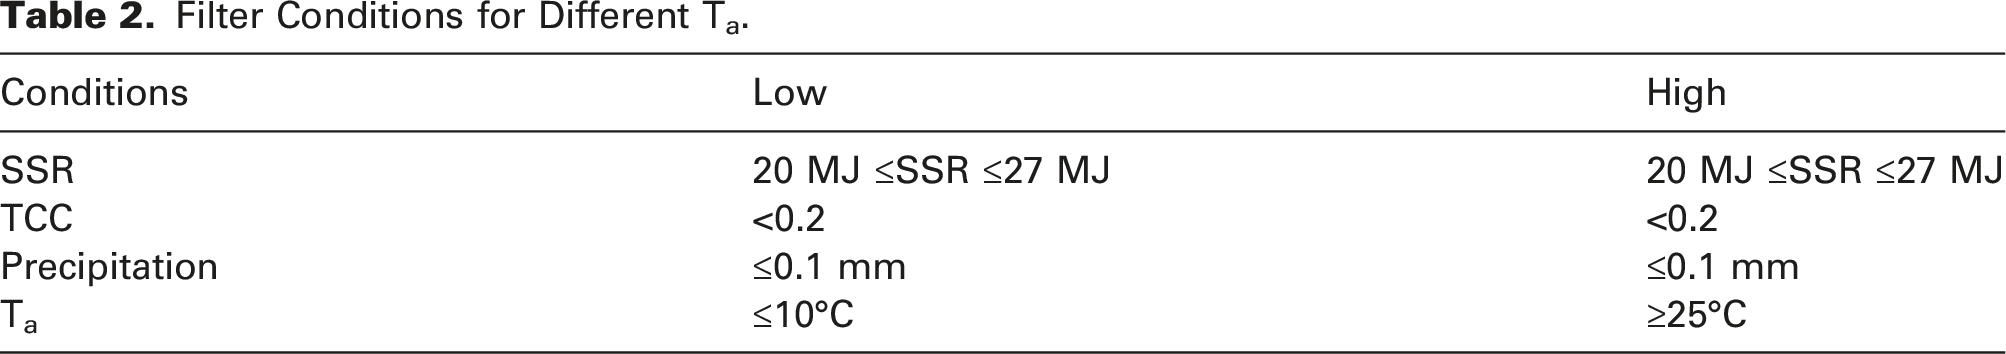
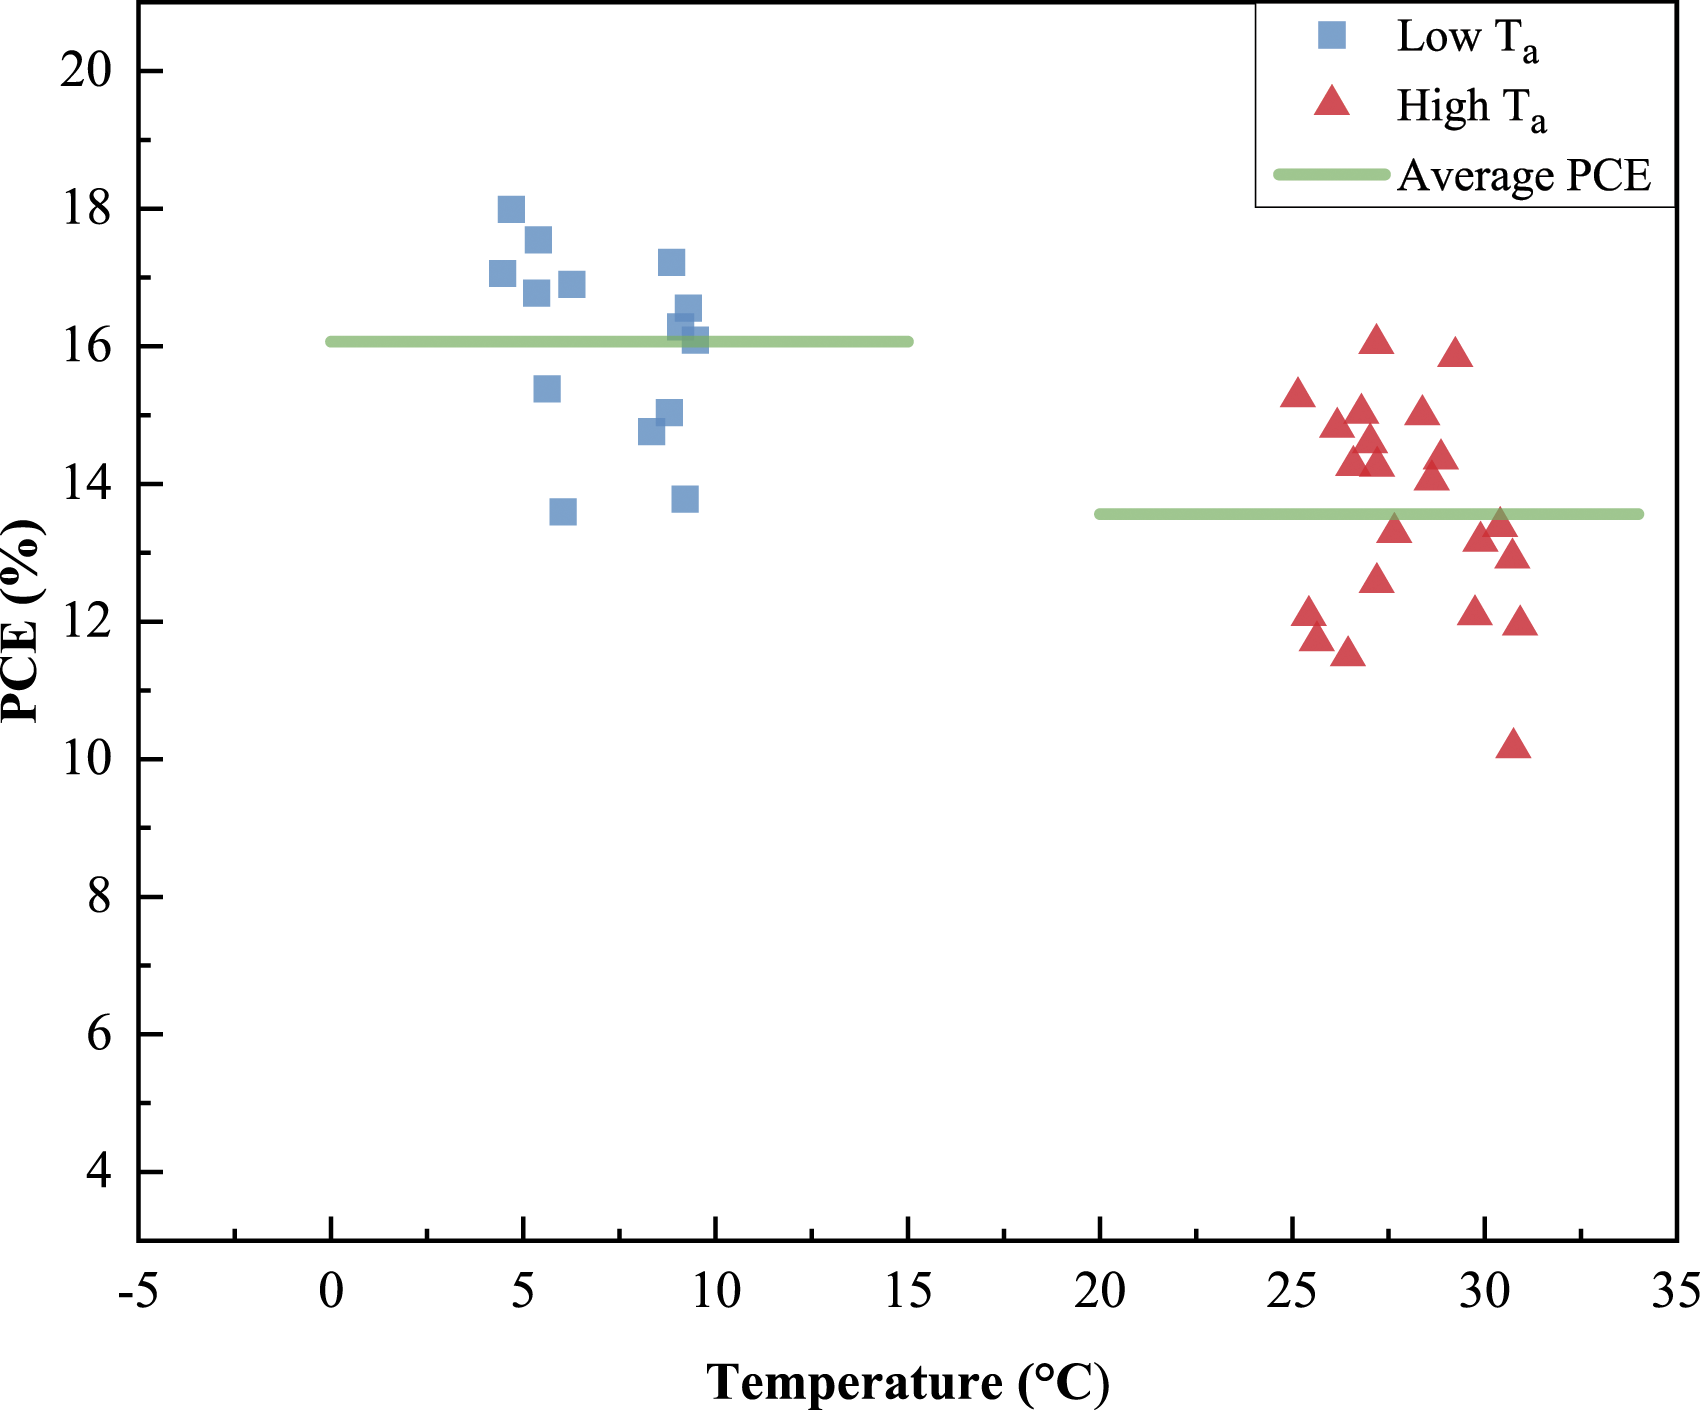
The weather filtered in Table 2 was sunny, with sufficient SSR. Figures 9 and 10 show the differences in the power generation and PCE under different Ta conditions. Under low Ta conditions, the average daily power generation was approximately 43.72 kWh. In contrast, under high Ta conditions, the average daily power generation was approximately 4.5 kWh lower than that under low Ta conditions, which was 39.27 kWh. As shown in Figure 8, the PCE was significantly affected by Ta. The daily average PCE can reach 16.06% under low Ta conditions, which is approximately 4.5% higher than 13.56% under high Ta conditions. These two data points indicate that temperature has a certain impact on the power generation and PCE of CdTe PV panels. However, although Ta seems to have a greater impact on the PCE of the CdTe PV panel, it is superior to the crystalline silicon PV panel with the largest market share (PCE decreases by 0.4%–0.5% for every 1 K increase in temperature
33
), which is acceptable. Power generation under different Ta conditions. PCE under different Ta conditions.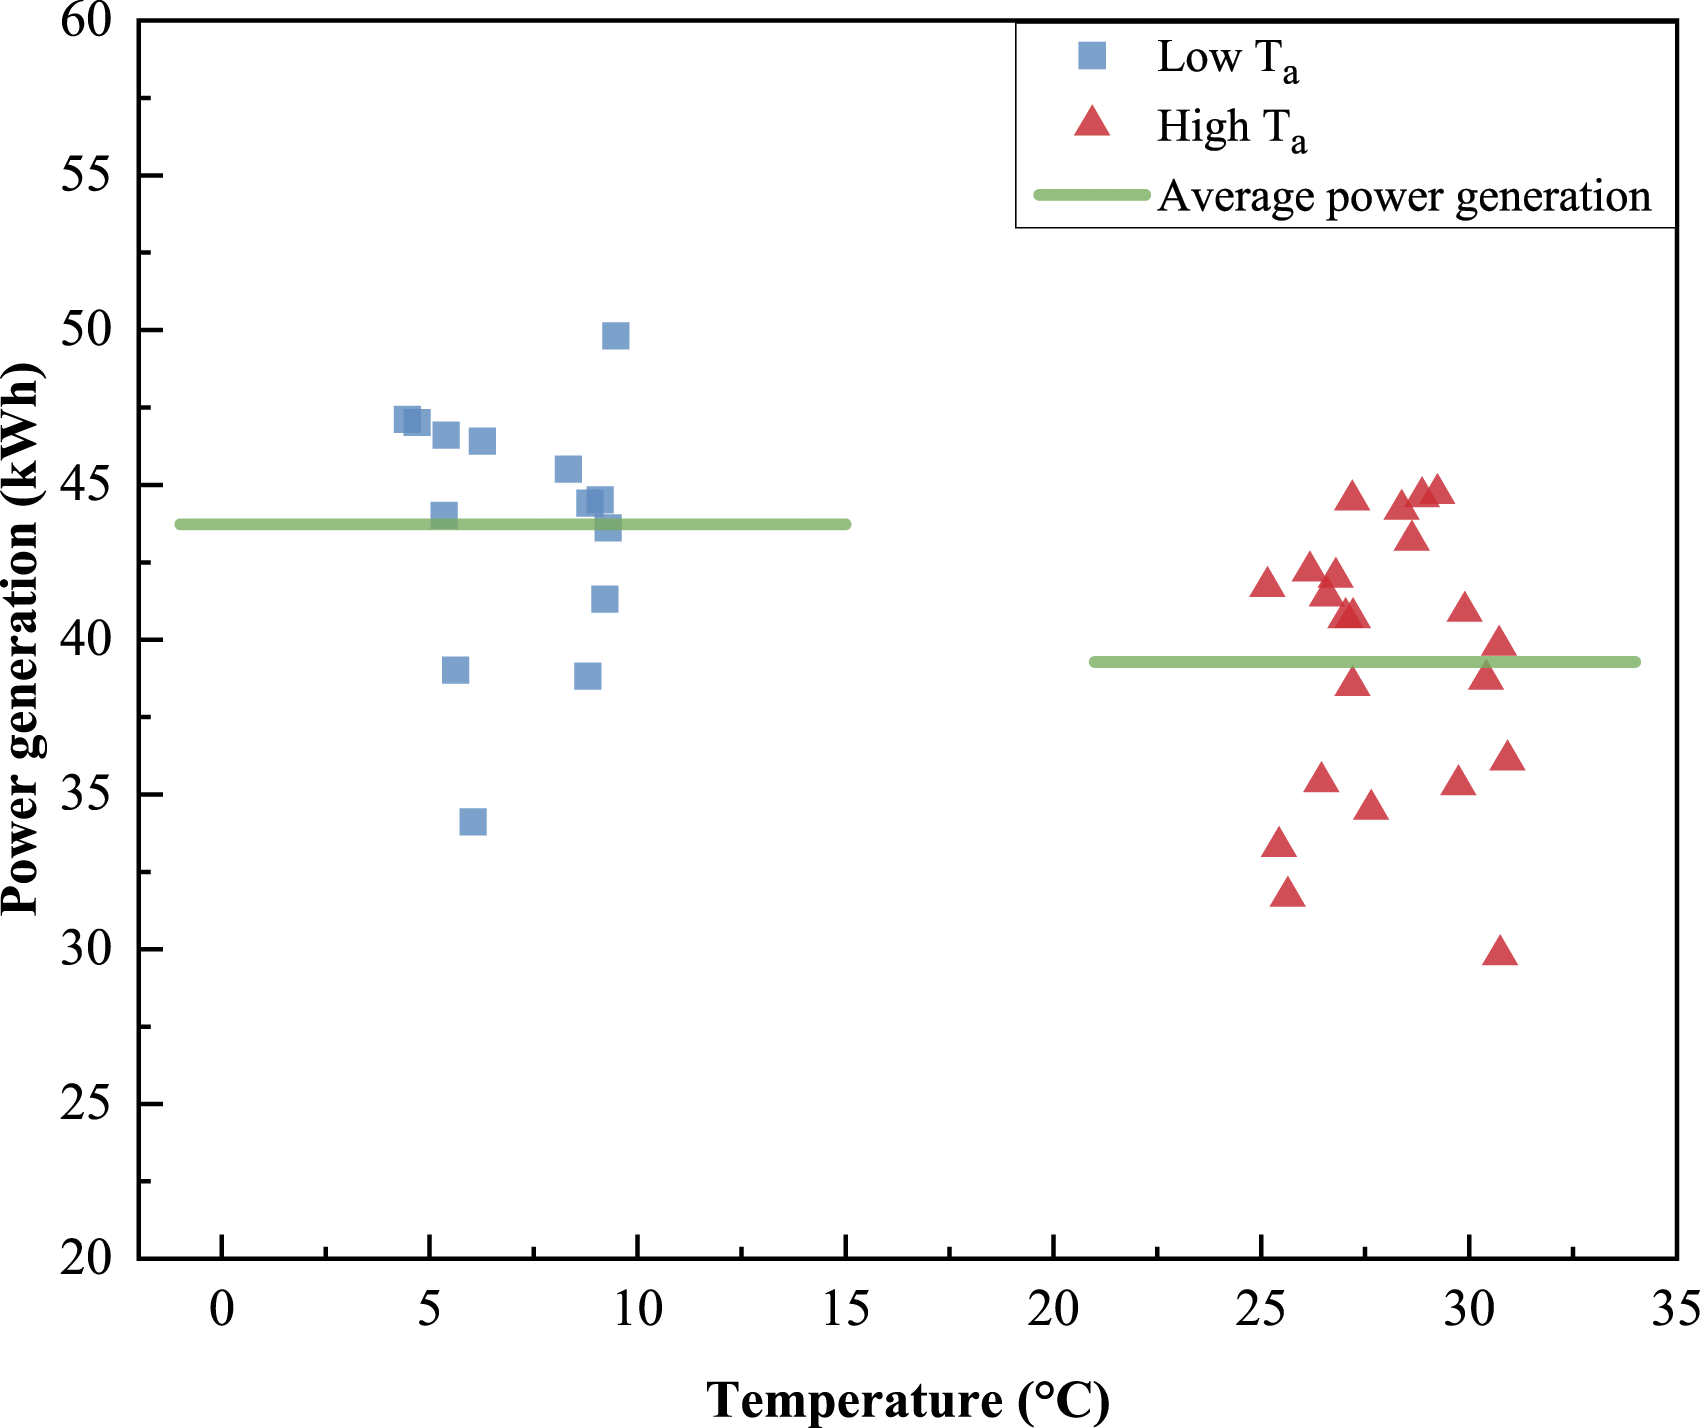
Power generation and PCE on the second day after rainfall
Filter Conditions on the Second Day After Rainy and Sunny Days.
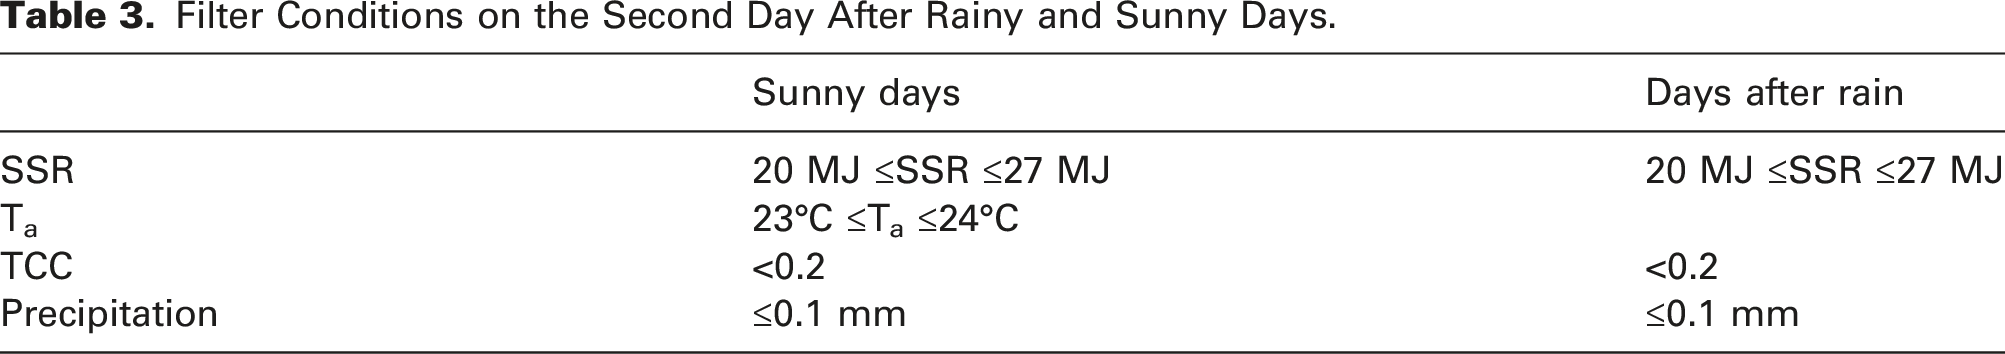
Considering that the weather conditions on the second day after rain (precipitation is more than 20 mm) were mostly cloudy or that the SSR was not sufficient, only 10 days strictly met the conditions (Table 3). The average Ta in these 10 days was 23.5°C. In ensuring that Ta would not affect the PCE, one of the conditions for filtering sunny weather was set as Ta between 23°C and 24°C.
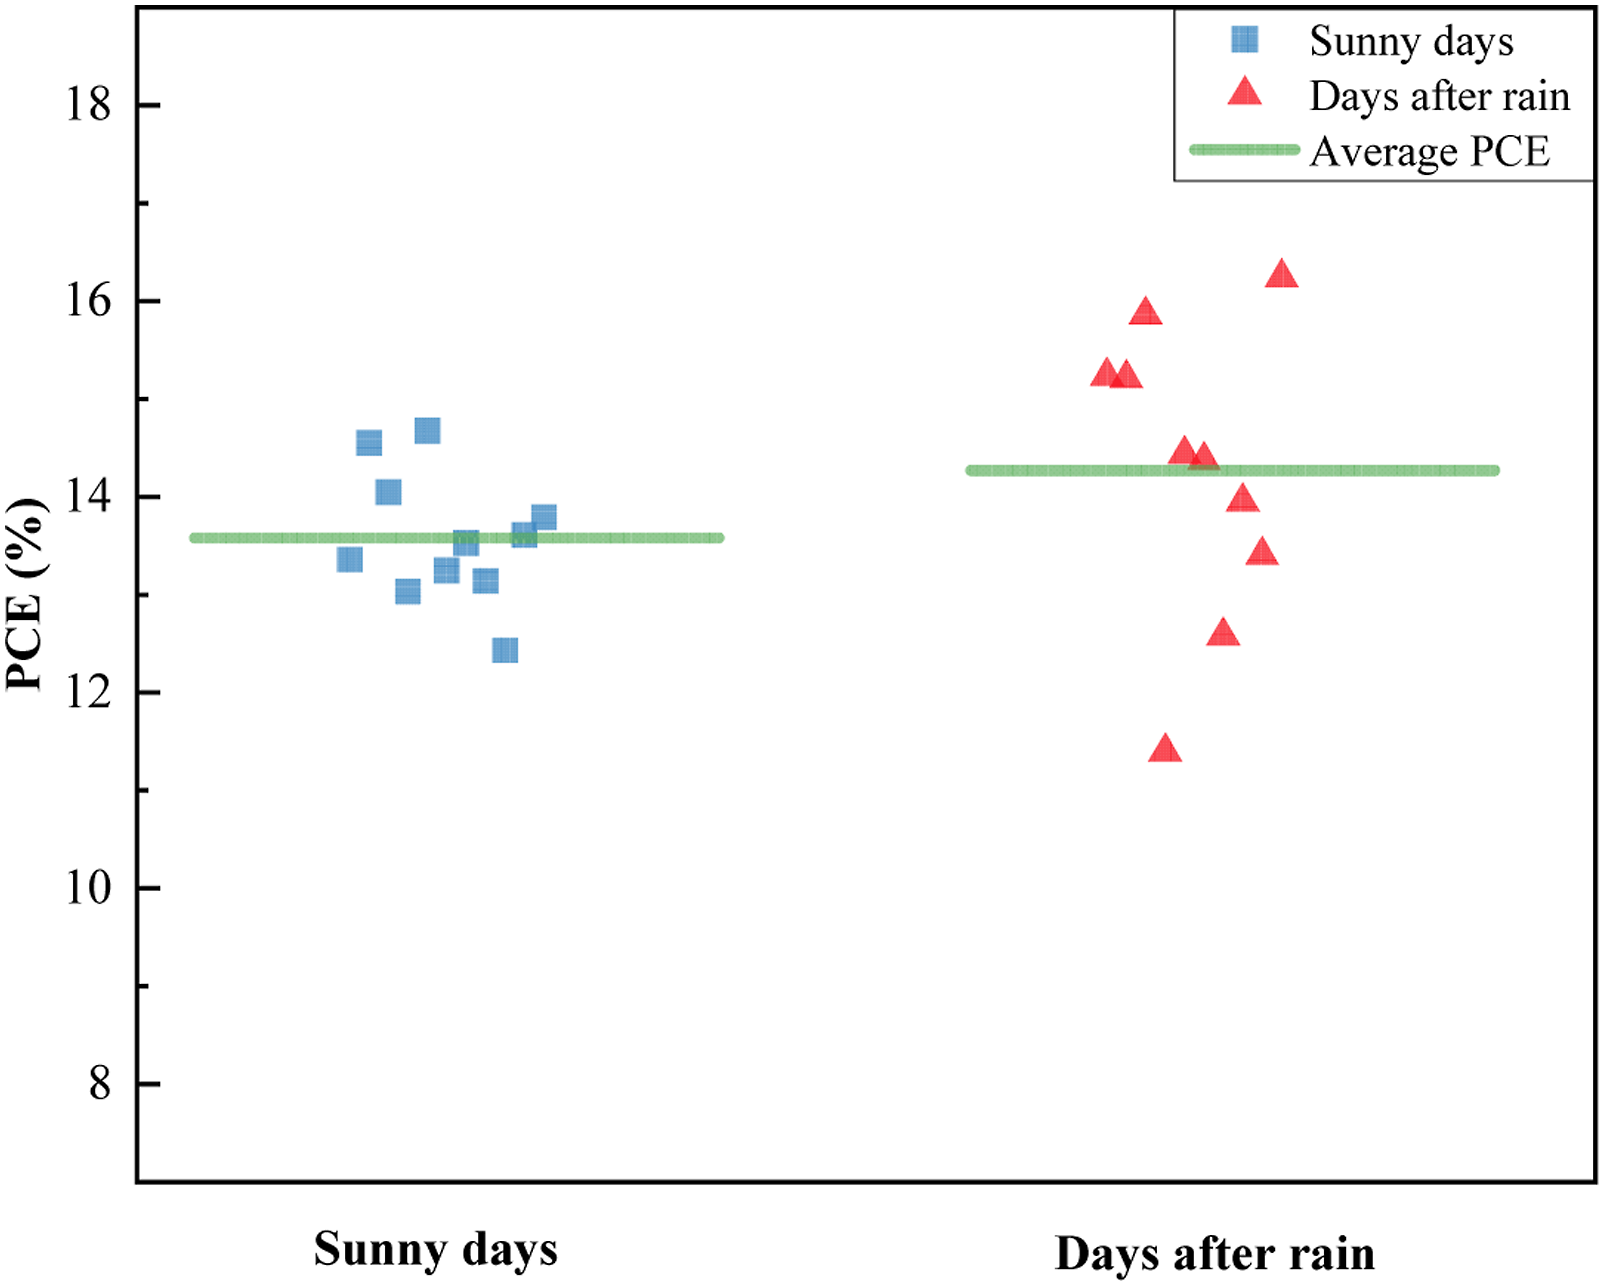
Figures 11 and 12 show the difference in power generation and PCE between rainy and sunny days. After the PV panels were cleaned with rainwater, the average power generation and PCE were slightly improved compared to those on sunny days under the same weather conditions. On the second day after a rainfall, the average power generation was 43.77 kWh, with an average PCE of 14.25%. On sunny days, the average power generation was 38.5 kWh, with an average PCE of 13.56%. The average power generation on the second day after rainfall was 5.27 kWh higher than that on sunny days, and the average PCE was 0.76% higher. These results confirm that the cleanliness of PV panels affects power generation and PCE. However, the time and economic costs must also be considered. It is impossible to arrange for professional personnel to clean household PV systems. Moreover, improvements in clean power generation and PCE were weakened by the redeposition of dust. Taking the PV system of the sample building in this study as an example, the PV panels were not manually cleaned, but the average PCE was 12%–13% with little fluctuation. Therefore, it is acceptable to rely solely on natural rainfall for cleaning. Power generation on the second day after a rainy day (comparison with sunny conditions). PCE on the second day after a rainy day (comparison with sunny conditions).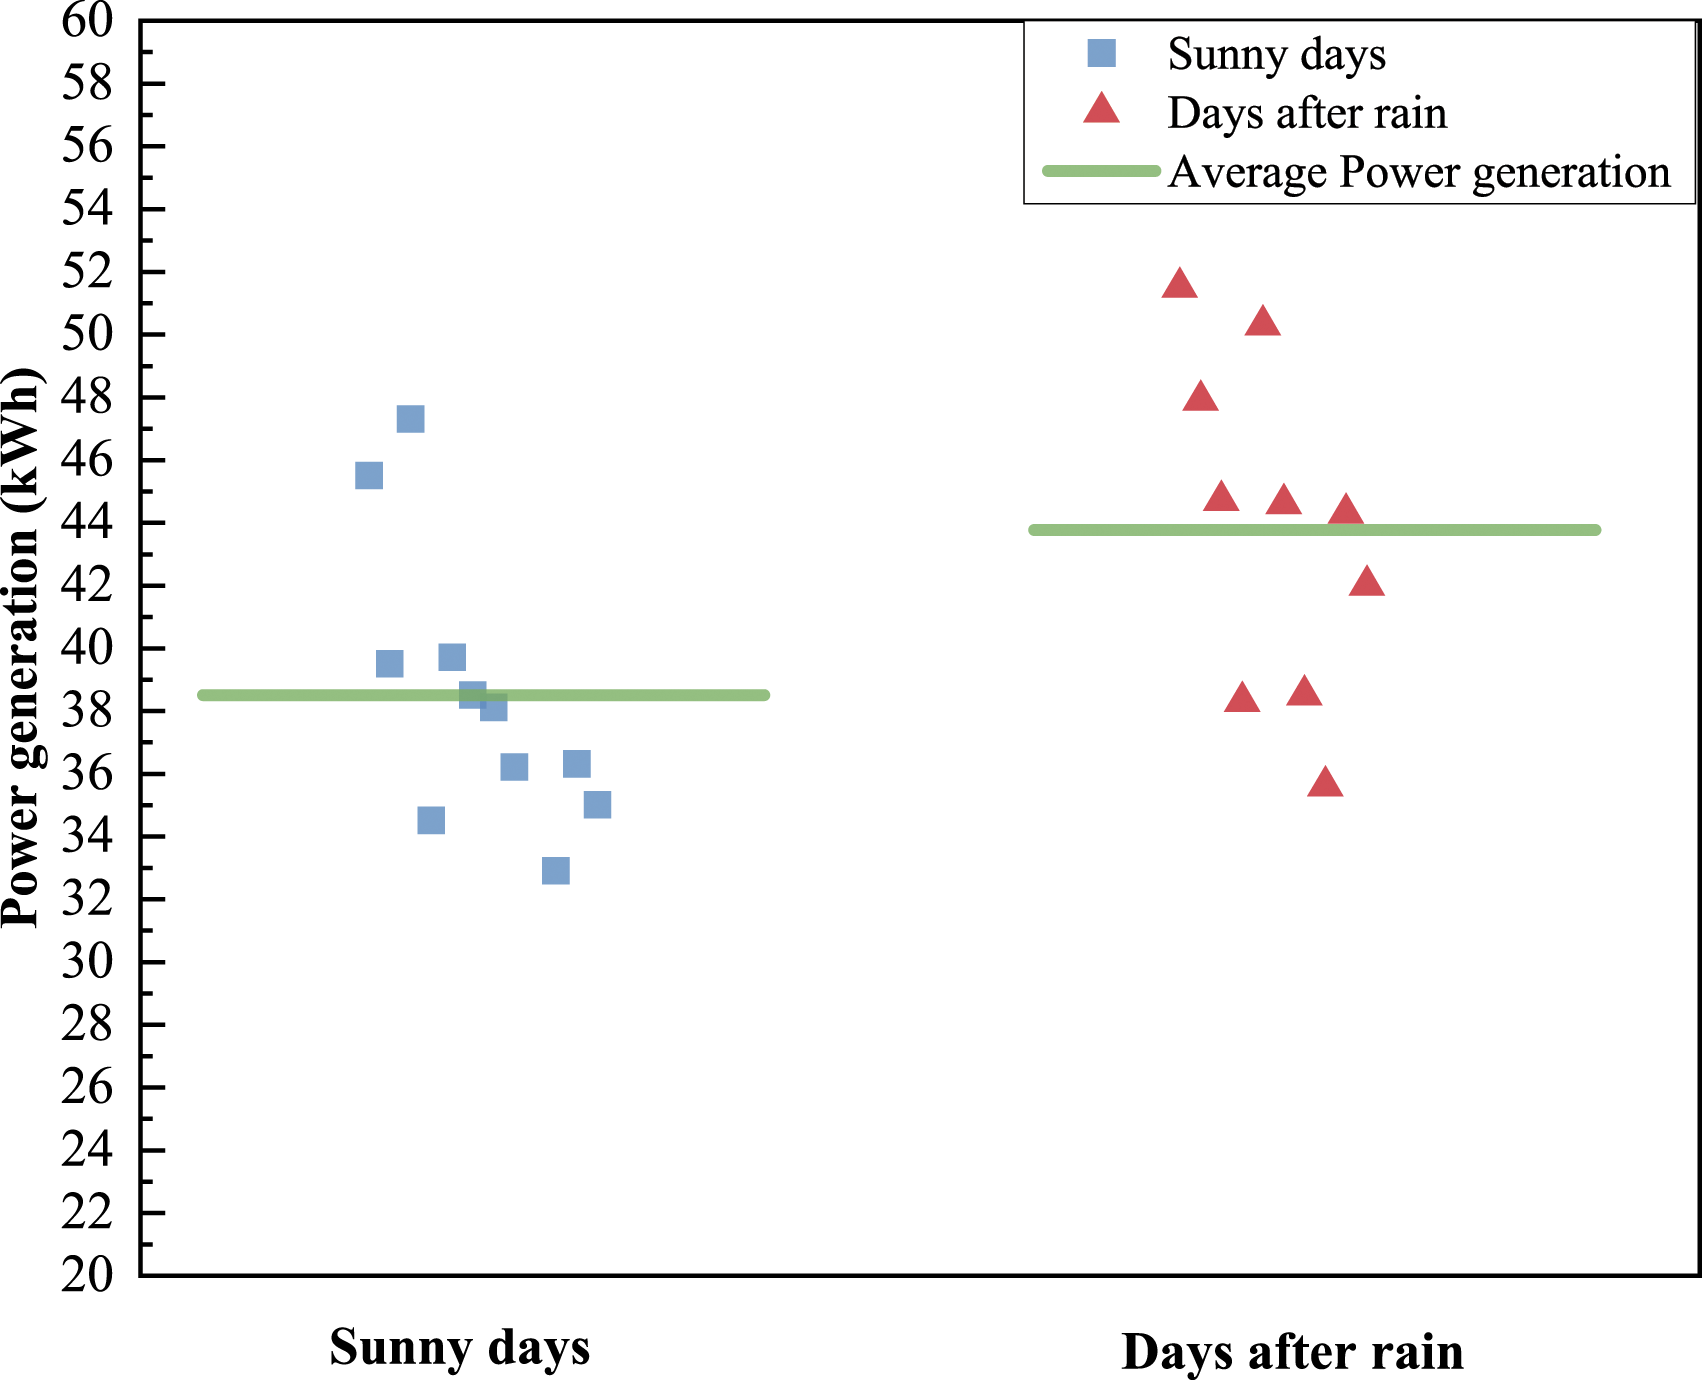
Power generation and PCE during cloudy days
Filter Conditions Compared Between Cloudy and Sunny Days.
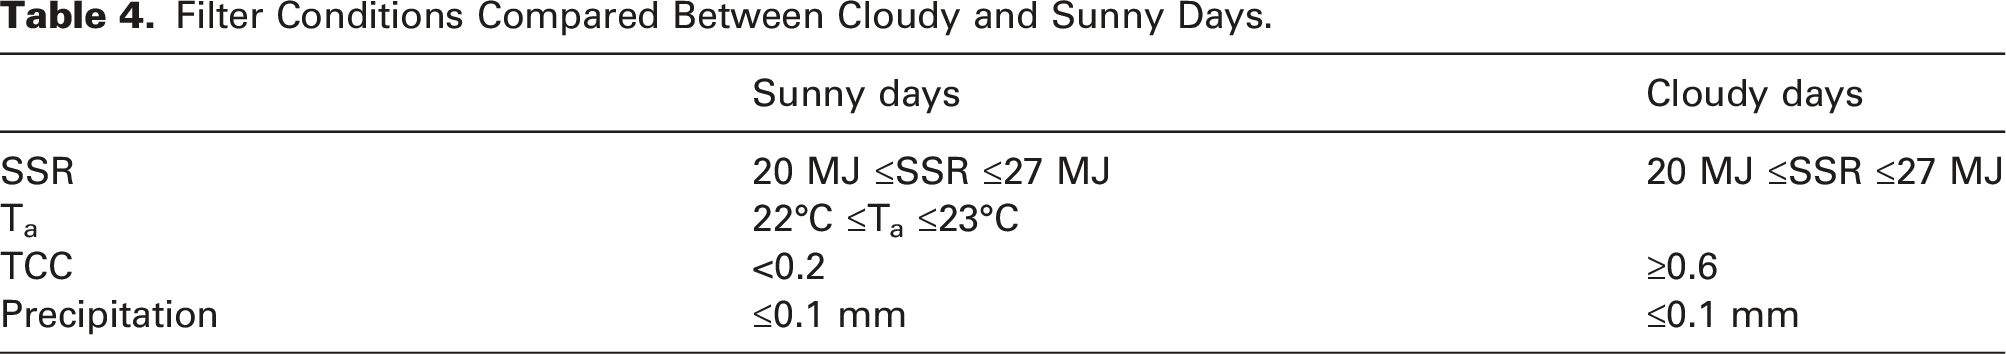
We defined weather with TCC greater than 0.6 or less than 0.2 as cloudy or sunny weather, respectively. To eliminate the impact of rainfall on power generation and PCE, the precipitation was set to no more than 0.1 mm. Cloudy weather with high SSR was screened and compared with sunny weather conditions. The average Ta of these days was 22.8°C. In eliminating the impact of Ta on power generation and PCE, one of the conditions for filtering sunny weather was set as Ta between 22°C and 23°C. After filtering (Table 4), the weather conditions were similar, except for TCC, and the impact of TCC on the PV system could be analysed.
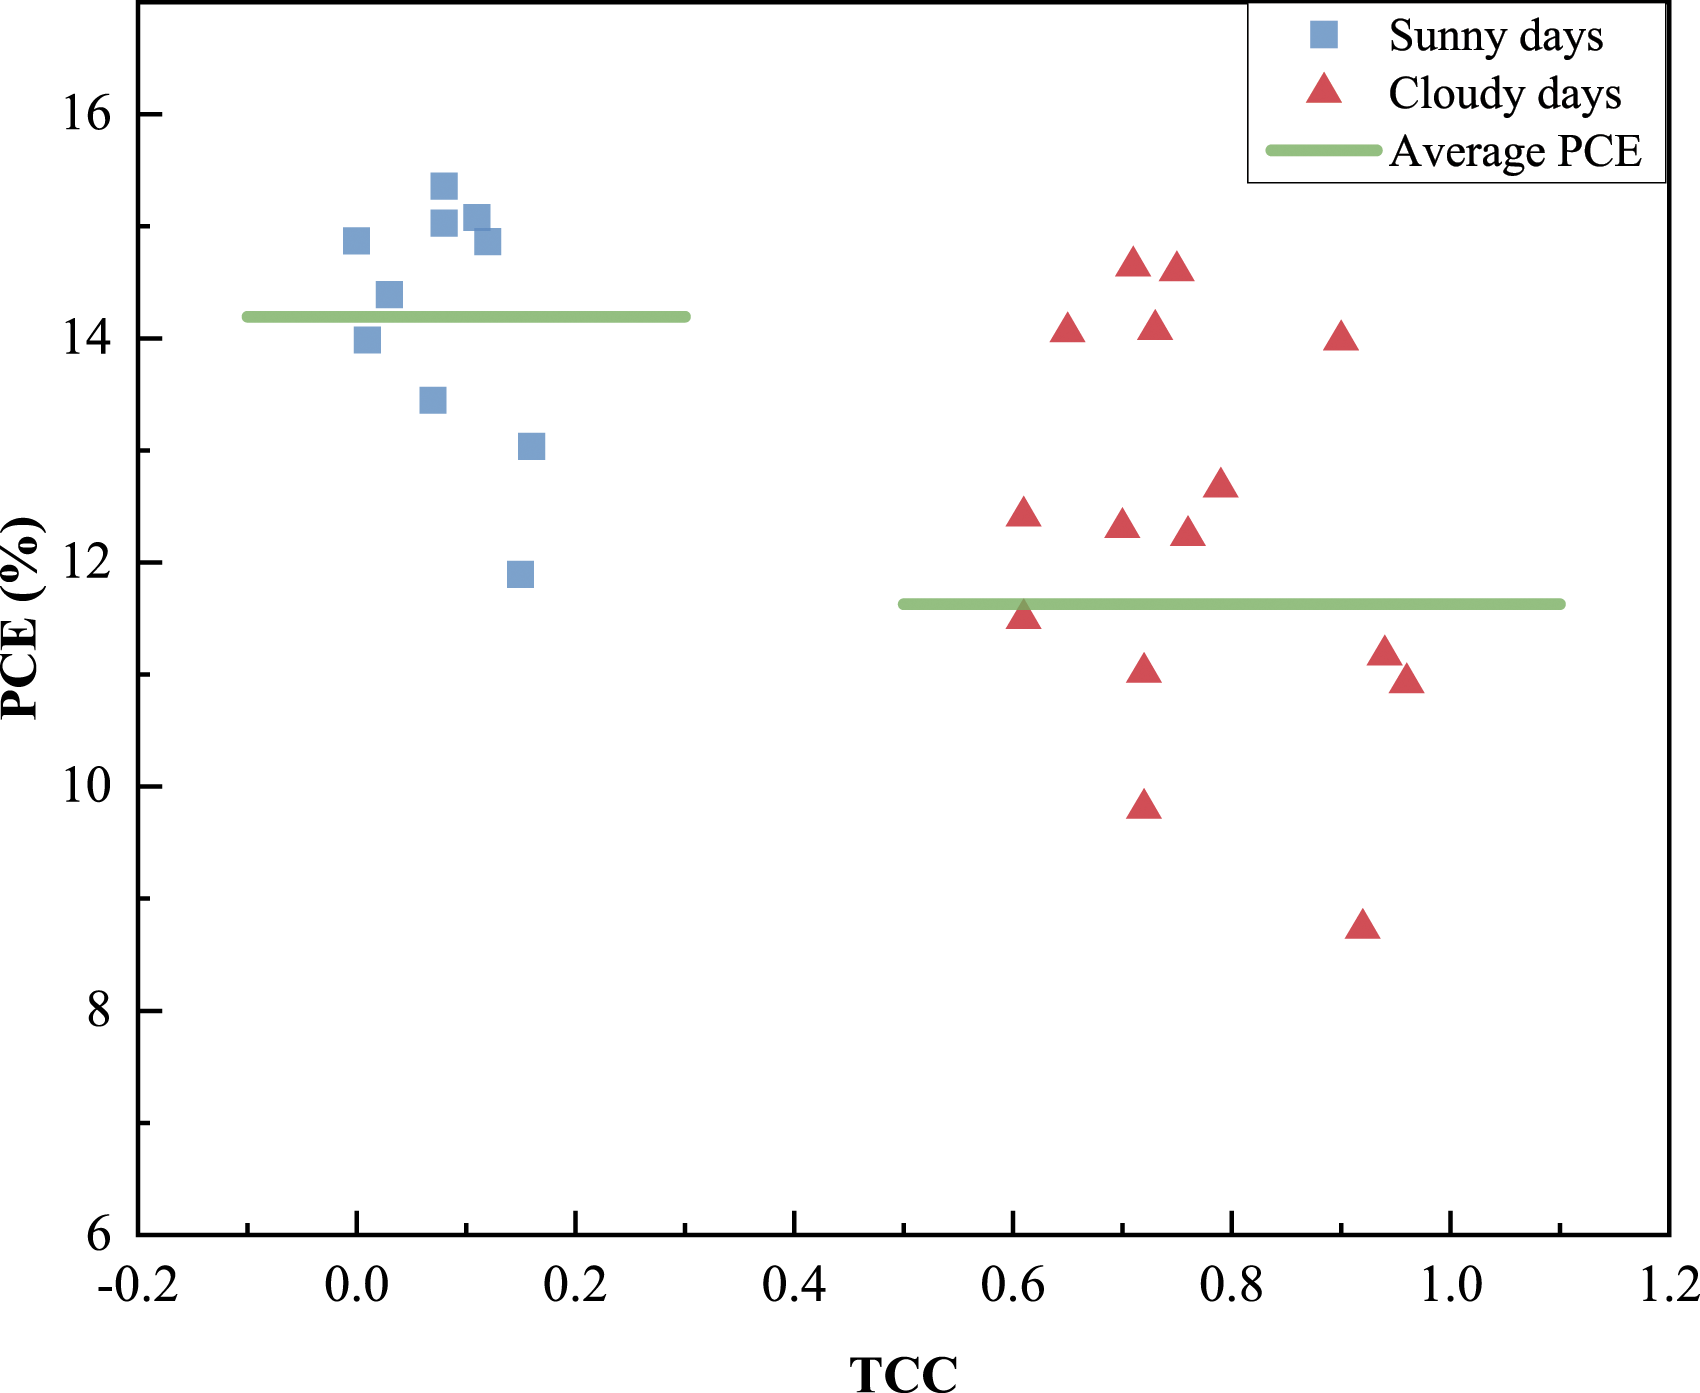
Figures 13 and 14 show the differences in the power generation and PCE between cloudy and sunny weather conditions. Under the same weather conditions, the power generation in sunny weather was 41.76 kWh, with a PCE of 14.19%, whereas the power generation in cloudy weather was 34.29 kWh, with a PCE of 11.62%. Based on the above-mentioned data, the average power generation in cloudy weather was 7.47 kWh lower than that in sunny weather, and the average PCE was 2.57% lower, indicating that the influence of cloudy weather on power generation and PCE was relatively large. Considering that the distance between the meteorological station and the sample building was approximately 20 km, a deviation would be observed between the TCC above the PV panel and the meteorological data monitored by the meteorological station. However, the trend of power generation and PCE is dependent on the TCC. Part of the sunlight was blocked by clouds, which could not act on the PV panels; thus, the power generation and PCE were significantly reduced. Power generation on cloudy and sunny days. PCE of cloudy and sunny days.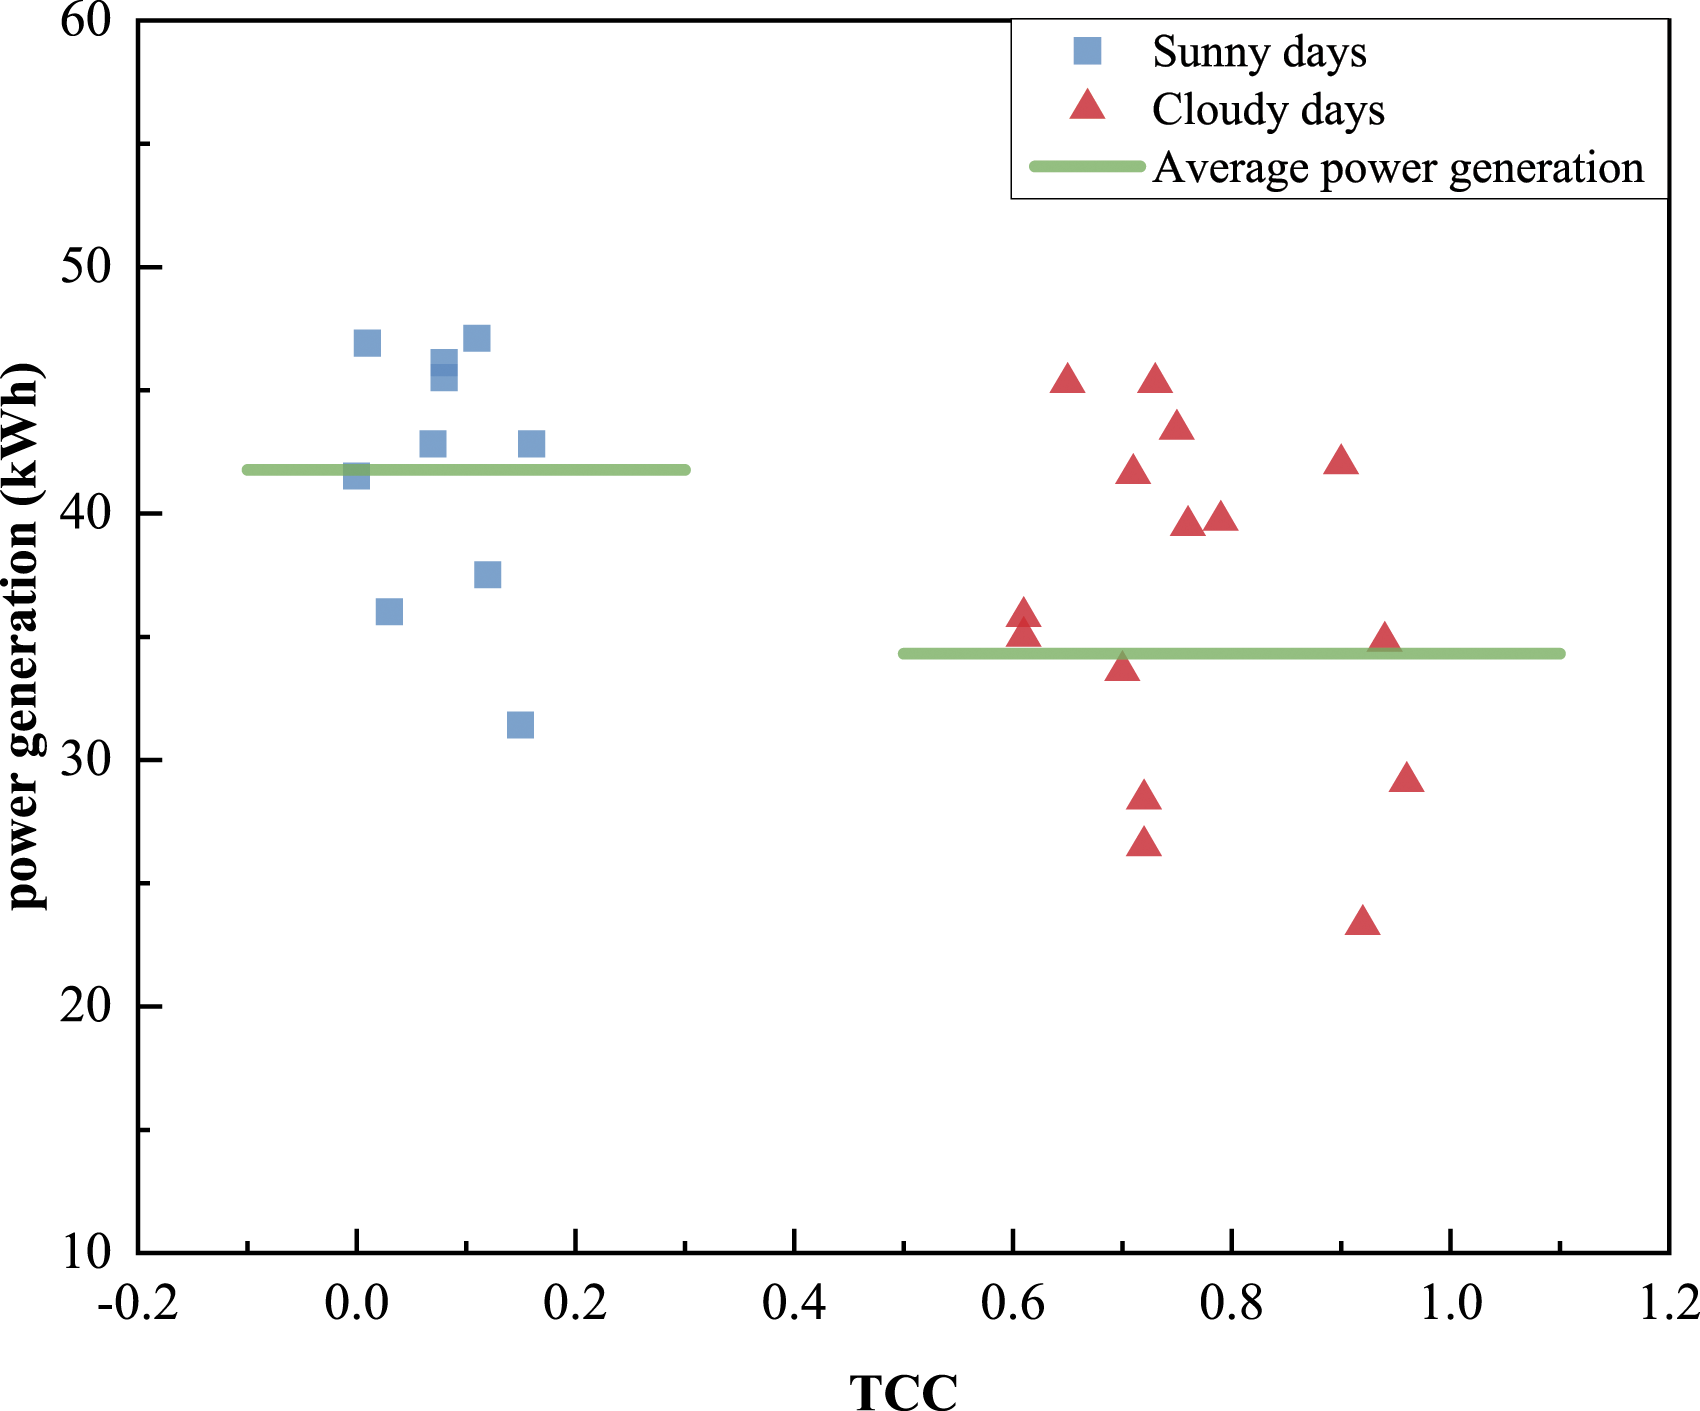
Prediction of power generation
Based on the aforementioned analysis, we believe that changes in the SSR, Ta and TCC are related to changes in power generation. In addition, based on the PV power generation data recorded from 2018 to 2021 and the aforementioned highly correlated meteorological data, the SVR algorithm was used to establish a prediction model for PV power generation in the sample building. In the prediction model, meteorological data were provided by WheatA, and PV power generation data were automatically recorded using a single-phase kilowatt-hour meter in the sample building. During data collection, data anomalies may occur because of recording errors and sensor offsets. These outliers were replaced by the monthly average.
The input variables of the prediction model included date, SSR, Ta and TCC, and the prediction resolution was 1 day. To eliminate the deviation in the prediction results caused by the interaction amongst continuous data, we randomly selected sample data for training and testing. The dataset contained 1461 data points in total, and the ratio of the training set to the test set was 8:2; that is, 1168 data points were randomly selected as the training set, and the remaining 293 data points were used as the test set.
A comparison between the predicted results of this model and the true values under different weather conditions is shown in Figure 15. Some deviations were observed between the predicted and actual values; however, they were within reasonable ranges. From the perspective of the evaluation indicators, the MAE and MAPE of the prediction model established in this paper were 3.39 and 34.7%, respectively, and R2 was 0.86. Predicted and actual values of power generation.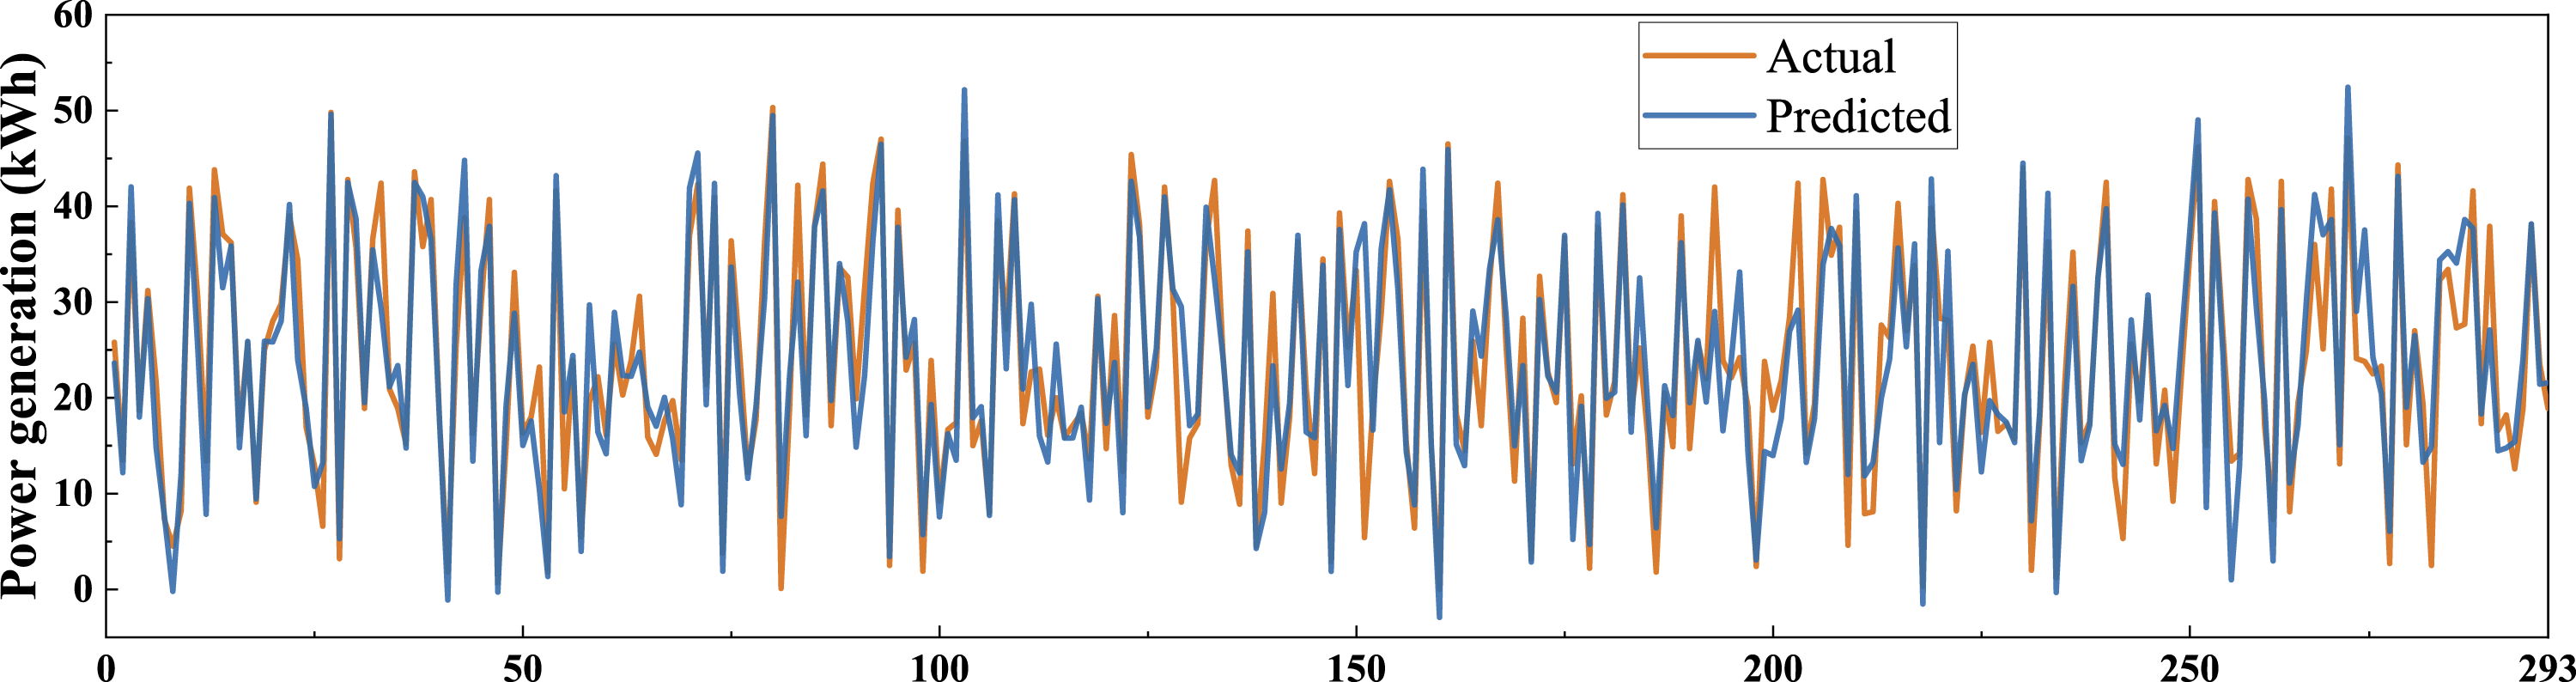
To verify whether the predicted value deviates from the actual value, a scatterplot of the test data points is shown in Figure 16, and the baseline with the predicted value equal to the actual value is delineated. The predicted value of the data points above the baseline was greater than the actual value, whereas the opposite was true for the data points below the baseline. However, several cases in which the predicted value was slightly lower were found, and some data points were lower than the baseline. By checking several data points that were lower than the baseline, the real value was found to be unstable when TCC was high; thus, the prediction result was low. Therefore, the deviation is within an acceptable range. In combination with the MAE, MAPE and R2 values, the prediction model presented in this study can accurately predict PV power generation under different weather conditions, providing a reference for future research on the matching of energy consumption systems and PV systems of single houses. Scatterplot of the actual and predicted energy production.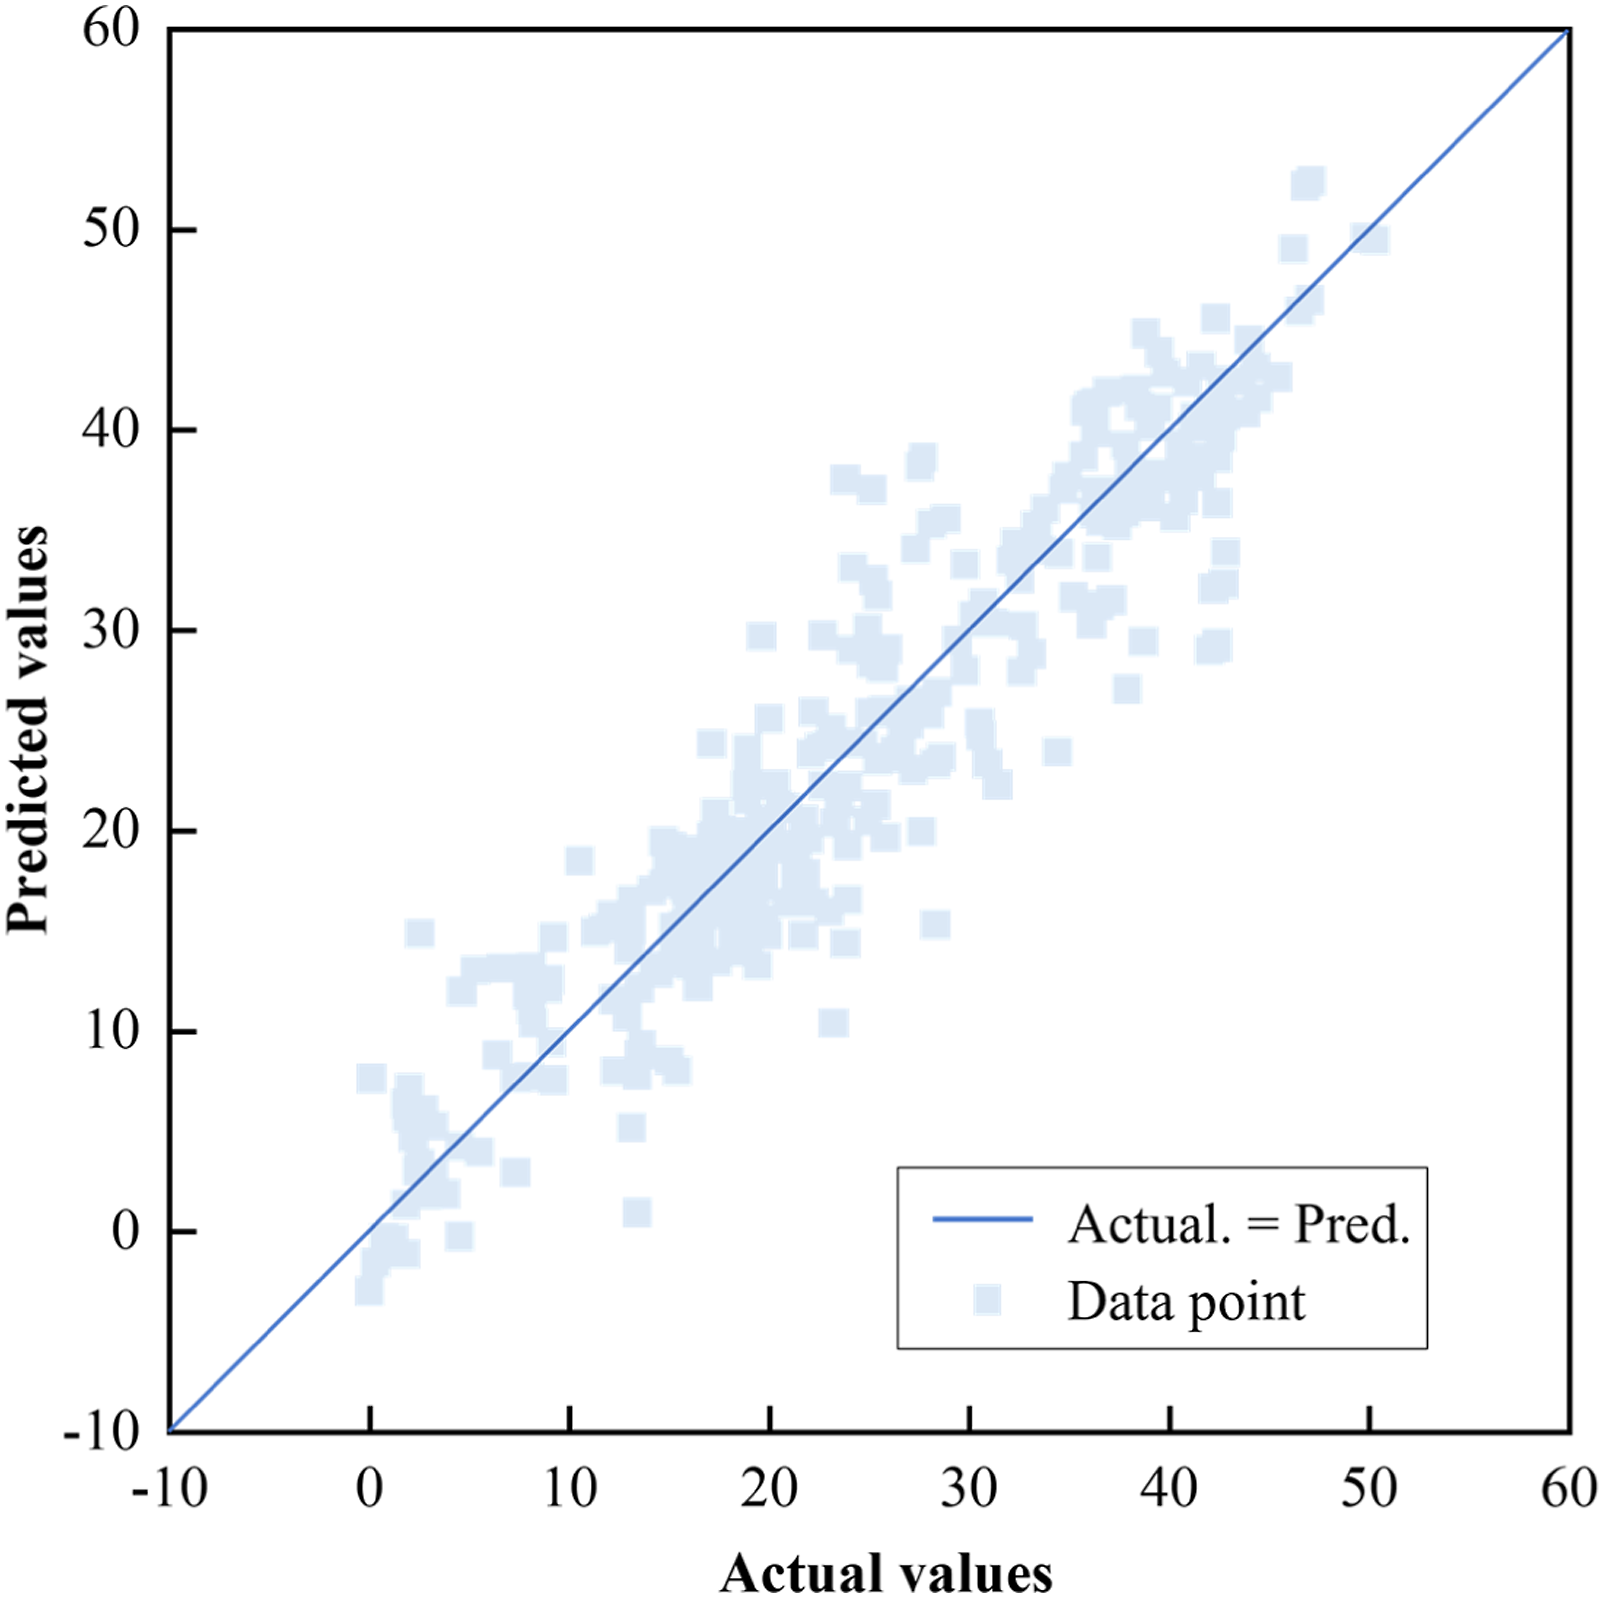
Limitations and discussion
First, the prediction of cloudy weather was insufficient. During cloudy weather, a large SSR indicates that the PV panels can still receive a large amount of solar radiation because of the short coverage time or other reasons, despite the large amount of clouds in the sky. Based on the above-mentioned analysis, we have proven that power generation and PCE are affected by such weather conditions. However, in most cases, cloudy weather is often accompanied by low SSR. Thus, meteorological stations are covered by clouds for a long time and receive only a small amount of solar radiation. In this case, the PV system of the sample building sometimes has very low power generation and PCE, or even close to zero. However, sometimes it is almost the same as that on sunny days with weak regularity. This finding might be related to the area and duration for which PV panels are covered by clouds. Considering that the meteorological data were obtained from a meteorological station approximately 20 km from the sample building, the cloud state above the PV panel of the sample building may have been different from that of the meteorological station. Given the rapid movement of clouds, a specific coverage duration cannot be ensured. These factors lead to inaccurate analyses and prediction results; thus, this study did not analyse such situations.
Therefore, cloudy weather conditions should be carefully studied to improve the accuracy of the prediction model. The duration and area of cloud-covered PV panels are factors that greatly affect power generation and need to be recorded in detail. Three measures can be used to solve this problem: (1) A camera should be added to monitor the status of the PV panels during the daytime, and the area and duration of the PV panels covered by clouds should be recorded manually. (2) A small meteorological station could be added to the roof of the sample building to monitor the TCC directly above the PV panel. (3) The hourly or minute power of the PV system should be measured and used to determine whether the PV panel is covered by cloud. After solving this problem, the uncertainty model in cloudy weather can be introduced into the prediction model, or other methods can be used to improve the accuracy of the model using the duration and area of the PV panel covered by clouds.
Second, the prediction resolution of this study is 1 day; thus, the adjustment and transfer of load on the next day can only be adjusted macroscopically, and precise adjustment of the electrical equipment cannot be carried out. To utilise PV power generation, it is necessary to take 1 hour as the prediction resolution and accurate management of household electrical equipment should be conducted, which will also be our future research work.
Conclusion
In this study, the power generation data of a single-house PV system in Beijing over the past 5 years were used to analyse the factors affecting the power generation and PCE of the PV system in combination with meteorological data. Thus, an SVR forecasting model was established to forecast power generation under different weather conditions. The main findings are summarised as follows. (1) In this study, the PCE of the CdTe PV panels was not affected by the SSR and was relatively stable. However, the influence of SSR on power generation is evident and positively correlated. The PCE in winter was the highest of the four seasons, reaching 13%. The SSR and power generation were the highest in spring. The average power generation in spring from 2018 to 2021 is 2912.5 kWh, accounting for 32.8% of the average annual power generation. (2) The Ta, TCC and cleanliness affect the power generation of PV systems. Amongst these factors, Ta and TCC have the greatest impact on the PV panels. The increase in Ta reduces power generation and PCE. Under sunny weather conditions, the average power generation under high Ta conditions is 4.5 kWh lower than that under low Ta conditions, and the PCE is 4.5% lower. The power generation and PCE during cloudy weather are 7.47 kWh and 2.57% lower, respectively, under cloudy weather conditions. The PV panels were cleaned the day after the rain, and the power generation and PCE slightly improved. However, the sample buildings that rely only on natural rainfall for cleaning are acceptable. (3) The prediction model established using SVR can accurately predict the power generation of the sample buildings under different weather conditions. The MAE, MAPE and R2 of the prediction model are 3.39, 34.7% and 0.86, respectively, which can provide a relatively accurate reference for matching the PV and energy consumption systems of a single house.
Footnotes
Author contributions
All authors contributed equally in the preparation of this manuscript.
Declaration of conflicting interest
The authors declare that they have no known conflicting financial interests or personal relationships that could have appeared to influence the work reported in this paper.
Funding
The author(s) disclosed receipt of the following financial support for the research, authorship, and/or publication of this article: This work was supported by the Local Science and Technology Development Fund Project: Research on Low Carbon Transformation Methods for Residential Buildings (XZ202301YD0009C).