
Abstract
In this study, the performance of a micro-environment system was analysed and compared with diffused ceiling ventilation. In the analysed micro-environment low velocity radiant panel system, two low velocity units and radiant panels were installed above workstations to supply directly clean air to occupants and to cover the cooling power required. With diffused ceiling ventilation, all cooling demand is covered with air and thus, the airflow rate required is higher than with low velocity radiant panel system. The varied heat gain from 40 to 80 W/m2 consists of two seated dummies, laptops, monitors and simulated solar gain. The results show that with perimeter exhaust and local supply air, 8–13% reduction of the total cooling load required is possible, in comparison to the standard mixing systems. The average exhaust temperature was 0.7–1.9°C higher than average room air temperature at the workstation. Moreover, the mean air temperature with the low velocity radiant panel system at the occupied zone was 0.6°C lower than with diffused ceiling ventilation. With low velocity radiant panel system, the air velocity was less than 0.12 m/s in the occupied zone. Also, the draught rate was less than 10%. Furthermore, the air change efficiency with the low velocity radiant panel system was over 70% which is better than 44–49% efficiency with diffused ceiling ventilation.
Keywords
Introduction
Building sector accounts for about one-third of the global greenhouse gas emissions and at the same time uses about 40% of the world’s energy. 1 A considerable fraction of this energy use is utilized for achieving desirable indoor climate in buildings. 2 According to the European Commission, improved energy efficiency of buildings means maintaining good indoor air quality and thermal comfort levels with less energy use than before. 3 In the European Union, policies have been stricter according to the EU 2030 goals on energy efficiency demands in buildings to meet EU’s long-term 2050 greenhouse gas reductions target, which is −30% in 2030 and −80% in 2050 compared the reference year of 1990. 4
In many cases, good indoor environment and energy efficiency are often seen as conflicting requirements. Therefore, novel Heating, Ventilating, Air-Conditioning (HVAC) systems are required to achieve simultaneously indoor climate and energy efficiency requirements. For that reason, more concerns have been focused on micro-environment of occupants to optimize energy usage and trade off energy conservation and indoor comfort, where the main challenge is to supply clean air to the breathing zone and maintain thermal conditions.
In large enclosures, occupied zones are made up of typically only a small volume of total space volume where the principle to control only the occupied zone is a well-known practice.5,6 In high spaces, occurrence of vertical temperature and pollutant gradients is possible and thus the strategy of the air distribution is only to control actively the occupied zone, e.g. with displacement ventilation. 7 In normal height spaces, for example, like in offices, the main challenge has been to cover relatively high specific cooling demand (typically 60–100 W/m2) and distribute simultaneously clean air to workstations without draught risk in an energy efficient manner.8,9 In the modern open-plan office environments, the total heat gain is substantial due to poor solar shading of large glazed facades, high occupancy density and significant equipment load.
To maintain indoor air quality, international standards or design criteria, for example,10,11 typically require a ventilation rate of 4–10 L/s per person of outdoor air supply to office spaces. The air inhaled by each occupant is only 0.1 L/s. 12 Thus, this inhaled air is only 1% of the supplied air. However, the required supply airflow rate is typically much higher when the ventilation is used for cooling.
The most common ventilation system is fully mixing all-air system with ceiling diffusers, where the cooling capacity is covered with the supply airflow rate. 8 Lately, diffused ceiling ventilation (DCV) system has been introduced to offices to provide a better indoor climate compared to standard mixing ventilation strategy.13–17 The ventilation strategy of DCV is also mixing where the supply air is released with low momentum flux and the combination of thermal plumes and ventilation is mixed in the air volume. According to reports, the DCV system may reduce draught risk in high cooling load applications (more than 80 W/m2) compared to the standard mixing systems.13,14 By using the DCV, architecturally excellent solutions could be possible where ventilation system is invisible. However, the DCV is a total volume system that provides a uniform indoor climate condition for the whole space.
Convective cooling of the body at warm environment improves peoples’ thermal comfort but may cause thermal discomfort in cooler environment. However, the high airflow rate of all-air systems might cause thermal discomfort.18,19 To reduce the risk of draught, air-water systems, for example, radiant cooling panels have been becoming more popular where the major part (more than 50%) of cooling load is covered from water side. By using radiant cooling systems, air movement could be reduced.20–22 A review of the research on radiant cooling reported that radiant cooling may enhance thermal comfort compared with convective cooling. 23 From the radiant panel itself, the most significant portion of the cooling power is released by long wave radiation. With the use of radiant panels, average portion of radiation (56%) and convection (44%) was reported in earlier research.24,25 Thus, also with radiant panels, convection is playing a big role.
Draught-free air distribution in the occupied spaces is very complex in practice to arrange either by all-air or air-water systems if the cooling load required is higher than 60 W/m2. 8 This leads to the situation where the average satisfaction on indoor climate is very low in many buildings. The average proportion of dissatisfied persons was reported to be over 30% on thermal comfort in high quality Nordic offices. 26 Air movement depends on the interaction of the supplied airflow and the thermal plume generated by persons and other possible heat gains.27,28 How to reduce draught risk is widely studied in public and commercial buildings environments.29,30 Experimental studies were performed to analyse the effect of different design parameters on the comfort conditions, e.g. effects of different heat gain distributions, 31 ventilation strategies, e.g., mixing or displacement ventilation32,33 and facade structures. 34
In general, there is a need for a paradigm shift from uniform indoor environment to non-uniform indoor environment accommodating various individual preferences. 35 The target should be only to control local conditions when a person is at the workplace. There should be also a need to introduce more advanced systems where users can influence their own local micro-environment. An individually controlled micro-environment by providing local heating/cooling of the body and body parts has a potential to satisfy a greater number of occupants in a space compared to a centrally controlled total volume environment.36–40
In office buildings, only the area consisting of the breathing and personnel working zones needs to be controlled.41,42 In industrial premises, there has long time realized that only the near zone around workers would need to be protected from pollution and thermal stress.43,44 Based on this, local exhaust ventilation45,46 and push-pull ventilation strategies 47 have been widely used to directly remove the contaminant and heat. In operating theatres, only the local indoor environment for patients and medical personnel would need to be secured. 48
During last years, different personalized ventilation (PV) systems in commercial and residential buildings’ environments have been studied. PV installed at workstations provides the clean air close to each occupant’s breathing zone and has the potential to improve inhaled air quality.42,49,50 Recently, local hospital bed ventilation51,52 and natural personalized ventilation 53 were introduced to meet the individual indoor air quality requirements and avoid airborne cross-infection. Also, other types of personalized ventilation systems were introduced, e.g. ductless PV, 54 ceiling-mounted PV 55 and protected occupied zone ventilation, 56 to address the individual requirements of indoor air quality and thermal comfort. Also in residential buildings, a bed side personalized ventilation 57 was applied to create a local environment that enhances sleep quality. As mentioned in previous studies, there have been successfully utilized local micro-environment control strategies in many applications. Those new solutions make possible to improve air quality and thermal comfort and to simultaneously reduce energy consumption compared to the traditional ventilation systems. The numerical studies show that the use of PV may reduce energy consumption up to 51% in hot and humid climates 58 and 60% in a cold climate. 59
In recent years, several concepts were introduced for micro-environment control.60–62 The performance of an individually controlled system could be, for example, comprised of a convection-heated chair, an under-desk radiant heating panel, a floor radiant heating panel, an under-desk air terminal device supplying cool air and a desk-mounted personalized ventilation, used for cooling and heating effects at different room temperatures. 63 Also some other strategies to create micro-environment conditions were presented by, for example, Shao et al. 64 who proposed a multi-mode ventilation by a combination of several single airflow patterns to meet multiple demand scenarios including variable locations of occupants and indoor sources. Previous studies indicate that the control of local micro-environment has potential to satisfy more occupants in a space compared to the total volume systems used at present.
Most of earlier studies in office environment were focused on either personalized convection or radiant solutions that were installed close to the workstation. At the moment, there is no study of the system where the micro-environment in a workstation is provided with a ceiling hanging radiant panel and low velocity unit. The novelty of this paper is to introduce and analyse the performance of new ventilation and cooling systems where local micro-environment is created by using local low velocity radiant panel system (LVRP) in a double office layout. Together with the localized LVRP system, background ventilation is arranged with diffuse ceiling ventilation. Also to increase efficiency, perimeter exhaust grille is installed over the window to capture the convection heat gain of warm window. A comparison of the performance between LVRP and the previously studied diffuse ceiling ventilation (DCV) 65 was also conducted. In this study, thermal comfort and air quality indices are compared with LVRP and DCV systems.
Methods
Test chamber and analysed systems
The experimental measurements were performed in the steady-state laboratory condition. The measurements were carried out in a test chamber with internal dimensions of 5.50 m (length), 3.84 m (width) and 3.20 m height from the floor up to diffuse ceiling panels. The floor area was around 21 m2. The test chamber was located inside a laboratory hall such that the outer environment was stable.
In this study, the performance of a new ventilation and cooling system with local micro-environment was evaluated by using the local low velocity radiant panel system (LVRP). The performance was compared with the earlier studied DCV system. 65 Both systems were measured at 40, 60 and 80 W/m2 heat gain levels. This describes the increase from a common heat gain level in offices up to the peak level. Figure 1(a) presents the layout of the test chamber with local low velocity units with the radiant panel system (LVRP). Figure 1(b) shows the layout of the earlier studied diffuse ceiling ventilation (DCV) system. 65
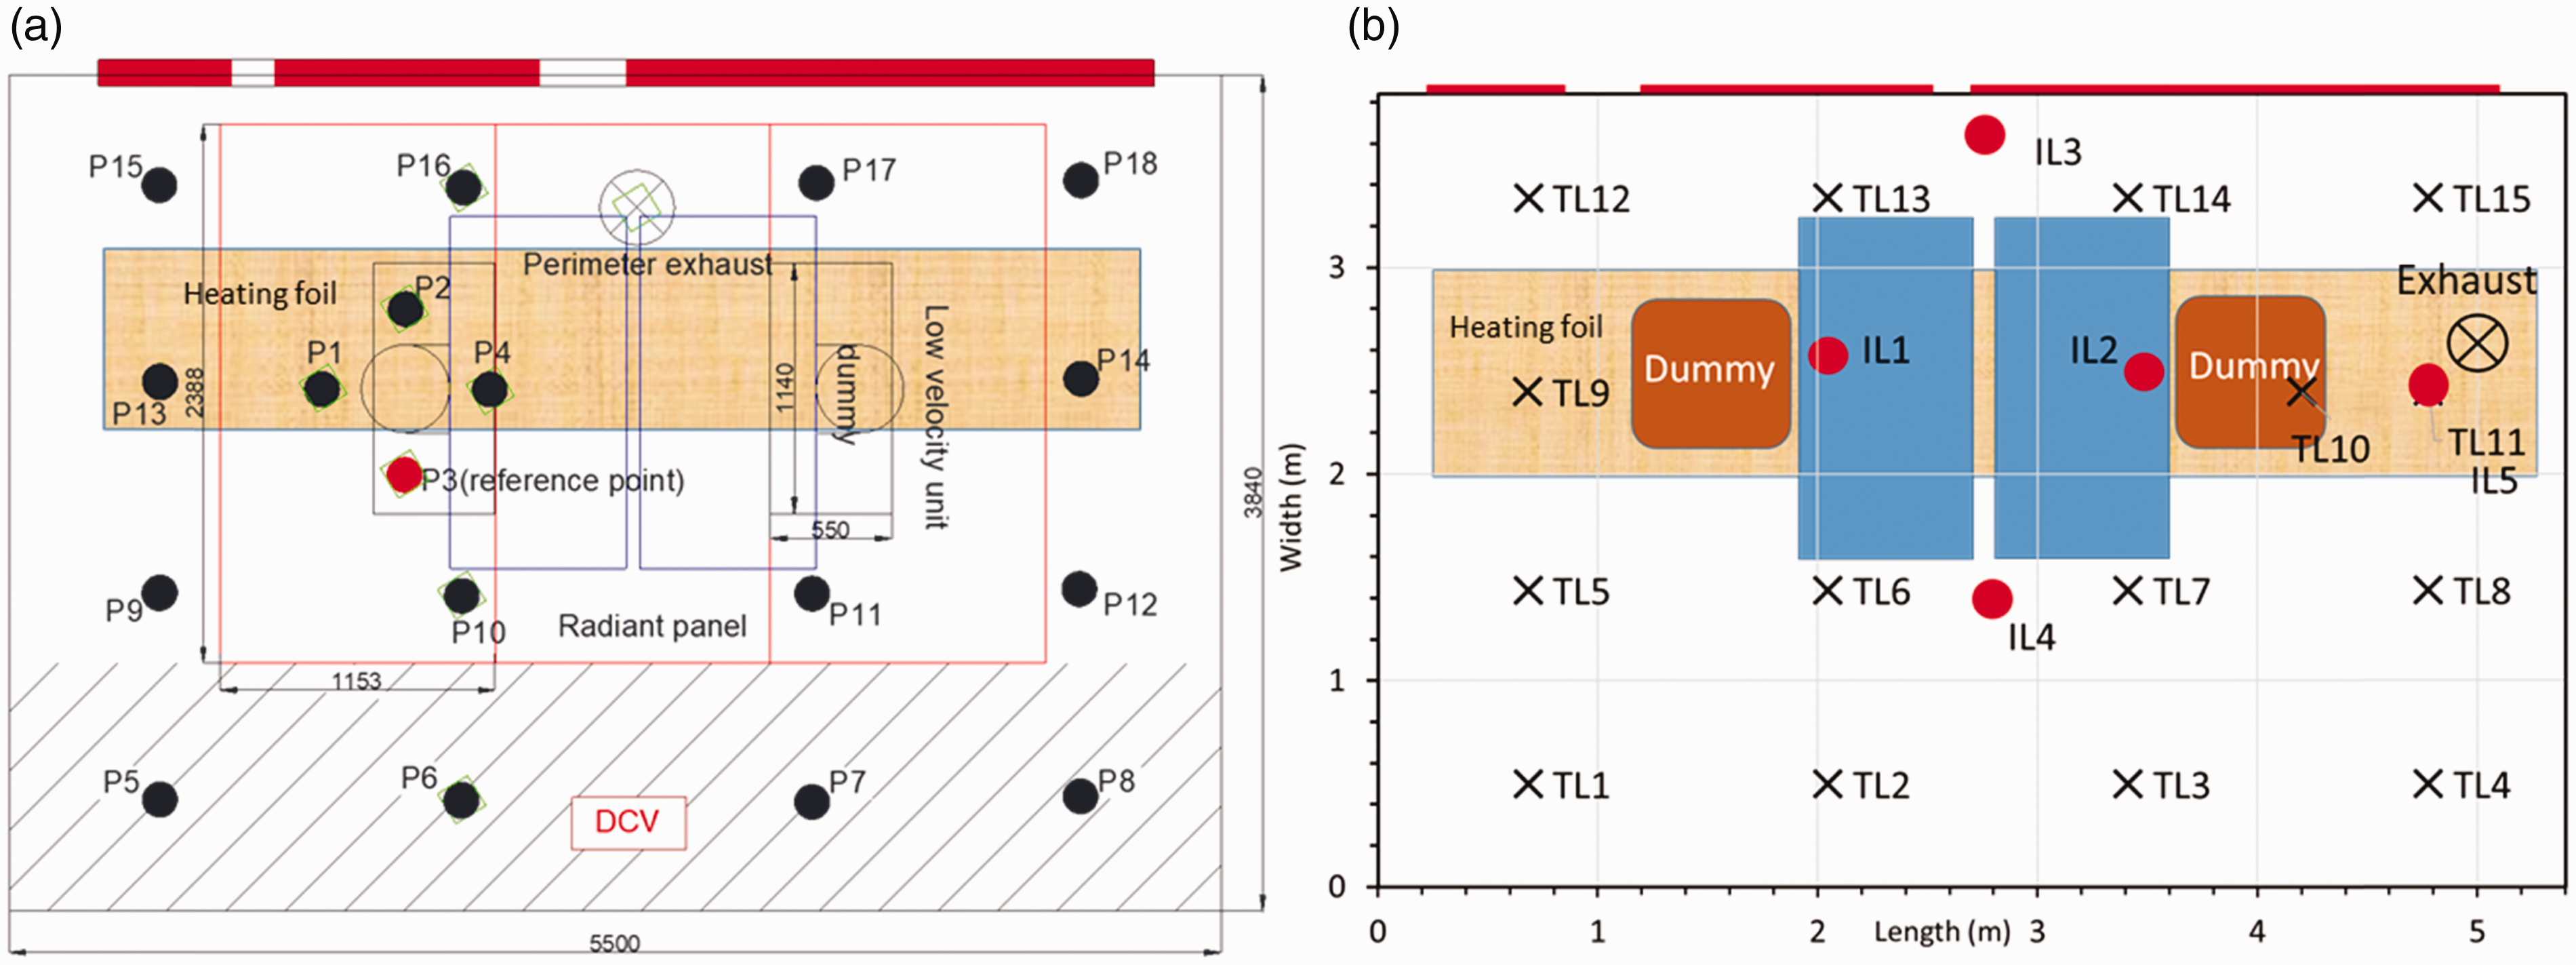
Test room layout and the measurement locations for evaluation of the performance of: (a) a local low velocity radiant panel system (LVRP) and the diffuse ceiling ventilation (DCV) background ventilation and (b) the diffuse ceiling ventilation (DCV) alone. 65 Note: Please refer to the online version of the article to view the figure in colour.
With the installation of both systems, two workstations with two dummies 66 were located in the middle of the room 0.6 m from the window panel in longwise direction, as shown in Figure 2. Both workstations were also equipped with a laptop and a monitor. Lights were installed in the middle of these workstations at the ceiling at a height of 3.2 m. Window panels were heated depending on the cooling load demand of up to 30–40°C simulating solar gain, as shown in Table 1. The heating power was provided by hot-water pipes inside the window panel. In the case of 80 W/m2, the additional heat source of 0.4 × 0.4 × 0.4 m3 was located on the floor below the table to model a computer. The electric heating foil of 5.0 m (length) and 1.0 m (width) was installed on the floor 0.8 m from the heated window panel wall to simulate direct solar radiation (see Figure 1).
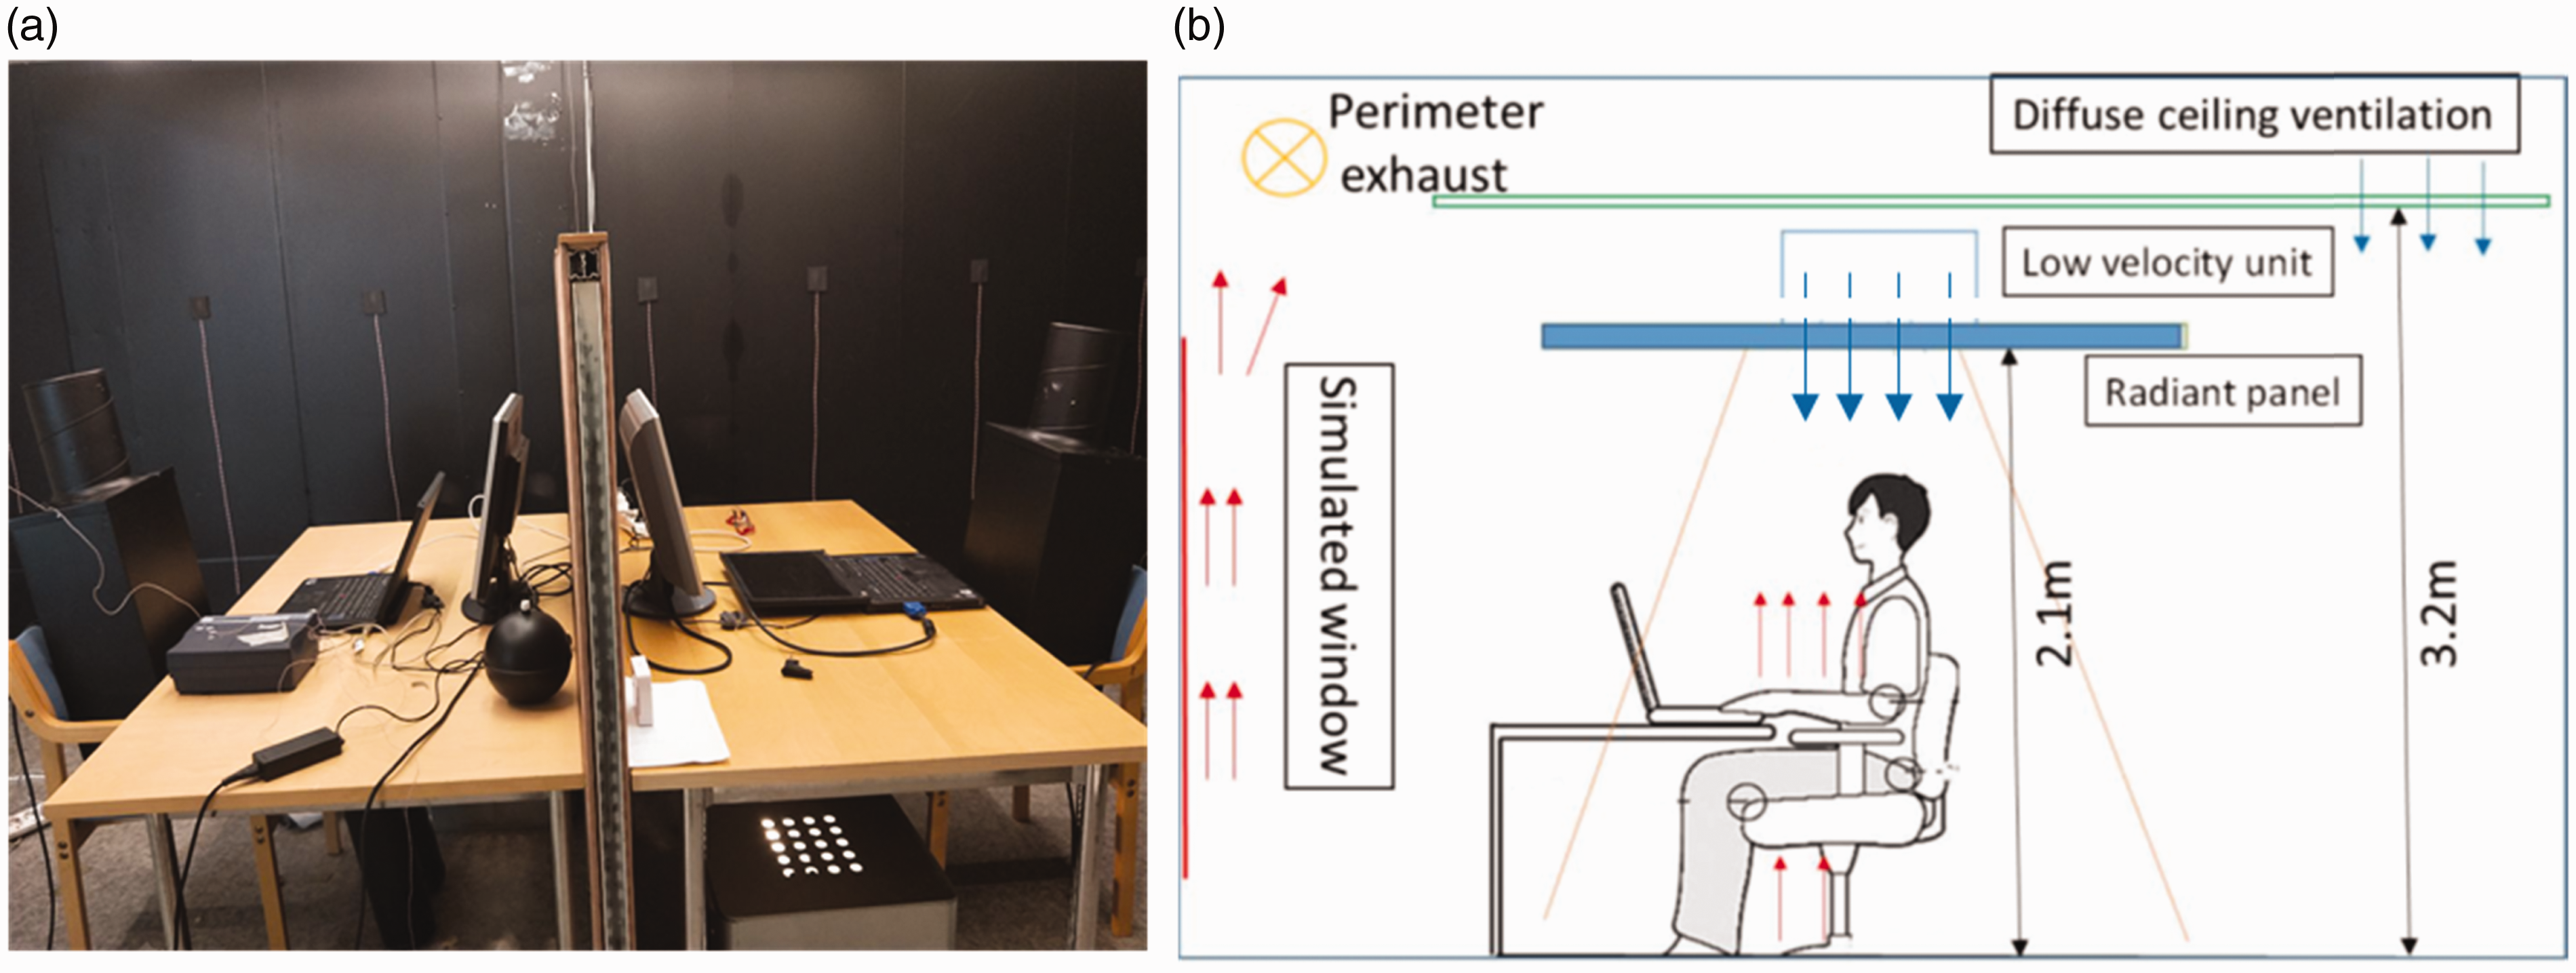
(a) The layout of two workstations with dummies and heat gains and (b) the sketch of local low velocity radiant panel system (LVRP) and DCV as background ventilation.Note: Please refer to the online version of the article to view the figure in colour.
Used heat gains in tests of the LVRP and DCV systems.
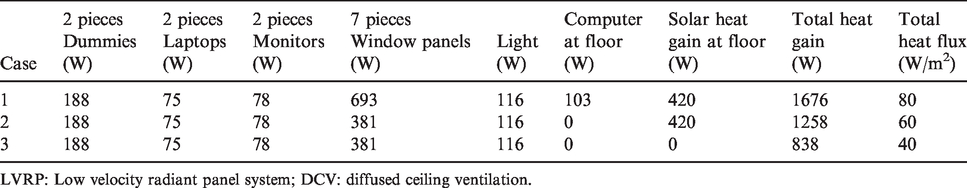
LVRP: Low velocity radiant panel system; DCV: diffused ceiling ventilation.
Two low velocity units were installed just over the radiant panels and air was supplied through those panels. The supply units were installed in the middle of the occupied area in longwise direction to provide the required outdoor air directly to workstations and create the microenvironment at the occupied zone. The supply air of 10 L/s and 15 L/s per unit was distributed directly downwards, as shown in Figure 2(b). The airflow rate from two low velocity units were balanced with the control damper PTS/B. 67
There are three perforated radiant cooling panels (2388 mm × 1153 mm) made of white 0.7 mm thick galvanized steel, as shown in Figure 3. The temperature of the inlet water was constant at 15°C and the water flow rate was controlled according the cooling demand. All radiant panels were perforated with 22.7% perforation free area. There were two pipe loops in each panel (in parallel 2 × 8 pipes) and the internal pipe diameter was 12 mm. The pipe connection of these radiant panels is presented in Figure 3(a). The radiant panels were in exposed installation and there was no top surface insulation on these radiant panels. Three radiant panels were installed over two workstations at a height of 2.1 m from the floor, as shown in Figure 3(b). The installation height was selected so that a tall person could easily walk to workstation. The distance between the diffuse ceiling ventilation panels to radiant panels was 1.1 m.
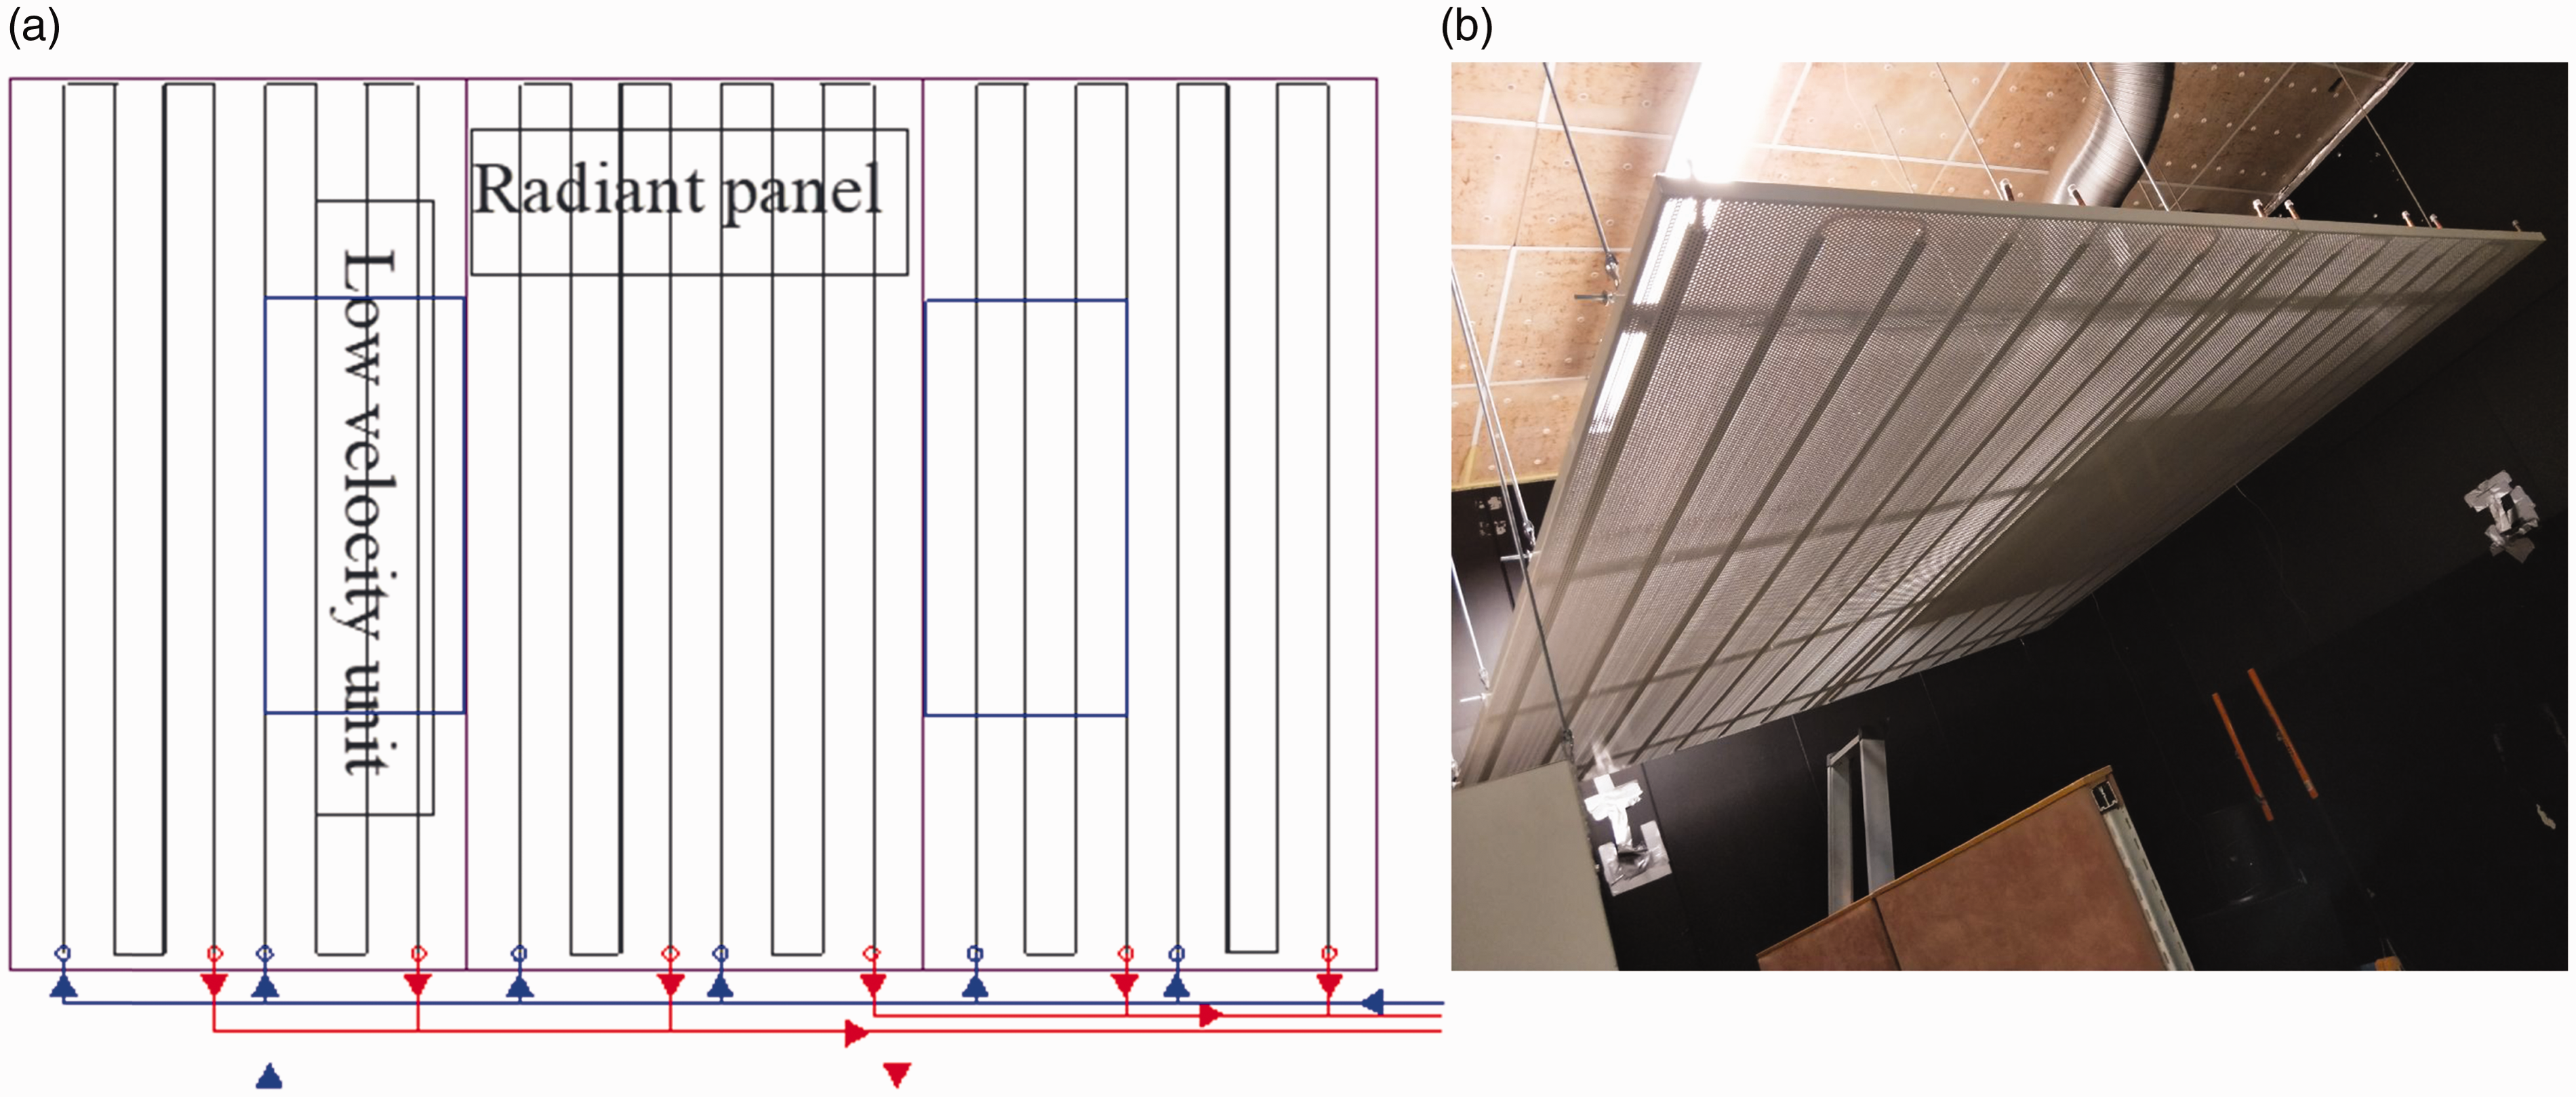
(a) The principle of water pipe connection in three radiant panels and (b) installation of three radiant panels over workstation.
The diffuse ceiling ventilation was used to provide the background ventilation outside the occupied zone. In Figure 1(a), the supply area of the background ventilation is marked. The reference temperature was set to be at a height of 1.1 m at measurement location P3. The temperature was kept constant at 23.5°C at the low heat gain of 40 W/m2 and at 26°C at high heat gains of 60 W/m2 and 80 W/m2. In the perimeter zone over the simulation window, exhaust grille was installed to directly capture the convective flow of the window (see Figure 1(a)).
With the reference DCV system, the workstation, heat gains and measurement locations were located exactly in the same location (Figure 1(b)). With DCV concept, the whole ceiling area was used to supply air. The reference room temperature with DCV was located at the exhaust terminal that was located at a height of 3.2 m (Figure 1(b)). The exhaust temperature was kept constant at 26.0°C in all cases.
Measurement set-up
The characteristics of flow field of air temperature, air velocity, turbulence intensity and draught rate were measured by hot-sphere anemometers at 18 locations (P1–P18) with LVRP and 15 locations (TL1–TL15) with DCV, as shown in Figure 1. The anemometers were installed into a measuring mast at heights of 0.1 m, 0.6 m, 1.1 m and 1.7 m. The operative temperature was measured at 1.1 m according to the Standard 55–201068 at P3 (reference point) with LVRP (see Figure 1(a)). Surface temperature (walls, floor, ceiling, windows) and humidity of air were measured by the Tinytagplus-2-meters. All measurement sensors were calibrated prior to measurements. The detailed temperature differences on surfaces were measured with infrared camera and temperature sensors to verify that water temperature inside these panels is as designed. The indoor airflow pattern was visualized with marker smoke to verify air distribution at work stations before physical measurements. All tests were carried out under steady-state conditions. The measurement averaging interval was 10 min. Thus, all 10-min measurement periods were about 3.3 times longer than normally used 3-min averaged measurements. 68
In this study, indoor air quality (IAQ) was evaluated by using tracer gas measurement. CO2 was employed as tracer gas because the background concentration of CO2 is constant during measurements. Gas-analysator was used to measure CO2 concentrations with different heat gain levels and at seven locations (P1–P7) at a height of 1.1 m above the floor and one location at exhaust (EX) with LVRP and five measurement locations (IL1–IL5) with DCV. IL1 and IL2 were attached to the face of two heat dummies at a height of 1.1 m to measure the indoor air quality at the occupied zone. IL3 near the simulated window (more thermal plume) and IL4 (less thermal plume) were located at unoccupied zone at a height of 1.1 m. IL5 was located at the exhaust to measure the air change efficiency for the whole room. With LVRP system, IAQ measurements were carried out at four different locations (P1–P4) close to the dummy. Also, P5–P6 (less thermal plume) were located at unoccupied zone and P7 near the simulated window (more thermal plume).
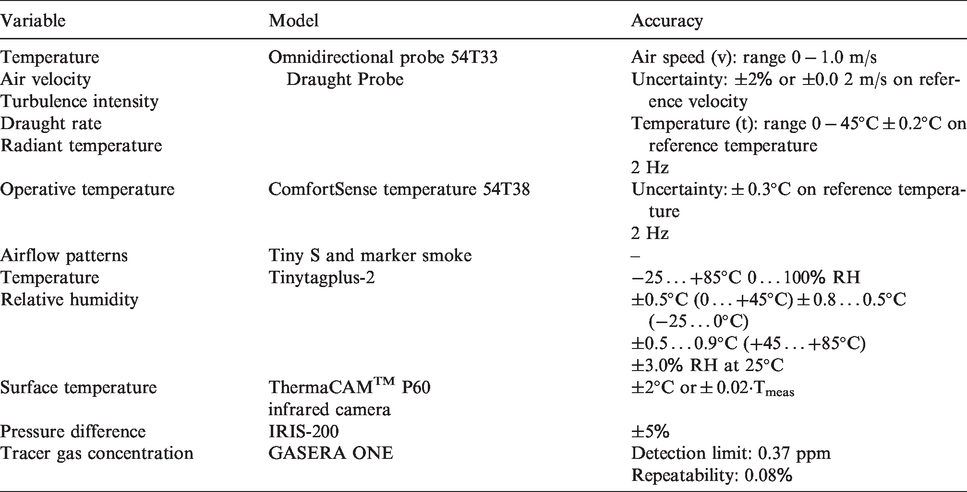
All measurement devices that were used during experiments are summarized in Table 2.
The measuring instruments.
Different airflow rates of LVRP that were supplied to each workstation from the low velocity units are summarized in Table 3. The total airflow rate was kept the same with three heat gain levels. The water flow rate inside radiant panels was adjusted accordingly to compensate for the residual cooling load.
Two tested airflow modes supplied to each workstation by the LVRP under heat gain levels (40, 60 and 80 W/m2).
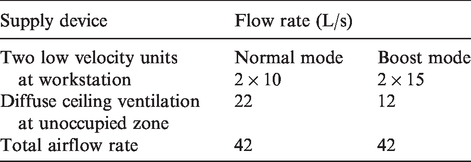
Table 4 shows the total airflow rate used with three heat gain levels when DCV was adopted to ventilate the test room. The parameter of the radiant panels and supply air for three heat gain levels are summarized in Table 5.
The total airflow rate used with studied heat gain levels (40, 60 and 80 W/m2) when DCV was adopted to ventilate the test room.
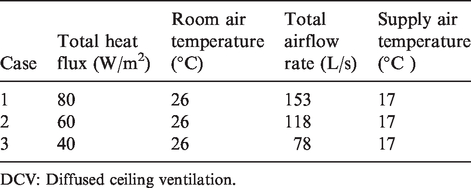
DCV: Diffused ceiling ventilation.
Test parameter of supply air and radiant panel with LVRP and heat gain levels (40, 60 and 80 W/m2).
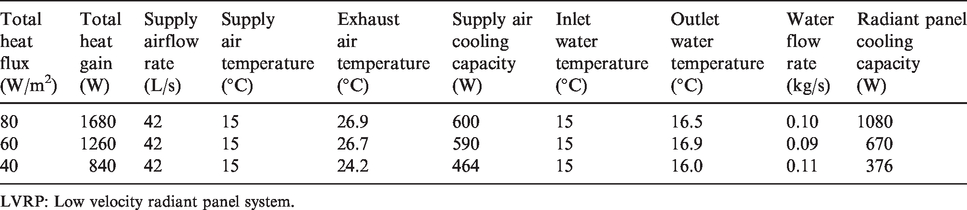
LVRP: Low velocity radiant panel system.
Evaluation indices
In the literature, several indices have been presented to evaluate air distribution, air quality and thermal comfort.68–70 In this study, the main focus was on micro-environment close to workstations, and thus local thermal comfort was evaluated.
The thermal comfort and indoor air quality of individually controlled microenvironment was evaluated with respect to the following aspects:
The air velocity and temperature at heights of 0.1 m (the ankle level), 0.6 m (the waist level), 1.1 m (the head level) and 1.7 m (the boundary of the occupied zone) were evaluated. Draught rate (DR) was used to evaluate the local discomfort. Draught is defined as an unwanted local cooling of the human body caused by air movement.
68
The DR was calculated based on the local air temperature, local mean air velocity and the turbulence intensity. The draught rate as is defined by the International Standard, EN ISO 7730:2005 is as given by equation (1)68

where
The turbulence intensity is defined by equation (2) as
3. Heat removal efficiency (HRE) is an index used to evaluate the effectiveness of heat removal
71
and it is calculated by equation (3)

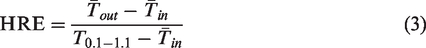
where 4. Indoor air quality was analysed by the concept of age of air introduced by Sandberg.
72
The age of air is defined as the time that has elapsed since the air entered the space through an opening. The air change efficiency is a measure of how quickly the air in a room is replaced compared to the theoretically fastest rate with the same ventilation airflow.
73
The air change efficiency (
The actual air change time 
So air change efficiency also is the ratio between 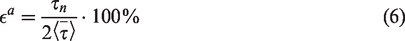
The local air change index,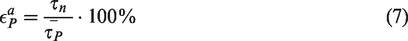
The mean age of the room air is calculated from the weighted area under the curve using equation (8)63
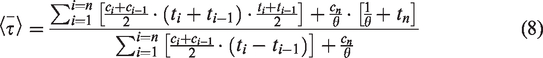
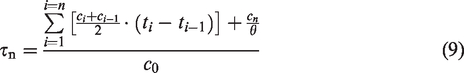
The nominal time constant is calculated by equation (9).
Results
System performance
Local supply with the LVRP system
Before the performance analysis of the micro-environment system, the throw pattern of the downward supplied low velocity units was tested with smoke visualization. The flow pattern of the local low velocity unit was visualized to guarantee that downward supply jet does not create too high air movement close to the work station. Figure 4(a) shows the air movement with a 10 L/s local air flow rate over the workstation. Smoke visualization indicates that the momentum flux of the jet was not strong enough to reach the dummy. When the local airflow rate was increased to 15 L/s, the airflow from the low velocity unit was just strong enough to reach the level of the top of dummy (Figure 4(b)). This smoke visualization confirmed that the airflow rate of 15 L/s could be used for local micro-environment control without increasing significantly the draught risk.
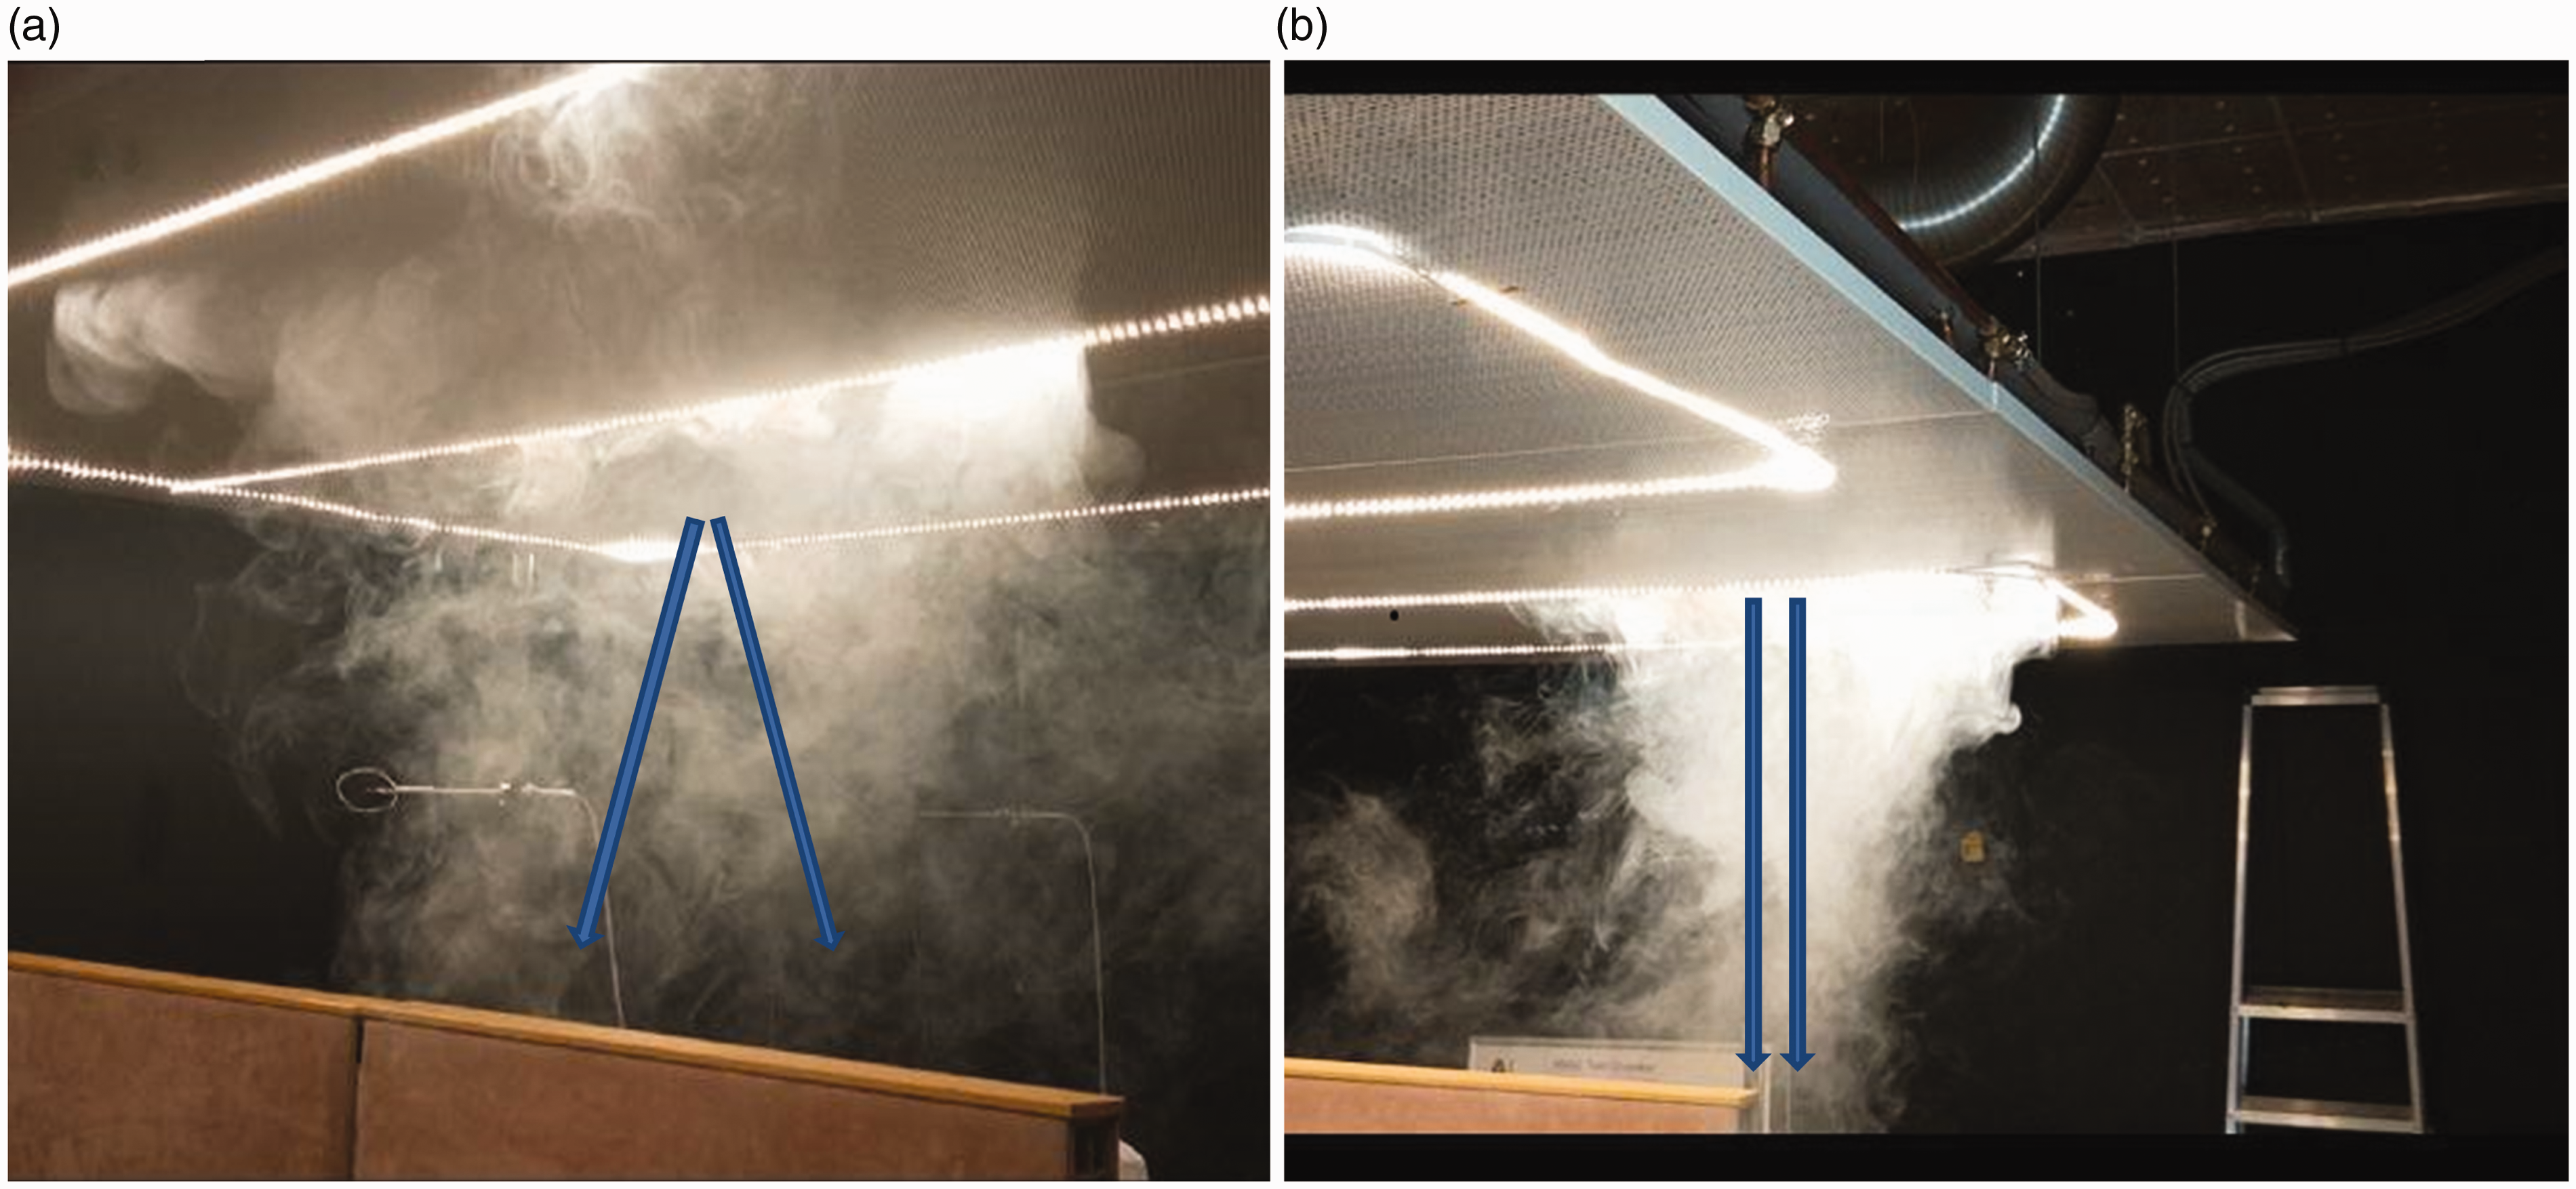
The smoke visualization of (a) the local air distribution with the airflow rate of 10 L/s and (b) the local air distribution with the airflow rate of 15 L/s. The blue arrows show the direction of the local airflow.
Perimeter exhaust
By utilizing perimeter exhaust over the window, the required cooling load would be reduced when a part of the convection load was directly directed to the exhaust grille. Figure 5(a) shows the principle of the perimeter exhaust system and how it captures partly the thermal plume of the warm window. Figure 5(b) shows the circulating airflow pattern visualized by smoke close to the perimeter exhaust. The capture efficiency of the exhaust located above the window is also enhanced by low velocity units that supply air downward over the workplace. The downward supplied cool air makes the thermal plume of the window stronger and increases the air movement toward the perimeter exhaust and thus enhances the exhaust performance. The airflow rate of the local LVRP and fully mixed DCV systems are quite different. In 60 W/m2 case, the total airflow rate was 118 L/s with DCV and 42 L/s with LVRP. With LVRP in the analysed cases, 20 L/s or 30 L/s was supplied downwards from low velocity units. On the contrary, the momentum flux of DCV is very low and the mixing is based on the convection flows.
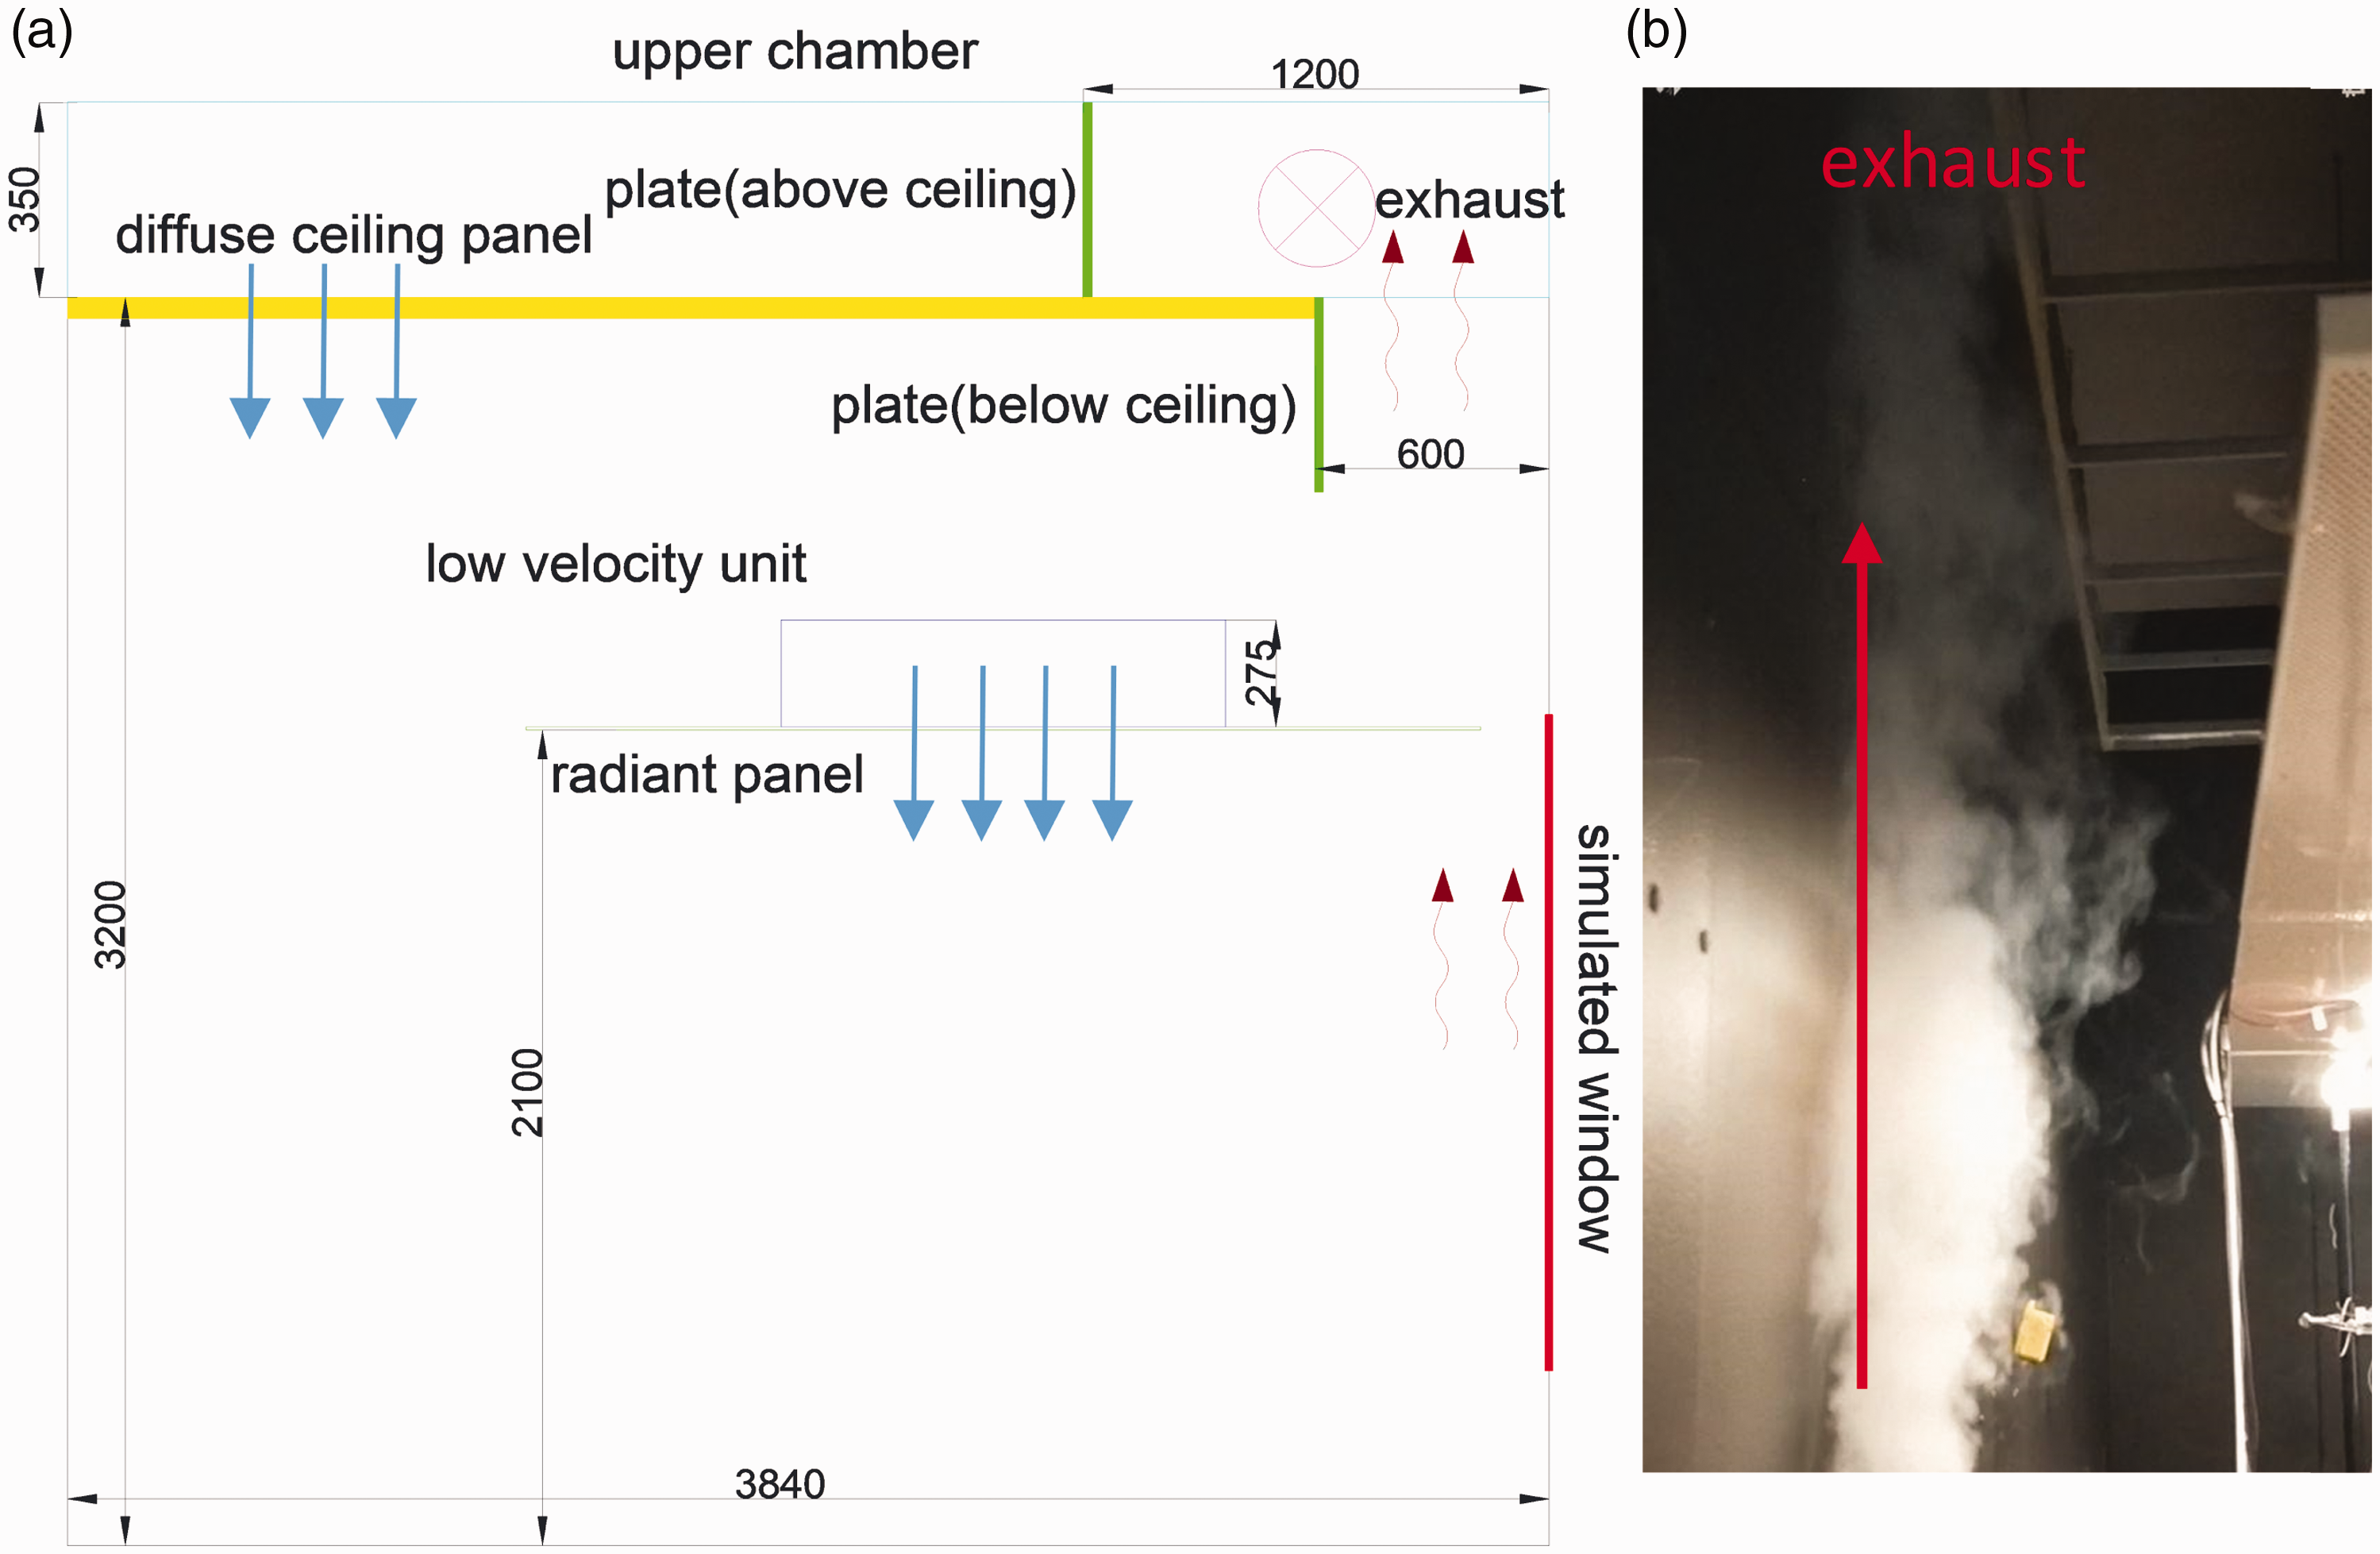
(a) The principle of the perimeter exhaust with LVRP system and (b) the smoke visualization of air movement at the perimeter exhaust.Note: Please refer to the online version of the article to view the figure in colour.
According to equation (3), Table 6 shows the heat removal efficiency (HRE) of LVRP and DCV systems. The heat removal efficiencies were 1.01 and 1.05 with DCV and a standard exhaust grille solution when heat gains were 60 W/m2 and 80 W/m2. This indicates that with DCV system, there was also a small temperature gradient between the occupied zone and exhaust point that improved the heat removal efficiency. With the perimeter exhaust and LVRP, the HREs were 1.05 and 1.11 with 10 L/s and 15 L/s at the heat gain of 60 W/m2, respectively. By increasing the heat gain to 80 W/m2, the HREs were improved to 1.08 and 1.13 with 10 L/s and 15 L/s, respectively. This indicates that both heat gain levels and local supply airflow rates have significant effect on the HRE. However, the effect of the local supply airflow rate over the workstation is stronger than the effect of the heat gain level.
The heat removal efficiency of perimeter exhaust with LVRP and DCV systems.
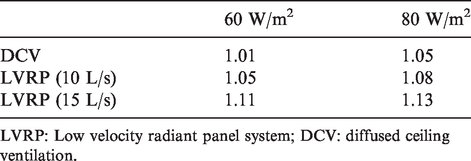
LVRP: Low velocity radiant panel system; DCV: diffused ceiling ventilation.
As expected, the thermal plume of the simulated window can partly remove directly by the perimeter exhaust without diluting it with room air. With this perimeter exhaust and a local supply airflow rate of 15 L/s, a reduction of 8–13% of the total cooling load is possible compared with the standard mixing system.
In measured cases, the window heat gain was 30% and 41% of total heat gains of 60 W/m2 and 80 W/m2. The perimeter exhaust was able to capture around 25% and 28% of the window heat gain in 60 W/m2 and 80 W/m2 cases. The average surface temperature of simulated window was 33.6°C and 37.2°C with 60 W/m2 and 80 W/m2 heat gains, respectively. Thus, the ratio of the convection load of simulated window was 43% and 56% in 60 W/m2 and 80 W/m2 heat gains. As a result, the perimeter exhaust was able to capture over 50% of the window convection heat gain.
Indoor air quality
Mean age of air
The mean age of air was compared in different cases which used the local low velocity radiant panels system (LVRP) or the diffuse ceiling ventilation (DVC) system. Figure 6 shows the distribution of the mean age of air at different measured zones: the simulated window side, the occupied side and the corridor side with LVRP and DVC system under three heat gain levels. With the heat gain of 40 W/m2 and local air flow rate of 10 L/s under the LVRP, the average mean age of air was 41.0 min at the occupied zone (P2–P4 in Figure 1(a)). That was smaller than in the window (43.6 min) and corridor (43.8 min) sides. This indicates that the local air supply has a clear effect on the mean age of air close to the workstation. The average mean age of air was 41.2 min at the window side and was increased to 47.1 min at the corridor side with the use of DCV and a heat gain of 40 W/m2. With the use of DCV and a heat gain of 40 W/m2, this indicates that the thermal plume at the window would dominate the air movement toward to the corridor side and the mean age of air in the corridor side is much longer than in the window side.
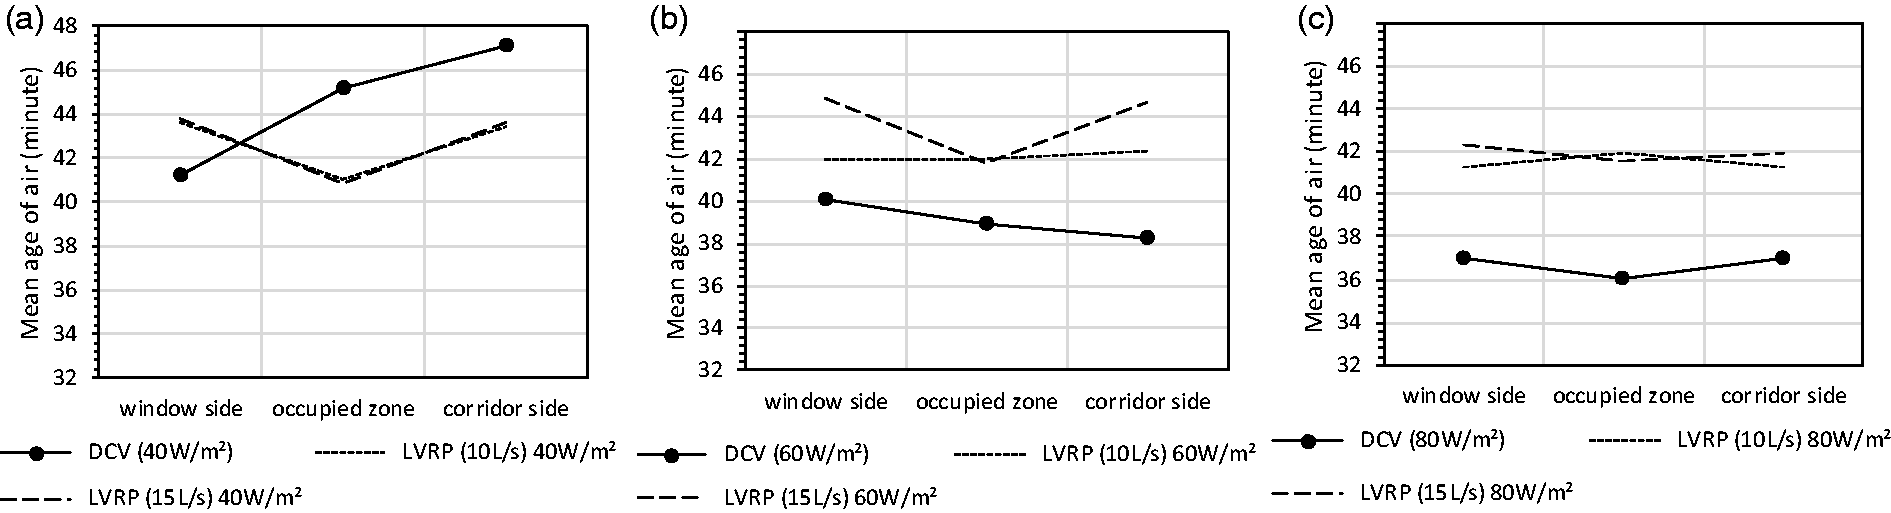
The distribution of the mean age of air under conditions of DCV and LVRP with heat gains of (a) 40 W/m2, (b) 60 W/m2 and (c) 80 W/m2.
When the heat gain was increased to 60 W/m2 and 80 W/m2, the mean age of air was longer with the use of LVRP (42.3 min) than with the use of DCV (37.9 min). The reason for this was that the total airflow rate of DCV was increased from 78 L/s (40 W/m2) to 153 L/s (80 W/m2) which significantly increased the age of air in the whole room space. With the use of DCV and a heat gain of 60 W/m2, the increased simulated solar load on the floor would change the air movement pattern and the mean age of air would be shorter in the corridor side than in the window side. With a heat gain of 80 W/m2 under the DCV condition, the mean age of air was almost the same at all locations, indicating effective mixing over the whole room space.
Under the condition of LVRP, the average mean age of air at the occupied zone was the same (42.0 min) with heat gains of 60 W/m2 and 80 W/m2 when the airflow rate supplied to the workstation was 10 L/s. The mean age of air at workstation did not change when the airflow rate was increased from 10 L/s to 15 L/s with heat gains of 60 W/m2 and 80 W/m2. Under the condition of LVRP and a heat gain of 60 W/m2, the mean age of air was almost the same at all locations with 10 L/s. The higher airflow rate (15 L/s) had a shorter mean age of air at the workstation than on other sides. When the heat gain was increased to 80 W/m2, the mean age of air was quite similar in all zones with both airflow rates. This indicates that by increasing the local supply airflow rate over the workstation is not possible to reduce the mean age of air. The combination of thermal plumes and jets is quite complex especially with high heat gain levels and flow structure can change if one flow element changes.
Local air change index
Figure 7 shows the distribution of local air change index in different measured zones under LVRP and DCV systems with three heat gain levels, as defined in equation (7). As expected, the trend of local air change index was adverse to the mean age of air. With the heat gain of 80 W/m2, the average local air change index under the condition of LVRP were 140% and 151% in the occupied zone (P2–P4) with a local airflow rate of 10 L/s and of 15 L/s, respectively. However, the corresponding value of DCV was 101%. Therefore, the LVRP would create a faster air replacement in the micro-environment than DCV. Moreover, when the local airflow rate was increased from 10 L/s to 15 L/s, the local air change index was increased in the occupied zone and was reduced at the window side and corridor side. In that case, more airflow was supplied to the occupied zone and less was supplied to other zones. This indicates that the LVRP can create slightly a better local indoor air quality in the occupied zone than outside of it.
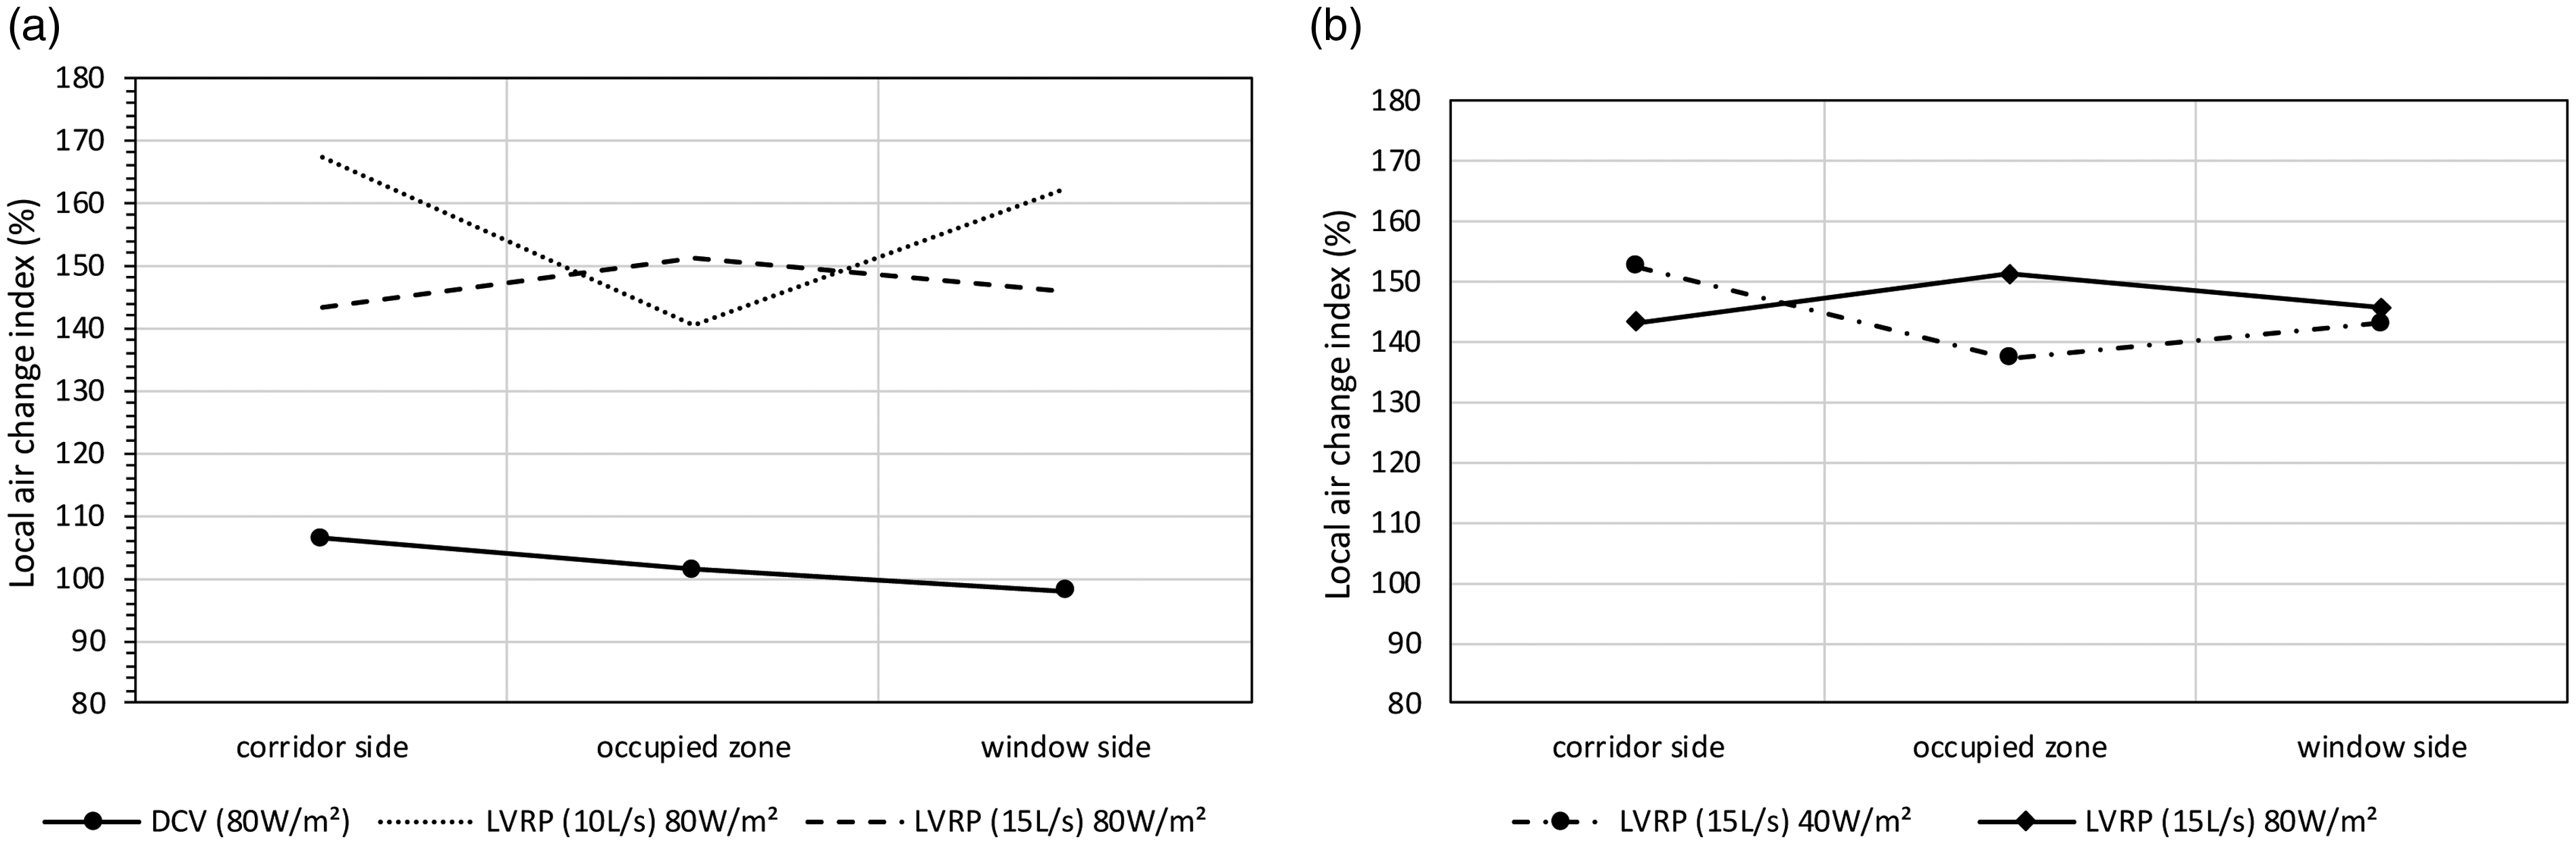
The distribution of the local air change index (a) under the condition of LVRP and DCV with a heat gain of 80 W/m2 and (b) with different heat gains under LVRP system.
The effect of the heat gain on the local air change index under the LVRP system was shown in Figure 7(b). With the heat gain of 40 W/m2, the local air change index was slightly lower in the occupied zone than with a heat gain of 80 W/m2. Therefore, the higher convection flow with a heat gain of 80 W/m2 could accelerate the air change at the side of the occupied zone.
Air change efficiency
Figure 8 shows the air change efficiency under DCV and LVRP systems with three different heat gain levels (see equation (6)). The air change efficiency under the condition of LVRP was between 70% and 80% with different conditions being higher than when under the DCV (44–49%). Thus, the performance of the LVRP system was much better than with the fully mixing ventilation which has an air change efficiency of 50%. This indicates that the LVRP system can achieve a higher ventilation effectiveness even with a lower airflow rate (42 L/s) as compared to the DCV system (78–153 L/s). The reason was that the smaller airflow rate of LVRP would cause a longer nominal age of air. Therefore, the air change efficiency was much higher under the LVRP according to the calculation of equation (6) while the mean age of air was similar under conditions of LVRP and DCV.
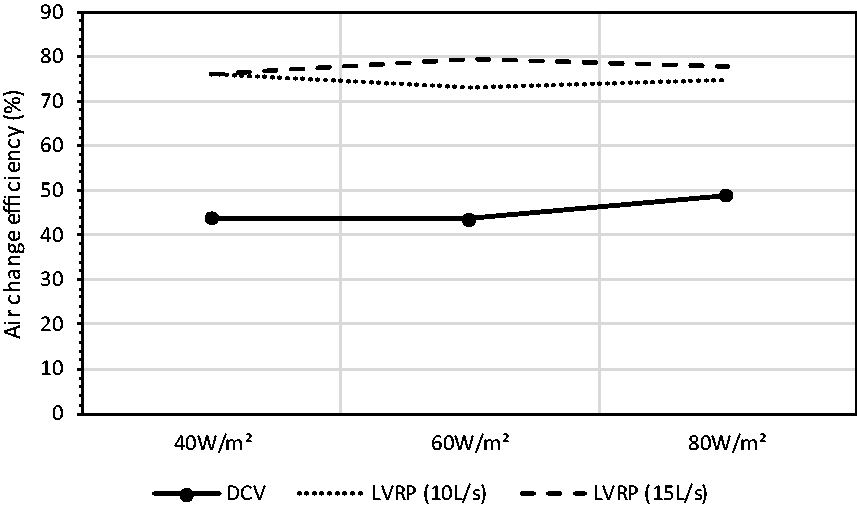
Air change efficiency under DCV and LVRP systems.
The air change efficiency under LVRP was more than 50%. The reason for the higher air change efficiency than the standard mixing ventilation was that the airflow pattern created by the low velocity unit around the workstation was some kind of displacement type flow which produce a performance that was between those of the fully mixed flow and ideal piston flow. Therefore, the air distribution of the LVRP system is much closer to the displacement system. Compared to the traditional mixing ventilation, the local diffuser installed above the workstation would release the fresh air more directly to the breathing zone. As a result, less contaminant can mix with the fresh supply air before the breading zone which may enhance the perception of air quality.
Thermal comfort
Average thermal conditions and vertical temperature gradient
Table 7 summarizes the operative temperature, air temperature and mean radiant temperature at the reference location (P3 at a height of 1.1 m) and the exhaust air temperature of under the LVRP system. Thermal conditions were very similar in all these tested cases. With higher airflow rate through the radiant panel (from 10 L/s to 15 L/s), the difference between the room air and operative temperature was slightly bigger. However, the operative temperature near the workstation was only 0.05–0.11°C lower than the room air temperature. The average temperature difference between the exhaust air and room air at the reference point was rather significant (from 0.7°C to 1.9°C), especially with a higher local airflow rate. Also, this difference was bigger with a higher heat gain level. Therefore, the LVRP system can enhance the thermal comfort by creating a local micro-environment at the workstation level.
The average thermal condition with different heat gains under the LVRP.
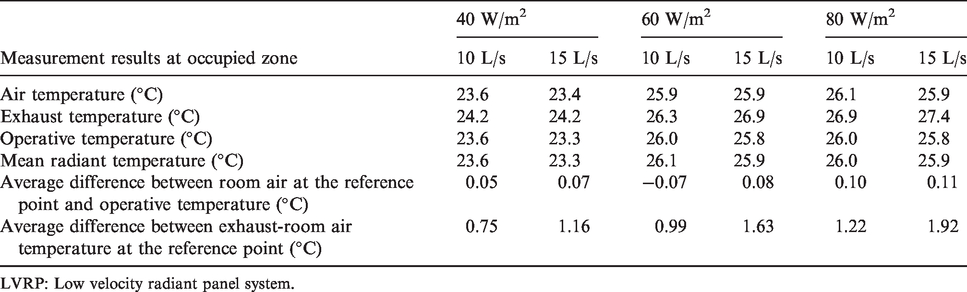
LVRP: Low velocity radiant panel system.
Figure 9 shows the vertical distribution of mean room air temperatures in the occupied zone (P2–P4) under the condition of LVRP and with different heat gain levels. With the heat gain of 40 W/m2 in Figure 9(a), at vertical level located at 1.7 m, the lowest temperatures with both airflow rates of 10 L/s and 15 L/s were 23.5°C and 23°C, respectively, due to the air was supplied directly downwards above the workstation. When the heat gain was increased to 60 W/m2 and 80 W/m2 in Figure 9(b), the lowest temperature was at 0.6 m with the local airflow rate of 10 L/s. This was due to the added heat gain by the floor, which changed the vertical air temperature profile with heat gains of 60 W/m2 and 80 W/m2. The air temperature difference between 0.1 m and 1.1 m was less than 0.2°C in all measured cases under the condition of LVRP. The highest temperature at vertical level was at 1.1 m with 40 W/m2 heat gain and 0.1 m with both heat gains of 60 W/m2 and 80 W/m2. This indicates clearly the effect of the heat gain strength and location on the vertical temperature gradient. Especially the simulated solar heat gain on the window and the floor, which has a significant effect on the air movement in the room space.
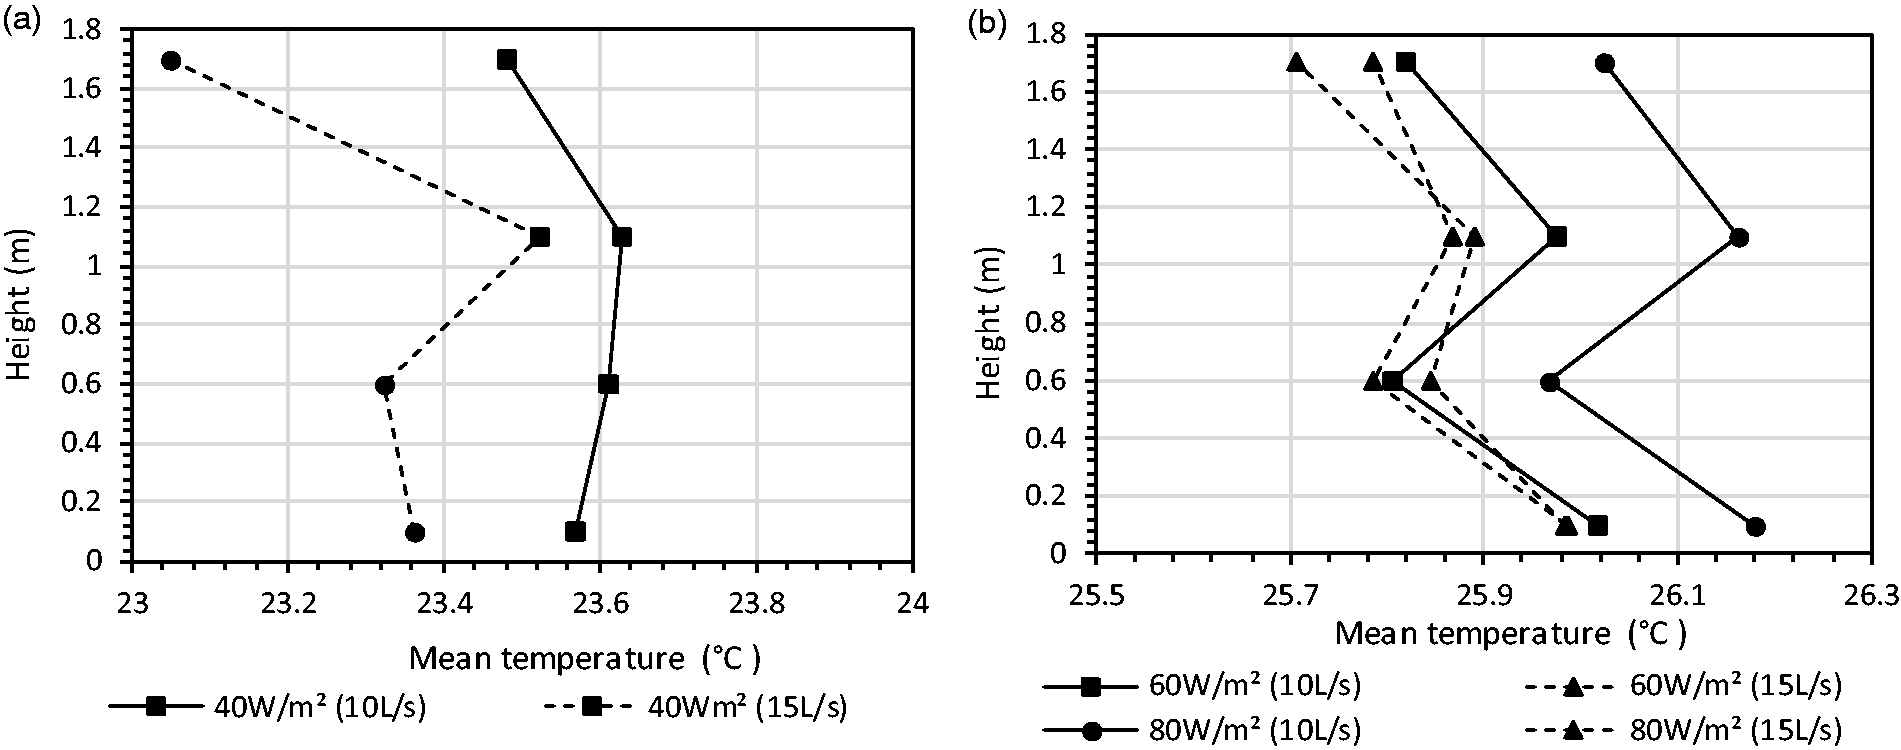
The vertical gradient of the mean room air temperature in the occupied zone (P2−P4) under the condition of LVRP with heat gains of (a) 40 W/m2 and (b) 60 W/m2 and 80 W/m2.
The reference temperature at 1.1 m level was set to 26°C at P3 under the condition of LVRP system and 26°C at the exhaust under DCV. The actual temperature was slightly varied by 0.5°C between the different measured locations of the occupied zone (P2–P4) under the condition of LVRP and by 0.1°C in the DCV case. Thus, by moving the sensor only couple of centimetres, the room air temperature could be slightly different.
The vertical air temperature gradient was slightly different under LVRP and DCV systems. Figure 10 shows the comparison of the vertical temperature gradient between LVRP system (P2–P4) (Figure 1(a)) and DCV system (P9 and P10) in the occupied zone (Figure 1(b)). Under the condition of DCV, the room air temperatures were highest at 1.1 m level in the occupied zone while under the LVRP, the warmest locations were at the floor level. However, temperature differences between different heights were not significant.
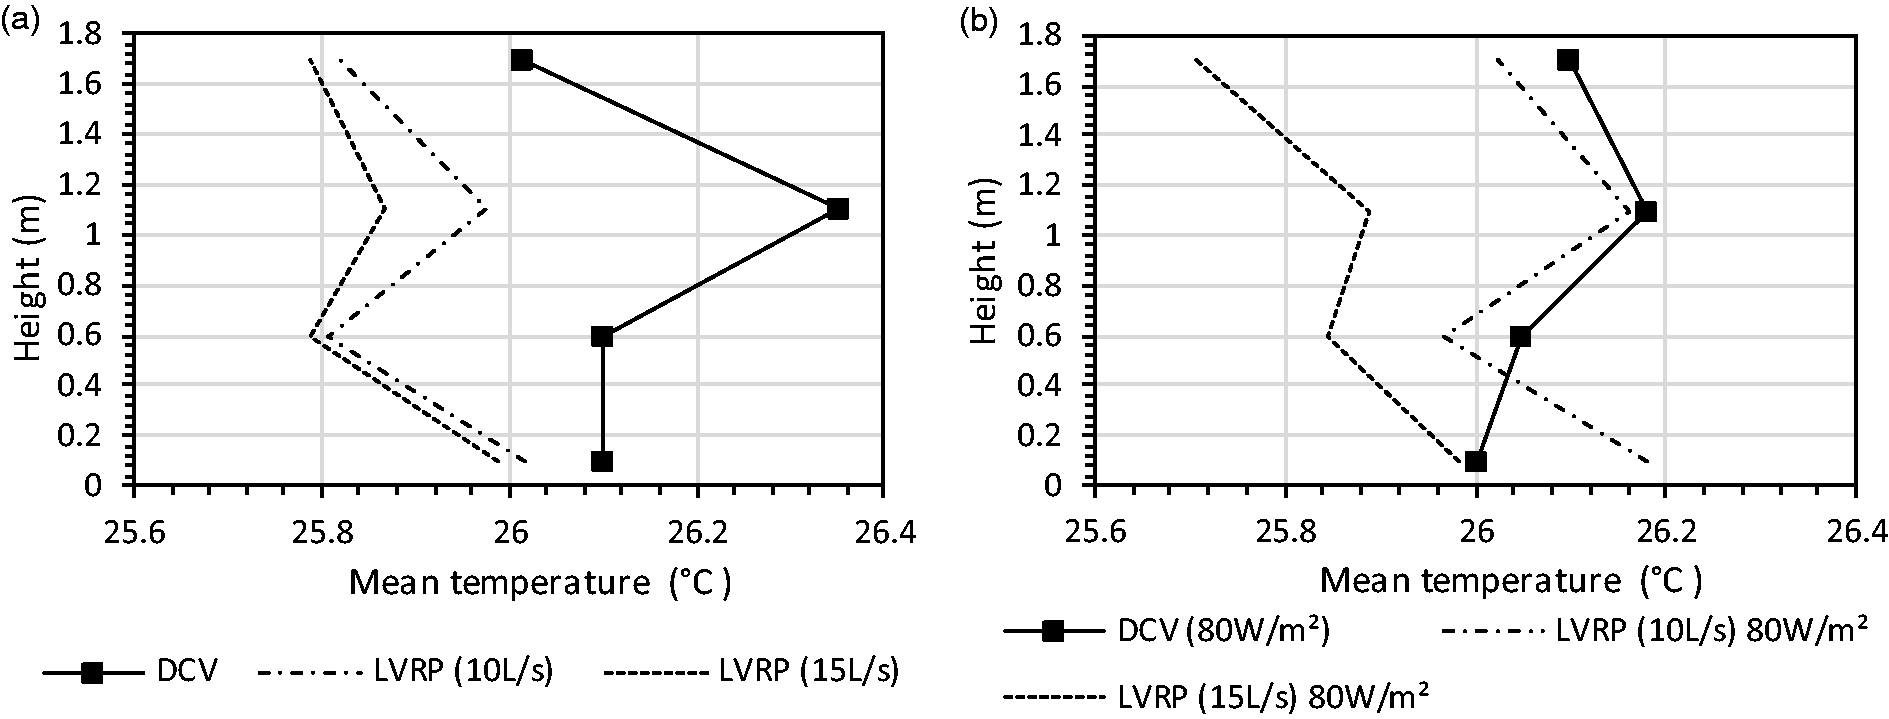
The vertical temperature gradient under the low velocity radiant panel (LVRP) system (locations P2–P4) and diffuse ceiling ventilation (DCV) (locations P9 and P10) with heat gains of (a) 60 W/m2 and (b) 80 W/m2.
The effect of the convection was evaluated by analysing the horizontal temperature gradient. Figure 11 shows the horizontal temperature gradients from the corridor side (P5–P8) to window side (P15–P18) with the heat gain levels of 60 W/m2 and 80 W/m2 under conditions of LVRP and DCV systems. Under DCV where the airflow rate was evenly supplied through the ceiling, the temperature at 1.1 m was increased gradually from the corridor side to the window side due to the asymmetric heat gain distribution (Figure 2). The horizontal temperature differences were 0.8°C and 0.7°C with heat gains of 60 W/m2 and 80 W/m2. The horizontal temperature distribution was different under the LVRP system and the coldest point was in the occupied zone if the local flow rate was 15 L/s. With a local flow rate of 15 L/s, the mean air temperature in the occupied zone (25.7°C) was slightly lower than the window side (26.1°C) and the corridor side (25.8°C) with a heat gain of 60 W/m2. Compared with the condition under the DCV, the mean temperature in the occupied zone was 0.6°C smaller than under the LVRP system. With 80 W/m2 heat gain level, the thermal plume of the simulated solar load was stronger and the coldest point moved to the corridor side. With the heat gain of 80 W/m2, the room air temperature difference between the LVRP and DCV system was smaller, because the higher heat gain of computers and warmer window panels were mixed in the room air condition.
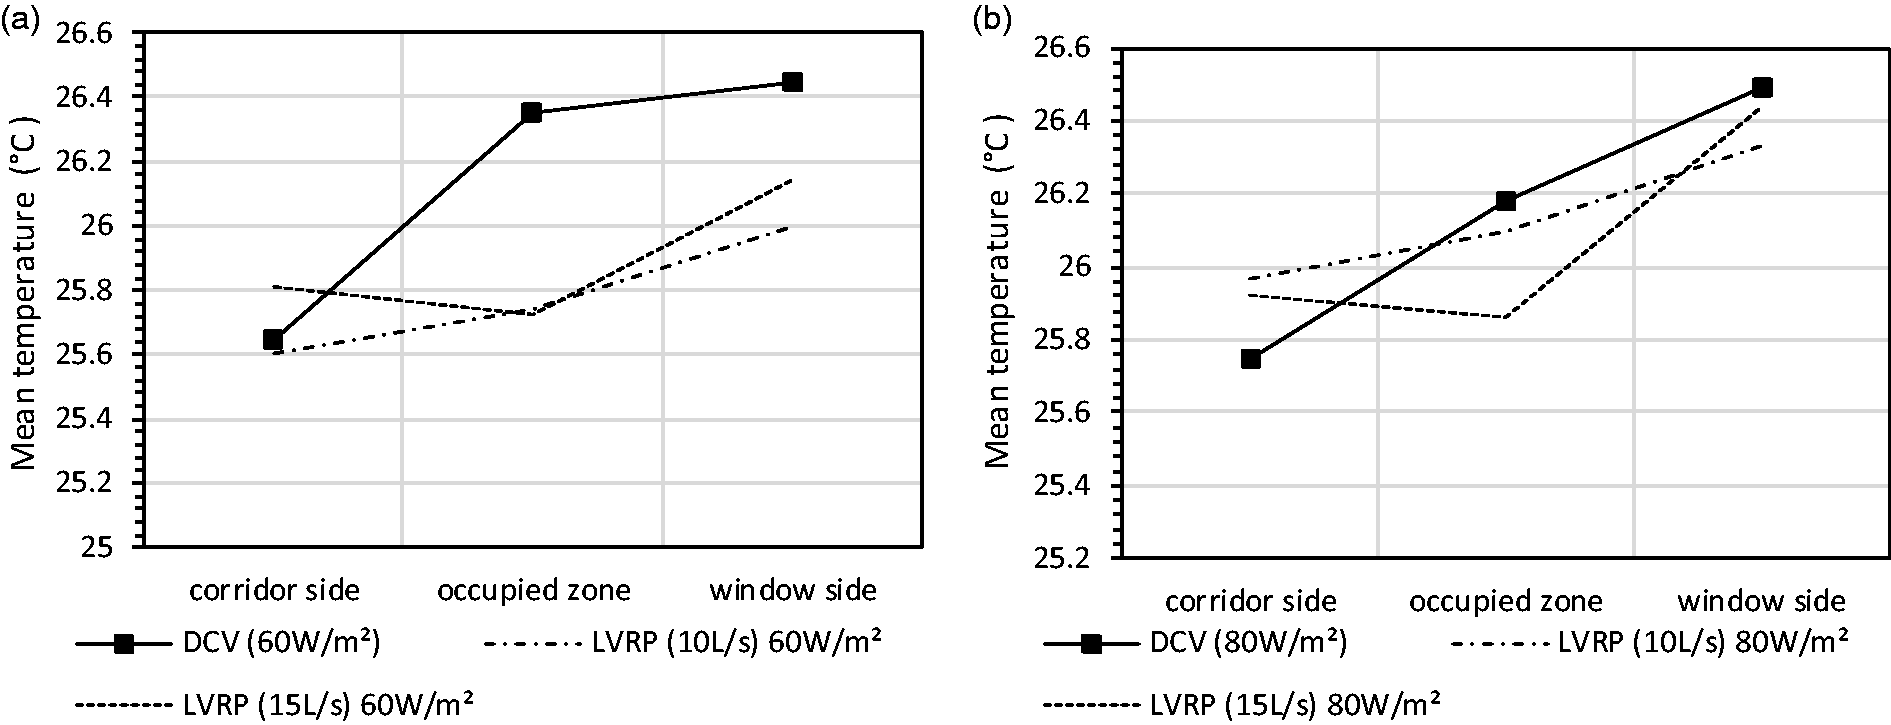
The horizontal distribution of the mean temperature under the condition of DCV and LVRP with heat gains of (a) 60 W/m2 and (b) 80 W/m2.
As a summary, under the condition of LVRP, the local airflow rate with a smaller total air flow rate of 42 L/s, the panel cooling is possible to create a cold area close to the workstation if the heat gain level is <60 W/m2. With the higher heat gain levels, the supply airflow rate would be higher from the local supply unit to create a local micro-environment. Increasing the supply airflow rate would increase the risk of draught.
Velocity profile
Figure 12 shows the vertical distributions of the mean air velocity near the workstations with LVRP (average value of the points P2–P4) and DCV (average value of the points P9 and P10) systems. In general, the air velocities were quite low. The mean velocity with LVRP from the height 0.1 m to 1.1 m was 0.08 m/s with both 40 W/m2 (10 L/s) and 40 W/m2 (15 L/s) cases in Figure 12(a). The value was lower than that with DCV (0.11 m/s). When the heat gain was increased to 80 W/m2, the corresponding mean velocities were 0.11 m/s, 0.12 m/s and 0.14 m/s with LVRP (10 L/s), LVRP (15 L/s) and DCV, respectively. This indicates that downward supply did not cause high air velocities close to work stations and nor increase significantly draught risk.
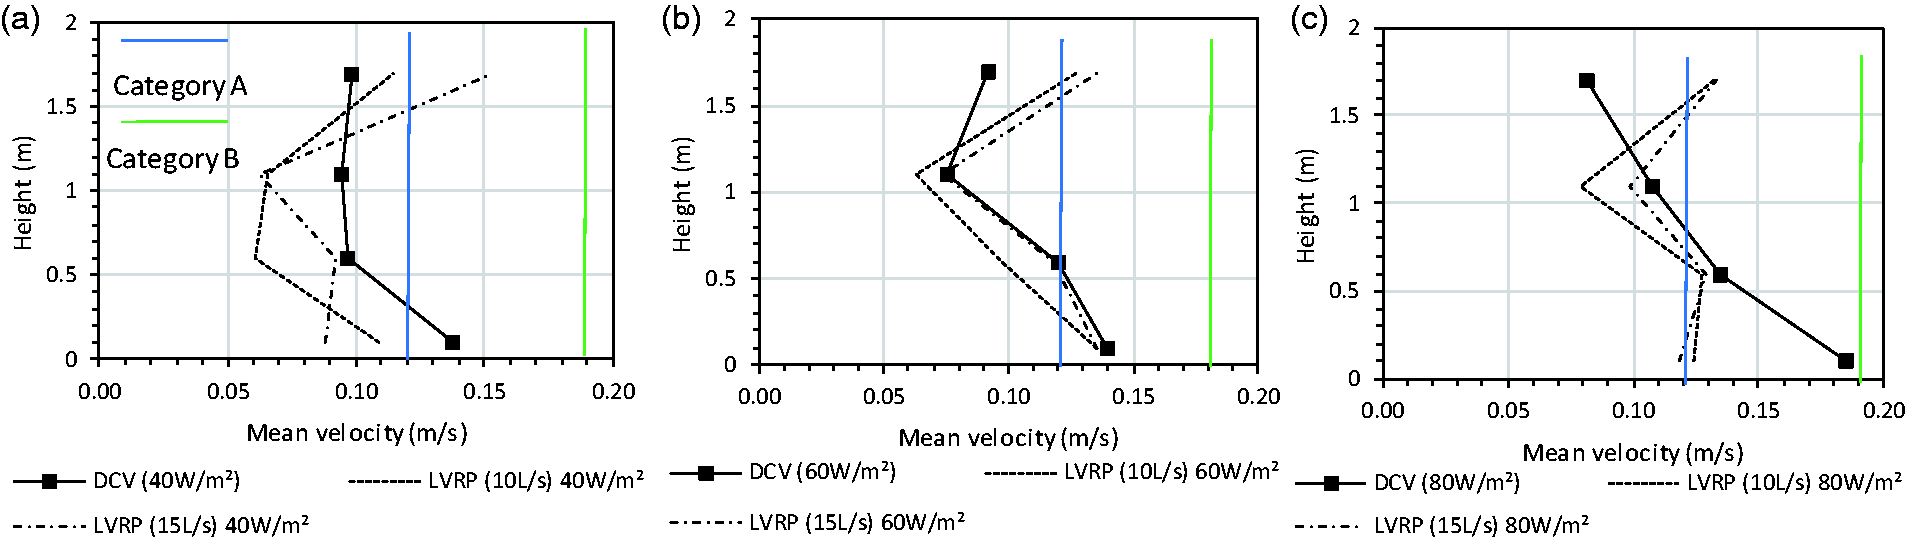
The vertical distribution of the mean air velocity in the occupied zone with heat gains of (a) 40 W/m2, (b) 60 W/m2 and (c) 80 W/m2.
According to the International Standard EN ISO 7730:2005, 68 the mean air velocities were able to meet the category A requirement, with a heat gain of 40 W/m2 under conditions of LVRP (10 L/s) and DCV. In all other case, the air velocity would meet the category B requirement. When the heat gain was 60 W/m2 or 80 W/m2, the highest velocity was located at the ankle level (0.1 m). The reason for that was the return flow at the floor level was created by high thermal plumes.
Figure 13 shows the distribution of the mean air velocity from the window side to the corridor side with three heat gain levels. Under LVRP and DCV conditions, the highest air velocity was measured at different locations. Under the DCV, the highest air velocity was always measured in the corridor. However, under the LVRP system, the highest air velocity was measured in the occupied or the window zones. The mean velocities were lower under the LVRP system compared to the DCV system. With a heat gain of 40 W/m2, the mean velocities were 0.08 m/s and 0.11 m/s, respectively, in the occupied zone under the LVRP system (15 L/s) and DCV. The corresponding values were 0.12 m/s and 0.14 m/s with the heat gain of 80 W/m2.
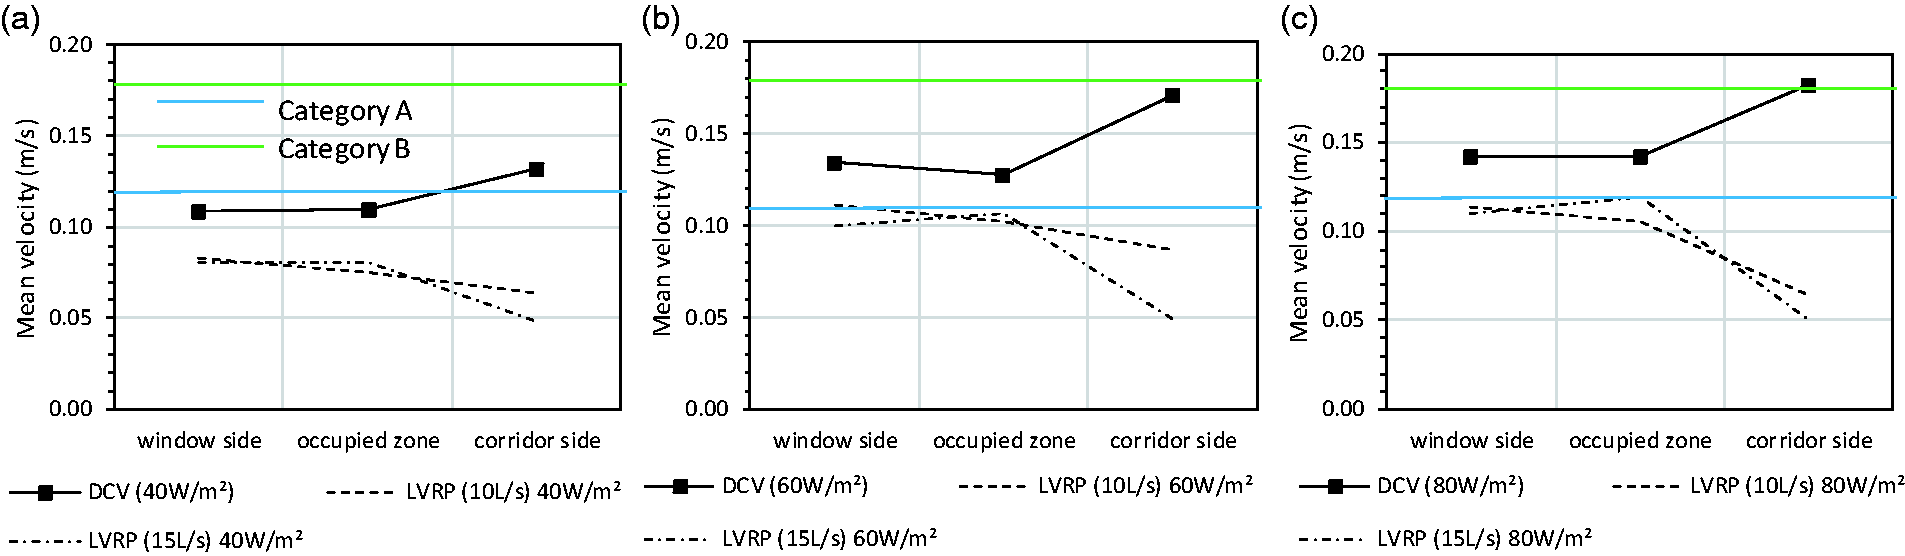
The horizontal distribution of the mean velocity under the DCV and LVRP system with heat gains of (a) 40 W/m2, (b) 60 W/m2 and (c) 80 W/m2.
Figure 14 shows the standard deviation (Std.) of the air velocity at vertical direction with three heat gains. The Std. was lower under the LVRP system than with DCV at heights between 0.1 and 1.1 m in the occupied zone. Under the DCV, the return flow level increased the standard deviation at the floor level. Under the LVRP system, the higher local airflow rate (15 L/s) increased the standard deviation compared to the lower airflow rate (10 L/s). When the airflow supplied to each workstation was increased from 10 L/s to 15 L/s, the Std. was increased by 15% and 9% with the heat gains of 40 W/m2 and 80 W/m2, respectively.
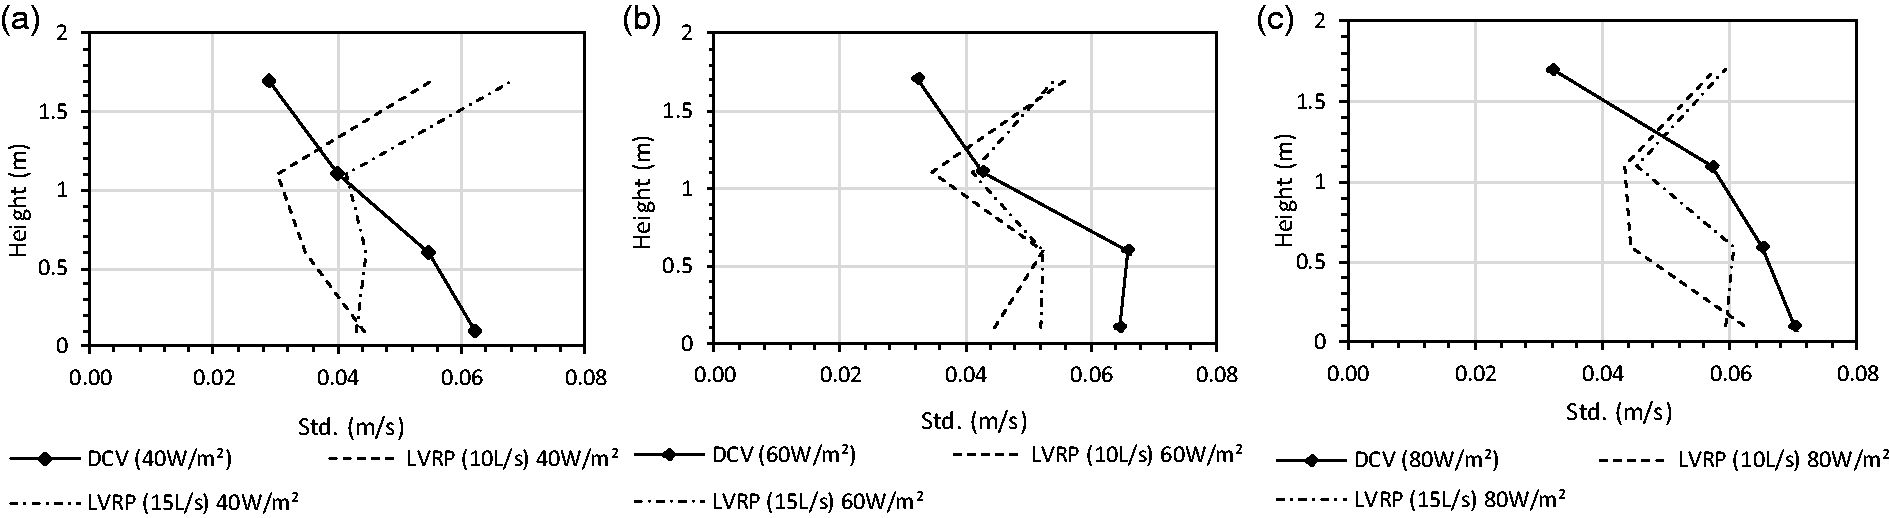
The vertical distribution of standard deviation at occupied zone with diffuse ceiling ventilation (DCV) and ceiling integrated microenvironment low velocity radiant panel system (LVRP) with heat gains of (a) 40 W/m2, (b) 60 W/m2 and (c) 80 W/m2.
Figure 15 shows the Std. of the air velocity distribution from the window side to the corridor side under the LVRP and DCV system. The Std. of air velocity was increased from the window side to the corridor side under the DCV with all three heat gains. Under the LVRP system, the Std. of air velocity was highest in the occupied zone in all cases. The average Std. was 0.03 m/s under the LVRP system (10 L/s) and was increased to 0.05 m/s (30%) under the DCV system when the heat gain was 40 W/m2. The corresponding difference was 35% with the heat gain of 80 W/m2.
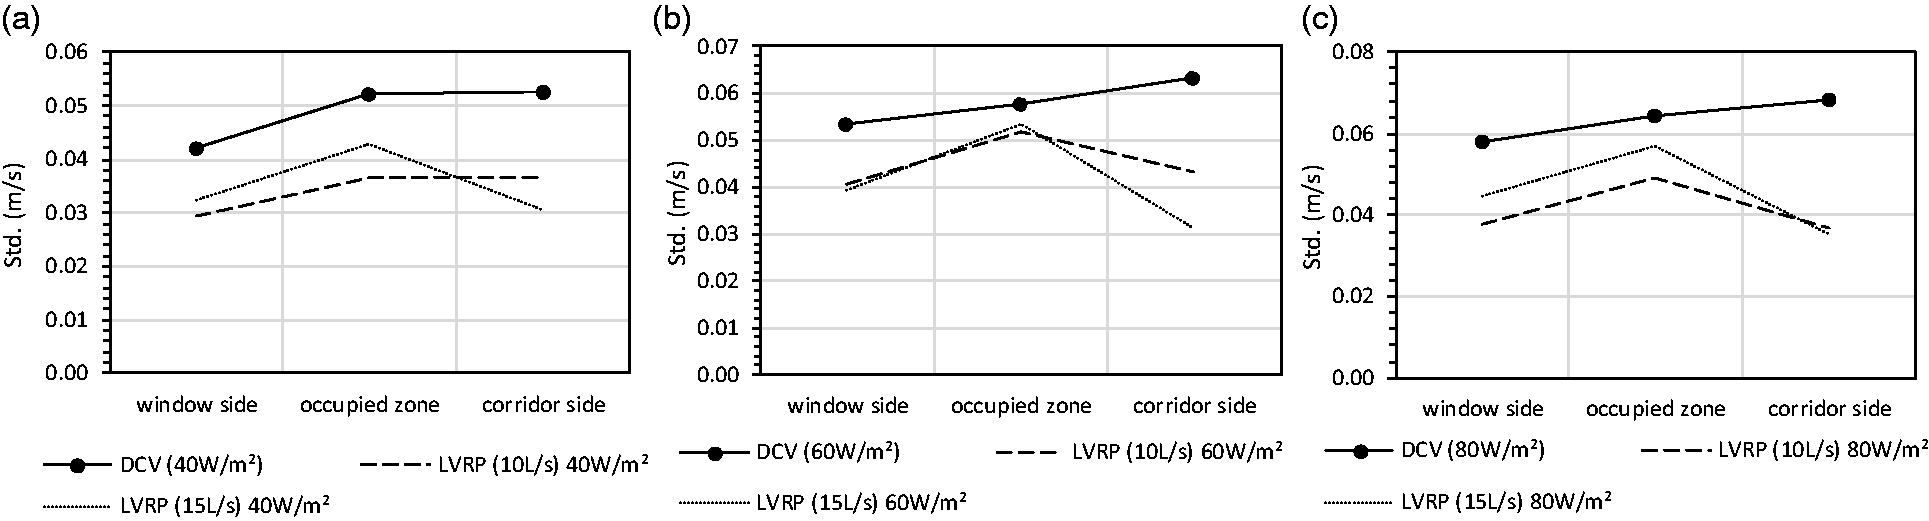
The horizontal distribution of standard deviation under the DCV and LVRP system with heat gains of (a) 40 W/m2, (b) 60 W/m2 and (c) 80 W/m2.
Draught rate
Figure 16 shows the vertical distribution of draught rate in the occupied zone with different heat gains and airflow rates. In all cases, the draught risk was quite small. Figure 16(a) shows that the average draught rate was 5.8% and 7.0% under the LVRP and DCV system from 0.1 m to 1.1 m with a heat gain of 40 W/m2. Figure 16(b) shows that the corresponding draught rates were 7% and 10% under LVRP and DCV with the heat gain of 80 W/m2, respectively. Especially, the draught rate at ankle level (0.1 m) was slightly lower under the LVRP than DCV system. Therefore, the low velocity unit that supplies outdoor air directly to workstation can keep the local thermal discomfort at low level. Under the LVRP system, the average draught rate was quite similar with local flow rate of 10 L/s and 15 L/s with a heat gain of 40 W/m2. When the heat gain was increased to 80 W/m2, the relative difference of draught rate was 15% when the local flow rate was increased from 10 L/s to 15 L/s.
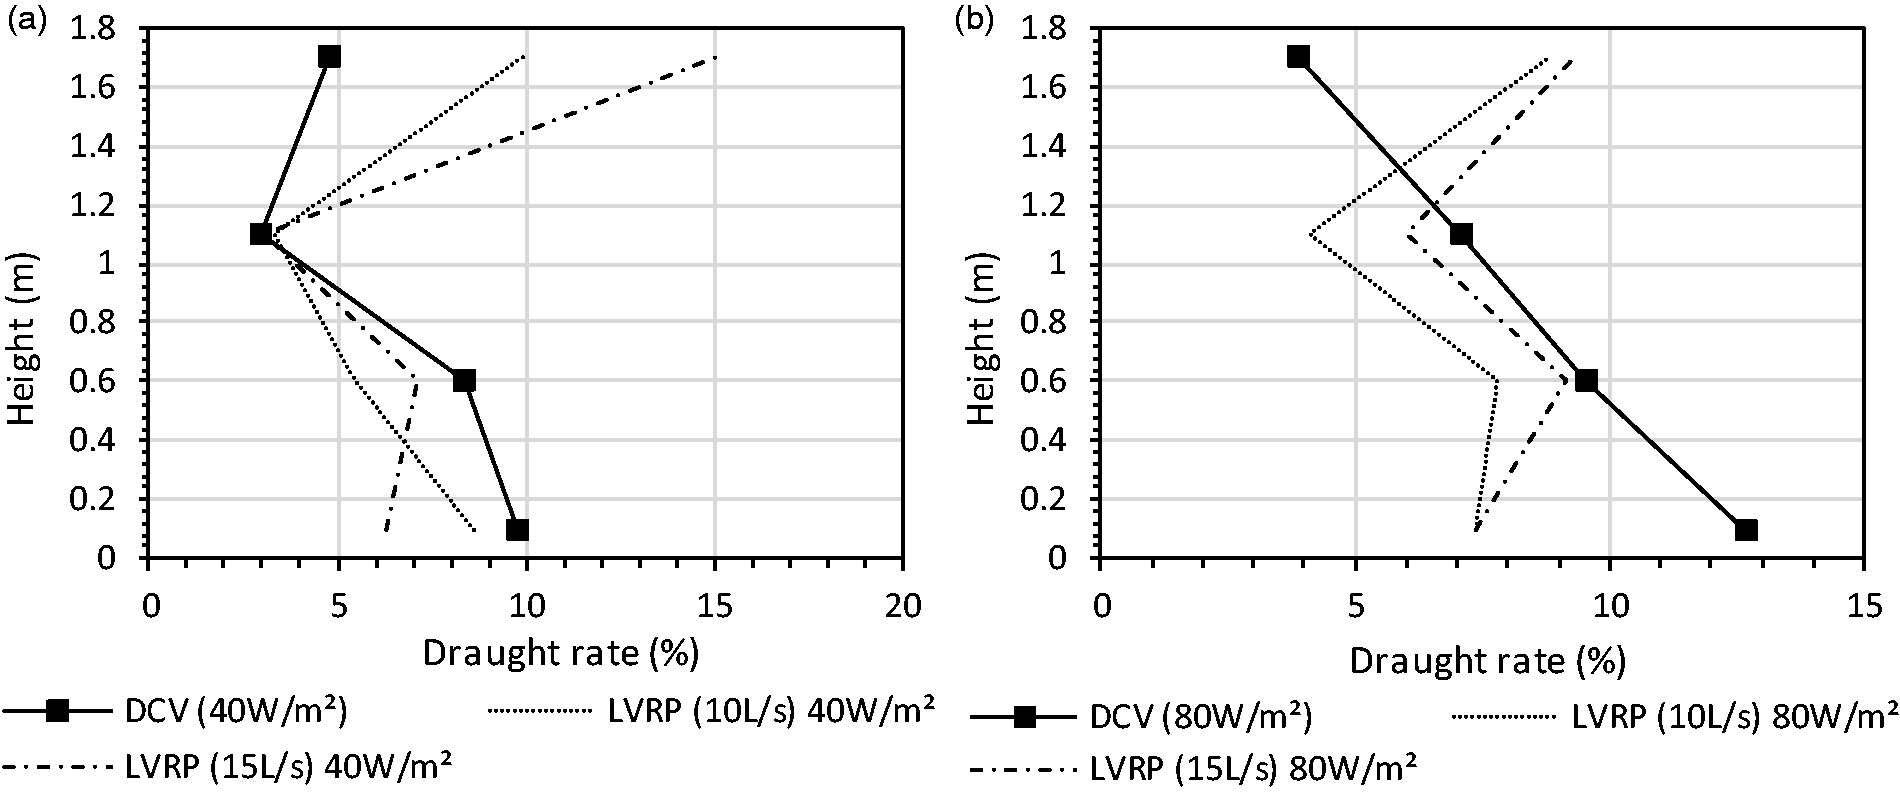
The vertical distribution of draught rate in the occupied zone under the DCV and LVRP system with heat gains of (a) 40 W/m2 and (b) 80 W/m2.
Discussion
The air distribution is dominated by jets or convection flows. The driven force of diffuse ceiling ventilation (DCV) is buoyancy flow from the heat source. Therefore, the asymmetric heat gain distribution would generate a large-scale circulating airflow pattern from the window side to the opposite corridor side along to the ceiling zone. Compared with DCV, the higher concentrated momentum force from the local diffuser of the LVRP system can bring the outdoor air to the breathing zone directly and would create the micro-environment around workstations.
In this study, the location of the diffuser was still relatively far from the breathing zone (above 2.1 m). This means that the entrainment of the supply air with room air would lead to the situation that the indoor air quality is no longer as good as outdoor air. Still, the use of LVRP system can enhance the indoor air quality compared to the standard mixing system. This is because the airflow pattern from the diffuser could be classified as displacement flow. So this flow can displace the contaminant air with the fresh air. To attain a better air quality, the supply units should be closer to the occupant. However in practical point of view, the supply unit cannot be at a much lower level in the ceiling mounded installation concept.
Also with the localized system, local thermal comfort would be enhanced compared to the DCV. Under the LVRP system, the airflow rate is supplied directly downwards to the workstation, but still the air movement does not increase the local draught risk. Due to the local diffuser and radiant panel are above the workstation, the local indoor climate can be controlled locally, thereby reducing the energy consumption while simultaneously improving the level of indoor air quality.
Under the LVRP system, 0.8–1.9°C lower room air temperature than in the exhaust could be created. This would provide a clear benefit compared with fully mixing ventilation, e.g. diffuse ceiling ventilation. So, this system could achieve a higher capture efficiency locally with a lower airflow rate. The localized chilled beam coupled with chilled ceiling was investigated by generating uniform thermal conditions (differences smaller than 1°C). 74 The use of the LVRP system has a higher potential than the previous concept to reduce cooling power required. From the energy saving prospective in commercial buildings where occupants spend most of their active time, a local environment created by the LVRP system should have more practical usage.
Under the commonly used mixing ventilation (DCV, chilled beams and VAV), there always exists significant horizontal temperature gradient between the window and corridor area. However, with the localized micro-environment system, this temperature gradient is compartively smaller. This means in practice that even the main objective of the localized micro-environment system is to maintain the indoor condition close to the workstation, and therefore the temperature difference between the perimeter and internal areas could be reduced.
In the convective type of localized systems, personalized ventilation in conjunction with mixing ventilation or displacement ventilation would provide a higher thermal comfort and a better perceived air quality compared with that could be provided by the total volume system. 30 According to the EN ISO 7730:2005, 68 how the increased air movement could enhance thermal comfort, e.g. by using desk fans is prescribed. Under the summer conditions, the temperature could be increased by around 2–4°C above the level allowed for comfort. The use of the localized radiant cooling system would only produce a minor effect on the thermal sensation. In this study, the difference between the air temperature and the operative temperature was small (less than 0.1°C). This finding also agreed with the performance of the radiant panel system combined with linear slot diffuser and radial multi-nozzle diffuser. 28 Under the localized radiant cooling combined with low velocity unit, the biggest benefit is due to the temperature difference between the workstation and exhaust air.
The localized radiant cooling would provide other benefits. It can increase the perceived air quality (PAQ) acceptability by decreasing the convective flow of human body and thus increasing the air quality close to the breathing zone. However, this improvement is not as much as convective cooling achieved by raising the air velocity. 75
Mixing ventilation systems coupled with radiant ceiling panels was able to maintain a suitable thermal comfort in the indoor environment, especially with high thermal loads. 76 By providing localized convective and radiant cooling, such as by the LVRP system, the thermal perception of occupants could be enhanced. The most suitable application of the LVRP is in offices. However, the maximum specified cooling demand is 80 W/m2. With higher cooling demands, the area of radiant panel should be increased. Based on our results, the local supply air flow rate should be 10–15 L/s. If the local air flow rate is higher, the personalized control should be introduced where users can adjust airflow rate based on their thermal preference.
The system in the present study may be somewhat limited by the layout of the ventilated room, due to the height and size of radiant panel installation. In order to be effective, this method would need careful consideration of the type and location of the room supply diffuser and workstation in relation to the room geometry. Also, the flexibility of layout changes should be considered in the design process. In common with all room systems, for example, the VAV, the chilled beam and radiant ceiling, the desk integrated personalized ventilation (PV) has similar challenge of certain limitations for layout changes when office layout is changed. To improve flexibility of the LVRP system, novel pipe and duct connections should be developed to make the layout changes easier and thus reduce the cost of retrofitting.
Conclusion
The main objective of this paper was to compare the performance of the concept of a local low velocity radiant panel system (LVRP) with a diffuse ceiling ventilation system (DCV) by experimental studies. The indoor air quality, thermal comfort and airflow characteristics were compared in both vertical and horizontal levels near workstations and unoccupied zone with same heat gains in a test chamber.
The capture efficiency of exhaust grill was higher than the one combined with the LVRP system. Also, the perimeter exhaust could capture 10–22% of the thermal load of the simulated window. Therefore, the perimeter exhaust could diminish the effect of the buoyancy flow caused by the heated window, which lead to more acceptable thermal conditions at the workstation. The results show that the mean age of air was smaller under the LVRP than when using the DCV under low heat gain. The air change efficiency of using the LVRP system was more than 70% while it was nearly 50% when using the DCV. Hence, the airflow pattern from the low velocity unit was displacement flow. This was due to the local diffuser that was installed above the workstation, which releases fresh air more directly to breathing zone in comparison to the traditional mixing ventilation. The results show that the vertical temperature gradient in the occupied zone under the LVRP system was 0.4°C smaller than the condition under DCV. Moreover, the mean temperature in the occupied zone when using the LVRP system remained at 26°C; which is 0.6°C lower than when under the DCV. The temperature in the occupied zone under LVRP system was lower than in the unoccupied zone due to the local airflow rate and the radiant panel above the workstation. The exhaust temperature was from 0.8°C to 1.9°C higher than the reference temperature at workstation under the LVRP system. Under the LVRP system, the air velocity was low (less than 0.12 m/s) in the whole occupied zone even with the highest studied heat gain. As a result, the draught rate was also low (less than 10%) and the thermal comfort was better than under the DCV. The overall thermal comfort under the LVRP system was able to meet the Category A as prescribed by the International standard, EN ISO 7730:200568 with a heat gain of 40 W/m2 and the Category B with heat gains of 60 W/m2 and 80 W/m2.
Footnotes
Acknowledgements
The authors appreciate the low velocity units and radiant panels provided by Halton Oy. The authors appreciate Sami Lestinen from Aalto University and Panu Mustakallio from Halton Oy for discussion.
Authors' contribution
WZ conducted all measurements, analysed the data and drafted the article. SK and RK supervised the measurements. RK and JJ reviewed the manuscript and provided comments for revision of the article.
Declaration of conflicting interests
The author(s) declared no potential conflicts of interest with respect to the research, authorship, and/or publication of this article.
Funding
The author(s) received no financial support for the research, authorship, and/or publication of this article.