
Abstract
The influence of occupants'’ movements should be considered when analysing local thermal comfort. This study presents the effect of human movement on airflow characteristics and local thermal conditions with diffuse ceiling ventilation by experimental studies. A simulated person moving was used to study the human movement in an office. In these experiments, three moving speeds were studied: 0.3, 0.6 and 1.0 m/s. The simulated person moved in four cycle patterns: continuous moving and with 5 s, 10 s and 15 s interval breaks between each turn. Three heat gain levels of 40, 60 and 80 W/m2 were evaluated in the chamber. The results indicate that the human movement decreased vertical temperature gradient compared with the steady-state condition. Instead, the moving intervals would have no effect on the vertical air temperature gradient. The power spectral density was increased by 90% due to the person movement compared with the steady-state condition. The moving person would create different micro-environments close to work stations than close to the moving area.
Keywords
Introduction
In modern cities and urban societies, the influence of indoor environment to human health, comfort and productivity is important1,2 because people spend more than 90% of their time indoors. 3 Occupants expect to have healthy and comfortable indoor environment that could fulfil their need for thermal comfort as well as excellent indoor air quality. These conditions can be achieved by high-performance ventilation.
Diffuse ceiling ventilation (DCV) is a ventilation concept in which the suspended ceiling serves as an air diffuser to supply outdoor air into the room, where the air movement is dominated often by buoyancy flows from heat sources and not by momentum flow from the supply. The supply air of DCV is distributed evenly through the perforated suspended ceiling down to the occupied zone. Diffuse ceiling air supply can create good thermal environment in heating season. However, it will require higher energy consumption. 4
Earlier studies have shown that large-scale circulating flow pattern exists with asymmetric thermal load distribution with diffuse ceiling ventilation increasing a vertical temperature gradient (about 1°C) at the whole space.5–8 The effect of heat gain on indoor airflow characteristics was studied.8,9 The result shows that the mean air speed and the airflow fluctuation were increased with heat gain and supply airflow rate. Consequently, also the turbulent kinetic energy and the turbulence dissipation would be increased. The results indicate a cause–effect relationship of the heat gain strength and the heat gain distribution on airflow characteristics that may also have effects on air distribution. Also, the air distribution of diffuse ceiling is affected by natural convection flows and asymmetrical heat gains arrangement, which may cause circulation and high velocities in the opposite side of heat sources. 10
Together with the effect of heat gains on air movement, the influence of occupants’ movements should also be considered. Previous studies indicated that the human movement in indoor environment has an influence on the dynamic airflow.11–14 An upward air vortex and a strong downward airflow were found behind the moving body at different moving speeds. Also, a symmetric downward air flow along the vertical centreline of the moving body was observed. 15
Mattsson 16 reported measurements from a full-scale displacement ventilated room where a heated dummy (1.63 m high cylinder) was located on a trolley. If the dummy without thermal load was doing a single motion, horizontal air movements would be created without mechanical ventilation. If the dummy was moved back and forth on a straight line by a conveyer belt, systematic periodical air movement would be recognized. The local field as well as the entire room airflow was found to be substantially influenced by occupants’ movements. The air mixing is enhanced by increasing the speed of reciprocal movements of a person. 17
Measurements and computational fluid dynamics (CFD simulations) of a displacement ventilated room with a cylinder type person simulator standing still and moving back and forth on a straight line were performed, respectively.18,19 The speed varied between 0 and 1.0 m/s. Similar study was carried out by Feng. 20 The results showed that the vertical thermal stratification was disturbed and the local mean age of air decreased as the speed of the moving dummy increased. With displacement ventilation, a moving manikin could make the vertical temperature gradient smaller than in the steady-state conditions. Simultaneously, higher moving speed led to a smaller local air exchange index in the occupied zone. 21 Halvoňová and Melikov 22 examined the effect of disturbances due to walking person with ‘ductless’ personalized ventilation in conjunction with displacement ventilation. The results revealed that the walking person disturbed the displacement principle and resulted in a decrease of the inhaled air quality. Yang and Sekhar 23 simulated the interaction of dynamic indoor environment with the moving person with a ceiling-mounted personalized ventilation system.
Some studies investigated the aerodynamic effect of human movement with different moving speeds and different frequency of limbs pendulum by experiment and numerical simulations without ventilation.24,25 These studies show that the aerodynamic effect caused by human movements depend on the moving speed, moving distance and spatial location. The analysis results show that body motion has an influence on the flow field. Also, more detailed profile of the human body with movement would lead to more complicated flow field in the nearby area.
Previous studies also have found that the air distribution is affected by the moving person with mixing ventilation, stratum ventilation and displacement ventilation. The influence of the moving manikin on mixing ventilation was the smallest and the influence on stratum ventilation was smaller than on displacement ventilation. However, the disturbed room airflows would return to the original state quickly after the walking person remains motionless.26–28
In previous studies, different methods such as the small-scale test with positive input ventilation (PIV) experiment 29 and the simulation based on momentum theory30,31 were introduced. Moreover, the transient airflow was studied with different spaces such as the operating room 32 and the subway. 31
The literature shows that person movements have some impact on the airflow structure in the ventilated enclosures both in relation to the local field around a person as well as to the near zone of the occupant. No studies explored the effect of the moving person with different moving intervals on the airflow pattern and thermal comfort under diffuse ceiling ventilation. The extended predicted mean vote (ePMV) of the dynamic thermal comfort model was proposed to extend the PMV model to dynamic conditions. 33 In this study, the heat gain and the temperature are constant. The main focus was on local thermal comfort, and the draught rate and air velocity were selected as indices to analyse the thermal conditions with the moving person.
The novelty of this study is to analyse the effect of a moving person with different intervals on the performance of diffuse ceiling ventilation close to workstation with laboratory experiments. Also, the power spectral density and fluctuation energy ratio were studied to analyse the effect of a moving person on the airflow structure close to workstations. The simulated moving person was designed to go back and forth on a straight line near workstations. The effect of the specific heat gain level and also moving speed and moving interval of the simulated person on the air flow pattern was studied. The selected measurement locations represent the micro-environment close to the workstation (P1) and moving zone (P2). The main objective was to analyse the effect of the moving person on the airflow characteristics and thermal conditions near the person and moving zone.
Methods
Room air temperature, surface temperatures and air velocity were measured to evaluate thermal environment of studied cases. Local thermal comfort was analysed with draught rate. The power spectral density and fluctuation energy ratio were studied to observe the airflow fluctuation characteristics.
Test room
The measurements were carried out in a test chamber of the internal dimensions of 5.5 m length, 3.8 m width and 3.2 m height from the floor up to the suspended ceiling. The supply air was distributed through the suspended ceiling panels into the room. The panels were installed 0.35 m below the ceiling. The diffuse ceiling panel has dimensions of 600 × 600 × 20 mm3, and the panel was made of glass-wool-plate elements. Each tiny plastic nozzle has a diameter of 14 mm, and the overall perforation ratio is approximately 0.5% (Figure 1(a)). Two Ventiduct VSR duct diffusers 34 were installed sequentially above the suspended ceiling to able to reach uniform static pressure over the ceiling panels. The combined duct diffuser of diameter 200 mm extended the entire length of the upper chamber (Figure 1(b)). The suspended ceiling was 50 mm below the duct. The exhaust grille was installed at floor (circle, length-coordinate 5 m, width-coordinate 2.4 m), as shown in Figure 2(a)). The diameter of the exhaust duct was 160 mm. The test chamber was located inside a laboratory hall such that the outer environment was stable.
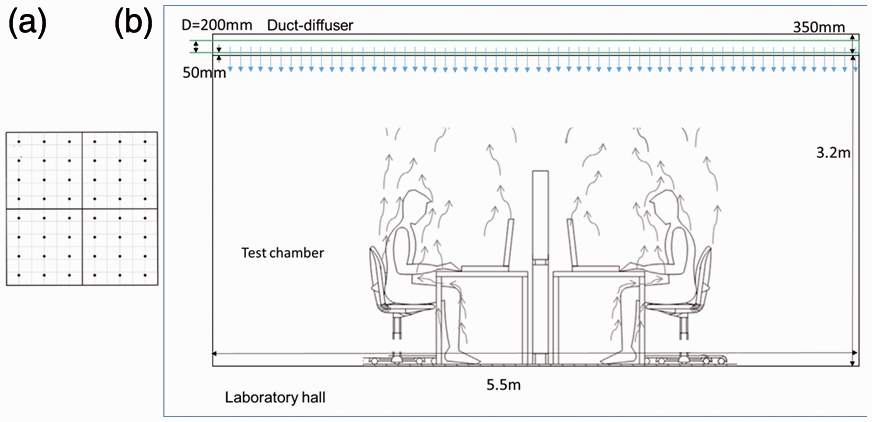
(a) Diffuse ceiling inlet structure with tiny nozzle density (d = 14 mm) of the entire panel (600 × 600 mm) area and (b) duct diffuser (D = 200 mm) located in the plenum chamber over the ceiling panels.
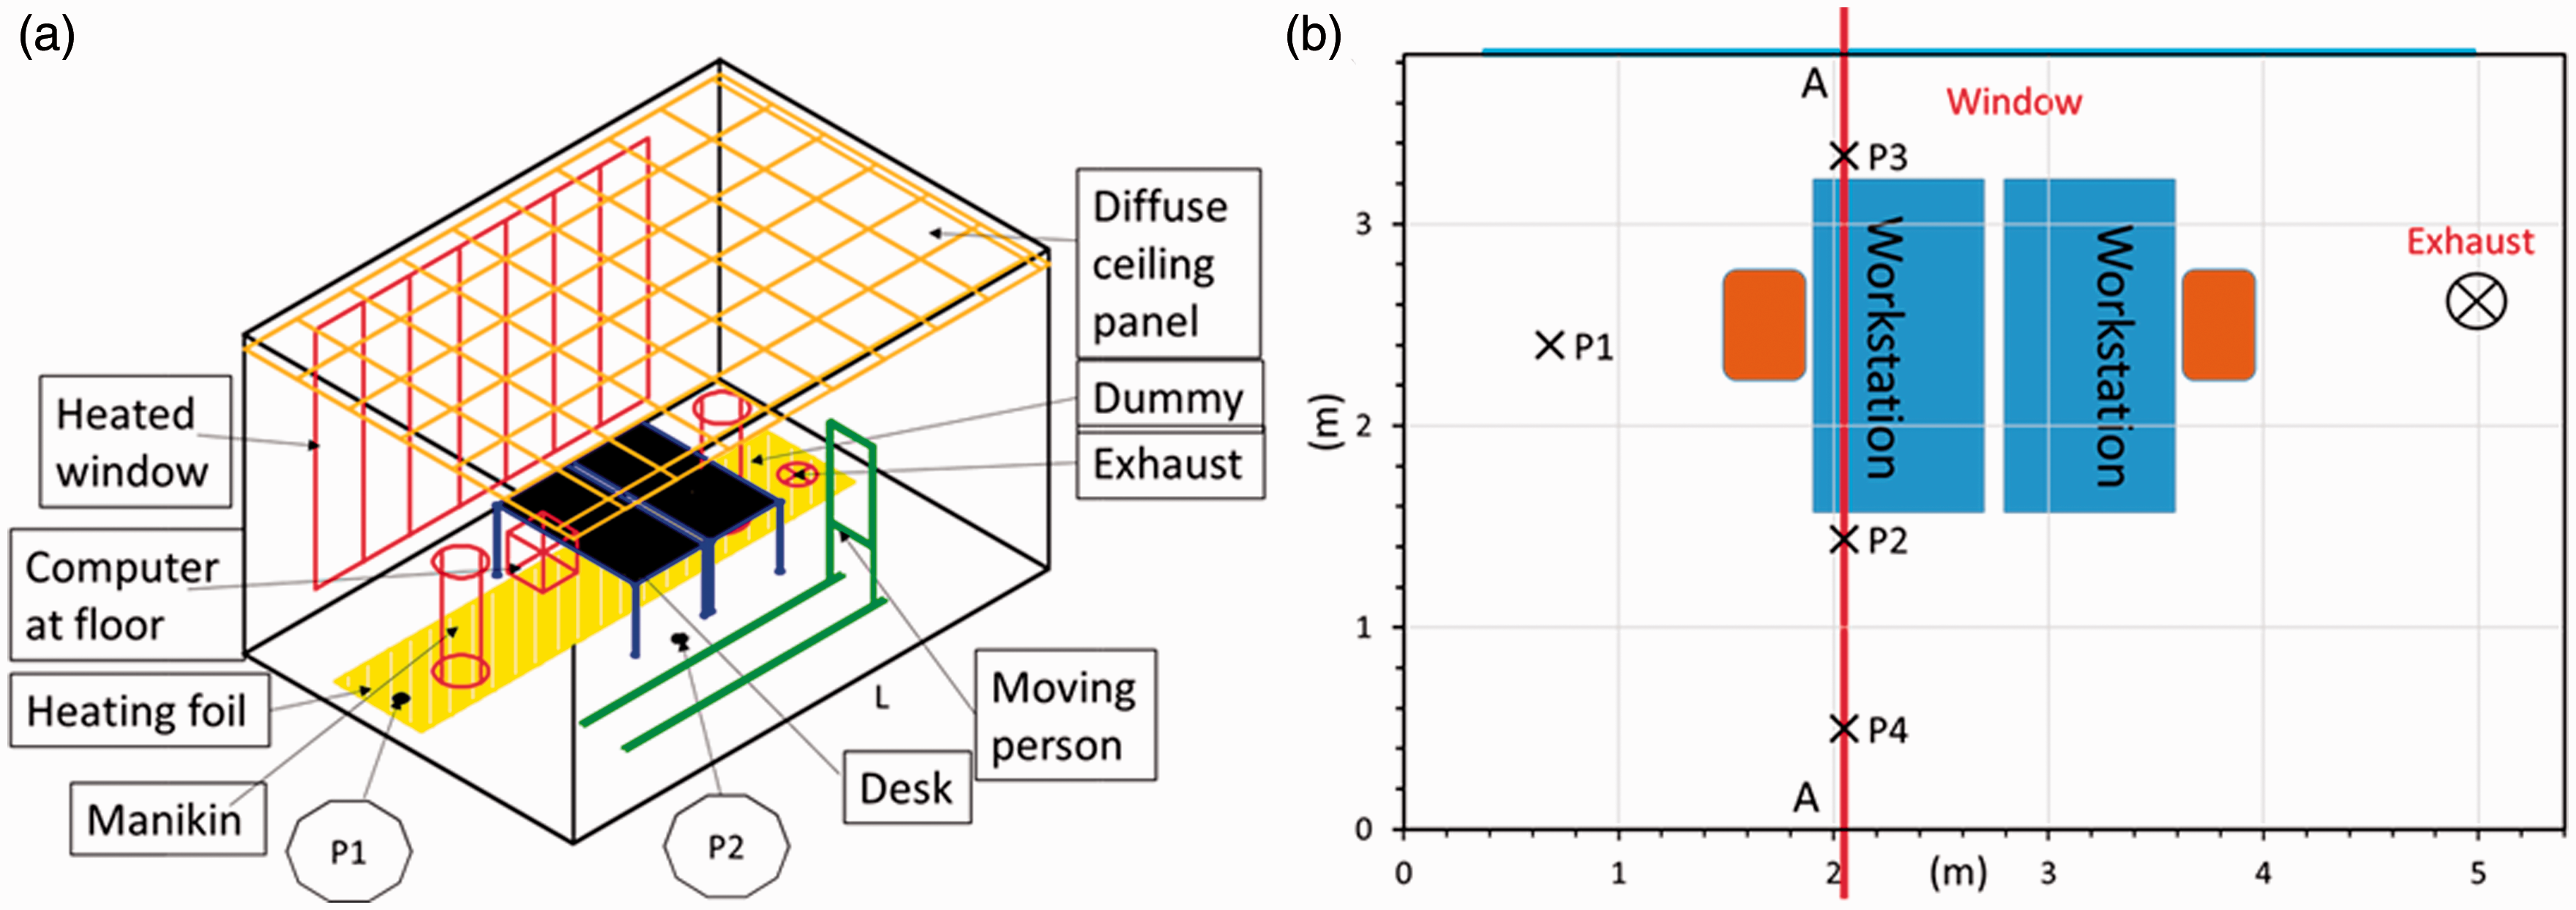
(a) The test chamber layout and the location of the moving simulated person and (b) measurement locations in the steady-state condition and the section A-A included the measurement locations of P2, P3 and P4.
The experimental set-up
Figure 2 presents the layout of the test chamber. Two workstations were located in the middle of the room in longwise direction and 0.6 m from the window panel. Both workstations were equipped with a laptop and a monitor. Lights were installed in the middle of the workstation to the ceiling at a height of 3.2 m. The simulated solar heat gain was provided by hot-water pipes inside the window panel. The window panel surface was set to 30–40°C to simulate solar heat gain, as shown in Table 1. The insulation plates with a thickness of 0.1 m were installed outside the room to cover the window panel. The electric heating foil of 5 m length and 1 m width was installed on the floor 0.8 m from the heated window panel wall to simulate direct solar load, as shown in Figure 2(a)).
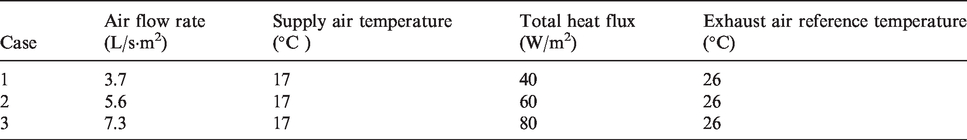
Used heat gains in different test cases.
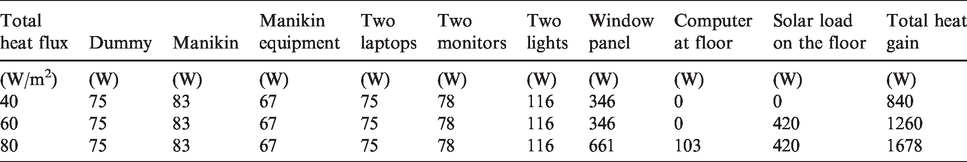
The use of real human movement makes the study more complicated, because to maintain the same walking speed and moving breaks for long time tests is difficult. Because of this reason, the Nordtest 35 was selected to simulate a moving person. According to Nordtest standard, the moving person is a plate with dimensions of 1.0 m height, 0.5 m width and the total height is 1.6 m from the floor. For the solidity and stability, a plate made by polyfoam with a 0.03 m thickness was used for the test to fulfil the demand of Nordtest. The moving person was fixed upon a trolley which a moving speed that was possible to control. The moving track was 3 m long and located 0.67 m from the wall in the longwise direction, as shown in Figure 3.
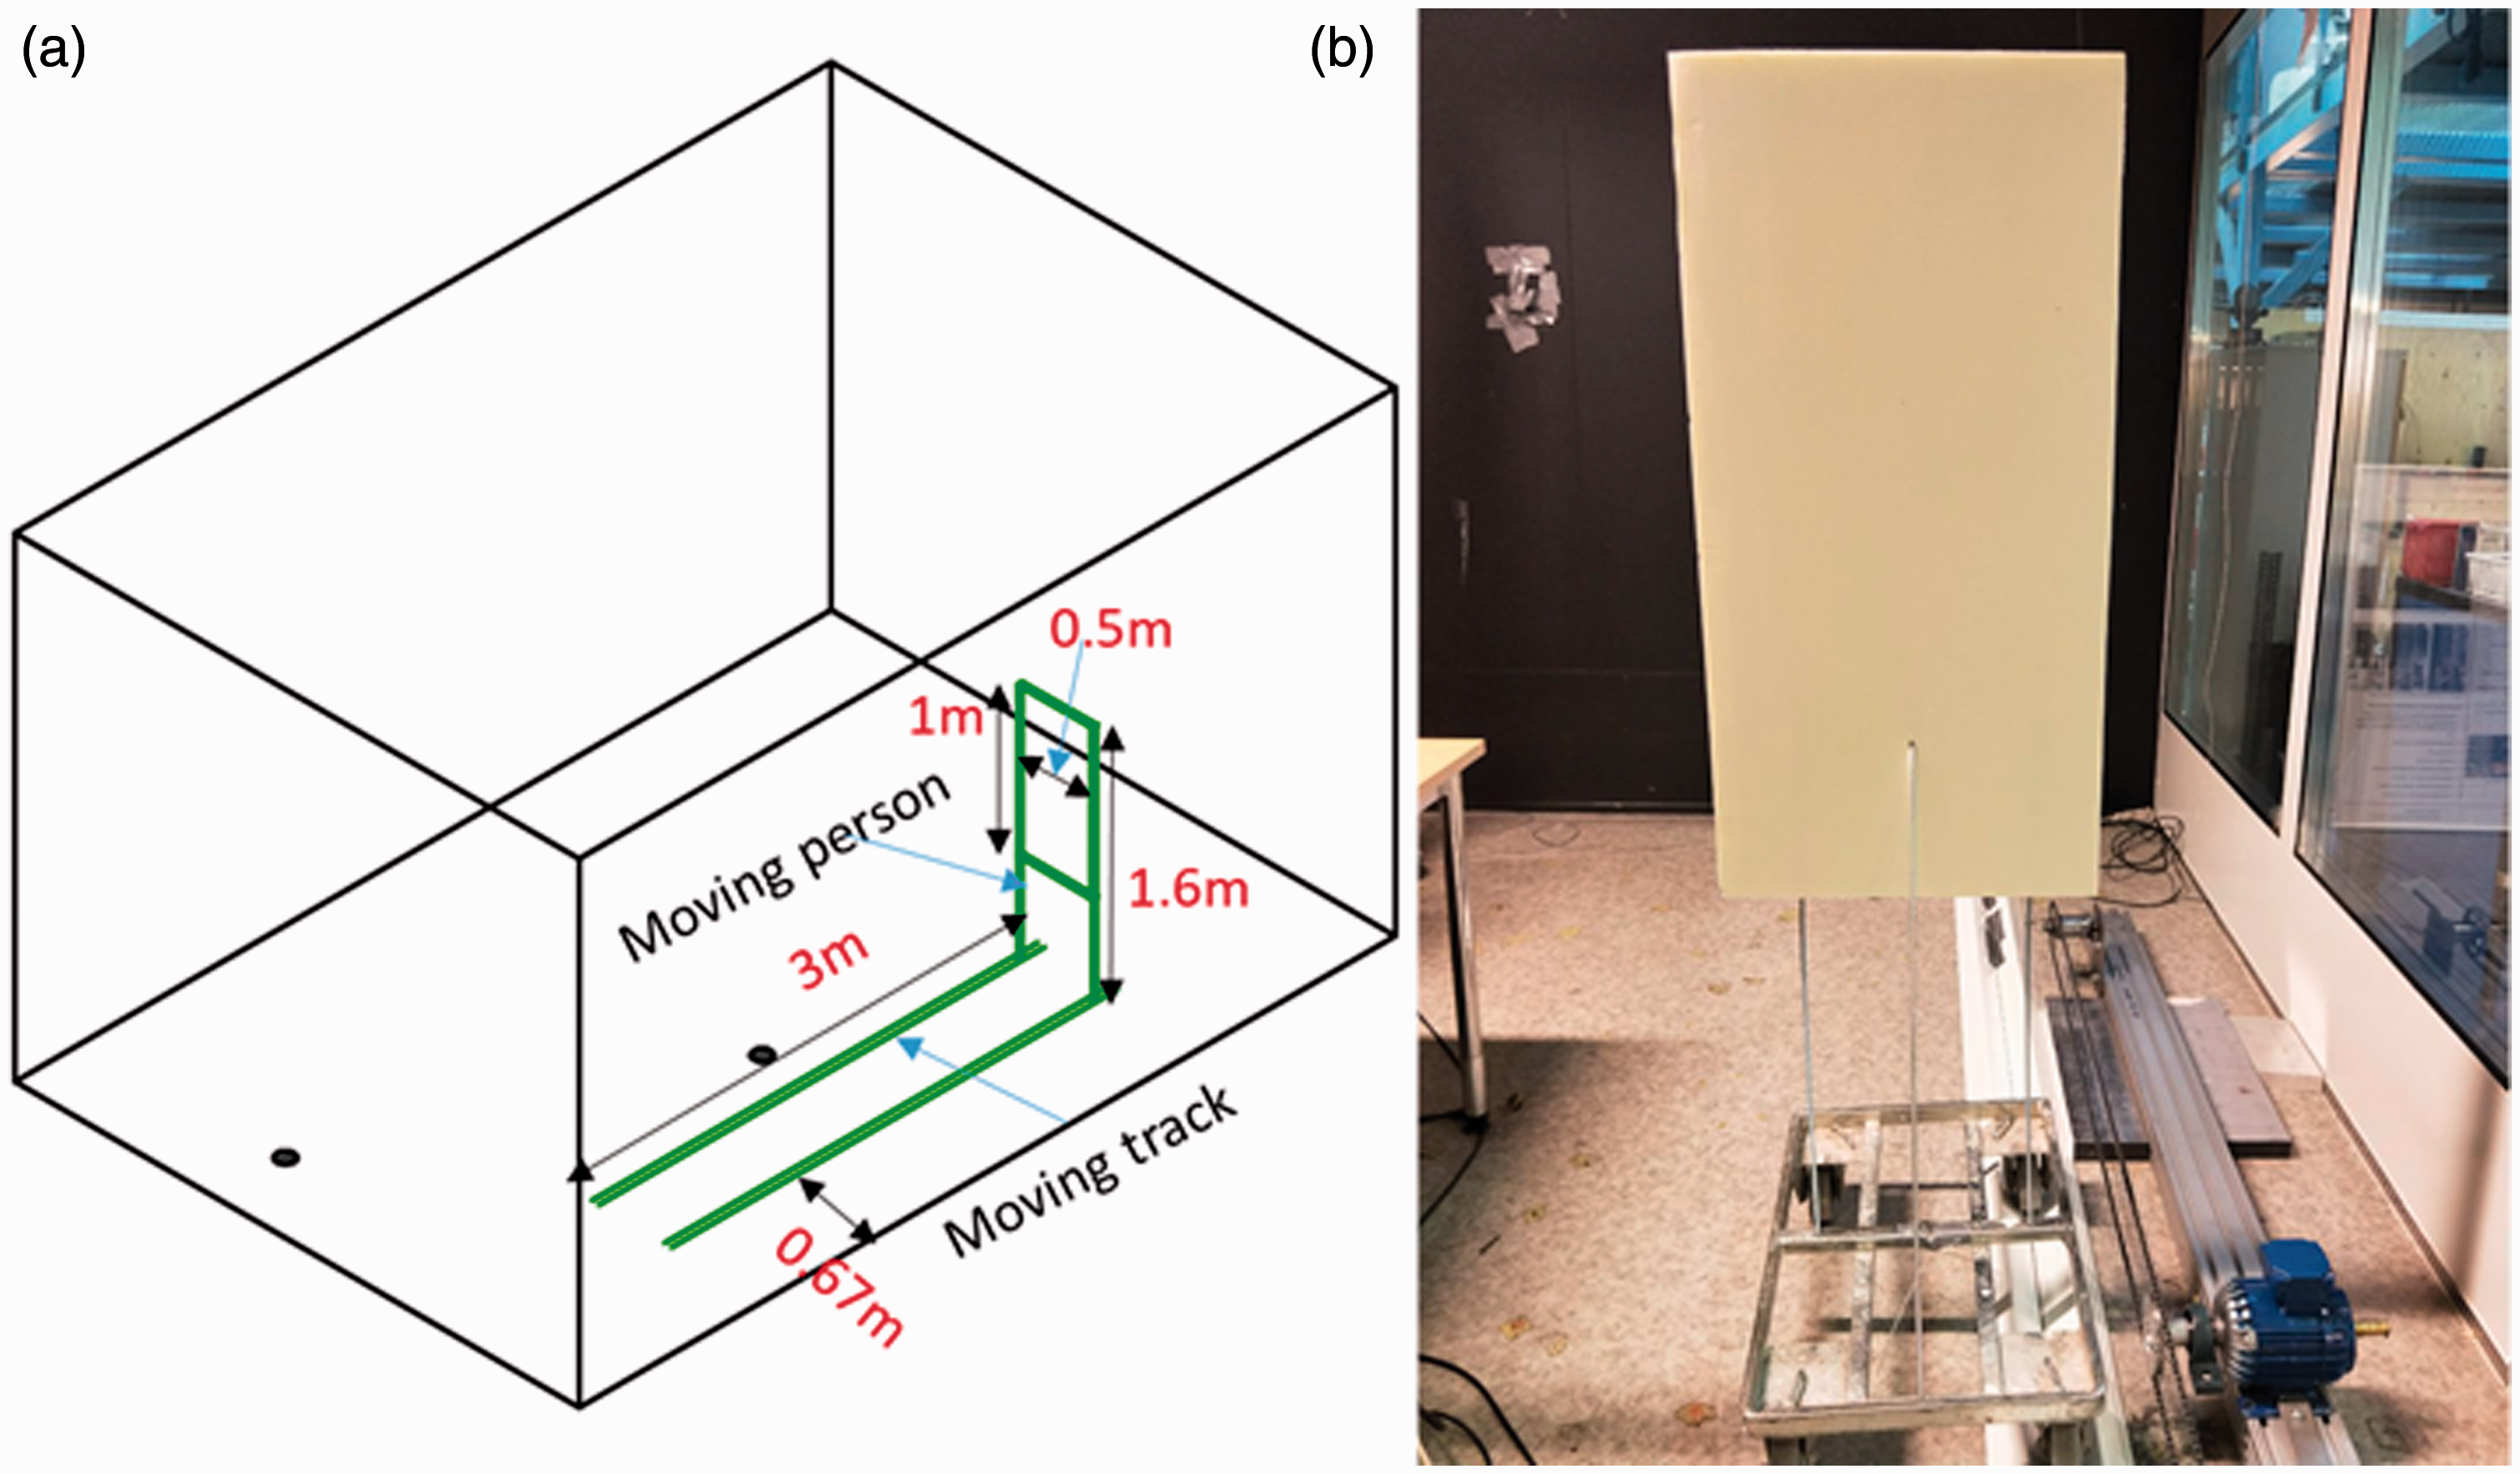
(a) A dimension of moving plate as a simulated moving person with trolley and moving track and (b) the simulated person moving on the track.
In this study, the occupied zone means the region normally occupied by people within a space, defined by ASHREA 55–2010. 36 The workstation zone is the area including desks and seated occupants, as shown in Figure 4. Because there are two measured locations, P1 (seated person zone) and P2 (moving zone), the seated person zone was named as the occupied zone accordingly.
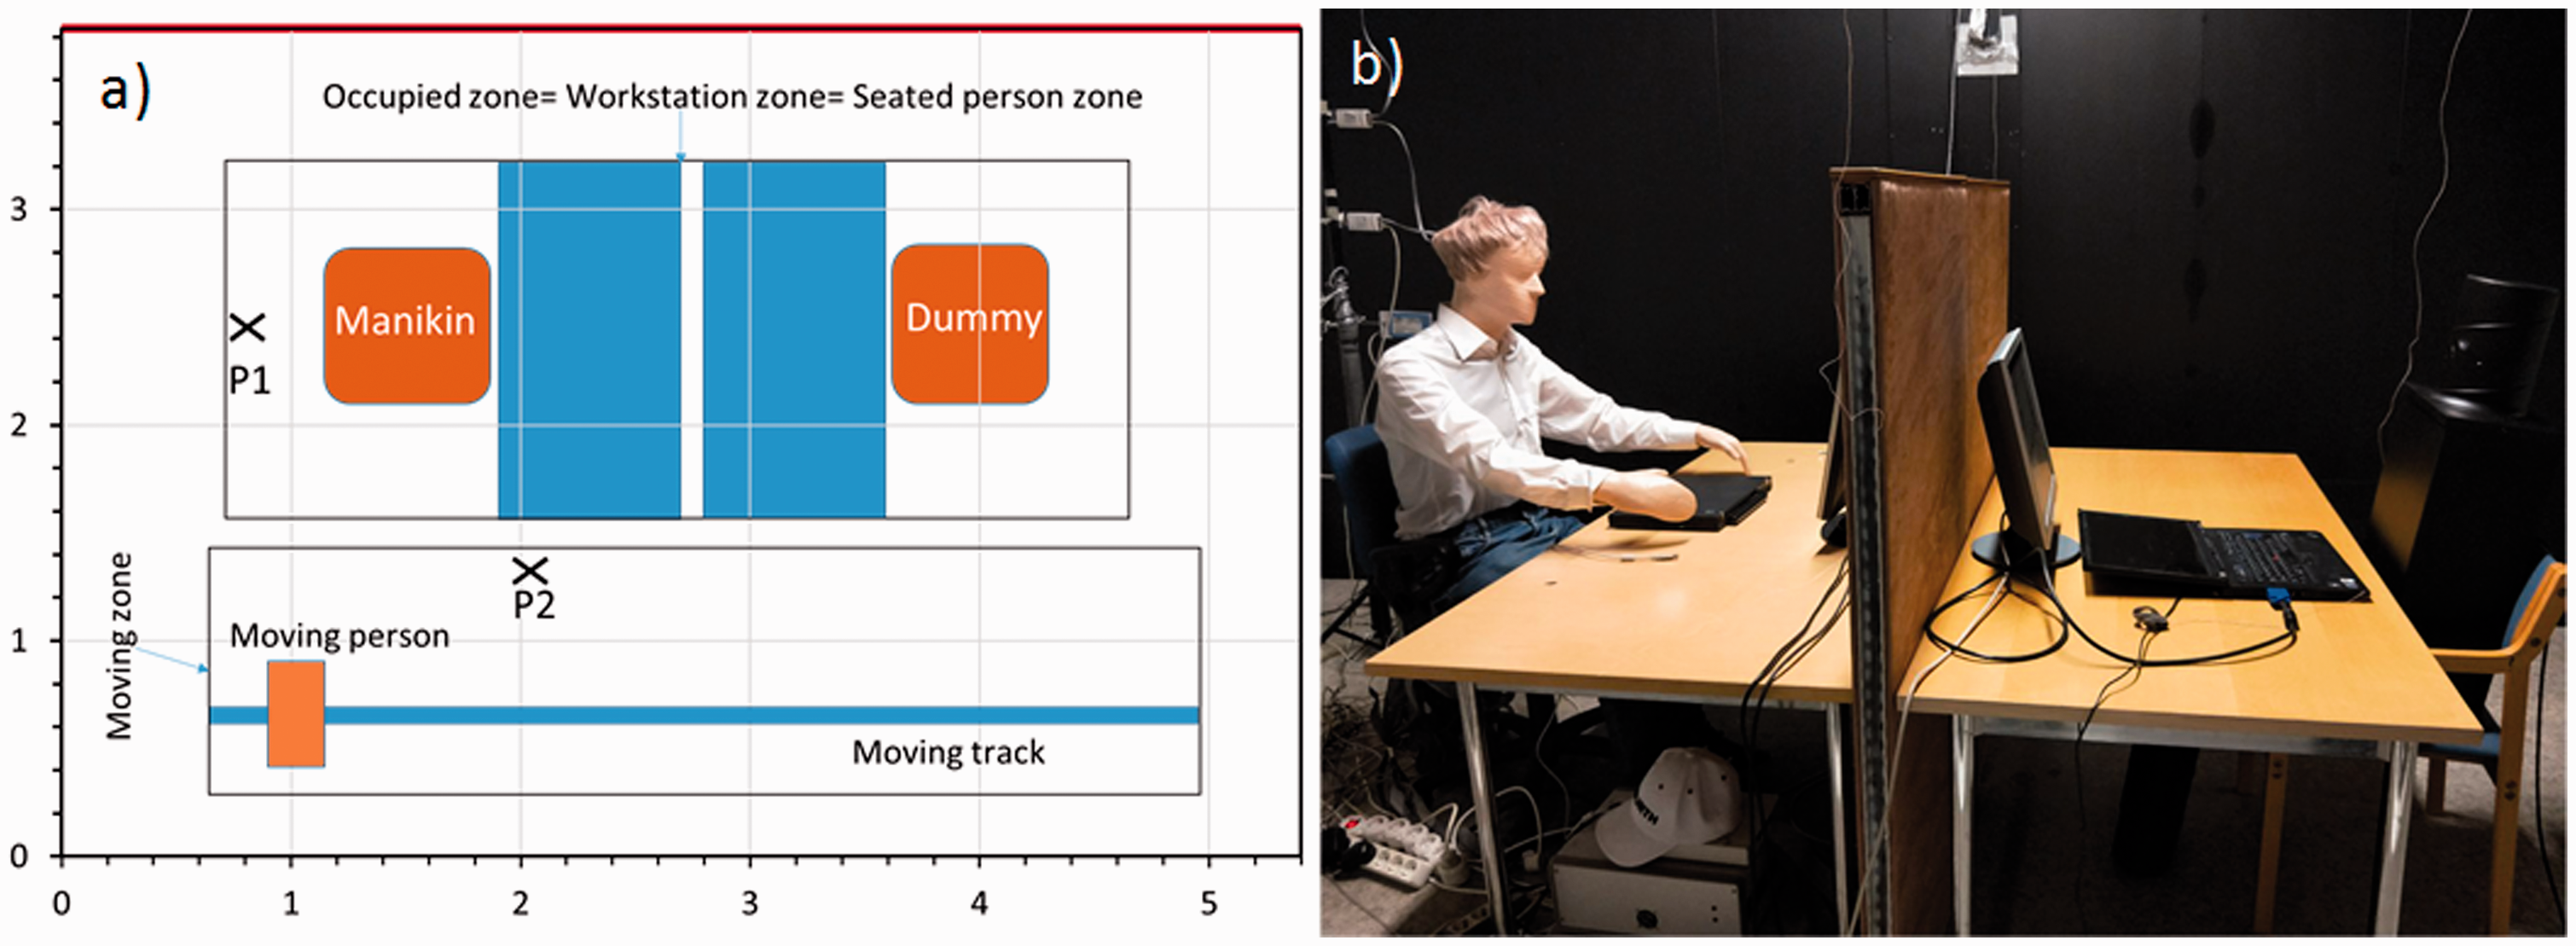
(a) The area of different zones in the chamber and (b) the seated dummy and manikin.
Experimental conditions
The average heat gain was designed at 40 W/m2, 60 W/m2 and 80 W/m2. Table 1 shows the used heat gains in the test chamber. In this study, the supply temperature and exhaust temperature were constant with all heat gains. So when the heat gain rises (from 40 to 80 W/m2), a higher airflow rate is required to reach the same target room air temperature. In this study, the air flow rate was varied between 3.7 and 7.3 L/s/m2 according to heat gain. For internal heat gains, all electrical powers, e.g. lights, dummy, etc. were measured. The required heat gain balance was adjusted with the simulated window panel. The heating power of the window panel and the foil on the floor were adjusted to reach the set cooling load levels. In the case of 80 W/m2, the additional heat source of 0.4 × 0.4 × 0.4 m3 was located on the floor below the table to model a computer, see Figure 2(a)).
The parameters of the test cases are summarized in Table 2. The exhaust temperature was kept at 26°C as the reference temperature for all three heat gain levels.
Heat gains per floor area, specific airflow rates and temperatures.
In the tests, three moving speeds were used: 0.3 m/s, 0.6 m/s and 1.0 m/s. With 3 m length track, the speed of 1.0 m/s was the maximum that can be reached. However, the speed could be assumed to describe the normal walking speed in the office. The speeds of 0.3 m/s and 0.6 m/s were as reference speeds. So the simulated person took 20 s, 10 s and 6 s for one turn to move on the track. The simulated person moved by four cycle patterns: continuous moving and with 5 s, 10 s and 15 s interval breaks between each turn, as shown in Table 3. In this study, all together 81 cases were measured.
Moving speeds and interval brake times of the test cases.

Measurement instruments and measurement locations
In the test of moving person, different moving speeds and cycle patterns were measured to find how the movement could disturb the air distribution. Two locations (P1 and P2) were measured with the air temperature and velocity, where P1 (length-coordinate 0.68 m, width-coordinate 2.4 m) was near the seated person zone and P2 (at length-coordinate 2.05 m, width-coordinate 1.44 m) was near the track (see Figure 2(a).
Figure 2(b) shows the measured locations with steady-state conditions and the section A-A included the measurement locations of P2, P3 (corridor side) and P4 (simulated window side).
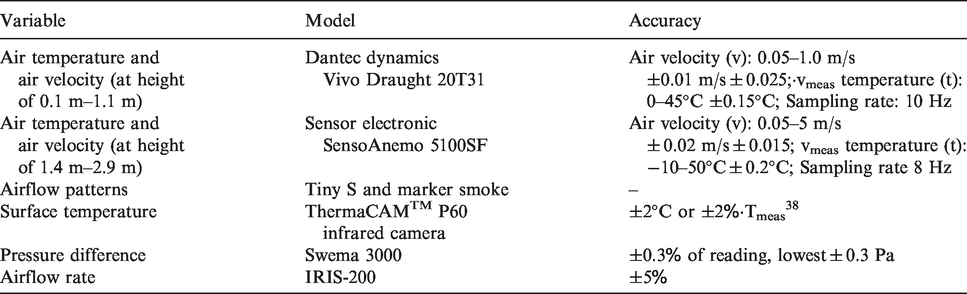
The characteristics of flow field were measured by seven hot-sphere anemometers at every measurement location. The anemometers were installed into a measuring mast at heights of 0.1 m, 0.6 m and 1.1 m according to recommendations given by the European Standard EN ISO 7726:1998. 37 Another four anemometers were measured at the height of 1.4 m, 1.7 m, 2.3 m and 2.9 m. Because of the limitation of measurement devices, two different sensors were used. Three lowest sensors were the Vivo Draught 20T31 anemometers with the sampling rate of 10 Hz. The four highest sensors were the wireless Sensoanemo 5100SF anemometers with the sampling rate of 0.5 Hz. The Sensoanemo and the Vivo Draught anemometers were calibrated before the measurement.
The Tinytag Plus-2-meters were attached to internal window and corridor side walls to measure near-wall temperature and relative humidity conditions. The uniformity of the surface temperature of the panel was measured with infrared camera and temperature sensors to verify that water circuit inside the panel is as designed. Indoor airflow pattern was visualized with marker smoke. This visualization was used to recognize air flow pattern. All the measurement devices used in the experiments are summarized in Table 4.
The measuring instruments.
Experimental procedure
In the test, the room reached another quasi-steady state condition after the plate had moved for 10 min. All tests started under steady-state condition. In the measurements, the data acquired during 10 min period before starting the plate movement were averaged as the steady condition. The data collected during the 10 min dynamic tests were averaged as the simulated moving conditions, respectively. Thus, all the 10 min measurement periods were about 3.3 times longer than normally used, 3 min averaged measurements. 39
The thermal comfort indices and airflow characteristics
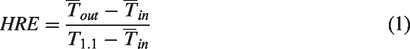
In this study, the thermal conditions were analysed by using heat removal efficiency (HRE) and draught rate. HRE is an index used to evaluate the effectiveness of heat removal
40
and it was calculated by equation (1).
The walk of person increases the room air velocity as well as its fluctuation. The standard deviation (SD) of the velocity is defined by equation (2).
Draught is defined as an unwanted local cooling of the human body caused by the air movement, which is strongly related to local air speed. Standard EN ISO 7730:200541 defines the draught rate (DR) as given by equation (3).

The turbulence intensity, 
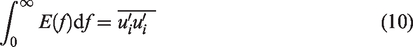
In this study, the airflow characteristics were analysed by equivalent frequency, turbulent kinetic energy, energy spectral distribution and fluctuation energy ratio.
The equivalent frequency (
The turbulent kinetic energy, 
The Fourier transform of airflow fluctuation represents a frequency distribution from the set of discrete values of a given variable over the time-interval by providing the sinusoidal components of original function with certain frequency. The Fourier transform, 
The outcome of the Fourier transform is the complex-valued function 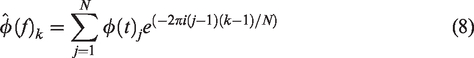
The power spectral density describes the distribution of power as a function of frequency that provides a normalized power spectrum. The power spectral density was calculated using the Fast Fourier Transform (FFT) method in Matlab software.
45
Consequently, the power spectral density, 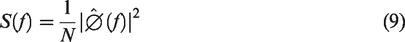
The equation shows the distribution density of velocity fluctuation in a range of frequencies, where
The fluctuation energy, F(E), integral over the time is determined from a numerical integral as given by equation (11).
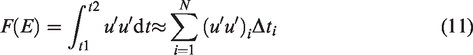
Furthermore, the fluctuation energy ratio, 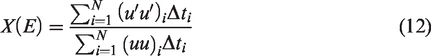
Results
Temperature
In the tests, three moving speeds 0.3 m/s, 0.6 m/s and 1.0 m/s were used for the simulated person. Also, the effect of intermittent movement of the simulated person with four different cycle patterns was tested. Figure 5 shows the temperature distribution in the section A-A (in the location of the measurement points P2, P3 and P4) and the adjacent zone of the manikin (in the point P1) under steady-state condition with the heat gain of 40 W/m2 and 80 W/m2. At the steady state, the more thermal load from heated window led to asymmetric load distribution. Then the upward buoyancy flow from the heated window pushed the air supplied from the diffuse ceiling to flow downward over the opposite wall. Thus, the air temperature near simulated window (P3) was higher than that at corridor side (P4) due to the effect of asymmetrical heat gains. With the heat gain of 40 W/m2, the air temperature was 0.7°C higher close to the window than that close to the corridor wall. With 80 W/m2, this air temperature difference was 1.0°C. This depicts the effect of asymmetric heat load distribution on the temperature profile where the location of the heat gain was the key factor.
The air temperature distribution at the section A-A (points P2, P4 and P3) and near the manikin (point P1) under the steady state condition with the heat gain of (a) 40 W/m2 and (b) 80 W/m2.
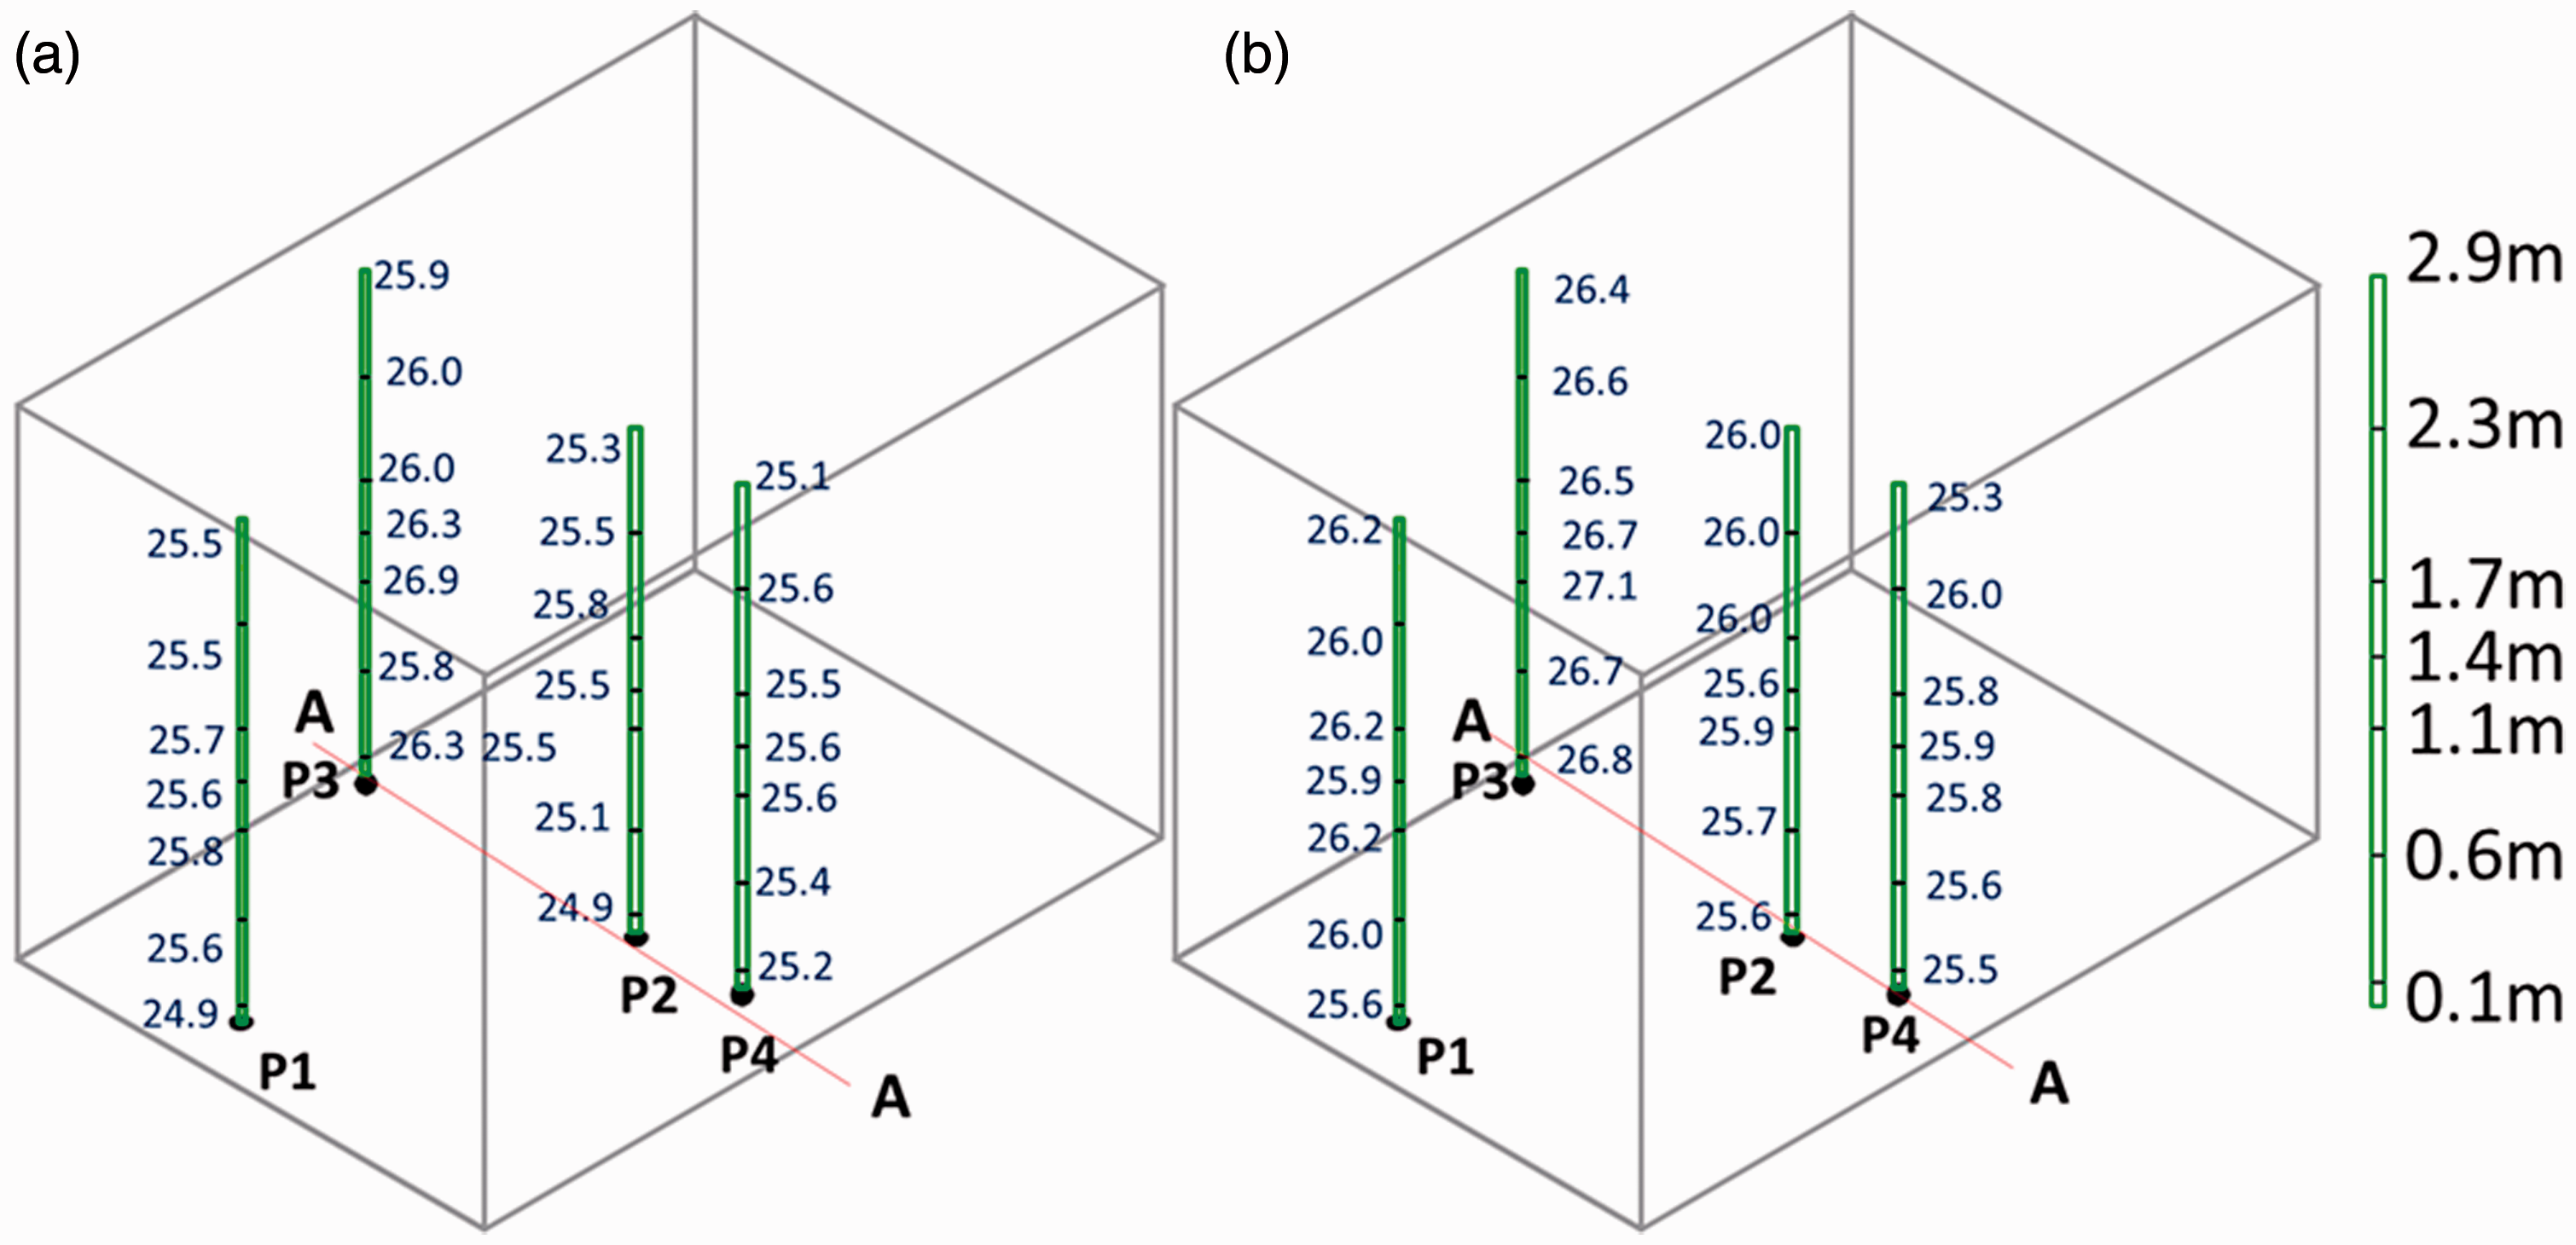
The effect of the simulated moving person on the vertical air temperature is presented in Figure 5. In Figure 6, the average temperature distribution under the steady-state and dynamic conditions is shown with the constant moving speed of the simulated person (0.6 m/s). With a heat gain of 40 W/m2, the average air temperatures at P1 and P2 were rather similar in both steady-state and moving conditions (25.5°C). This means that the moving person has no significant effect on the vertical temperature gradient with the lower thermal load. However, with the heat gain of 80 W/m2, the moving person affected the room air temperature profile both in the occupied (P1) and near the simulated moving person (P2) zones. The mean air temperature at 1.1 m close to the workstation (P1) was 25.8°C under the dynamic condition, which was 0.2°C lower than with the steady-state condition. Nevertheless, the air temperature close to the track of the moving person (P2) was 0.2°C higher in the steady-state condition. In the case of no moving person, with asymmetric heat gain of 80 W/m2, there existed 1°C horizontal temperature difference. Due to the moving person, the horizontal temperature difference was reduced to 0.2°C. Thus, a moving person could reduce significantly the horizontal temperature difference.
Mean air temperature with heat gains of 40 W/m2 and 80 W/m2 under steady-state conditions with a constant moving speed of 0.6 m/s (a) at point P1 (near manikin) and (b) at point P2 (near track).
The effect of the moving person on temperature profile was different with a heat gain of 40 W/m2 and 80 W/m2. When the simulated person moves, the horizontal air mixing was enhanced between the occupied zone and moving zone. Therefore, the human movement would reduce the temperature at P1 but increased the temperature at P2. Due to a heat gain of 40 W/m2, there was less heat transfer between workstation and the side of the moving track than with a heat gain of 80 W/m2. Therefore, the human movement would reduce the temperature at P1 but would increase the temperature at P2. Under the dynamic condition, the vertical air temperature difference between 0.1 m and 0.6 m was 0.4°C at P1, and was 0.1°C at P2. This indicates that the moving person disturbed the thermal stratification near the moving person at P2.
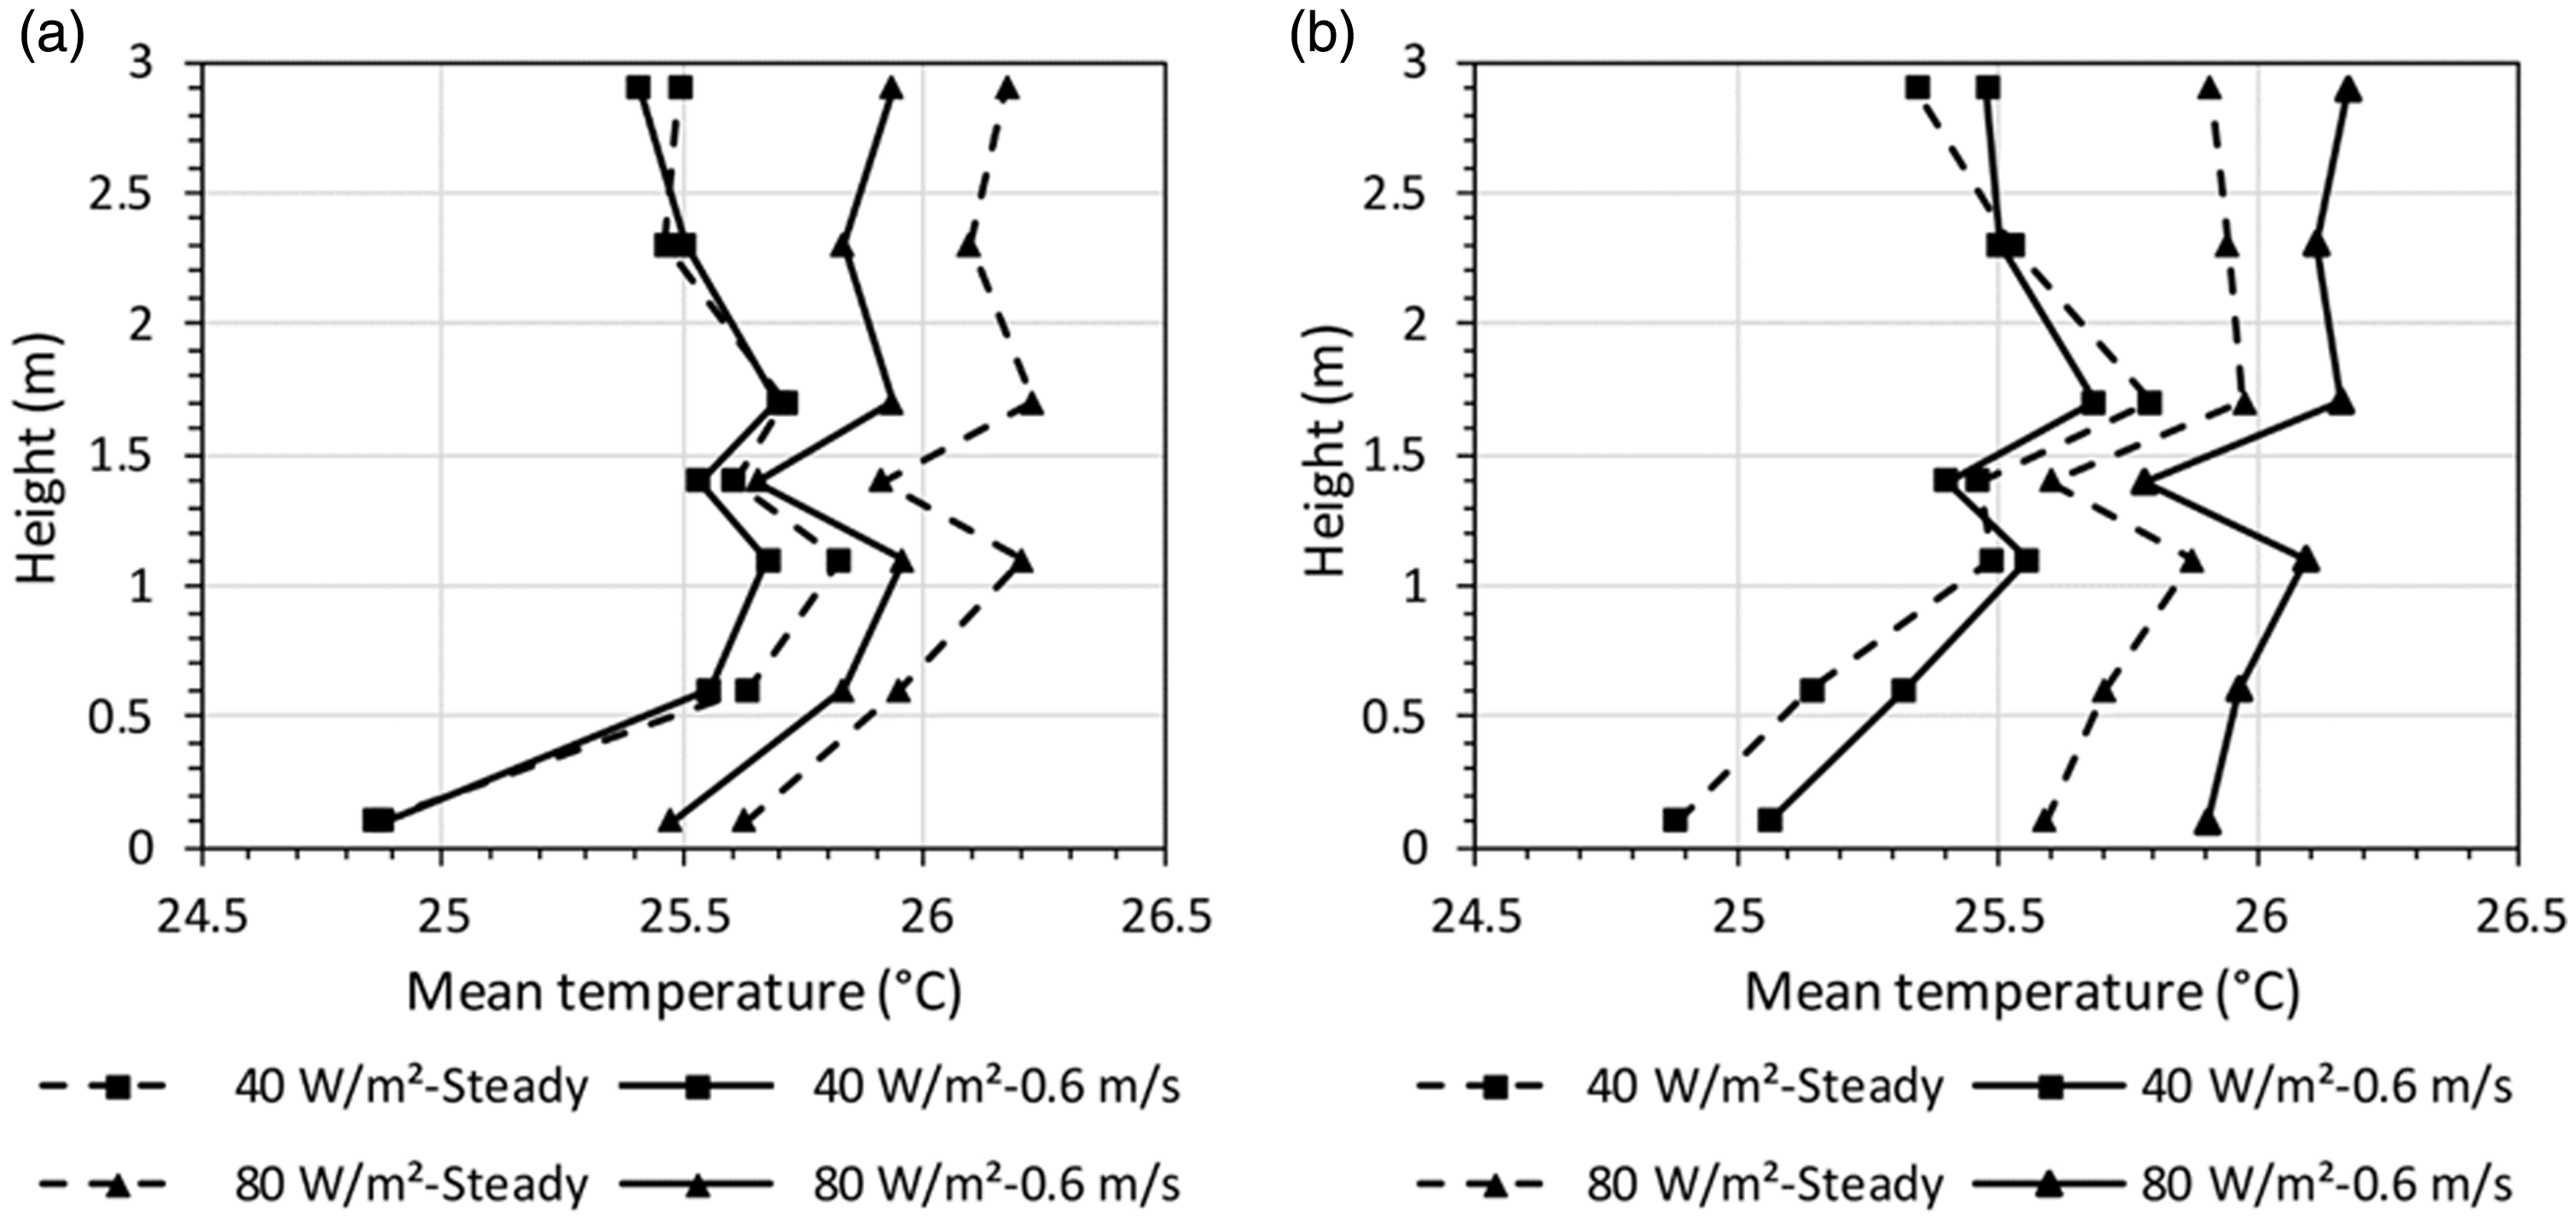
The effect of the moving speed and moving cycle patterns on the vertical temperature gradient was studied. In Figure 7, the air temperature was increased at a distance from the ankle (0.1 m) up to the head height (1.1 m) of a seated person. Figure 7(a) shows that there was not much difference in air temperature profile caused by the various moving speeds. The lower moving speed had led to a slightly higher temperature at 0.6 m and 1.1 m. Figure 7(b) shows the moving frequency also had no significant effect on the air temperature profile. In the continuous moving case (0.6 m/s), the mean air temperature was 0.3°C lower than moving with intervals at heights of 0.6 m and 1.0 m. The air temperature at occupied zone was just slightly higher with a longer stop interval (15 s) than with a shorter stop interval (5 s). Hence, different stop intervals did not have significant difference on the temperature profile. Also, there existed a clear difference only in the continuous moving case. In cases with breaks, there was no clear difference in vertical temperature gradient. This means only the continuous moving person has an effect on the vertical temperature gradient close to the workstation.
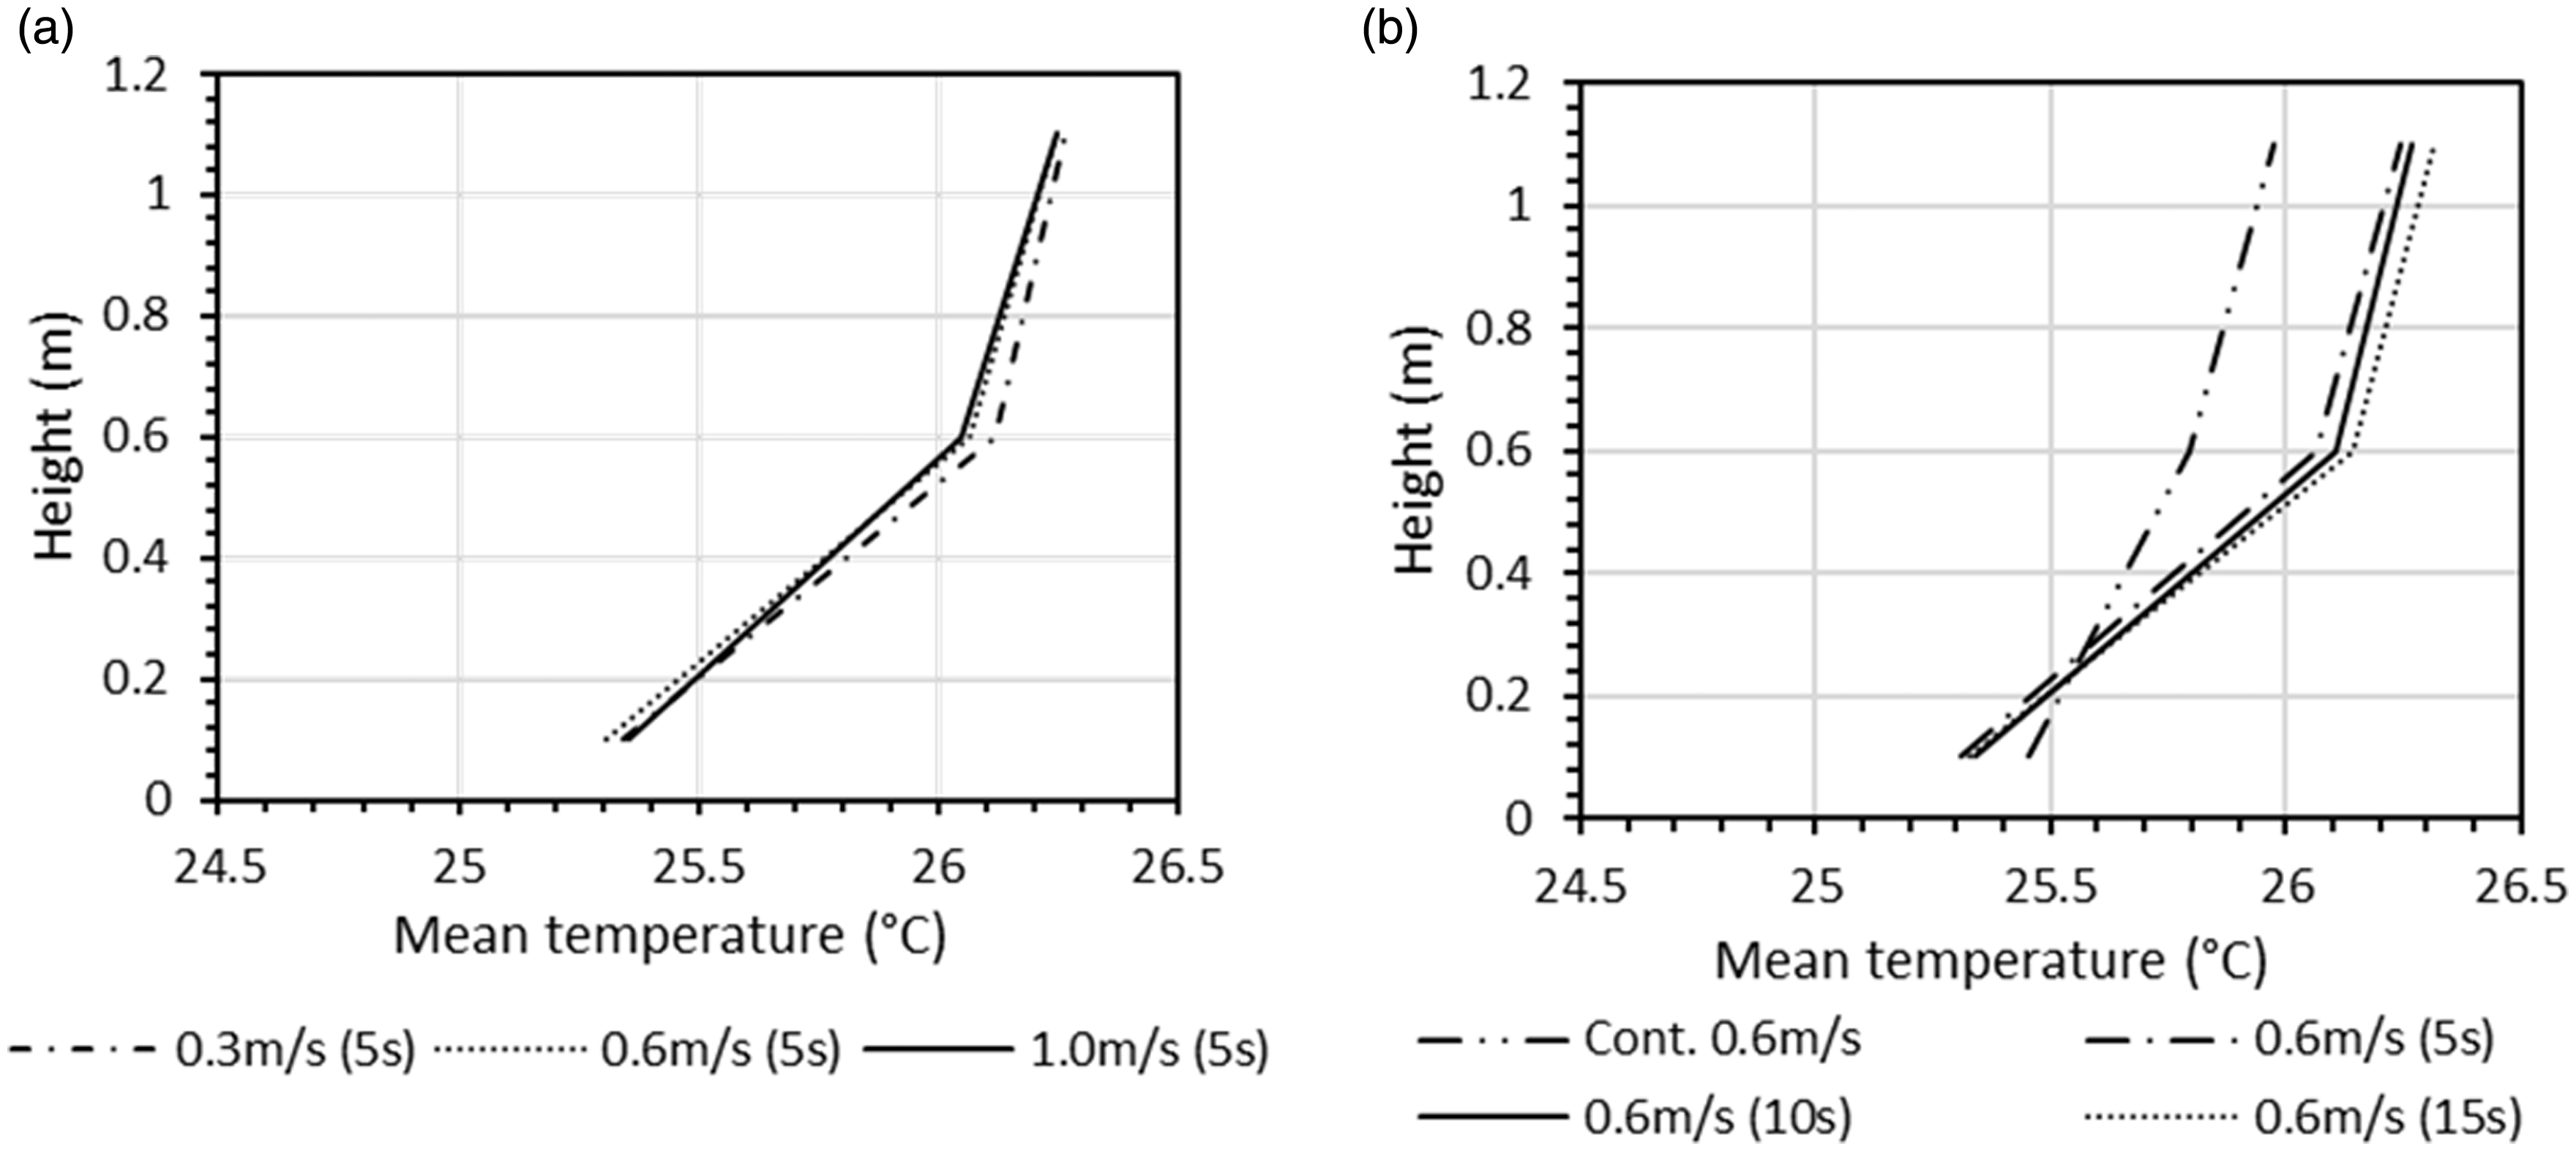
The mean air temperature profiles with 80 W/m2 between 0.1 m to 1.1 m at the point of P1 (near manikin) with (a) different moving speeds and (b) different stop intervals with moving speed of 0.6 m/s.
In Figure 8, the induced airflow behind the simulated moving person is illustrated. When the simulated person moved, the significant effect on air movement was noted. These airflow patterns would affect the micro-environment close to the work station. By the effect of the induced air movement, the vertical temperature gradient that was normally created in the steady-state condition was effectively reduced.
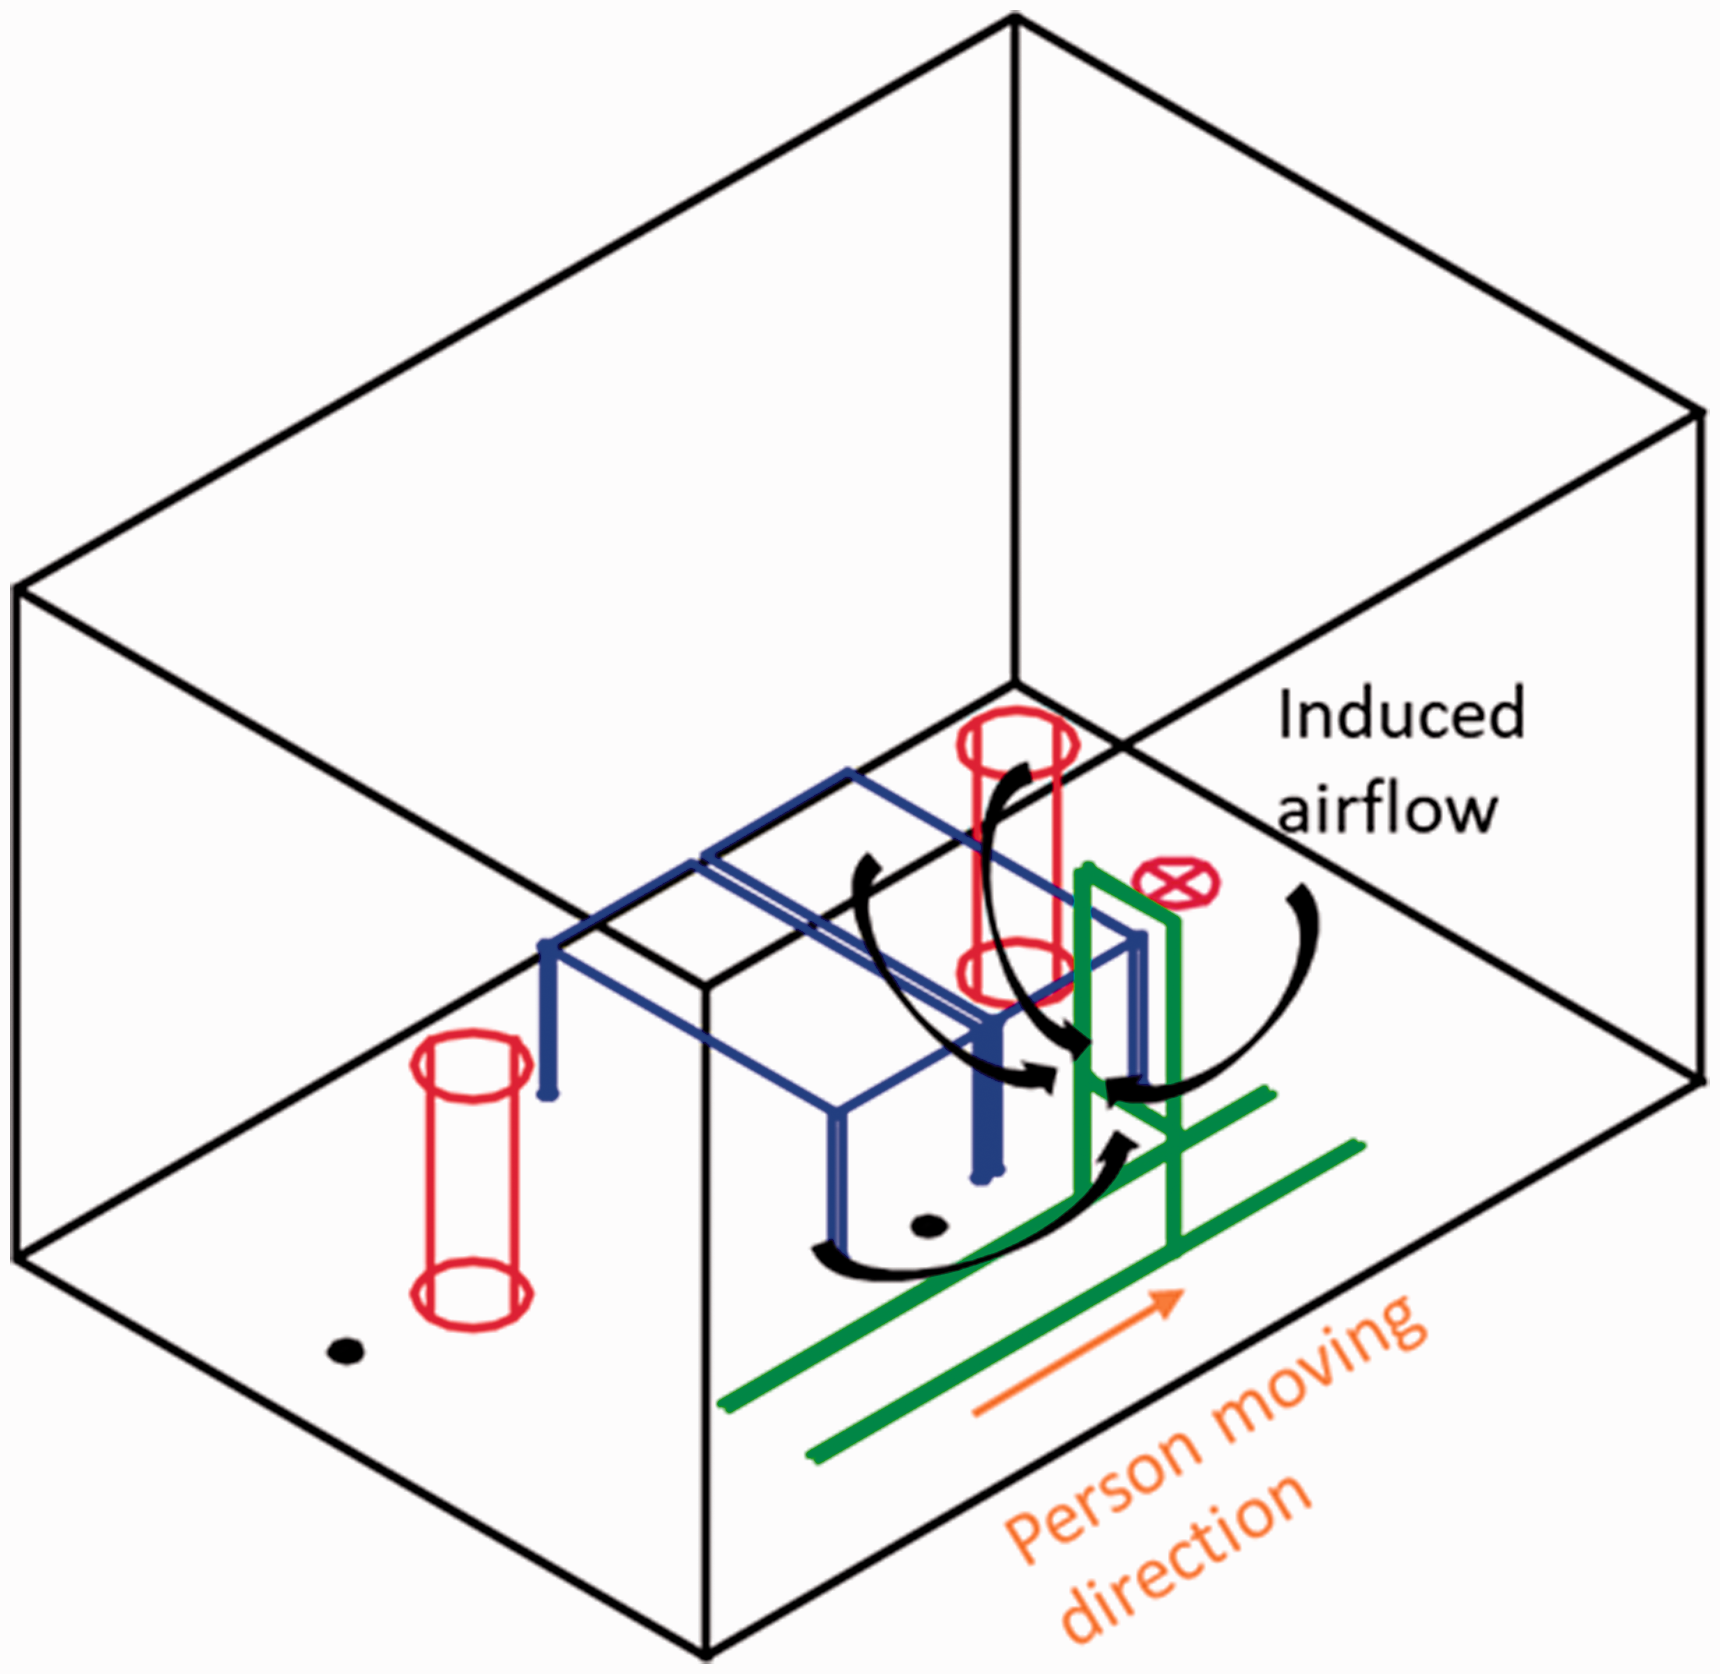
The air distribution affected by the induced air movement of a moving person.
Heat removal efficiency
Figure 9 shows the HRE by using equation (1), when the exhaust temperature was constant. Figure 9(a) shows the average HRE under the steady-state condition with three different heat gain levels. The HRE was greater close to the track (P2) than close to the manikin (P1) (Figure 8(a)), as the mean temperature at P1 was higher than P2. Compared with the steady-state condition under 40 W/m2, HRE was reduced by 6% in the continuous moving (0.6 m/s) case (Figure 9(b)). The varied intervals of the simulated moving person did not have any influence on the HRE. Also, the moving speed did not have an effect on the HRE (Figure 9(c)). Because the moving person would cause a change in the air distribution and further the air temperature at 1.1 m level with constant exhaust temperature, the HRE was changed according to equation (1). Two factors were shown to reduce the HRE: the heat gain level and the moving person. However, the moving speed and stop interval did not have much effect on HRE. In all moving cases, HRE was at level of 0.97.
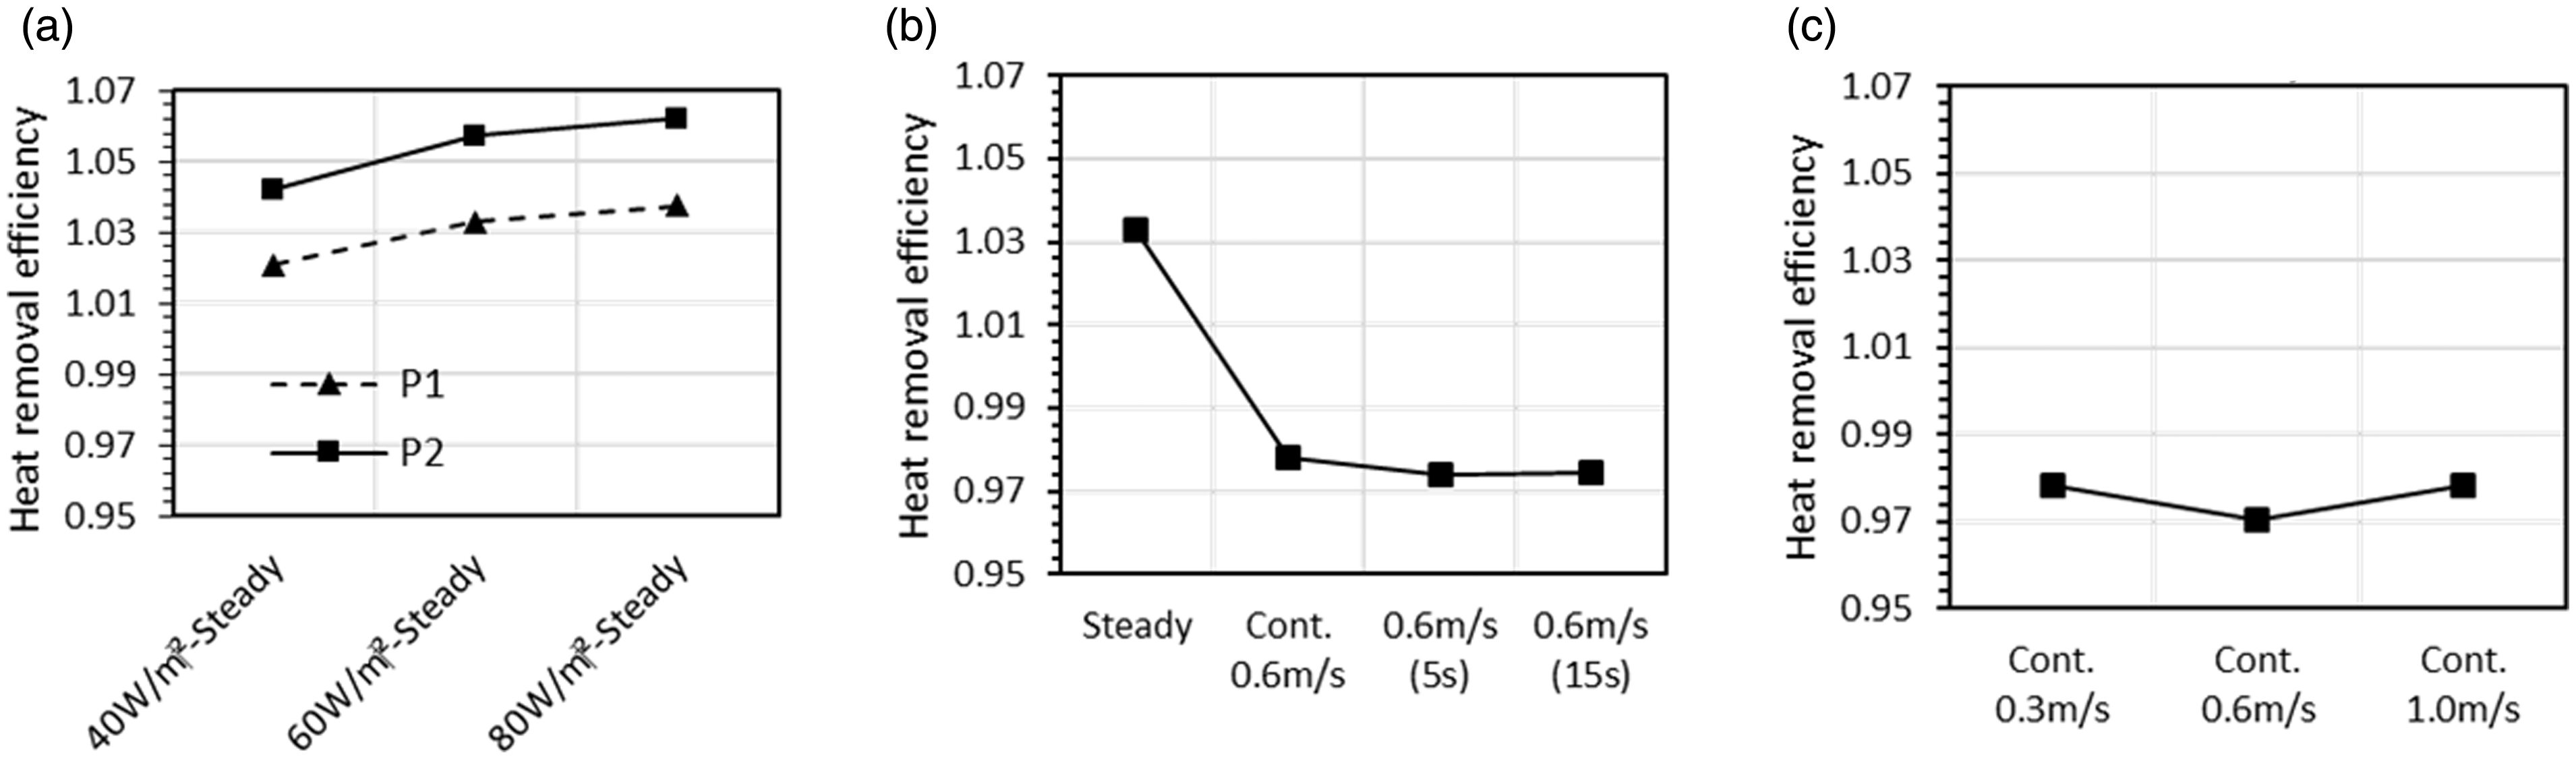
Heat removal efficiency with respect to the (a) heat gain from 40 W/m2 to 80 W/m2 under the steady-state condition at P1 (near manikin) and P2 (near track), (b) different stop intervals with a heat gain of 40 W/m2 at P1 (near manikin) and (c) different moving speeds with a heat gain of 40 W/m2 at P1 (near manikin).
Velocity profile
According to European design criteria of CR1752,
46
for the indoor environment, the indoor climate categories A, B and C allow local air velocities of 0.15 m/s, 0.18 m/s and 0.21 m/s, respectively. Figure 10 shows mean air velocities with heat gains of 40 W/m2 to 80 W/m2 at 1.1 m. The minimum realistic absolute expanded uncertainty at the 95% confidence for the mean air velocity was
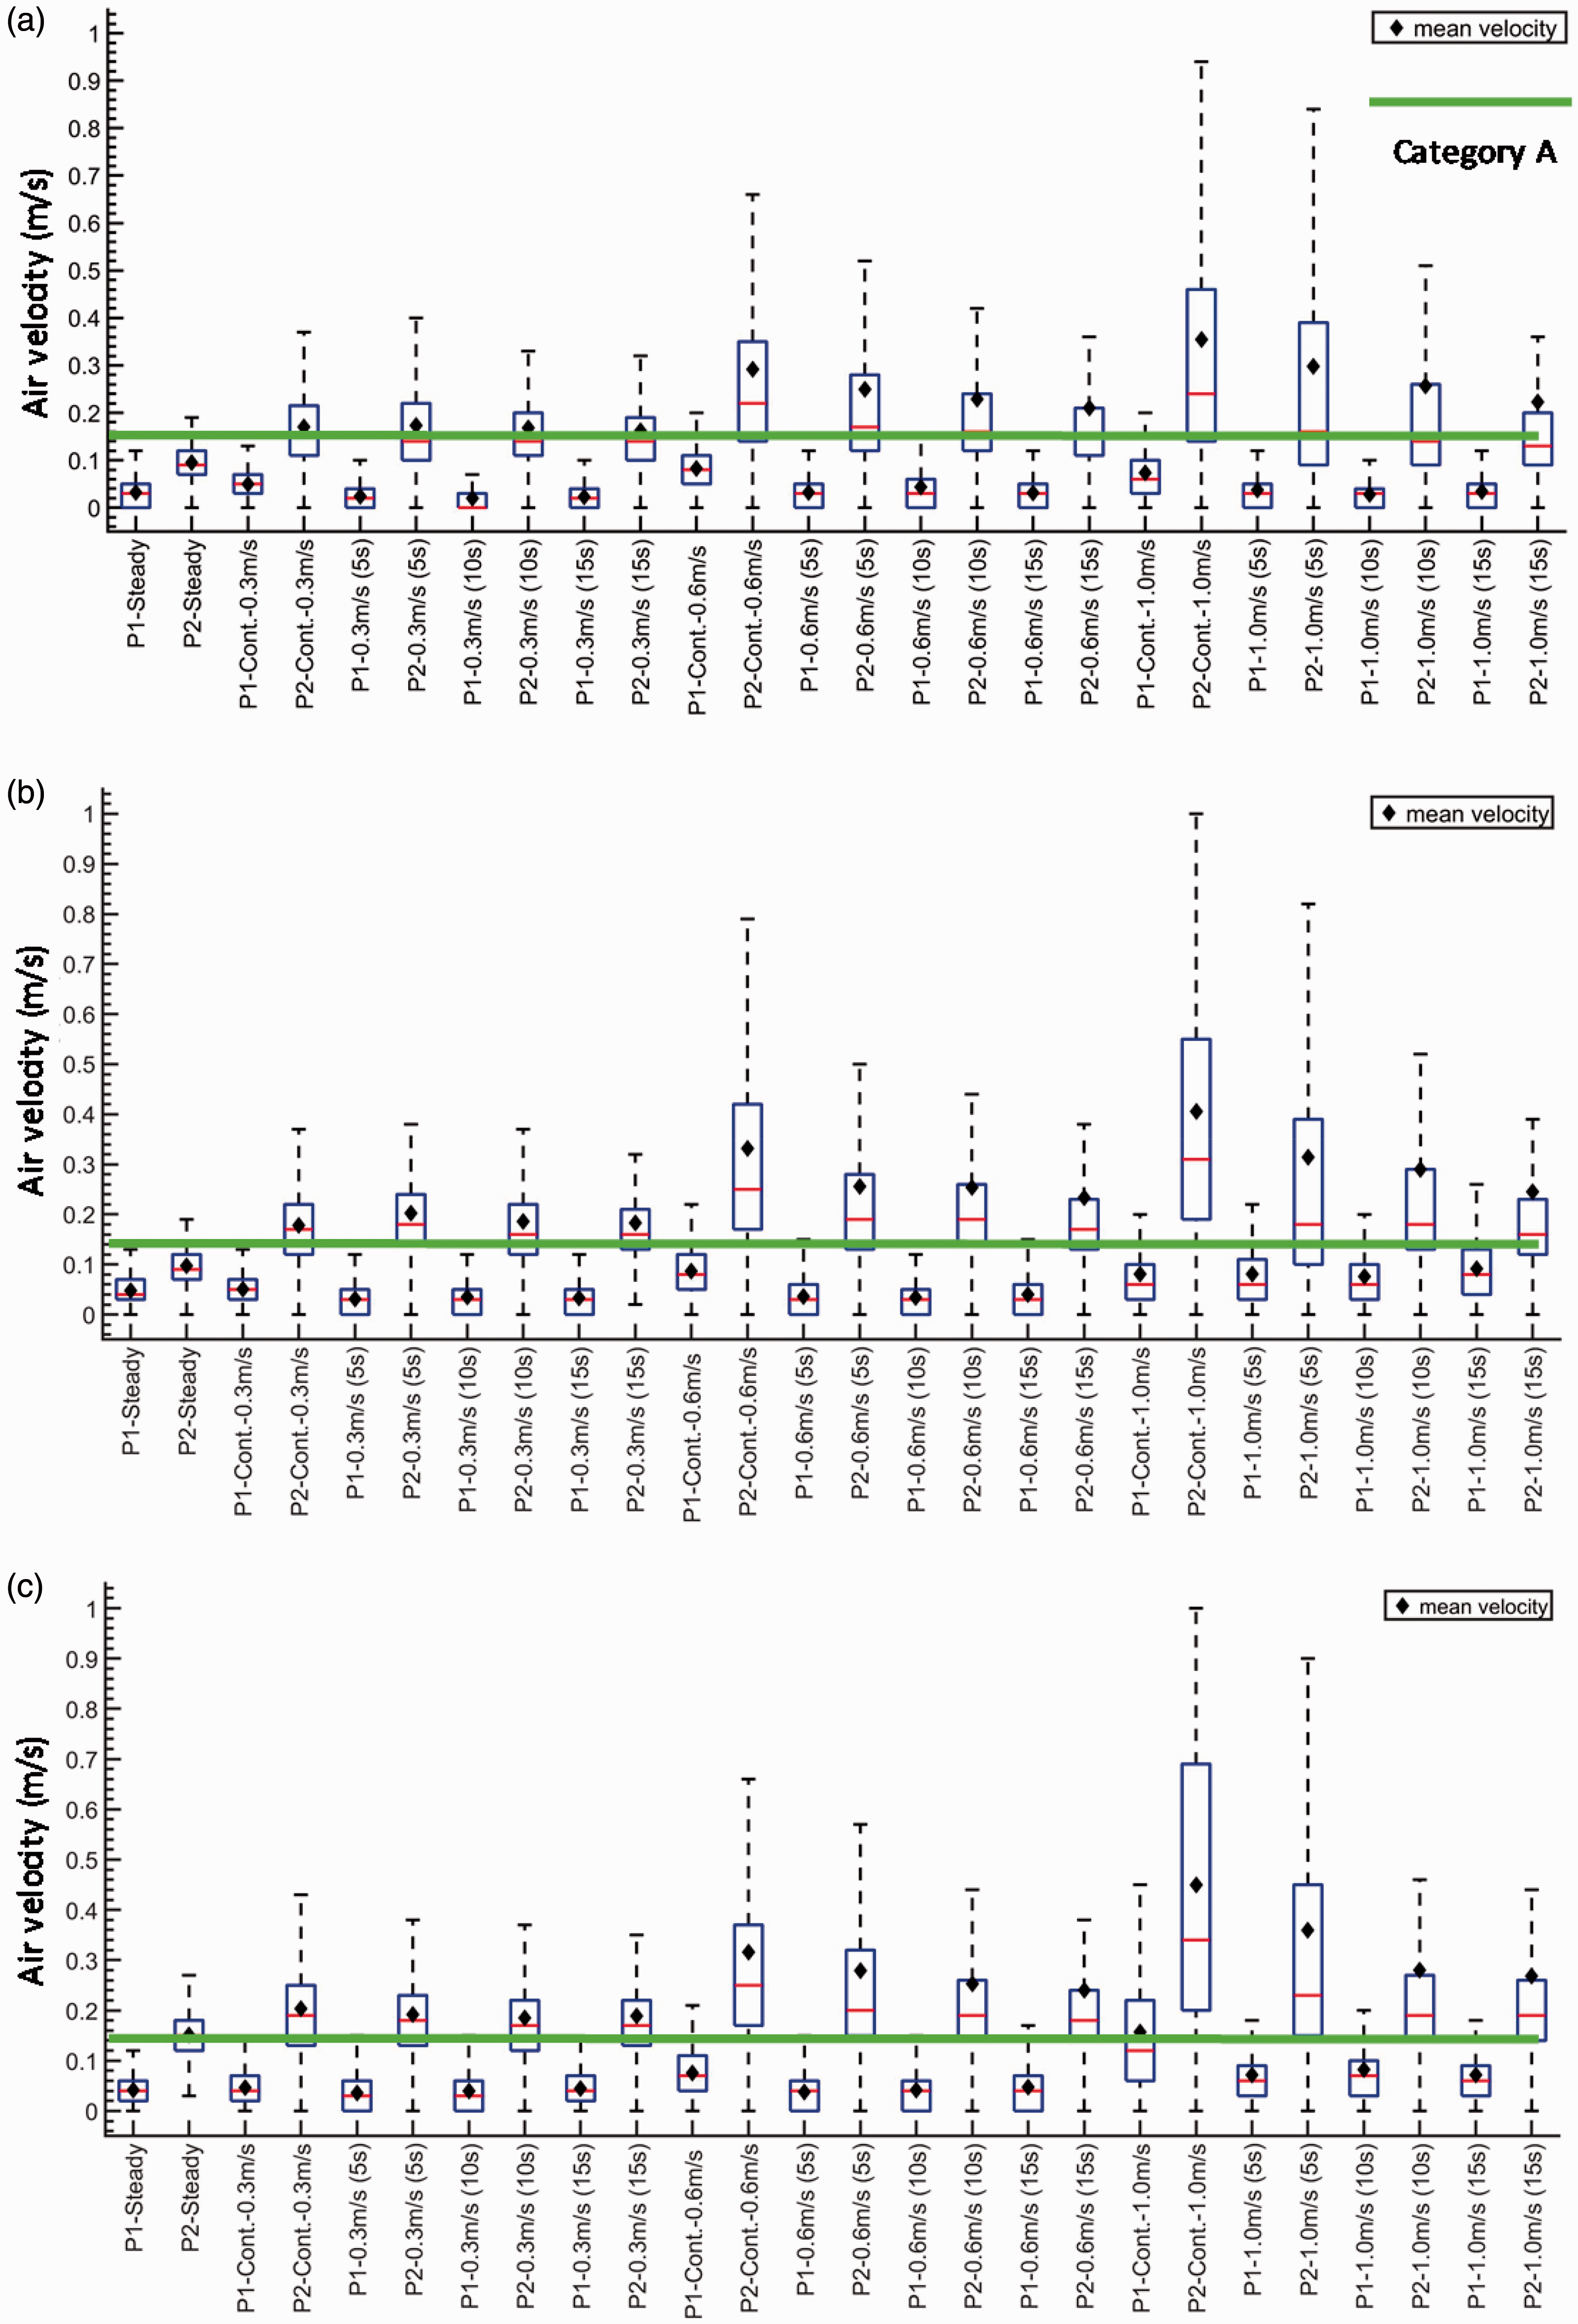
Air velocities at a height of 1.1 m at P1 (near manikin) and P2 (near track) with a heat gain of (a) 40 W/m2, (b) 60 W/m2 and (c) 80 W/m2. The box indicates the 25th percentile, median and 75th percentile of spatial mean air velocities. The whiskers denote a range of mean air velocities excluding the outliers. The x-axis denotes 26 different measuring cases.
Due to the person’s movement, the mean air velocity was 0.040 ± 0.026 m/s at P1 with a heat gain of 40 W/m2 and it was increased by 57% to 0.063 ± 0.027 m/s with a heat gain of 80 W/m2. In general, the mean air velocities were low in the seated person zone. However, the corresponding value was 0.23 m/s with a heat gain of 40 W/m2 and was increased by 15% to 0.27 m/s with a heat gain of 80 W/m2 near the moving track (P2). Compared to the seated person zone, the moving person increased the air velocity close to the moving simulated person more than 75%. This indicates the effect of the moving person on the air distribution in the room space. Due to the diffuse ceiling ventilation, the mean air velocity at the occupied zone can fulfil the Category A when the person moves about in the office. This indicates that with uniform air distribution by the diffuse ceiling ventilation, acceptable air velocity at occupied zone is possible under dynamic moving person condition.
The average air velocity was 0.05 ± 0.026 m/s and 0.07 ± 0.027 m/s with the continuous moving speeds of 0.3 m/s and 1.0 m/s with a heat gain of 40 W/m2. Therefore, the average air velocity was increased when the moving speeds of the simulated person were increased. Furthermore, the mean air velocity with the continuous moving simulated person was much higher than with interval breaks between each turn.
In all cases, the effect of moving person was small on the mean air velocity close to the workstation. Thus, the moving speed and stop intervals did not have an effect on the air velocity. The strength of the heat gain had some effect on the average air velocity. However, all cases fulfilled the demand of Category A.
Air velocity fluctuation
The air velocity fluctuation (SD) is presented in Figure 10. Figure 11(a) shows the increase of air velocity fluctuation with different cooling load levels. In the seated person zone (P1), the standard deviations of the instantaneous air speed were 0.05 m/s and 0.06 m/s with heat gains of 40 W/m2 and 80 W/m2, respectively. Thus, the standard deviation was increased by 24% with heat gains of 40 W/m2 to 80 W/m2. The corresponding standard deviations were 0.16 m/s (40 W/m2) and 0.20 m/s (80 W/m2) close to the track at P2. As could be expected, this means that the moving person has more significant influence on the air velocity fluctuation near the moving track than the workstation. Also, the heat gain level had caused an increase in the standard deviation of air velocity close to the workstation.
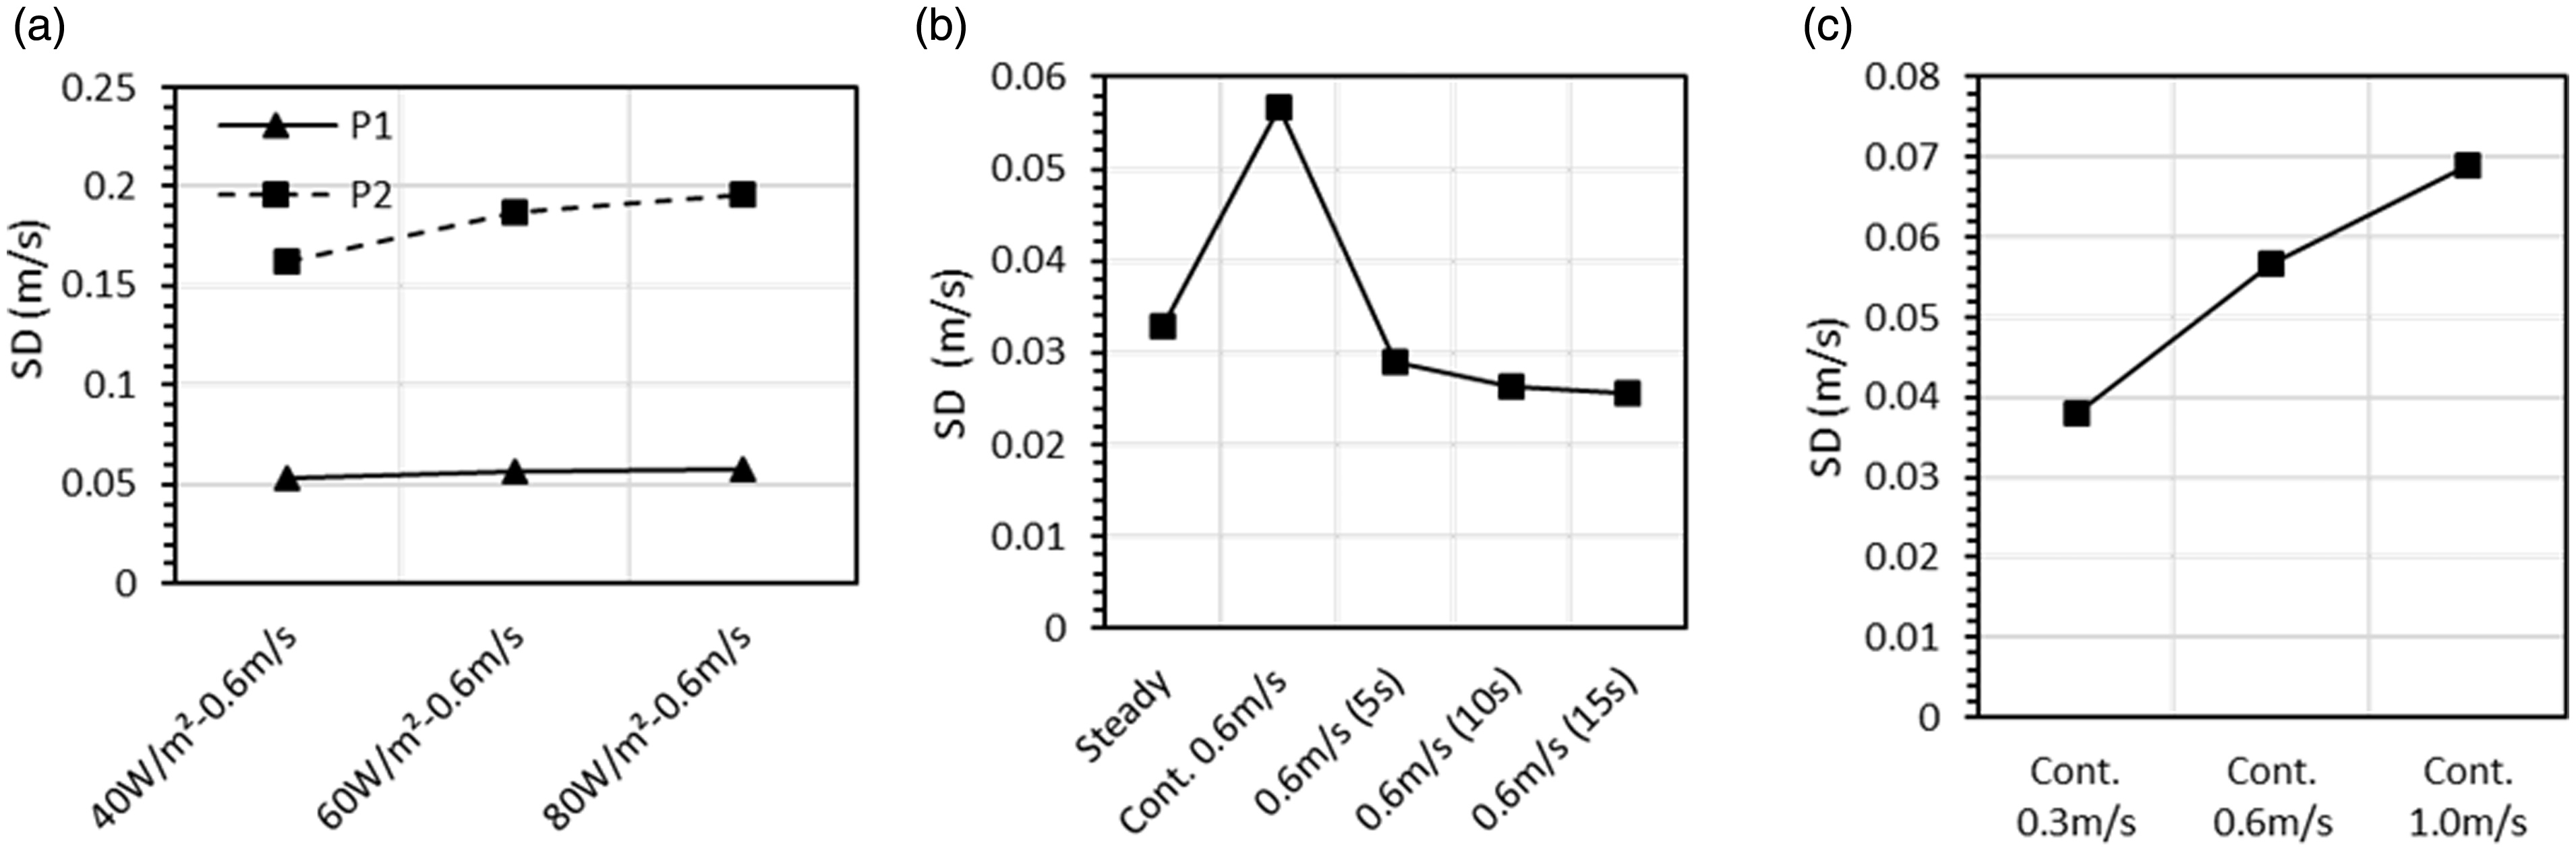
Standard deviation of air velocity with (a) heat gains of 40 W/m2 to 80 W/m2 at P1 and P2 with constant moving of a person at a moving speed of 0.6 m/s, (b) different moving frequencies at P1 with a heat gain of 60 W/m2 and (c) different moving speeds with a heat gain of 60 W/m2 at P1.
Figure 11(b) shows the continuous moving of the simulated person, which made the air flow most turbulent. The SD was reduced slightly when longer speed-breaks existed. The fluctuation was higher with the continuous moving than with stop intervals cases. The average SD almost increases linearly with the increasing moving speed (Figure 11(c)).
Equivalent frequency
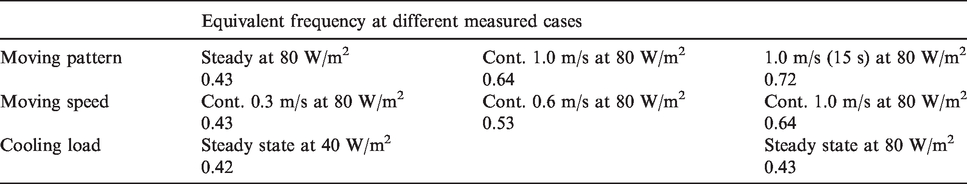
Table 5 shows the equivalent frequency defined by equation (5) with different measured cases near the work station at P1. The equivalent frequency did not change much when the heat gain varied from 40 W/m2 to 80 W/m2 at workstation area. Also, the lower moving speed (0.3 m/s) of a moving person with a heat gain of 80 W/m2 did not cause much difference on equivalent frequency. However, when the moving speed was increased to 1.0 m/s, the equivalent frequency was increased by 32% (from 0.43 Hz to 0.64 Hz).The relative effect was at the same level than in mean velocity. The moving pattern with a speed-break also caused an increase in the equivalent frequency by 40% (from 0.43 Hz to 0.72 Hz). The relative effect was smaller in comparison to the mean velocity (70%). The equivalent frequency near the moving area (0.78 Hz) was higher than at occupied zone (0.64 Hz). Therefore, as would be expected, the air flow pattern was more stable at the occupied zone. As a conclusion, the continuous moving speed of a moving person and moving with stop intervals would increase the equivalent frequency. However, the cooling load did not have any influence.
The equivalent frequency with different cases at P1.
Draught rate
Figure 11 shows the maximum draught rate at 1.1 m at locations P1 and P2. The average draught rate at the seated person zone was 16.3% and 24.0% with cooling loads of 40 W/m2 and 80 W/m2 under the steady-state condition (Figure 12(a)). The uncertainty of draught rate at P1 was 4–5%. 47 Therefore, the thermal environment was classified as categories B and C according to the EN ISO 7730:2005. 40 The draught rate at P1 was increased by 32% when the heat gain was increased from 40 W/m2 to 80 W/m2. The air velocity was increased as a function of the heat gain. This indicates that the heat gain has a direct effect on the draught rate and with a heat gain of 80 W/m2, only category B was fulfilled.
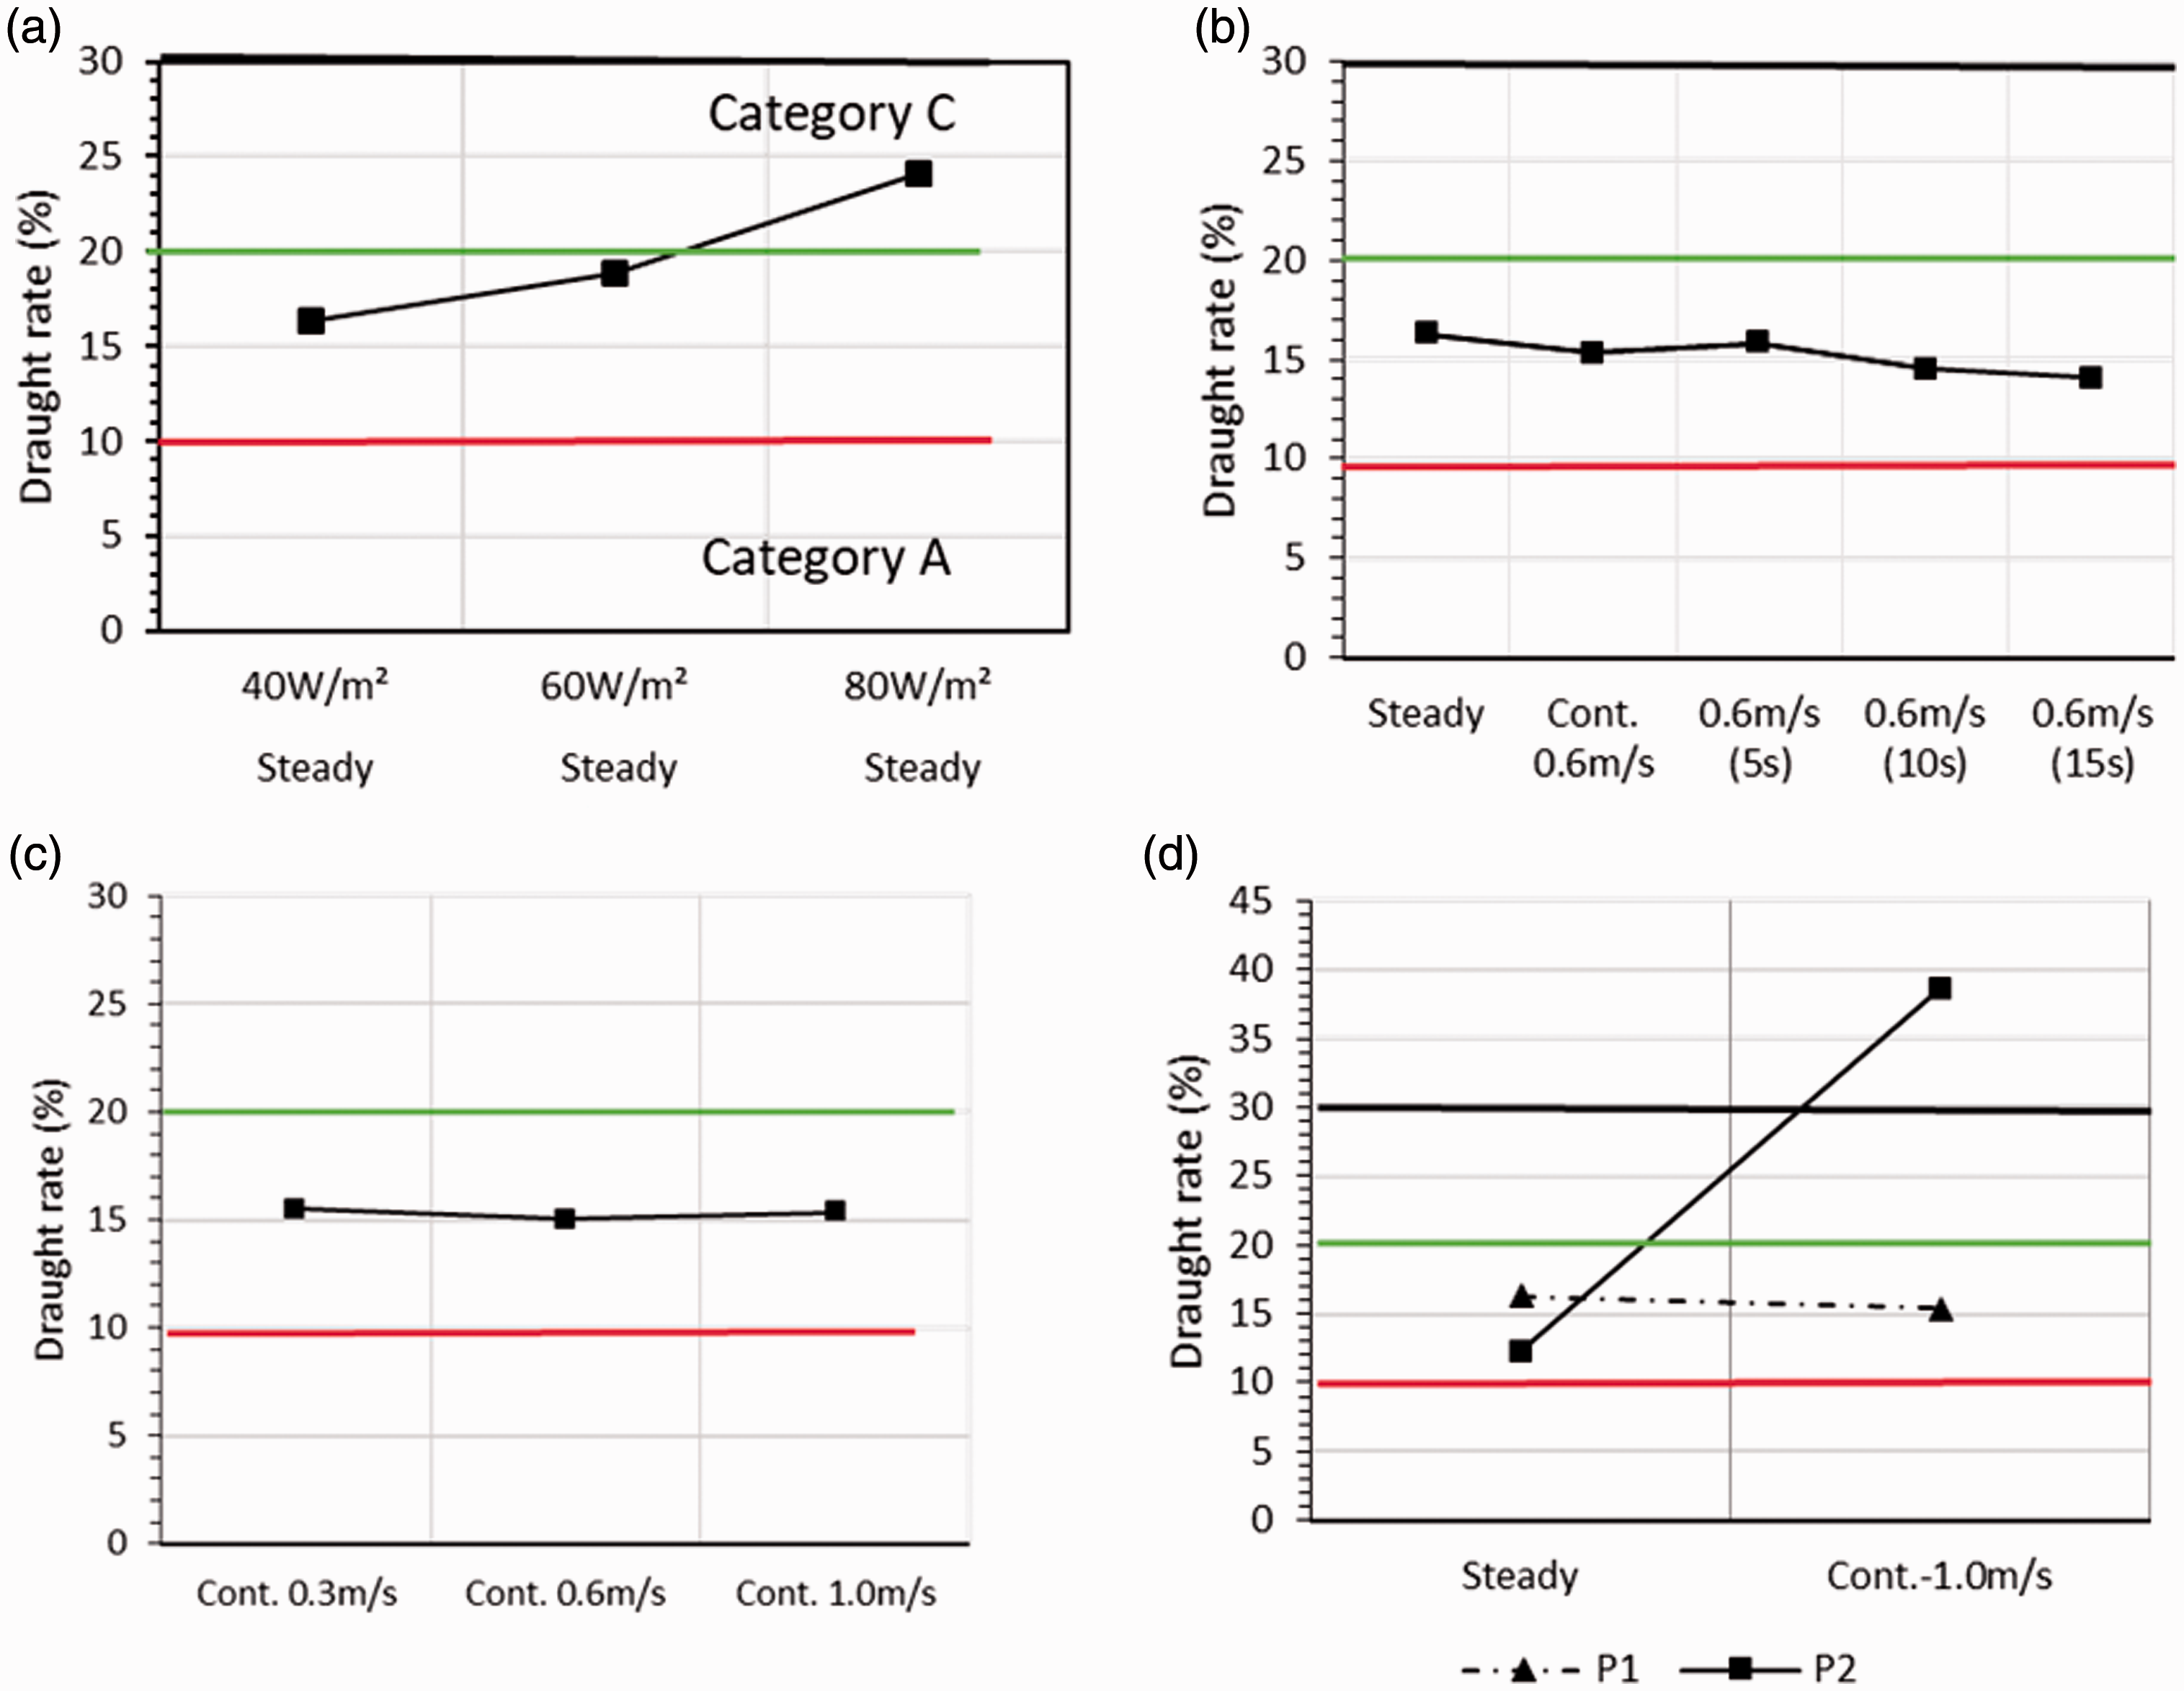
Draught rate at 1.1 m with (a) heat gains of 40 W/m2 to 80 W/m2 under the steady-state condition, (b) different moving frequencies with a heat gain of 40 W/m2 at P1 (near manikin), (c) different moving speeds with a heat gain of 40 W/m2 at P1 (near manikin) and (d) at different measured locations with a heat gain of 40 W/m2 under steady-state and constant moving condition close to manikin (P1) and track (P2).
Figure 12(b) shows that the draught rate at P1 was slightly lower with the moving person than in the steady-state condition. The air velocity at P1 was very low (below 0.15 m/s) in all moving cases. The reason for the draught rate reduction is that the mean air temperature was lower at P1 with the moving person. This indicates that in certain conditions the diffuse ceiling ventilation could reduce the local thermal comfort with a moving person in the workstation area.
However, the moving of the person with different time intervals did not have much effect on the draught rate compared with continuous moving. Also, the average draught rate did not change much when the moving speed was increased from 0.3 m/s to 1.0 m/s with a heat gain of 40 W/m2 (Figure 12(c)). Figure 11(d) shows that the trend of the average draught rate at P2, which was increased as a function of the moving speed. This indicates that the moving person has a significant influence on the draught rate near the moving track, but only a minor influence at the occupied zone when the diffuse ceiling ventilation was used.
Power spectral density
Figures 13 and 14 show the fluctuation energy defined by equation (9) at heights 1.1 m and 0.1 m, respectively. Table 6 shows the average fluctuation energy in different cases near the work station at P1. The Fourier transform produces a spectrum up to 10 Hz, because the spectrum is symmetric about a half of a sampling frequency. 48 Hence, Figure 12 shows the fluctuation energy as a function of frequency up to 5 Hz, i.e. half of a sampling rate due to the Nyqvist frequency. 49
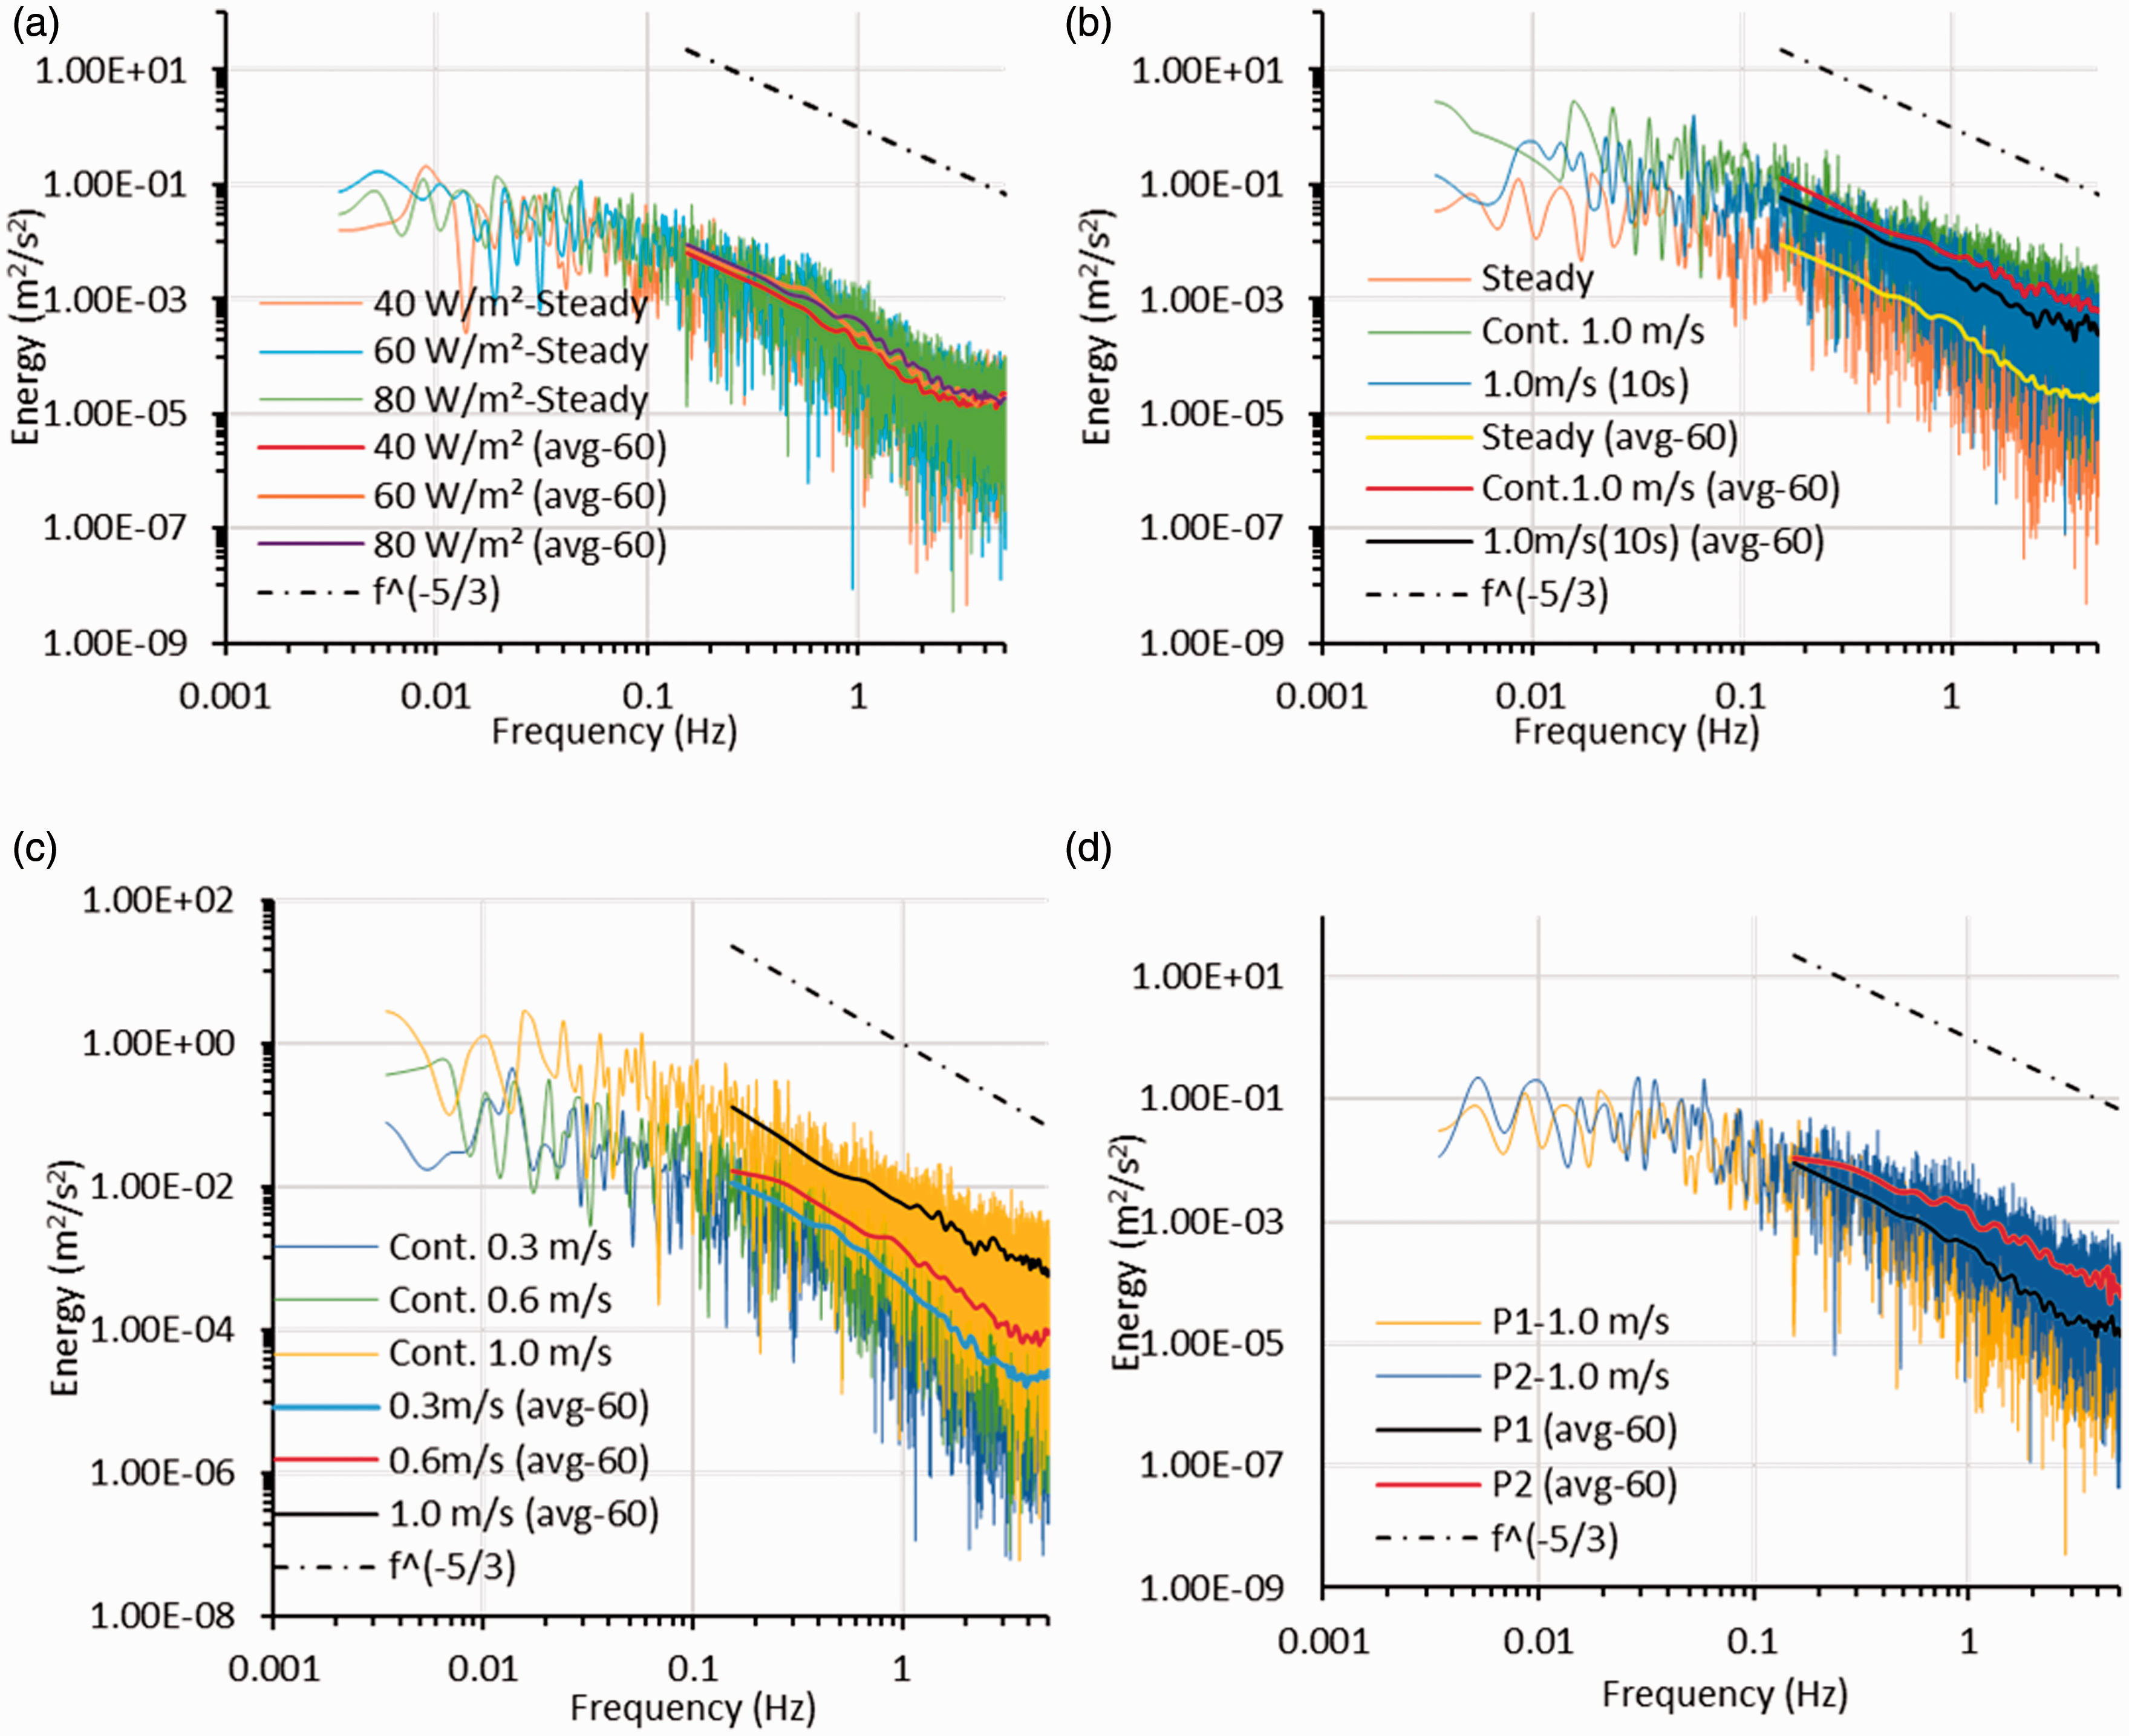
The fluctuation energy at a height of 1.1 m, log-log scales: (a) a heat gain from 40 W/m2 to 80 W/m2 in the steady-state condition, (b) different moving frequencies with a heat gain of 80 W/m2, (c) different moving speeds with a heat gain of 80 W/m2 and (d) at different measured points with a heat gain of 80 W/m2 and a moving speed of 1.0 m/s (15 s). (avg-60) means the average value of the numerical field being evaluated within the time range analysed.
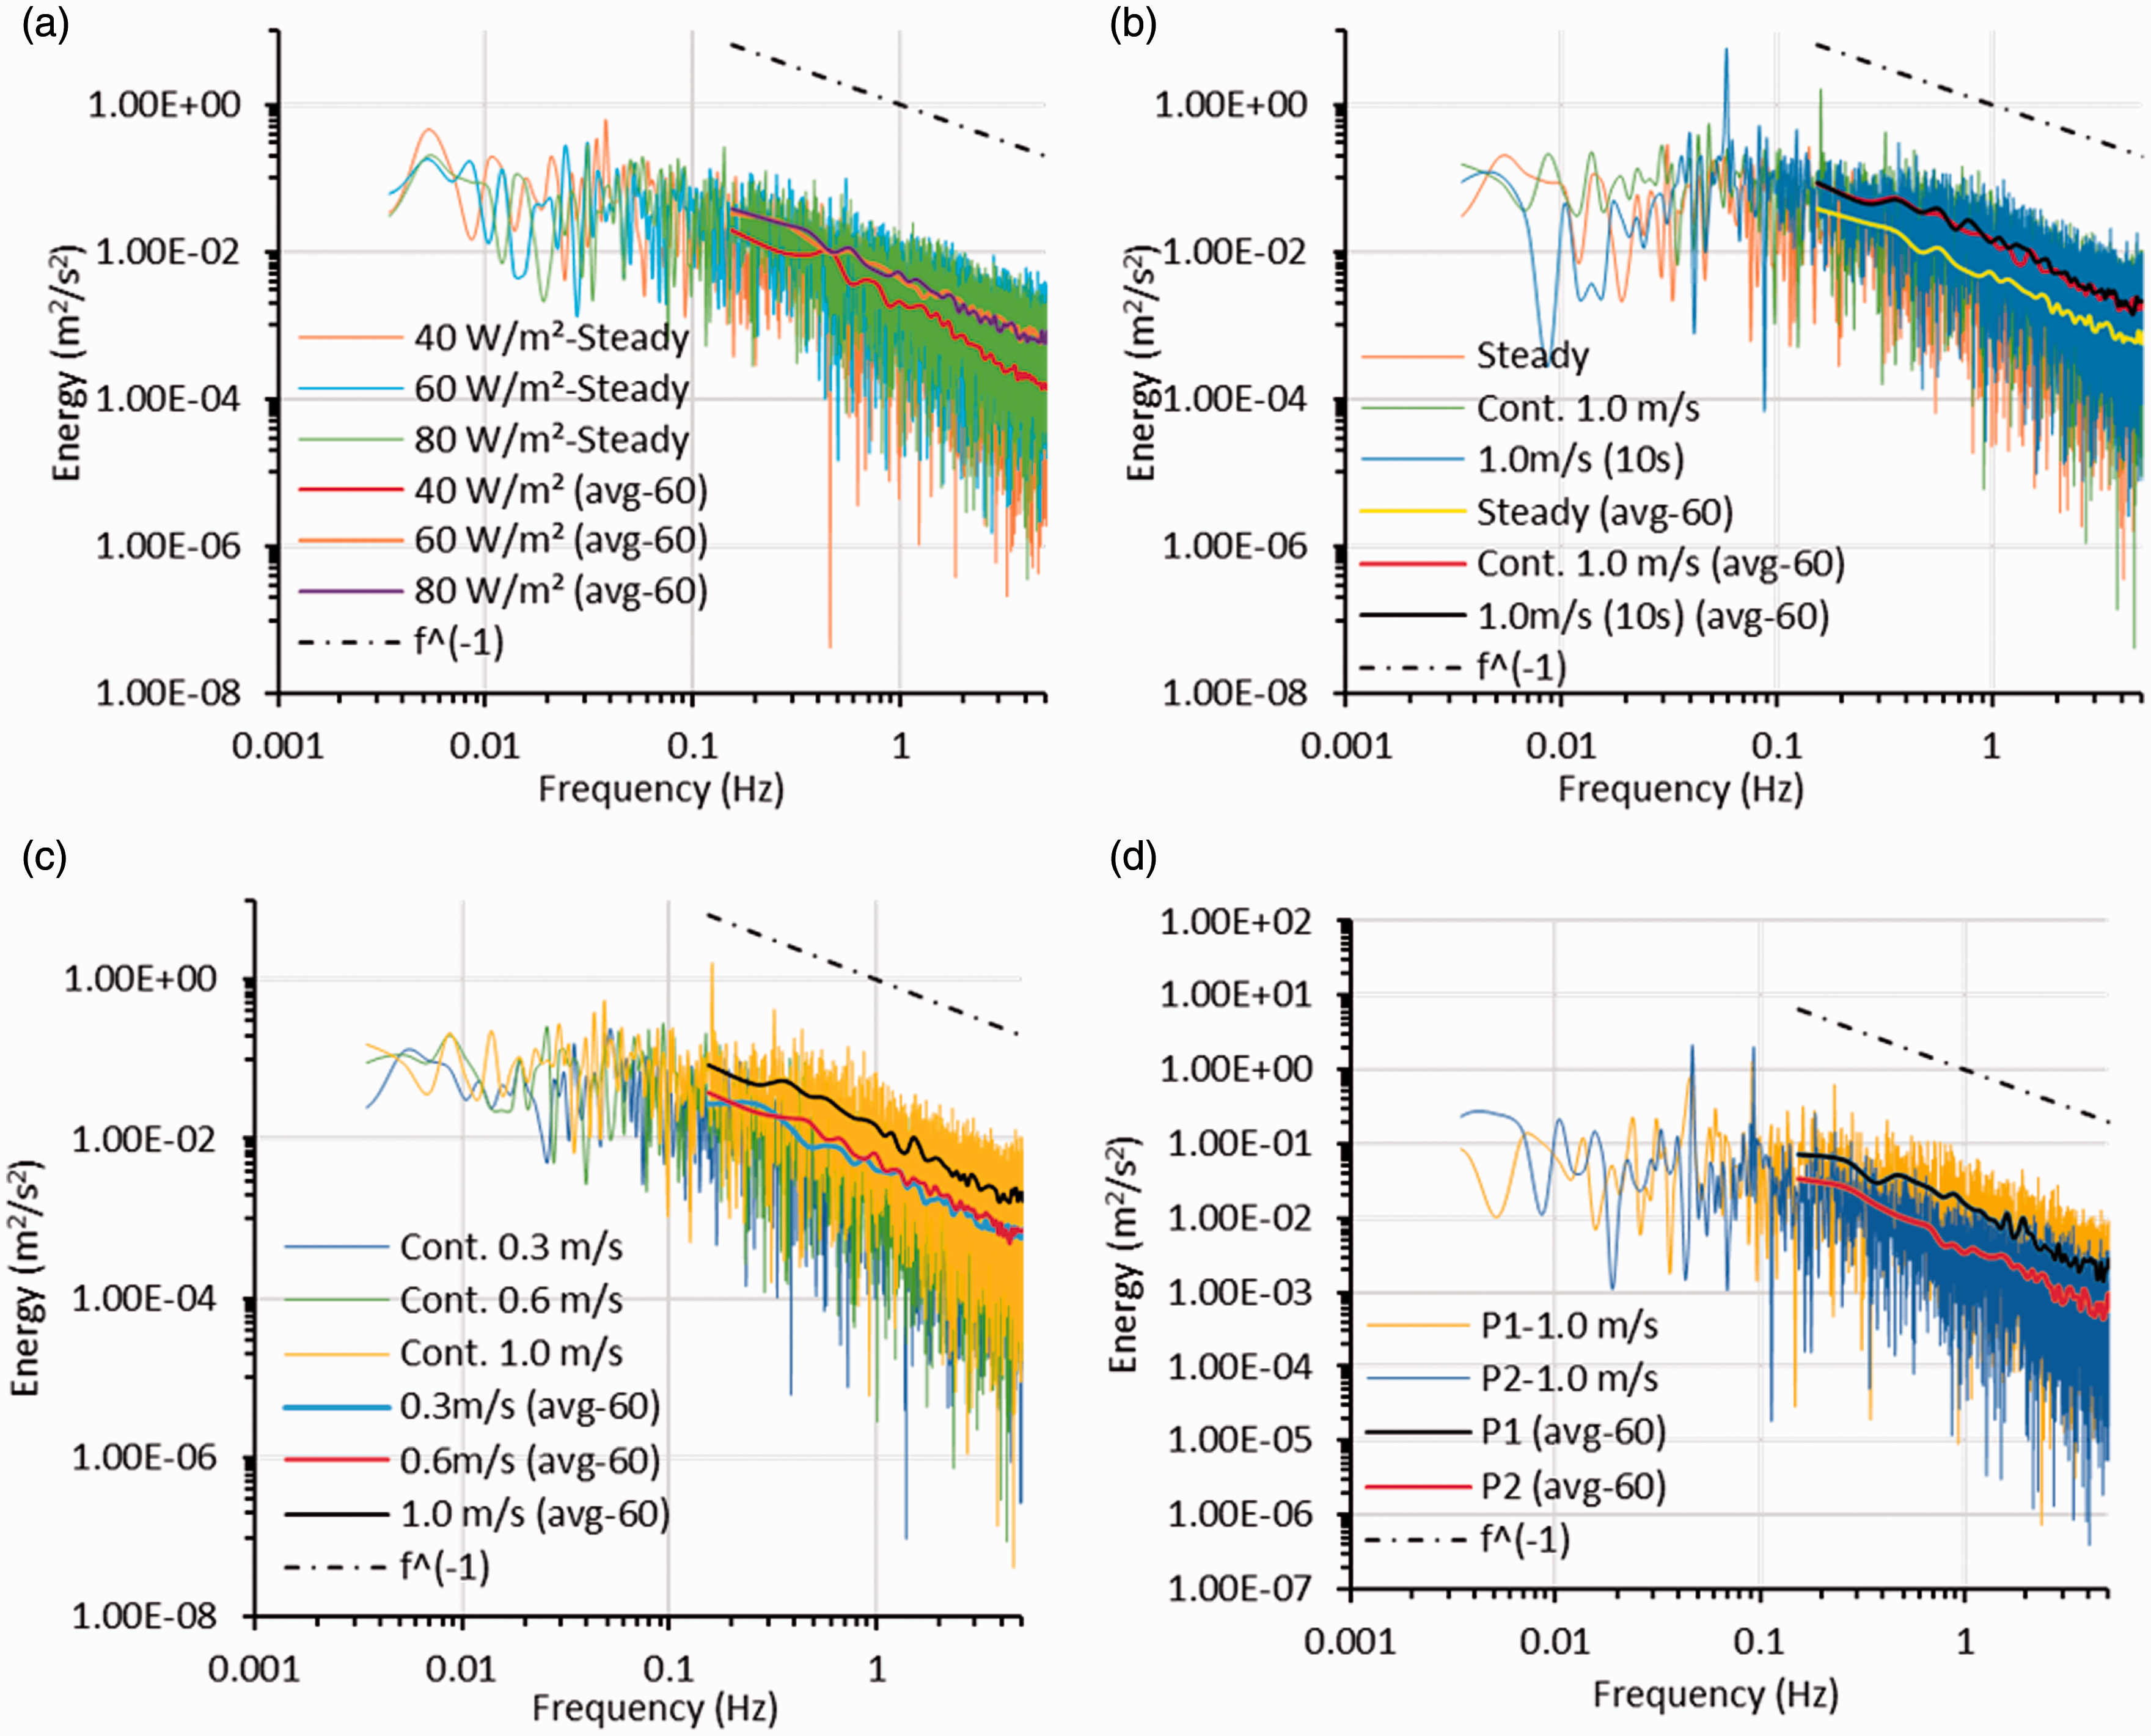
The fluctuation energy at a height of 0.1 m, log-log scales: (a) a heat gain of 40 W/m2 to 80 W/m2 in the steady-state condition, (b) different moving frequencies with a heat gain of 80 W/m2, (c) different moving speeds with a heat gain of 80 W/m2 and (d) at different measured locations with a heat gain of 80 W/m2–1.0 m/s (15 s). (avg-60) means the average value of the numerical field being evaluated within the time range analysed.
The average power spectral density with different test cases at P1.
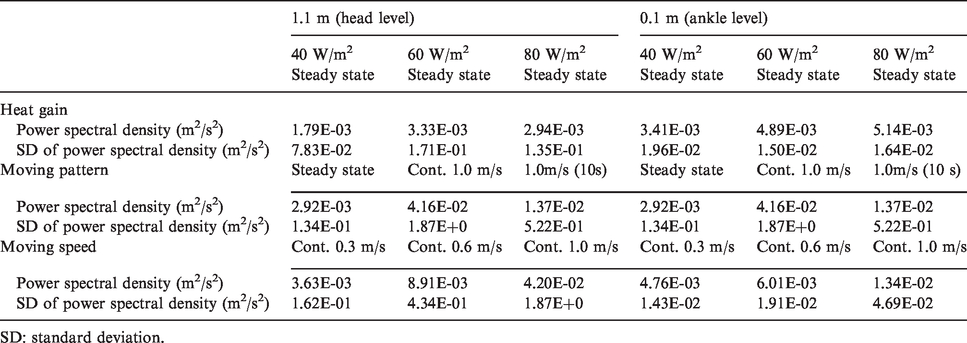
SD: standard deviation.
Figure 13 shows that the frequency distribution follows reasonably well the Kolmogorov law. The dashed line describes the –5/3 law 46 for the cascading process in turbulence at the height of 1.1 m. Most of the turbulent energy was concentrated at low frequencies. Figure 13(a) shows average power spectral density was 1.8 × 10⁻³ ± 7.8 × 10⁻² m2/s2 in the occupied zone (P1) at the height of 1.1 m with the case of 40 W/m2 in the steady-state condition. The corresponding average power spectral density was 2.9 × 10⁻³ ± 1.4 × 10⁻¹ m2/s2 at 80 W/m2. Consequently, the average fluctuation energy increased by 46% when the heat gain changed from 40 W/m2 to 80 W/m2. The relative effect of increased heat gain was therefore greater than the standard deviation of 24%. Figure 13(b) shows that the power spectral density with the continuous moving person was the largest. Compared to the steady-state condition, the mean value was increased by 93% (both fluctuation energy and standard deviation) up to 4.2 × 10⁻² ± 1.9 m2/s2 with the continuous moving person (0.6 m/s). Figure 13(c) shows the average power spectral density at the occupied zone (P1) with the different continuous moving speed in the case of 80 W/m2. The average energy was 3.6 × 10⁻³ ± 1.6 × 10⁻¹ m2/s2 with the moving speed of 0.3 m/s, and was increased by 91% with the moving speed of 1.0 m/s. Figure 13(d) shows that the fluctuation energy near the moving track (P2) was much higher, as would be expected, than at the seated person zone (P1). The average value was 3.4 × 10⁻² ± 1.8 m2/s2 at P2, while the corresponding value was 4.1 × 10⁻³ ± 1.3 × 10⁻¹ m2/s2 at P1 with 80 W/m2. Therefore, there was a significant difference of the airflow characteristic between the seated person zone and moving zone. As a conclusion, the power spectral density was increased significantly when the moving speed was increased. In cases of stop intervals, the power spectral density was slightly lower than with continuous moving case.
The average power spectral density at the height of 0.1 m had the same trend than at 1.1 m (Figure 14). The average fluctuation energy was increased by 34% with the increasing heat gain. However, the moving frequency has less influence on the power spectral at a height of 0.1 m than at a height of 1.1 m. Also, the energy distribution varied almost according to k–1 at a height of 0.1 m. This indicated strong interaction between thermal plume and air movement caused by person walking.
Turbulent kinetic energy
Figure 15 shows the average turbulent kinetic energy (
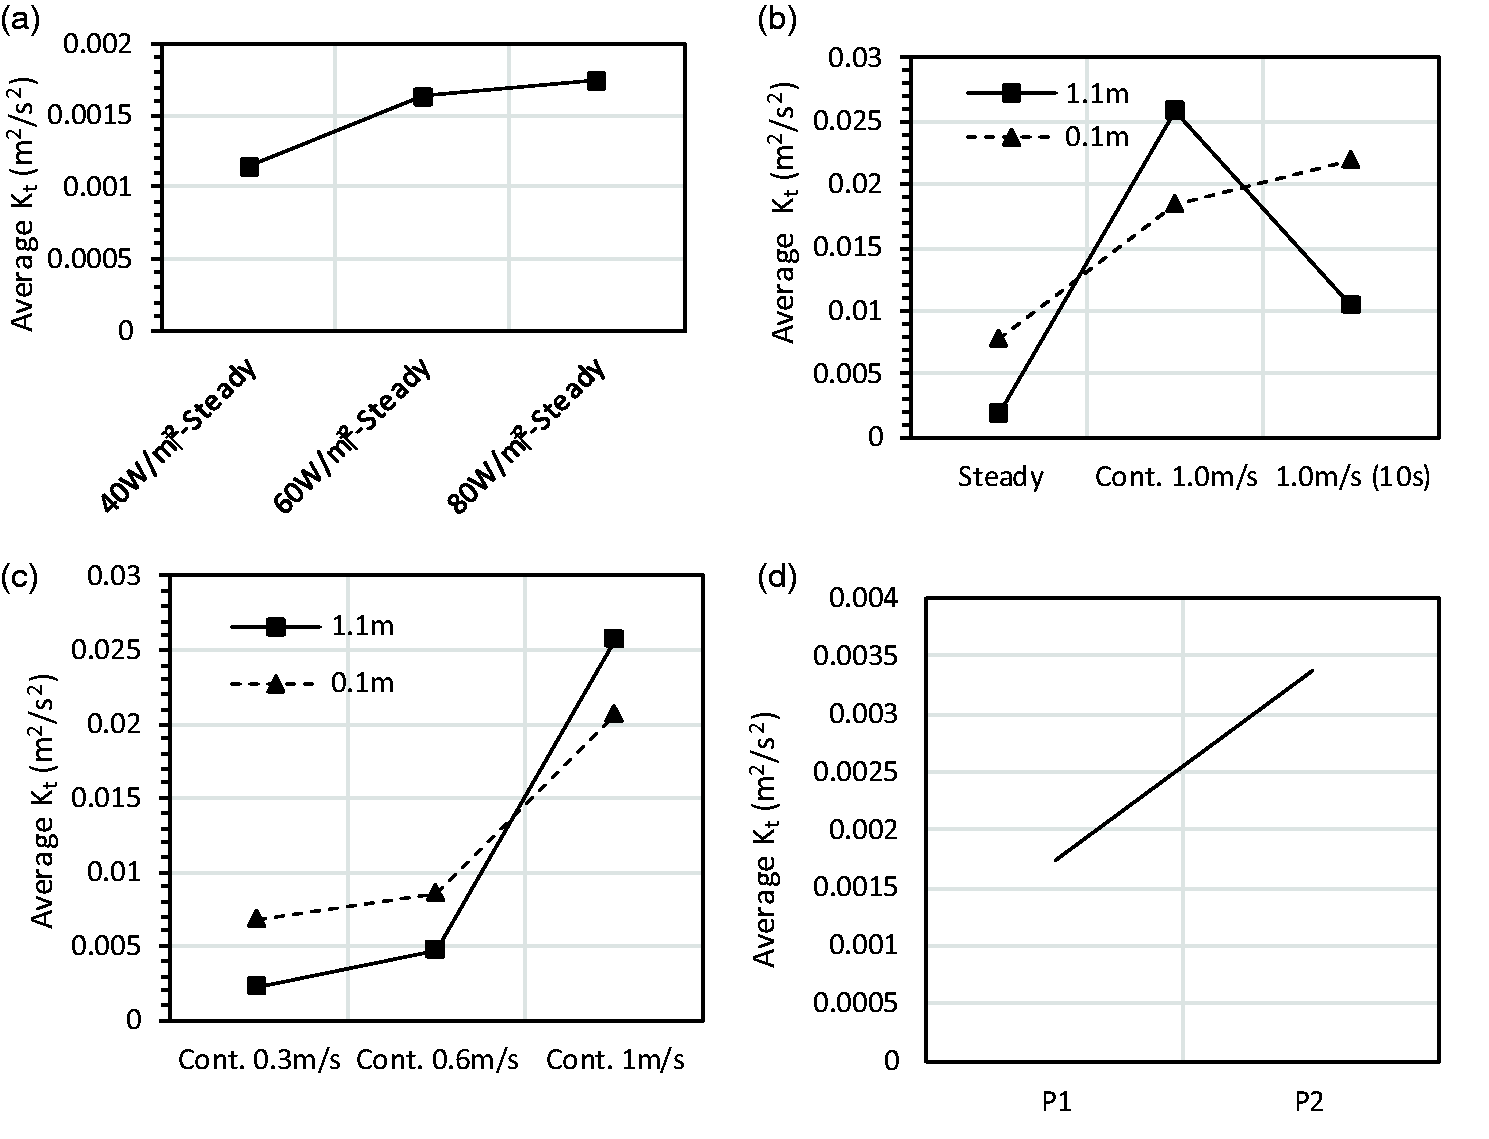
The average turbulent kinetic energy: (a) a heat gain of 40 W/m2 to 80 W/m2 at the steady-state condition at P1 (close to the manikin) at a height of 1.1 m, (b) different moving frequencies with a heat gain of 80 W/m2 at P1 (close to the manikin) at heights of 0.1 m and 1.1 m, (c) different moving speeds with a heat gain of 80 W/m2 at P1 (close to the manikin) at a height of 0.1 m and 1.1 m and (d) different measurement locations with a heat gain of 80 W/m2 in the case of 1.0 m/s (15 s) at a height of 1.1 m.
The average turbulent kinetic energy was 1.8 × 10⁻³ m2/s2 in the steady-state condition (Figure 15(b)) at 1.1 m. The corresponding energy was increased by 93% with the continuous moving person. However, the turbulent kinetic energy was reduced by 60% to 1.0 × 10⁻² m2/s2 with a moving interval of 10 s. At a height of 0.1 m, the average turbulent kinetic energy was highest with the continuous moving condition. Figure 15(c) shows the average turbulent kinetic energies close to the manikin (P1) were 2.2 × 10⁻³ m2/s2 and 2.6 × 10⁻² m2/s2 with a moving speed of 0.3 m/s and 1.0 m/s at a height of 1.1 m. The relative difference was 91% at a height of 1.1 m. Similarly, the difference was 67% at 0.1 m height, which indicates that the moving speed has a significant effect on the turbulent kinetic energy. The turbulent kinetic energy near the moving track was 48% higher than that at the seated person zone. Hence, as expected, the airflow was more turbulent near the moving person (Figure 15(d)). As a conclusion, the moving person has a higher effect on the turbulent kinetic energy than the increasing heat gain. With a continuous moving speed of 1.0 m/s, the turbulent kinetic energy was at the highest. The stop intervals would reduce the values but still the values were higher than the steady state.
Fluctuation energy ratio
Figure 16 shows the fluctuation energy ratio by using equation (12). In the case of a heat gain of 40 W/m2, the fluctuation energy ratio was 0.78 at a height of 1.1 m close to the seated person zone (P1) (Figure 16(a)). This indicates that the amount of airflow fluctuation energy was approximately 78% of the airflow motions. Furthermore, the corresponding fluctuation energy ratio was 77% smaller with a heat gain of 80 W/m2 than with a heat gain of 40 W/m2. This implies that the fluctuation energy was reduced as a function of the heat gain level.
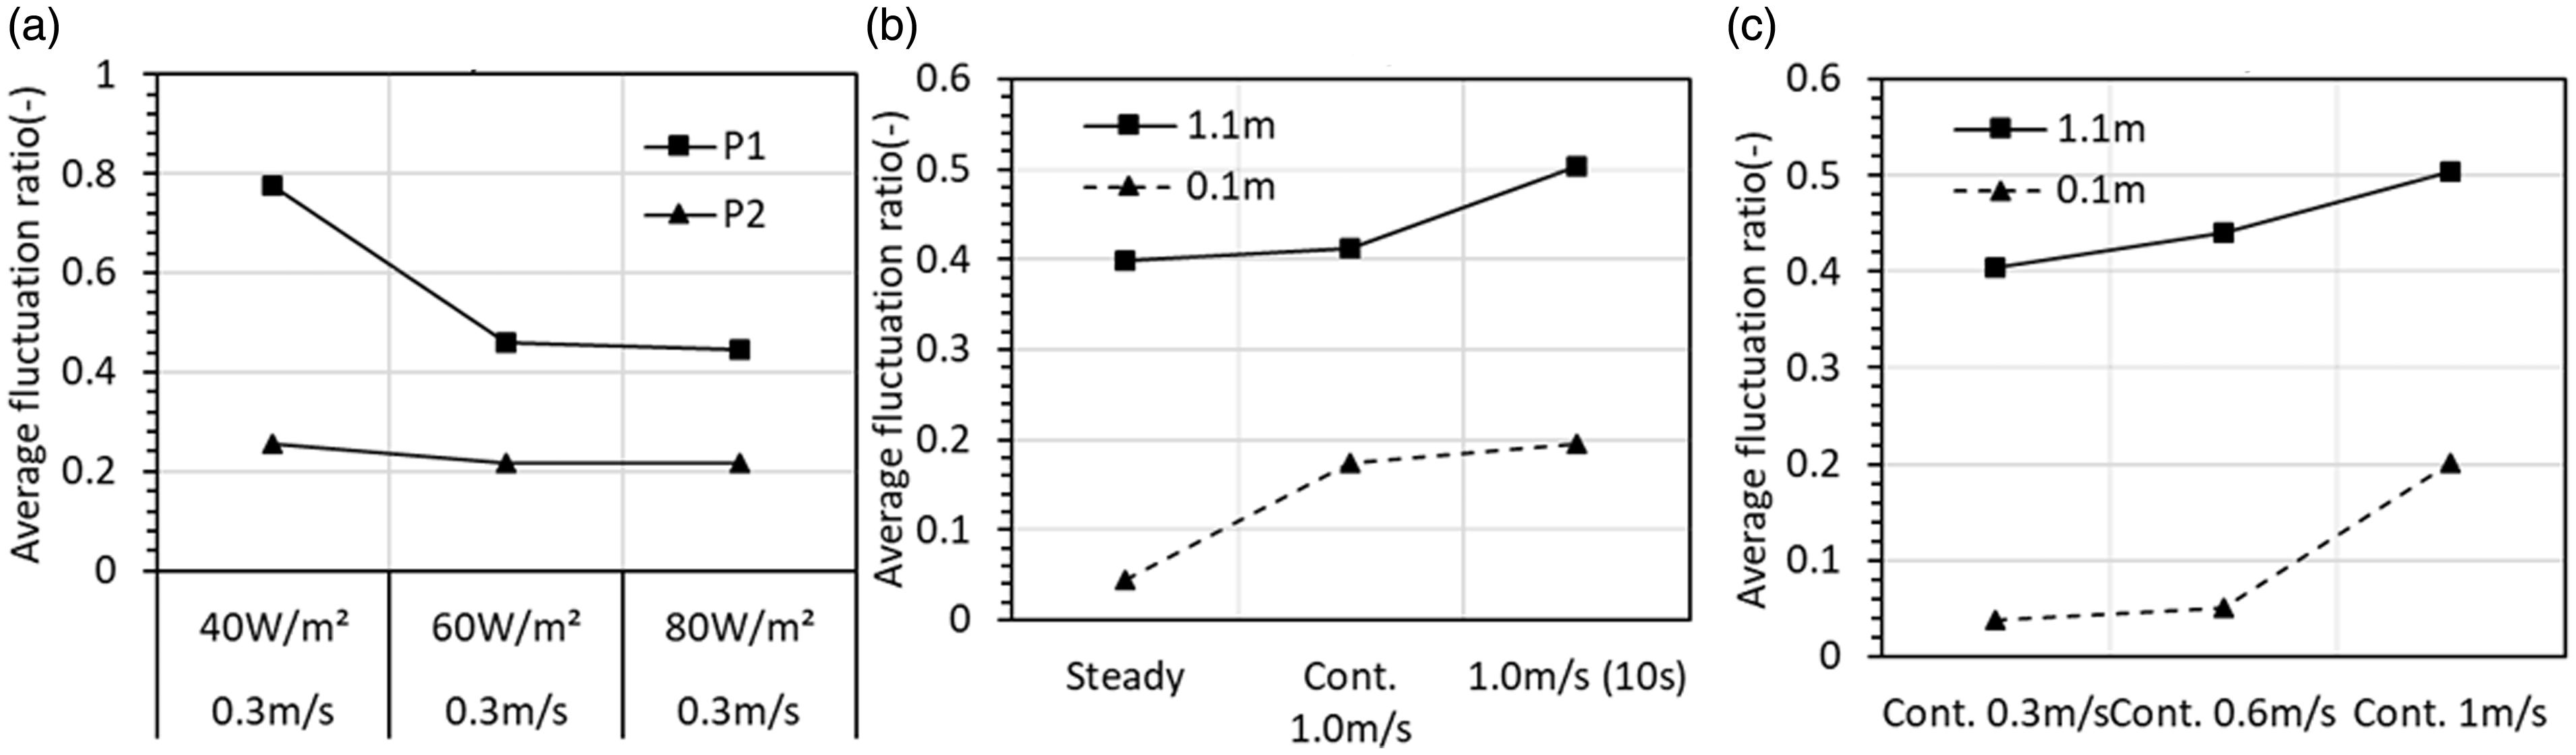
The fluctuation energy ratio: (a) heat gain from 40 W/m2 to 80 W/m2 with continuous moving speed at 0.3 m/s at the height of 1.1 m, (b) different moving frequency with 80 W/m2 at P1 (close to the manikin) at the height of 0.1 m and 1.1 m and (c) different moving speeds with 80 W/m2 at P1 (close to the manikin) at the height of 0.1 m and 1.1 m.
However, the fluctuation energy ratio was much smaller at P2 (close to the track) than close to manikin (P1). This indicates that the moving person created more energy fluctuation at the seated person zone than near the moving track. Compared with the steady-state condition, the fluctuation energy ratio was 26% higher with the moving speed of 1.0 m/s (10 s) at the seated person zone at a height 1.1 m (Figure 16(b)). This means the moving person with the speed-break would create more energy fluctuation. The fluctuation energy ratio is much smaller at a height of 0.1 m, which indicates that less energy fluctuation was achieved at the ankle level. Figure 16(c) shows that the fluctuation energy ratio was highest with the moving speed of 1.0 m/s at both heights of 0.1 m and 1.1 m.
Discussion
The main purpose of this study was to obtain an insight of the influence of human moving on air distribution and local thermal comfort with a diffuse ceiling ventilation system. The geometry of the simulated person was selected according to Nordtest. 35 The person was simulated as a plate (1.6 m × 0.5 m × 0.03 m). The used plate in the experiment was different than the shape of a real human body, which would affect the airflow characteristic in the ventilated room. The previous studies has already demonstrated that the moving arms and legs of a real person could have an effect on air distribution close to workstation compared with the simulated person used.19,50 The real human movement may create more a complicated induced airflow behind the moving body. Also in this study, the moving plate was not heated. However, the heat load of the real person would create a buoyancy flow (driven by convection heat flux) around the body that has also an effect on the air distribution. Nevertheless, the heat gain of the person (about 50 W is convection) is not so significant as compared with the other heat gains e.g. solar and equipment (1445 W).
The maximum moving speed of a simulated person was 1.0 m/s in this study because of geometry limitation of the test chamber. The higher moving speed would increase the mixing effect from both vertical and horizontal directions. In the office with diffuse ceiling ventilation, the horizontal temperature gradient is typically higher than 2°C. 9 Thus, the temperature gradient could be expected to be smaller in the higher moving speed condition.
The effect of a moving person on the different air distribution methods is different. Compared with stratum ventilation and displacement ventilation, the influence with mixing ventilation is the smallest. The influence with stratum ventilation is smaller than that with displacement ventilation. 27 With airflow from the diffuse ceiling ventilation, the effect of a moving person on indoor airflow characteristic depends on the space dimensions. The indoor environment near the moving track is much more influenced by moving person than close to the workstation.
For draught sensation, the previous experiments had shown that individuals are more sensitive to the draught risk with the equivalent frequency between 0.2 and 0.6 Hz than the other frequency levels.41,42 In this study, the equivalent frequency was mostly between 0.4 and 0.6 Hz at occupied zone. However, the mean air velocity was below 0.1 m/s. Thus, the draught rate still stayed at low level.
With displacement ventilation, the spectral distribution of the turbulent energy depends on the examined location, e.g. the distance from the outlet and the height above the floor. 51 In the case of the laminar flow in a clean room, the energy distribution is low, but it stays similar in a wide range of frequency. 43 As for the stratum ventilation, the spectral distribution of the velocity fluctuation depends on the horizontal distance from the supply terminal and height above the floor. 52 For locations close to supply terminals, the turbulence structure is influenced by the characteristic length scale of the supply diffusers. With the airflow development, the turbulence structure shifts to the similar power spectrum as that of a fully developed turbulent flow. The turbulence at head level is not yet fully developed under stratum ventilation.
In this study with a moving person under diffuse ceiling ventilation, the frequency distribution follows reasonably the k−5/3 law at 1.1 m and k−1 at 0.1 m. This is in good agreement with the experimental with the mixed ventilation. 43 Therefore, the turbulence energy spectrum is similar to those in a fully developed turbulent flow.
The results are not universal for all ventilation systems, the heat gain level and room layout. With the DCV, the cooling load level, dimension of the room and other disturbances, e.g. the moving person are the key factor that could affect the air movement and the local thermal comfort. This means that the results are valid only with the given experimental set-up. Thus, the effect of a moving person is probably different with other types of air distribution system.
The most suitable application of the DCV is offices. Diffuse ceiling ventilation was able to maintain a suitable thermal comfort in the indoor environment with a moving person, especially with high thermal loads. With a heat gain of 80 W/m2 when the supply air flow rate of DCV was 7.3 L/s/m2, the moving person did not increase significantly the draught risk close to the workstation.
For the future research, various moving speeds, interval time and indoor activities need to be investigated with advanced air distribution and cooling systems. The novel micro-environment system where part of the cooling is provided by radiation should be further analysed with the moving person.
Conclusion
The effect of the human movement on the performance evaluation of diffuse ceiling ventilation was studied by means of an experiment, using a simulated moving person designed to go back and forth on a straight track using a trolley. The trolley was controlled with different moving speeds and stop time intervals during each turn. The conclusion based on the results is indicated as follows:
The human movement had some effect on the vertical temperature gradient between the floor level and 0.6 m height. The temperature gradient was 0.4°C at occupied zone from 0.1 m to 0.6 m, but nearly no difference in the temperature gradient at the moving zone. The moving frequency had significant effect on the air temperature profile. As for the local thermal comfort, the draught rate was constant with a person moving at occupied zone. Results show that the diffuse ceiling ventilation was not very sensitive to turbulence even when an occupant moves in the office. The moving person would create a different airflow characteristic close to work stations and the moving person zone with the diffuse ceiling ventilation. In all cases, the mean velocity and draught rate were within the acceptable range at occupied zone with different moving speeds and moving patterns. Furthermore, the human movement could affect the average fluctuation energy a lot at the whole space. The power spectral density was increased by 80% with a moving person (1.0 m/s) as compared with the steady state condition. The turbulent kinetic energy was increased by 93%, and the fluctuation energy ratio was also increased by 21% with a 1.0 m/s moving speed.
Footnotes
Acknowledgements
The author wish to acknowledge comments from Juha Jokisalo, Aalto University.
Authors' contribution
Weixin Zhao conducted all measurements, analysed data and drafted the article. Simo Kilpeläinen and Risto Kosonen supervised the research and measurements; Risto Kosonen reviewed the article and provided comments for revision of the article.
Declaration of conflicting interests
The author(s) declared no potential conflicts of interest with respect to the research, authorship, and/or publication of this article.
Funding
The author(s) received no financial support for the research, authorship, and/or publication of this article.